

Submitted:
05 October 2026
Posted:
08 October 2026
You are already at the latest version
Abstract
Airborne microplastics (MPs) are increasingly recognized as atmospheric pollutants with potential implications for human exposure; however, their occurrence, temporal variability, and associations with urban particulate matter remain poorly understood. This study investigated MPs associated with PM10 in central Los Angeles across two seasonal sampling campaigns by integrating MP abundance, morphology, size distribution, PM10 chemical composition, and meteorological observations. MPs were detected in all samples, with concentrations ranging from 2.2-4.0 MP/m3 during the cool-season campaign and 2.2-3.4 MP/m3 during the warm-season campaign. Fibers remained the dominant morphology, while particles <100 µm, particularly the 5-50 µm and 50-100 µm fractions, consistently dominated the airborne MP population. Strong positive correlations (generally ρ ≥ 0.79) were observed between total MP concentrations and major crustal (Fe, Si, Mn, Ca, Al, and Mg), traffic-related (Ba, Cu, and Ni), and carbonaceous (OC and EC) tracers, indicating that MPs are closely associated with urban particulate mixtures influenced by resuspension and non-tailpipe traffic emissions. In contrast, short-term meteorological variability showed no consistent relationship with MP concentrations. These findings indicate that airborne MPs are a persistent component of the urban PM10 mixture rather than isolated contaminants, and provide new insight into their sources and behavior in densely populated urban environments.
Keywords:
airborne microplastics
; PM10
; particle size distribution
; microplastic morphology
; non-tailpipe emissions
; road dust resuspension
; urban air quality
1. Introduction
Plastics have become deeply embedded in modern society, with global production and disposal increasing rapidly over recent decades. By 2015, only 9% of the approximately 8,300 Mt of plastics produced globally had been recycled, while nearly 79% had accumulated in landfills; if current trends continue, discarded plastics are projected to reach 12,000 Mt by 2050 [1]. As plastics degrade and fragment, they generate large quantities of microplastics (MPs), which are now recognized as environmental contaminants raising substantial ecological and human health concerns [2]. MPs are typically defined as plastic particles smaller than 5 mm [3]. They originate either as primary MPs generated at microscopic sizes or as secondary MPs produced through the weathering and fragmentation of larger debris [4,5]. Primary MPs, such as those incorporated into personal care products, are often spherical, whereas secondary MPs tend to exhibit irregular morphologies, including fibers and fragments, reflecting a range of mechanical and environmental degradation processes [6,7].
Although MPs have been extensively investigated in aquatic systems, systematic study of their presence in the atmosphere has expanded only within the past decade [8,9,10,11,12,13,14,15]. Atmospheric MPs have since been detected in environments ranging from remote regions to densely populated cities, demonstrating their capacity for long-distance atmospheric transport and the influence of diverse emission and re-emission processes [16,17,18]. Despite this growing evidence, major uncertainties remain regarding MPs’ behavior in complex urban atmospheres and their concentrations in relation to concurrent particulate matter (PM) sources, such as mineral dust, carbonaceous material, and traffic-related emissions [19,20]. These knowledge gaps are particularly pronounced in dense metropolitan areas where resuspension, non-tailpipe emissions, and seasonal meteorology strongly influence ambient particulate mixtures. Human exposure to MPs through inhalation has also become a topic of increasing concern, especially because particles within the respirable size fraction can deposit in the deep regions of the lung [21,22]. Recent studies have confirmed the presence of MPs in human lung tissue and suggest that these particles may act as carriers for airborne pathogens such as SARS-CoV-2 [23]. Moreover, MPs have been reported in multiple media relevant to daily life, including tap water, food, and both indoor and outdoor air [24,25,26,27]. Therefore, in densely populated and polluted regions, where emissions and resuspension processes are elevated, exposure to MP-contaminated air may be particularly difficult to avoid. Quantifying airborne MPs is therefore essential for evaluating potential exposure and associated health risks, as particle size distributions, number concentrations, and morphologies influence inhalation potential and deposition patterns [28,29].
Previous atmospheric MP studies have most commonly employed filter-based air sampling followed by microscopic characterization to assess particle abundance, size distributions, and morphologies [6,9,10]. More recent work has begun to integrate MP observations with meteorological indicators and co-occurring particulate components to interpret potential sources and atmospheric behavior [5,19]. These efforts have substantially advanced understanding of MP occurrence, morphology, polymer composition, and weathering processes in the atmosphere. However, relatively few studies have examined MPs alongside detailed PM10 chemical components, such as trace metals, carbonaceous species, and indicators of non-tailpipe emissions, over extended sampling periods in major urban environments, limiting our understanding of how MPs co-vary with urban source signatures and seasonal atmospheric dynamics. Moreover, the relative roles of resuspension, abrasion-related non-tailpipe emissions, and co-emitted mineral constituents in shaping airborne MP distributions remain insufficiently constrained in dense urban corridors.
To address these gaps, this study investigates airborne MPs associated with PM with an aerodynamic diameter ≤10 μm (PM10), collected during 13 biweekly sampling periods and in different seasons in central Los Angeles. MP particles were quantified and classified by size and morphology to evaluate their abundance and distribution in the urban atmosphere. Concurrent measurements of PM10 components, including trace metals and carbonaceous fractions, were also analyzed alongside meteorological conditions to explore factors influencing the temporal variability of airborne MPs. This observational framework provides new insight into the abundance, size distribution, morphology, and temporal dynamics of atmospheric microplastics within a heavily trafficked urban environment shaped by resuspension, non-tailpipe emissions, and seasonal meteorology. By examining MPs within the chemically and physically complex PM10 matrix, this study explicitly considers the roles of particle resuspension, abrasion-related non-tailpipe emissions, and seasonal atmospheric conditions as key processes governing MP presence and variability in urban air. This integrated perspective allows airborne MPs to be interpreted not as isolated contaminants, but as constituents embedded within dynamic urban particulate mixtures shaped by traffic activity, surface disturbance, and meteorology. Together, this approach provides a framework for understanding how size-resolved MP characteristics evolve in heavily trafficked environments and supports improved assessment of inhalation exposure in dense metropolitan corridors.
2. Methodology
2.1. Sampling Site and Period
8 biweekly sampling periods (cool-season campaign) were conducted between October 2024 and February 2025, followed by an additional 5 biweekly sampling periods (warm-season campaign) between June and September 2025 to extend the measurements across different seasons, at the Particle Instrumentation Unit (PIU) of the University of Southern California (USC), located immediately adjacent to the I-110 freeway in central Los Angeles. The PIU site represents a dense urban corridor influenced by roadway emissions, resuspension, and regional background pollution [30,31,32]
2.2. Instrumentation
Airborne particles were collected using four Sioutas Personal Cascade Impactor Samplers (PCIS) (SKC Inc., USA), operating in parallel, each equipped with pre-baked 37 mm quartz filters (Pall Life Sciences, USA) and maintained at a flow rate of 9 lpm [33,34]. Quality assurance and quality control (QA/QC) procedures were applied throughout sampling and filter handling to limit both chemical and plastic contamination of the samples. Quartz substrates were pre-baked to remove residual carbon, stored in Teflon petri dishes lined with pre-fired aluminum foil, and kept frozen before use. Filters were equilibrated under controlled temperature and humidity, and weighed using a microbalance (MT5, Mettler-Toledo Inc.) with a precision of 1 µg. All PCIS units underwent flow calibration, internal and external leak checks, and verification of compliance with manufacturer specifications before deployment and after retrieval. Samples were handled with solvent-cleaned stainless-steel tweezers, sealed in accordance with chain-of-custody procedures, and transported or stored on dry ice to prevent contamination or degradation.
2.3. Microplastic Analysis
The collected PM10 samples were examined by optical microscopy to quantify the number concentrations of MP, and particles were classified by morphology into fibers, fragments, or spherical shapes. Filters were examined under a digital microscope (Leica DM6B-Z, Germany) equipped with a Leica DFC7000 T camera and Leica Application Suite X (LAS X) software. The size range of interest was 5–5000 µm, with the lower limit of 5 µm set by the smallest size resolution of the digital microscope. Following the operational definitions used by Chandrakanthan et al. (2023) [19], a fiber was recognized as cylindrical in shape with an aspect ratio (length/diameter) ≥ 3, and a fragment as shard-like and flattened. Transparent spheres were recognized as near-spherical particles with smooth edges. Microplastics were identified using the criteria of Hidalgo-Ruz et al. (2012) [6]: no cellular or organic structures visible; fibers of equal thickness throughout their length, showing three-dimensional bending; and clear, homogeneous color throughout. Particle size was then measured along the longest geometric dimension using ImageJ software (version 1.5, National Institutes of Health, USA) to obtain size distributions. All MP analyses were conducted at the Arizona State University laboratory following the procedures described in Chandrakanthan et al. (2023) [19], including the associated blank and quality-control procedures. Particle identification was based on morphology and optical appearance, and the particles are accordingly reported as suspected microplastics.
2.4. Chemical Analysis
Samples were submitted to the Desert Research Institute (DRI, Reno, NV, USA) for chemical characterization and analyzed to quantify trace metals and carbonaceous components (organic carbon (OC) and elemental carbon (EC)). Carbonaceous species were determined using a thermal-optical transmittance analyzer following the NIOSH 5040 protocol, which sequentially heats samples under inert and oxidizing atmospheres while monitoring changes in light transmittance to correct for pyrolyzed carbon. For trace metal analysis, filter punches were extracted in 2% nitric acid and analyzed using an inductively coupled plasma mass spectrometer (ICP-MS; NexION 300x, PerkinElmer), enabling quantification of acid-extractable elements at sub-ng m-3 levels. These chemical measurements were used to characterize the PM10 composition and assess potential relationships between airborne microplastics and co-occurring PM constituents.
2.5. Statistical and Meteorological Analysis
Spearman correlation analysis was performed between chemical species, meteorological data, and total MP number concentrations (MP/m3), as well as concentrations in morphological categories (fibers, fragments, and transparent spheres), across all 13 biweekly sampling periods. Two-sided p-values were obtained from exact permutation tests; bootstrap 95% confidence intervals and leave-one-out sensitivity analyses were used to evaluate the influence of individual sampling periods on the reported correlations. Meteorological data, including temperature, relative humidity (RH), and wind speed/direction, were retrieved from the California Air Resources Board (CARB) (nearest station 3 km north) and matched to the corresponding biweekly sampling periods. This statistical approach allows us to assess MP association with commonly used PM10 tracers.
3. Results and Discussions
3.1. Mass Concentrations
3.1.1. Total PM10 Mass Concentration
Figure 1 shows the biweekly PM10 mass concentrations measured at the USC PIU site, with Figure 1a representing the cool-season campaign conducted during fall and winter and Figure 1b representing the warm-season campaign conducted during summer. During the cool-season campaign, PM10 concentration varied substantially across the 8 sampling periods. As shown in Figure 1a, PM10 levels ranged from approximately 16 μg/m3 during the 2nd biweekly period to a maximum of ~39 μg/m3 in the 8th period which is align with CARB measurements also reflected the same temporal pattern, with concentrations ranging from 23.62 μg/m3 (4th biweekly) to 43.71 μg/m3 (8th biweekly), consistently tracking the rise and fall observed in the PCIS data. These concentrations fall within the expected range for dense urban environments where traffic emissions, resuspension of road dust, and local activity contribute to elevated particulate matter [35,36].
PM10 levels during the 6th biweekly period (mid-January 2025) remained elevated (∼32 μg/m3), with CARB measurements showing a similar enhancement (35.2 μg/m3). This period coincided with the later stages of regional wildfire activity, including wildfire events that occurred in Southern California earlier in January 2025, within the October 2024 to February 2025 sampling window. Post-fire high PM10, a well-documented feature of wildfire-impacted urban environments, typically arises from a combination of long-range transport of aged smoke aerosols and the resuspension of deposited ash and coarse particles as human activity and traffic resume [37,38]. These processes can sustain elevated PM10 concentrations for several days to weeks beyond the active burning period, delaying the return to baseline urban levels [39,40]. The observed concentration during this period is therefore consistent with established post-fire dynamics reported in prior studies showing that wildfire-impacted urban environments frequently experience elevated coarse and fine PM due to both transported smoke and secondary resuspension mechanisms [41,42,43].
As shown in warm-season campaign (Figure 1b), the similar temporal variability was also observed across the 5 sampling periods, with PM10 concentrations ranging from approximately 12 μg/m3 during the 2nd biweekly period to a maximum of ~26 μg/m3 observed during both the 1st and 3rd biweekly periods; also, the 4th and 5th biweekly periods remained relatively stable at ~26 μg/m3 and ~25 μg/m3, respectively. This is also consistent with the CARB measurements, which show the concentrations decreasing from 30.89 μg/m3 during the 1st biweekly period to 16.25 μg/m3 during the 2nd biweekly period. These concentrations also fall within the expected range for dense urban environments with elevated particulate matter[44].
Throughout both sampling campaigns, PM10 concentrations also exhibited typical temporal patterns observed in highly urbanized areas surrounding USC, where daily human activity, roadway emissions, and atmospheric mixing conditions shape particulate loading. In addition to this day-to-day variability, we also observed a clear seasonal contrast, with PM10 concentrations measured during the cool-season campaign conducted during fall and winter averaging 26.14 µg/m3 across all 8 biweekly sampling periods, while in contrast, concentrations measured during the warm-season campaign conducted during summer averaged 23.32 µg/m3 across 5 biweekly sampling periods. This higher PM10 concentration observed during the first sampling campaign is consistent with colder-season meteorology, when lower mixing-layer heights, more frequent stable or stagnant conditions, weaker winds, and reduced atmospheric ventilation limit dispersion and help the accumulation of locally emitted and resuspended particles near the surface [45,46]. In contrast, warmer summer conditions are generally characterized by stronger atmospheric mixing, higher boundary layer development, and enhanced atmospheric ventilation, which promote pollutant dispersion and likely contribute to the comparatively lower PM10 concentrations observed during the warm-season campaign. Taken together, these seasonal patterns indicate that the same emission sources can produce substantially higher PM10 exposures under cooler stagnant atmospheric conditions compared to warmer seasons. This is in line with previous PM studies that emphasize the controlling role of meteorology on urban particulate levels in Mediterranean-type climates [36,47].
The agreement between PCIS and CARB measurements across all biweekly periods, including both the seasonal minimum and the wintertime enhancement, also indicates that the PCIS samplers captured ambient PM10 variability well. The correspondence in temporal structure indicates that the observed variability, whether driven by baseline urban emissions, winter stagnation, or post-fire contributions, is a robust feature of the local atmosphere. This agreement supports the interpretation of particle composition and microplastic measurements within the corresponding sampling periods.
3.1.2. Microplastic Number Concentration by Morphological Type
Figure 2 shows the number concentrations of airborne MPs across the two sampling campaigns, with Figure 2a representing the cool-season campaign and Figure 2b representing the warm-season campaign, illustrating temporal variability in both total abundance and morphological composition. As shown in Figure 2a, MP concentrations ranged from approximately 2.2 to 4 MP/m3 across the cool-season campaign, with the highest level observed in the 8th biweekly sampling, which is approximately 4.0 MP/m3, followed by the 5th and 6th periods. Similarly, during the warm-season campaign shown in Figure 2b, MP concentrations ranged from approximately 2.2 to 3.4 MP/m3 across the five sampling periods, with the highest levels observed during the 1st and 3rd biweekly periods at approximately 3.4 MP/m3. This range places the PIU site within the envelope of reported urban atmospheric MP concentrations, while the episodic peaks observed during the 5th, 6th, and 8th biweekly periods in the cool-season campaign and the 1st and 3rd biweekly periods in the warm-season campaign may indicate short-term increases relative to surrounding sampling periods. MP number concentrations are broadly comparable to those reported for dense urban environments in Paris and Shanghai (1-3 MP/m3), particularly for concentrations observed across both the cool and warm-season sampling campaigns, which remained near or moderately above the upper end of the reported urban range [48,49]. The comparison is intended to contextualize magnitude rather than imply direct equivalence across studies with different sampling designs and analytical methods [19].
Sampled MPs were classified into three morphological categories, including fibers (elongated, thread-like particles), fragments (irregular particles consistent with the mechanical breakdown of larger plastic materials), and transparent spheres (near-spherical particles with smooth edges). Morphological classification is commonly used as an indicator of both source characteristics and degradation pathways in atmospheric microplastic studies [49,50,51,52]. While fibers consistently represented the dominant morphological type in most samples, particularly in the 3rd, 4th, and 5th biweekly periods in the cool-season campaign, where they accounted for more than half of the observed MPs, transparent spheres were detected only in minor amounts across all sampling periods. A similar morphology distribution was also observed during the warm-season campaign, where fibers remained the dominant morphological type across all 5 biweekly sampling periods, contributing between approximately 45% and 73% of the total measured MPs. The dominance of fibers may suggest contribution from urban sources such as textile shedding and upholstered materials, which are known to release fibrous MPs through routine human activity and mechanical wear [49,52].
Fragments, on the other hand, were more noticeable in the 1st, 7th, and 8th biweekly periods in the cool-season campaign, indicating episodic inputs superimposed on the background fiber signal and the intermittent prominence of fragments points to short-term processes, such as enhanced mechanical stress or surface abrasion of plastic materials, rather than steady emissions, consistent with laboratory and field evidence that polymer embrittlement, physical abrasion, and wind-driven turbulence accelerate fragmentation [53,54]. During the warm-season campaign, fragments also contributed substantially across all 5 sampling periods, with the highest fragment concentration observed during the 1st biweekly period. This elevated concentration may partly reflect short-term increases in human activity and traffic-related disturbance associated with the July 4th holiday period, which can enhance the mechanical resuspension and fragmentation of deposited plastic materials in urban environments.
Transparent spheres also contributed negligibly to total MP number concentrations throughout the campaign and did not exhibit pronounced temporal variability. Their consistently low abundance of spherical particles suggests that sources commonly associated with spherical MPs (e.g., pellets or beads) were not a dominant contributor to airborne MPs at the study site during the sampling period. No transparent spherical particles were detected during any of the 5 sampling periods in the warm-season campaign, further indicating that primary spherical MP sources were not a major component of the airborne MP population observed at the PIU site. Instead, the predominance of fibers and fragments indicates that airborne MPs were mainly characterized by non-spherical morphologies, which are commonly reported in atmospheric environments and may result from a combination of fragmentation, abrasion, and other urban emission processes. [55,56].
The morphology-resolved results in Figure 2 indicate that temporal changes in airborne MP number concentration were driven mainly by variations in fragment abundance during certain biweekly periods, as fibers remained the dominant morphological category throughout both sampling campaigns and exhibited relatively smaller changes in abundance than fragments across sampling periods. Additionally, across both sampling campaigns, fiber concentrations remained consistently dominant regardless of season, suggesting relatively continuous urban emission sources, whereas fragment concentrations exhibited greater temporal variability and accounted for most of the observed fluctuations in total MP concentrations. This interpretation is supported by the temporal correspondence between increases in fragment concentrations and increases in total MP concentrations observed during the 5th, 6th, and 8th biweekly periods of the cool-season campaign and the 1st and 3rd biweekly periods of the warm-season campaign (Figure 2), whereas the fiber fraction remained the predominant morphology throughout the study period.
3.1.3. Carbonaceous Species (EC/OC)
Figure 3 shows the temporal variation of OC and EC concentrations across the two sampling campaigns, with Figure 3a representing the cool-season campaign and Figure 3b representing the warm-season campaign, highlighting both seasonal patterns and periods of enhanced carbonaceous aerosol influence. As shown in Figure 3a, OC concentrations were highest during the 8th biweekly period (9.81 ± 1.20 µg/m3), with similarly elevated values observed during the 5th and 6th periods (~8.6 µg/m3). EC concentrations also exhibited a comparable temporal pattern, with elevated levels during the 5th, 6th, and 8th weekly periods and a maximum observed during the 8th period, which was approximately 3.16 ± 0.68 µg/m3. Similarly, during the warm-season campaign shown in Figure 3b, OC concentrations remained relatively stable across all 5 sampling periods, ranging from 4.90 ± 0.59 µg/m3 to 5.80 ± 0.70 µg/m3, while EC concentrations varied between 1.60 ± 0.16 µg/m3 and 2.20 ± 0.22 µg/m3, with the highest concentrations observed during the 1st biweekly period.
The moderate increase in EC during the 6th biweekly period in the cool-season campaign (mid-January 2025) likely reflects residual smoldering and low-intensity combustion associated with regional wildfire activity that occurred earlier in January, during the later stages of regional wildfire activity, rather than emissions associated with active flaming fronts. Smoldering-dominated biomass-burning plumes are known to generate carbonaceous aerosols with enhanced organic fractions and elevated OC/EC ratios, and can persist over urban regions for days to weeks following active fire suppression [57,58,59]. These aging wildfire emissions have also been shown to transport substantial carbonaceous material over various scales [60], consistent with the elevated EC and OC observed during this period. Importantly, this enhancement is also reflected in the total PM10 mass concentrations shown in Section 3.1.1, indicating that increases in carbonaceous species contributed measurably to the bulk particulate loading, rather than representing isolated compositional changes. Additionally, the elevated OC and EC concentrations observed during the 1st biweekly period of the warm-season campaign may partly reflect increased urban activity associated with the July 4th holiday period, which likely contributed to a short-term enhancement in carbonaceous aerosol emissions.
Across all samples in the cool-season campaign, OC consistently exceeded EC, with OC/EC ratios ranging from approximately 2.4 to 3.6. Ratios within this range are characteristic of urban atmospheres influenced by a combination of primary combustion sources and secondary organic aerosol formation, rather than fresh traffic emissions alone [61,62]. Elevated OC/EC ratios indicate substantial contributions from aged and processed carbonaceous aerosols, which are more abundant under conditions of reduced atmospheric mixing and longer residence times [63,64]. A similar pattern was also observed during the warm-season campaign, where OC consistently remained higher than EC across all 5 sampling periods, with average concentrations of 5.38 ± 0.34 µg/m3 for OC and 1.84 ± 0.23 µg/m3 for EC, indicating comparable dominance of OC throughout both campaigns.
These carbonaceous conditions may be relevant for airborne microplastics, as atmospheric aging processes, such as photo-oxidation and mechanical weathering, are known to increase microplastic surface roughness and introduce oxygen-containing functional groups [49,65,66]. Such physicochemical modifications enhance the sorption of organic and inorganic species onto microplastic surfaces, suggesting that in an urban environment enriched in OC and EC, airborne MPs may readily interact with carbonaceous aerosols and associated contaminants. This interaction may influence MP atmospheric persistence, chemical reactivity, and potential toxicity, consistent with emerging evidence that carbon-rich matrices can amplify oxidative and inflammatory responses upon inhalation [67].
Additionally, the parallel OC and EC peaks during the 8th biweekly period in the cool-season campaign coincided with the highest total PM10 concentration, indicating that the enhancement in carbonaceous aerosols during this period was reflected in bulk PM10 mass. This co-occurrence likely reflects winter meteorology, including lower temperatures and reduced mixing-layer heights that limit pollutant dispersion and favor the accumulation of both primary and secondary carbonaceous material near the surface [68,69]. CARB data also show a mean temperature of 11.9 °C during this period, more than 10 °C lower than during the 1st biweekly sampling interval in the cool-season campaign. These conditions are consistent with the broader meteorological patterns, which will be discussed in Figure 7, supporting the interpretation that wintertime stagnation contributed to the elevated OC, EC, and PM10 levels observed during this period. In comparison, the relatively stable OC and EC concentrations observed throughout the warm-season campaign (summer time) suggest more consistent atmospheric conditions with reduced seasonal accumulation effects compared to the cool-season campaign.
3.1.4. Metals and Trace Elements
Figure 4 presents the biweekly trace elemental concentrations measured across two sampling campaigns, with Figure 4a representing the cool-season campaign and Figure 4b representing the warm-season campaign, illustrating variability among crustal, traffic-related, and anthropogenic elements. As shown in Figure 4a, Fe and Si exhibited broadly similar temporal patterns with concurrent peaks in the 5th (Fe: 325.0 ng/m3; Si: 337.5 ng/m3), 6th (Fe: 315.1 ng/m3; Si: 393.4 ng/m3), and 8th (Fe: 296.2 ng/m3; Si: 353.4 ng/m3) biweekly periods in the cool-season campaign. Their co-varying peaks may indicate contributions from common mineral-dust-related sources, including road abrasion, construction activity, and urban dust resuspension, as well as episodic inputs from wildfire plumes that can mobilize large quantities of fine mineral particles [70]. As major crustal components, Fe and Si often display similar atmospheric transport and deposition behavior [20,71], which can facilitate their simultaneous enhancement and co-occurrence with airborne MPs in urban air. Similarly, during the warm-season campaign shown in Figure 4b, Fe and Si exhibited a comparable temporal pattern, reaching their highest concentrations during the 1st biweekly period (Fe: 210 ng/m3; Si: 180 ng/m3), followed by a pronounced decrease during the 2nd biweekly period (Fe: 60 ng/m3; Si: 55 ng/m3), before partially recovering during the 3rd biweekly period (Fe: 205 ng/m3; Si: 175 ng/m3).
In the cool-season campaign, Zn showed a pronounced episodic spike, reaching 21.54 ng/m3 during the 4th biweekly period. As a recognized tracer of traffic-related emissions, Zn commonly arises from tire wear and brake abrasion [72,73]. It’s a short-term elevation, therefore likely reflecting increased local traffic activity or enhanced resuspension of previously deposited brake- and tire-derived particles, processes known to be sensitive to meteorology and roadway turbulence in near-road environments. During the warm-season campaign, Zn concentrations also remained elevated, reaching a maximum concentration of 13.5 ng/m3 during the 1st biweekly period, followed by a substantial decrease to 3.5 ng/m3 during the 2nd biweekly period and increasing again to 12.5 ng/m3 during the 3rd biweekly period. This short-term enhancement during the 1st sampling period may partly reflect increased local traffic activity and non-exhaust emissions associated with the July 4th holiday.
In addition, Ca, Al, and Mg in the cool-season campaign exhibited elevated concentrations during the 5th and 6th biweekly periods, with Ca reaching 259.6 ng/m3, Al at 158.2 ng/m3, and Mg at 96.7 ng/m3. These elements are typically associated with deposited dust, soil resuspension, and crustal material transported from disturbed surfaces [74]. Their elevated levels during the 6th period may also reflect wildfire-related dust emissions and enhanced mechanical disturbance of exposed soils, consistent with the broader regional wildfire influence observed during this interval. A similar temporal pattern was also observed during the warm-season campaign, where Ca, Al, and Mg reached their highest concentrations during the 1st biweekly period (Ca: 150 ng/m3; Al: 95 ng/m3; Mg: 70 ng/m3), followed by a sharp decline during the 2nd biweekly period (Ca: 45 ng/m3; Al: 30 ng/m3; Mg: 20 ng/m3), before recovering during the 3rd biweekly period. These fluctuations suggest episodic enhancement of crustal and resuspended particles superimposed on the urban background conditions observed throughout the warm-season campaign.
3.2. Microplastic Size Distribution
Figure 5 presents the normalized microplastic size distribution across the two sampling campaigns, with Figure 5a representing the cool-season campaign and Figure 5b showing the results from the warm-season campaign, illustrating how particle counts vary across 26 size bins from 5 to 1300 µm. As shown in Figure 5, particles in the 5-100 µm range dominated across all periods, consistent with findings by Chandrakhanthan et al. (2023), who reported elevated counts in this range due to the prolonged atmospheric residence time of smaller particles. A similar pattern was also observed during the warm-season campaign, shown in Figure 5b, where particles in the 5-100 µm range also dominated across all 5 biweekly periods. The dominant size fraction was 5-50 µm during the 1st, 2nd, 3rd, and 4th biweekly periods, while the 50-100 µm fraction was dominant during the 5th biweekly period. This dominance of fine microplastics reflects fundamental atmospheric behavior, such as smaller particles settling more slowly, remaining suspended for longer durations, and therefore accumulating more readily than larger, heavier particles [75]. In addition, progressive weathering and fragmentation of larger plastics produce far more small particles than large ones, continually replenishing the fine-size fraction in the atmosphere [76]. These combined mechanisms contribute to the strong skew toward smaller particle sizes observed across all sampling periods.
Notably, particles with physical dimensions greater than 10 µm were still detected in our samples, which is expected because the PM10 inlet classifies particles according to aerodynamic diameter rather than their largest geometric dimension [19]. The particle dimensions measured by microscopy therefore represent geometric size rather than aerodynamic size. Aerodynamic diameter is governed by particle settling behavior, which is influenced by particle density, shape, and aerodynamic drag, rather than by geometric dimensions alone. Aerodynamic behavior reflects the combined effects of particle density, morphology, and drag, and irregularly shaped microplastics, especially nonspherical fibers, can exhibit settling characteristics that fall within the PM10 efficiency curve even when their longest dimension exceeds 10 µm. Consequently, elongated fibers with relatively small cross-sectional diameters may possess aerodynamic diameters within the PM10 sampling range despite having substantially larger geometric lengths. Laboratory measurements have shown that such fibers experience substantially greater drag and reduced settling velocities compared with volume-equivalent spheres, enabling them to remain suspended longer and penetrate size-selective inlets. Similarly, [77] demonstrated that the long-range atmospheric transport of MP fibers is strongly influenced by their high aspect ratio and small cross-sectional dimensions, highlighting that fiber length alone does not determine atmospheric transport behavior. These aerodynamic properties explain why fibers with geometric lengths exceeding 10 µm can still be collected within the PM10 size fraction across both sampling campaigns. These aerodynamic properties explain why fibers with geometric lengths exceeding 10 µm can be captured by the PM10 inlet despite their larger geometric dimensions.
Larger particles (>100 µm) were also detected, though rarely, which may suggest the predominance of ongoing fragmentation and degradation processes that typically produce smaller MPs [19]. Particle counts decreased substantially beyond the 100-150 µm size range, with only limited particles observed in the larger size fraction range. Their infrequent occurrence aligns with both the rapid settling of coarse particles and the continual generation of finer debris from weathered plastics, reinforcing the strong skew toward the smaller size classes observed across all sampling periods.
In terms of potential exposure, these findings suggest a higher risk of exposure to smaller airborne MPs, which may have a greater potential to trigger pro-inflammatory responses in human cells and contribute to adverse health effects [28].
3.3. Comparison of Size Distribution Peaks
Figure 6 illustrates the average normalized microplastic size distributions for samples whose peak concentrations occurred in the 5-50 µm and 50-100 µm ranges across both sampling campaigns. The figure highlights how rapidly particle abundance declines with increasing size and how consistently the smaller fractions dominate the ambient profile. As shown in Figure 6, this steep decline is observed in both peak groups, which exhibited pronounced decreases in particle abundance immediately after their maximum size bins, demonstrating a strongly right-skewed distribution in which smaller MPs (<100 µm) dominate the airborne population. This rapid decrease reflects the limited atmospheric persistence of larger particles and the preferential accumulation of finer material in suspension throughout both sampling campaigns.
In the 5-50 µm group, particle counts in each size bin are expressed as a percentage of the maximum bin count within that distribution, such that the most abundant size bin is normalized to 100%. Under this normalization, counts reached nearly 100% in the smallest size bins, then declined sharply, falling below 20% by approximately 200 µm. The 50-100 µm group exhibited a similar normalized decline pattern, with a slightly broader tail extending beyond 200 µm. These patterns indicate that even when the modal peak shifts toward larger sub-100-µm sizes, particle abundance decreases rapidly with increasing particle dimensions. This distribution remained consistent after incorporating the warm-season campaign, where 4 of the 5 additional biweekly sampling periods were also characterized by maximum counts in the 5-50 µm size range, while only the 5th biweekly period exhibited a maximum in the 50-100 µm range.
The predominance of particles smaller than 100 µm is consistent with previous observations from Chandrakanthan et al. (2023), who reported that over 75% of airborne MPs in urban environments were below 100 µm. This concentration of fine particles is also supported by atmospheric behavior, as smaller MPs settle more slowly and have longer suspension lifetimes, allowing them to accumulate more readily in the air. Larger particles (>100 µm) remained relatively uncommon in both peak categories, underscoring the inhalation-relevant risks associated with the finer fractions, as small particles have greater mobility, longer residence times, and more efficient pathways for respiratory exposure.
This overall size pattern is further reinforced by fragmentation dynamics, which show that the breakdown of a single larger microplastic item can generate hundreds to thousands of fine particles, continually replenishing the smaller fractions and explaining the sharp decay in particle abundance with increasing size. Such processes also contribute to the persistent dominance of sub-100-µm particles observed throughout all sampling periods across both sampling campaigns.
3.4. Correlation Between Chemical Species and Microplastic Number Concentrations
Table 1 shows the Spearman correlations between elemental species, EC, OC, and MP concentrations across all biweekly sampling periods. Because smaller MPs (<100 µm) represented the dominant size fraction across both sampling campaigns (Figure 5), the observed correlations between MP concentrations and chemical species measured in PM₁₀ are likely dominated by this abundant small MP population, whereas the relatively few larger particles (>100 µm) contribute comparatively little to the overall relationships. As shown in Table 1, statistically significant correlations were observed between MP concentrations and several commonly used PM10 source tracers. Leave-one-out analysis confirmed that no single sampling period drove the reported correlations. The strong correlations of total MP counts with Si (0.81), Fe (0.94), Mn (0.93), Ca (0.90), and Al (0.87), which are commonly used as tracers of resuspended dust [73,78], may indicate that MPs co-varied with resuspended soil particles, although these elements are not specific to a single source. In addition, the strong associations of total MP counts with Ba (0.79), Cu (0.80), and Ni (0.93), commonly used as tracers of non-tailpipe traffic emissions, have also been observed, suggesting that MPs co-varied with abrasive vehicular sources such as brake, tire, and road wear particles [79,80]. These elements have multiple potential sources, and the associations reported here indicate temporal co-variation. While the strong correlations with EC and OC (EC: 0.91 and OC: 0.92 ) do not directly reflect the origin of MPs from combustion sources, they can be explained by the co-occurrence of combustion-related tailpipe emissions and abrasive non-tailpipe sources in urban settings [81,82]. In addition, atmospheric MPs can act as surfaces for the adsorption or accumulation of carbonaceous material during atmospheric transport, which may further contribute to the observed associations between MPs and EC/OC measured in PM10 [49,65,66]
Furthermore, the observed high correlations with Pb (0.87) and Cr (0.85), which are commonly associated with industrial emissions [83,84] may also indicate that airborne MP levels co-varied with industrial activity. It is also essential to consider that the high correlation with Pb may not be solely explained by industrial sources, as Pb is also commonly found in road dust and can be partially associated with non-tailpipe emissions [85,86].
Similarly, the correlations of total MP counts with Mg (ρ = 0.95) and Na (ρ = 0.65) are consistent with an influence of aged sea salt and marine aerosol, as both elements are established tracers of marine aerosols [87,88], indicating the possibility of MPs being transported from the ocean into the atmosphere. Given the coastal setting of Los Angeles, these correlations indicate the possibility of atmospheric transport of marine-derived particles, including MPs, from the nearby Pacific Ocean into the urban airshed. The elevated correlation with Mg may also reflect terrestrial inputs, particularly from resuspended road dust [89,90], which commonly contains Mg. Taken together, these associations can point to a mixture of non-tailpipe, resuspended dust, as well as marine/industrial sources influencing airborne MPs in Los Angeles.
To further resolve source influences, correlations were examined for individual microplastic morphological categories where fibers showed strong correlations with Al (ρ = 0.72), Ca (ρ = 0.74), Fe (ρ = 0.82), and Mn (ρ = 0.86). These elements are well-known markers of crustal material [91,92], indicating that airborne MPs in the form of fibers may be co-transported with mineral particles and suspended in the atmosphere through soil and dust mobilization processes. Additionally, the association of fibers with Mg (ρ = 0.84) may also indicate potential contributions from marine emissions and resuspended dust [93,94]. The correlations with Ba (ρ = 0.73) and Cu (ρ = 0.70) additionally suggest an influence from non-tailpipe traffic emissions [72]. Similarly, the correlations with EC (ρ = 0.80) and OC (ρ = 0.75) indicate that, in addition to their role as combustion tracers, these species can also capture the overlapping influence of tailpipe and non-tailpipe emissions in urban environments.
For fragments, no significant correlations with the measured chemical species were observed, in contrast to the consistent associations found for fibers. For transparent spheres, the strong correlation with Cd (0.73) suggests contributions from plastic dust [95], possibly resuspended from ground-up plastic debris, as Cd is commonly used as a dyeing agent in plastic production. Transparent spheres were not detected during the warm-season campaign, and the correlations reported for this category therefore reflect the combined dataset, in which those periods contribute zero counts. Taken together, the absence of significant fragment associations, alongside the strong Cd association for transparent spheres, indicates that transparent spheres are more likely governed by material-specific plastic sources rather than by crustal or traffic-related co-emissions (Table 1).
The cool and warm-season campaigns also represented different atmospheric periods, with the cool-season campaign including a sampling interval influenced by regional wildfire activity and the warm-season campaign including the July 4th holiday period. These differences provide seasonal and episodic context for interpreting campaign-to-campaign variability in chemical composition and MP associations. Therefore, these correlations indicate that airborne MPs in Los Angeles co-varied with tracers of multiple urban source categories, and the strong linkage with traffic-related and crustal tracers highlights that people are disproportionately exposed to smaller, abrasion-derived particles that may pose greater inflammatory potential.
3.5. Meteorological Variability
Figure 7 presents the biweekly variations in RH, temperature, wind speed, and wind direction across the cool and warm-season campaigns. During the cool-season campaign (Figure 7a), conducted from October 2024 to February 2025, RH exhibited considerable variability, ranging from approximately 40% to 80%, with the lowest biweekly averages during the 3rd and 6th periods and the highest during the 7th period. Temperature also followed a declining trend across the first campaign, decreasing from approximately 22 °C in the 1st biweekly period to a minimum of ~13 °C during the 6th period, followed by a modest increase thereafter. Wind speed remained relatively stable throughout the cool-season periods, ranging between approximately 3.5 and 4.5 mph, with a slight increase during the 6th biweekly period, which was consistent with the study by Chandrakhanthan et al. (2023), suggesting that wind conditions during the campaign were not strong enough to substantially influence the airborne microplastic levels.
During the warm-season campaign (Figure 7b), conducted from June to September 2025, RH remained relatively stable across the 5 biweekly periods, ranging from approximately 66% to 74%. Temperature exhibited warmer summer conditions compared with the cool-season campaign, increasing from approximately 22 °C during the 1st biweekly period to approximately 28 °C during the 5th biweekly period. Wind speed remained relatively consistent across the warm-season campaign, with average values around 4 mph, indicating limited variability in atmospheric transport conditions.
The descriptive meteorological patterns shown in Figure 7 indicate substantial variability in RH and temperature across both sampling campaigns, while wind conditions remained relatively stable. To assess whether these short-term meteorological fluctuations exerted a measurable influence on airborne microplastic concentrations, statistical analyses were also conducted. These analyses did not reveal consistent or systematic relationships between meteorological variables and total or morphology-resolved microplastic counts, indicating that meteorology did not play a dominant role in shaping airborne MP levels during the sampling periods. This finding is consistent with prior urban studies, including Chandrakanthan et al. (2023), which similarly reported limited meteorological control on airborne microplastic concentrations. Accordingly, the observed MP patterns are interpreted to be governed primarily by source contributions rather than short-term meteorological variability.
4. Conclusions
This study provides an exploratory characterization of airborne microplastics associated with PM10 in central Los Angeles by integrating microplastic abundance, morphology, size distribution, PM10 chemical composition, and meteorological observations across two seasonal sampling campaigns. Airborne MPs were consistently detected throughout the study period and were predominantly fibrous and smaller than 100 µm, indicating that MPs are a persistent component of the urban atmosphere.
The consistent associations between airborne MPs and PM10 chemical tracers suggest that MPs co-vary with the broader urban particulate matter mixture rather than behaving as isolated atmospheric contaminants. Associations with crustal elements, traffic-related non-tailpipe tracers, and carbonaceous species are consistent with the influence of urban particulate processes, including resuspension and roadway abrasion, while short-term meteorological variability did not consistently explain the observed temporal patterns. Therefore, these findings demonstrate the value of integrating MP characterization with conventional PM10 chemical measurements to improve understanding of the occurrence, temporal variability, and potential source influences of airborne MPs in urban environments. This integrated approach can provide a framework for future investigations of airborne MPs and supports their consideration in urban air quality and human exposure assessments.
Author Contributions
Conceptualization, S.F., Y.A., M.M.B. and C.S.; methodology, S.F., Y.A., M.M.B.,K.Ch., P.H., M.P.F., J.Z. and C.S.; investigation, S.F., Y.A., M.M.B., K.Ch., and P.H.; data curation, S.F., Y.A. and M.M.B.; writing—original draft preparation, S.F.; writing—review and editing, Y.A., M.M.B., M.P.F., J.Z. and C.S.; visualization, S.F.; supervision, C.S.; project administration, C.S.; funding acquisition, C.S. All authors have read and agreed to the published version of the manuscript.
Funding
This work was supported by funding from a Ph.D. fellowship from the Viterbi School of Engineering at the University of Southern California.
Data Availability Statement
The data presented in this study are available on request from the corresponding author.
Conflicts of Interest
The authors declare no conflict of interest.
References
- Geyer, R.; Jambeck, J.R.; Law, K.L. Production, Use, and Fate of All Plastics Ever Made. Sci. Adv. 2017, 3, e1700782. [Google Scholar] [CrossRef] [PubMed]
- Gasperi, J.; Wright, S.L.; Dris, R.; Collard, F.; Mandin, C.; Guerrouache, M.; Langlois, V.; Kelly, F.J.; Tassin, B. Microplastics in Air: Are We Breathing It In? Curr. Opin. Environ. Sci. Health 2018, 1, 1–5. [Google Scholar] [CrossRef]
- NOAA What Are Microplastics? Available online: https://oceanservice.noaa.gov/facts/microplastics.html (accessed on 14 December 2025).
- Jenner, L.C.; Sadofsky, L.R.; Danopoulos, E.; Rotchell, J.M. Household Indoor Microplastics within the Humber Region (United Kingdom): Quantification and Chemical Characterisation of Particles Present. Atmos. Environ. 2021, 259, 118512. [Google Scholar] [CrossRef]
- Wright, S.L.; Ulke, J.; Font, A.; Chan, K.L.A.; Kelly, F.J. Atmospheric Microplastic Deposition in an Urban Environment and an Evaluation of Transport. Environ. Int. 2020, 136, 105411. [Google Scholar] [CrossRef] [PubMed]
- Hidalgo-Ruz, V.; Gutow, L.; Thompson, R.C.; Thiel, M. Microplastics in the Marine Environment: A Review of the Methods Used for Identification and Quantification. Environ. Sci. Technol. 2012, 46, 3060–3075. [Google Scholar] [CrossRef] [PubMed]
- Khatmullina, L.; Isachenko, I. Settling Velocity of Microplastic Particles of Regular Shapes. Mar. Pollut. Bull. 2017, 114, 871–880. [Google Scholar] [CrossRef] [PubMed]
- Chu, X.; Zheng, B.; Li, Z.; Cai, C.; Peng, Z.; Zhao, P.; Tian, Y. Occurrence and Distribution of Microplastics in Water Supply Systems: In Water and Pipe Scales. Sci. Total Environ. 2022, 803, 150004. [Google Scholar] [CrossRef] [PubMed]
- Dris, R.; Gasperi, J.; Rocher, V.; Saad, M.; Renault, N.; Tassin, B. Microplastic Contamination in an Urban Area: A Case Study in Greater Paris. Environ. Chem. 2015, 12, 592–599. [Google Scholar] [CrossRef]
- Dris, R.; Gasperi, J.; Saad, M.; Mirande, C.; Tassin, B. Synthetic Fibers in Atmospheric Fallout: A Source of Microplastics in the Environment? Mar. Pollut. Bull. 2016, 104, 290–293. [Google Scholar] [CrossRef] [PubMed]
- Evangeliou, N.; Tichý, O.; Eckhardt, S.; Zwaaftink, C.G.; Brahney, J. Sources and Fate of Atmospheric Microplastics Revealed from Inverse and Dispersion Modelling: From Global Emissions to Deposition. J. Hazard. Mater. 2022, 432, 128585. [Google Scholar] [CrossRef] [PubMed]
- Karapanagioti, H.K.; Kalavrouziotis, I.K.; Karapanagioti, H.K.; Kalavrouziotis, I.K. Microplastics in Water Bodies and in the Environment. Water 2022, 14. [Google Scholar] [CrossRef]
- Loganathan, Yukeswaran; Kizhakedathil, Moni Philip Jacob. A Review on Microplastics – An Indelible Ubiquitous Pollutant. Biointerface Res. Appl. Chem. 2022, 13, 126. [Google Scholar] [CrossRef]
- Mu, H.; Wang, Y.; Zhang, H.; Guo, F.; Li, A.; Zhang, S.; Liu, S.; Liu, T. High Abundance of Microplastics in Groundwater in Jiaodong Peninsula, China. Sci. Total Environ. 2022, 839, 156318. [Google Scholar] [CrossRef] [PubMed]
- Yusuf, A.; Sodiq, A.; Giwa, A.; Eke, J.; Pikuda, O.; Eniola, J.O.; Ajiwokewu, B.; Sambudi, N.S.; Bilad, M.R. Updated Review on Microplastics in Water, Their Occurrence, Detection, Measurement, Environmental Pollution, and the Need for Regulatory Standards. Environ. Pollut. 2022, 292, 118421. [Google Scholar] [CrossRef] [PubMed]
- Bergmann, M.; Mützel, S.; Primpke, S.; Tekman, M.B.; Trachsel, J.; Gerdts, G. White and Wonderful? Microplastics Prevail in Snow from the Alps to the Arctic. Sci. Adv. 2019, 5, eaax1157. [Google Scholar] [CrossRef] [PubMed]
- Brahney, J.; Hallerud, M.; Heim, E.; Hahnenberger, M.; Sukumaran, S. Plastic Rain in Protected Areas of the United States. Science 2020, 368, 1257–1260. [Google Scholar] [CrossRef] [PubMed]
- Brahney, J.; Mahowald, N.; Prank, M.; Cornwell, G.; Klimont, Z.; Matsui, H.; Prather, K.A. Constraining the Atmospheric Limb of the Plastic Cycle. Proc. Natl. Acad. Sci. 2021, 118, e2020719118. [Google Scholar] [CrossRef] [PubMed]
- Chandrakanthan, K.; Fraser, M.P.; Herckes, P. Airborne Microplastics in a Suburban Location in the Desert Southwest: Occurrence and Identification Challenges. Atmos. Environ. 2023, 298, 119617. [Google Scholar] [CrossRef]
- Chen, Q.; Shi, G.; Revell, L.E.; Zhang, J.; Zuo, C.; Wang, D.; Le Ru, E.C.; Wu, G.; Mitrano, D.M. Long-Range Atmospheric Transport of Microplastics across the Southern Hemisphere. Nat. Commun. 2023, 14, 7898. [Google Scholar] [CrossRef] [PubMed]
- Amato-Lourenço, L.F.; Carvalho-Oliveira, R.; Júnior, G.R.; dos Santos Galvão, L.; Ando, R.A.; Mauad, T. Presence of Airborne Microplastics in Human Lung Tissue. J. Hazard. Mater. 2021, 416, 126124. [Google Scholar] [CrossRef] [PubMed]
- Jenner, L.C.; Rotchell, J.M.; Bennett, R.T.; Cowen, M.; Tentzeris, V.; Sadofsky, L.R. Detection of Microplastics in Human Lung Tissue Using μFTIR Spectroscopy. Sci. Total Environ. 2022, 831, 154907. [Google Scholar] [CrossRef] [PubMed]
- Amato-Lourenço, L.F.; de Souza Xavier Costa, N.; Dantas, K.C.; dos Santos Galvão, L.; Moralles, F.N.; Lombardi, S.C.F.S.; Júnior, A.M.; Lindoso, J.A.L.; Ando, R.A.; Lima, F.G.; et al. Airborne Microplastics and SARS-CoV-2 in Total Suspended Particles in the Area Surrounding the Largest Medical Centre in Latin America. Environ. Pollut. 2022, 292, 118299. [Google Scholar] [CrossRef] [PubMed]
- Kosuth, M.; Mason, S.A.; Wattenberg, E.V. Anthropogenic Contamination of Tap Water, Beer, and Sea Salt. PLoS ONE 2018, 13, e0194970. [Google Scholar] [CrossRef] [PubMed]
- Kutralam-Muniasamy, G.; Pérez-Guevara, F.; Elizalde-Martínez, I.; Shruti, V.C. Branded Milks – Are They Immune from Microplastics Contamination? Sci. Total Environ. 2020, 714, 136823. [Google Scholar] [CrossRef] [PubMed]
- Liebezeit, G.; Liebezeit, E. Non-Pollen Particulates in Honey and Sugar. Food Addit. Contam. Part A 2013, 30, 2136–2140. [Google Scholar] [CrossRef] [PubMed]
- Zhang, Q.; Xu, E.G.; Li, J.; Chen, Q.; Ma, L.; Zeng, E.Y.; Shi, H. A Review of Microplastics in Table Salt, Drinking Water, and Air: Direct Human Exposure. Environ. Sci. Technol. 2020, 54, 3740–3751. [Google Scholar] [CrossRef] [PubMed]
- Hwang, J.; Choi, D.; Han, S.; Choi, J.; Hong, J. An Assessment of the Toxicity of Polypropylene Microplastics in Human Derived Cells. Sci. Total Environ. 2019, 684, 657–669. [Google Scholar] [CrossRef] [PubMed]
- Liu, P.; Zhan, X.; Wu, X.; Li, J.; Wang, H.; Gao, S. Effect of Weathering on Environmental Behavior of Microplastics: Properties, Sorption and Potential Risks. Chemosphere 2020, 242, 125193. [Google Scholar] [CrossRef] [PubMed]
- He, Y.; Fazelvalipour, S.; Chen, M.; Yañez, C.C.; Forestieri, S.; Nishandar, S.R.; Neyestani, S.E.; Quiros, D.C.; Zhang, J. Development of a Heavy-Duty Vehicle Emissions Inventory with High Spatial Resolution for Community-Level Analysis. ACS EST Air 2025. [Google Scholar] [CrossRef]
- Jalali Farahani, V.; Altuwayjiri, A.; Taghvaee, S.; Sioutas, C. Tailpipe and Nontailpipe Emission Factors and Source Contributions of PM10 on Major Freeways in the Los Angeles Basin. Environ. Sci. Technol. 2022, 56, 7029–7039. [Google Scholar] [CrossRef] [PubMed]
- Shirmohammadi, F.; Wang, D.; Hasheminassab, S.; Verma, V.; Schauer, J.J.; Shafer, M.M.; Sioutas, C. Oxidative Potential of On-Road Fine Particulate Matter (PM2.5) Measured on Major Freeways of Los Angeles, CA, and a 10-Year Comparison with Earlier Roadside Studies. Atmos. Environ. 2017, 148, 102–114. [Google Scholar] [CrossRef]
- Misra, C.; Singh, M.; Shen, S.; Sioutas, C.; Hall, P.M. Development and Evaluation of a Personal Cascade Impactor Sampler (PCIS). J. Aerosol Sci. 2002, 33, 1027–1047. [Google Scholar] [CrossRef]
- Singh, M.; Misra, C.; Sioutas, C. Field Evaluation of a Personal Cascade Impactor Sampler (PCIS). Atmos. Environ. 2003, 37, 4781–4793. [Google Scholar] [CrossRef]
- Alshetty, D.; S. M., S.N. Urban Characteristics and Its Influence on Resuspension of Road Dust, Air Quality and Exposure. Air Qual. Atmos. Health 2022, 15, 273–287. [Google Scholar] [CrossRef]
- Hasheminassab, S.; Daher, N.; Saffari, A.; Wang, D.; Ostro, B.D.; Sioutas, C. Spatial and Temporal Variability of Sources of Ambient Fine Particulate Matter (PM2.5) in California. Atmos. Chem. Phys. 2014, 14, 12085–12097. [Google Scholar] [CrossRef]
- Burke, M.; Childs, M.L.; de la Cuesta, B.; Qiu, M.; Li, J.; Gould, C.F.; Heft-Neal, S.; Wara, M. The Contribution of Wildfire to PM2.5 Trends in the USA. Nature 2023, 622, 761–766. [Google Scholar] [CrossRef] [PubMed]
- Tarín-Carrasco, P.; Augusto, S.; Palacios-Peña, L.; Ratola, N.; Jiménez-Guerrero, P. Impact of Large Wildfires on PM10 Levels and Human Mortality in Portugal. Nat. Hazards Earth Syst. Sci. 2021, 21, 2867–2880. [Google Scholar] [CrossRef]
- Phuleria, Harish C.; Fine, Philip M.; Zhu, Yifang; Sioutas, Constantinos. Air Quality Impacts of the October 2003 Southern California Wildfires. Available online: https://agupubs.onlinelibrary.wiley.com/doi/full/10.1029/2004JD004626 (accessed on 9 December 2025).
- Viswanathan, S.; Eria, L.; Diunugala, N.; Johnson, J.; McClean, C. An Analysis of Effects of San Diego Wildfire on Ambient Air Quality. J. Air Waste Manag. Assoc. 2006, 56, 56–67. [Google Scholar] [CrossRef] [PubMed]
- Sparks, T.L.; Wagner, J. Composition of Particulate Matter during a Wildfire Smoke Episode in an Urban Area. Aerosol Sci. Technol. 2021, 55, 734–747. [Google Scholar] [CrossRef]
- van Drooge, B.L.; Sicard, M.; Stohl, A.; Fontal, M.; Bravo, N.; Muñoz, A.; Lange, D.; Fernández, P.; Grimalt, J.O. Detection and Simulation of Wildfire Smoke Impacting a Mediterranean Urban Atmosphere. Atmos. Pollut. Res. 2016, 7, 494–502. [Google Scholar] [CrossRef]
- Wu, J.; M Winer, A.; J Delfino, R. Exposure Assessment of Particulate Matter Air Pollution before, during, and after the 2003 Southern California Wildfires. Atmos. Environ. 2006, 40, 3333–3348. [Google Scholar] [CrossRef]
- Wei, T.; Wijesiri, B.; Li, Y.; Goonetilleke, A. Particulate Matter Exchange between Atmosphere and Roads Surfaces in Urban Areas. J. Environ. Sci. 2020, 98, 118–123. [Google Scholar] [CrossRef] [PubMed]
- Mousavi, A.; Sowlat, M.H.; Sioutas, C. Diurnal and Seasonal Trends and Source Apportionment of Redox-Active Metals in Los Angeles Using a Novel Online Metal Monitor and Positive Matrix Factorization (PMF). Atmos. Environ. 2018, 174, 15–24. [Google Scholar] [CrossRef]
- Zeb, B.; Ditta, A.; Alam, K.; Sorooshian, A.; Din, B.U.; Iqbal, R.; Habib ur Rahman, M.; Raza, A.; Alwahibi, M.S.; Elshikh, M.S. Wintertime Investigation of PM10 Concentrations, Sources, and Relationship with Different Meteorological Parameters. Sci. Rep. 2024, 14, 154. [Google Scholar] [CrossRef] [PubMed]
- Galindo, N.; Varea, M.; Gil-Moltó, J.; Yubero, E.; Nicolás, J. The Influence of Meteorology on Particulate Matter Concentrations at an Urban Mediterranean Location. Water. Air. Soil Pollut. 2011, 215, 365–372. [Google Scholar] [CrossRef]
- Dris, R.; Gasperi, J.; Mirande, C.; Mandin, C.; Guerrouache, M.; Langlois, V.; Tassin, B. A First Overview of Textile Fibers, Including Microplastics, in Indoor and Outdoor Environments. Environ. Pollut. 2017, 221, 453–458. [Google Scholar] [CrossRef] [PubMed]
- Liu, K.; Wang, X.; Fang, T.; Xu, P.; Zhu, L.; Li, D. Source and Potential Risk Assessment of Suspended Atmospheric Microplastics in Shanghai. Sci. Total Environ. 2019, 675, 462–471. [Google Scholar] [CrossRef] [PubMed]
- Andrady, A.L. Microplastics in the Marine Environment. Mar. Pollut. Bull. 2011, 62, 1596–1605. [Google Scholar] [CrossRef] [PubMed]
- Bergmann, M.; Gutow, L.; Klages, M. Marine Anthropogenic Litter; Springer Nature, 2015. [Google Scholar]
- Ebrahimi, P.; Abbasi, S.; Pashaei, R.; Bogusz, A.; Oleszczuk, P. Investigating Impact of Physicochemical Properties of Microplastics on Human Health: A Short Bibliometric Analysis and Review. Chemosphere 2022, 289, 133146. [Google Scholar] [CrossRef] [PubMed]
- Belioka, M.-P.; Achilias, D.S.; Belioka, M.-P.; Achilias, D.S. The Effect of Weathering Conditions in Combination with Natural Phenomena/Disasters on Microplastics’ Transport from Aquatic Environments to Agricultural Soils. Microplastics 2024, 3, 518–538. [Google Scholar] [CrossRef]
- Jaikumar, G.; Brun, N.R.; Vijver, M.G.; Bosker, T. Reproductive Toxicity of Primary and Secondary Microplastics to Three Cladocerans during Chronic Exposure. Environ. Pollut. 2019, 249, 638–646. [Google Scholar] [CrossRef] [PubMed]
- Rodríguez-Seijo, Andrés; Pereira, Ruth. Morphological and Physical Characterization of Microplastics. In Comprehensive Analytical Chemistry; Elsevier, 2017; Vol. 75, pp. 49–66. [Google Scholar]
- Rosal, R. Morphological Description of Microplastic Particles for Environmental Fate Studies. Mar. Pollut. Bull. 2021, 171, 112716. [Google Scholar] [CrossRef] [PubMed]
- Crounse, J.D.; DeCarlo, P.F.; Blake, D.R.; Emmons, L.K.; Campos, T.L.; Apel, E.C.; Clarke, A.D.; Weinheimer, A.J.; McCabe, D.C.; Yokelson, R.J.; et al. Biomass Burning and Urban Air Pollution over the Central Mexican Plateau. Atmos. Chem. Phys. 2009, 9, 4929–4944. [Google Scholar] [CrossRef]
- Marlier, M.E.; DeFries, R.S.; Voulgarakis, A.; Kinney, P.L.; Randerson, J.T.; Shindell, D.T.; Chen, Y.; Faluvegi, G. El Niño and Health Risks from Landscape Fire Emissions in Southeast Asia. Nat. Clim. Change 2013, 3, 131–136. [Google Scholar] [CrossRef] [PubMed]
- Naeher, L.P.; Brauer, M.; Lipsett, M.; Zelikoff, J.T.; Simpson, C.D.; Koenig, J.Q.; Smith, K.R. Woodsmoke Health Effects: A Review. Inhal. Toxicol. 2007, 19, 67–106. [Google Scholar] [CrossRef] [PubMed]
- Jaffe, D.; Hafner, W.; Chand, D.; Westerling, A.; Spracklen, D. Interannual Variations in PM2.5 Due to Wildfires in the Western United States. Environ. Sci. Technol. 2008, 42, 2812–2818. [Google Scholar] [CrossRef] [PubMed]
- Kim, W.; Lee, H.; Kim, J.; Jeong, U.; Kweon, J. Estimation of Seasonal Diurnal Variations in Primary and Secondary Organic Carbon Concentrations in the Urban Atmosphere: EC Tracer and Multiple Regression Approaches. Atmos. Environ. 2012, 56, 101–108. [Google Scholar] [CrossRef]
- Pio, C.; Cerqueira, M.; Harrison, R.M.; Nunes, T.; Mirante, F.; Alves, C.; Oliveira, C.; Sanchez de la Campa, A.; Artíñano, B.; Matos, M. OC/EC Ratio Observations in Europe: Re-Thinking the Approach for Apportionment between Primary and Secondary Organic Carbon. Atmos. Environ. 2011, 45, 6121–6132. [Google Scholar] [CrossRef]
- Plaza, J.; Gómez-Moreno, F.J.; Núñez, L.; Pujadas, M.; Artíñano, B. Estimation of Secondary Organic Aerosol Formation from Semi-Continuous OC–EC Measurements in a Madrid Suburban Area. Atmos. Environ. 2006, 40, 1134–1147. [Google Scholar] [CrossRef]
- Plaza, J.; Artíñano, B.; Salvador, P.; Gómez-Moreno, F.J.; Pujadas, M.; Pio, C.A. Short-Term Secondary Organic Carbon Estimations with a Modified OC/EC Primary Ratio Method at a Suburban Site in Madrid (Spain). Atmos. Environ. 2011, 45, 2496–2506. [Google Scholar] [CrossRef]
- Duan, J.; Bolan, N.; Li, Y.; Ding, S.; Atugoda, T.; Vithanage, M.; Sarkar, B.; Tsang, D.C.W.; Kirkham, M.B. Weathering of Microplastics and Interaction with Other Coexisting Constituents in Terrestrial and Aquatic Environments. Water Res. 2021, 196, 117011. [Google Scholar] [CrossRef] [PubMed]
- Hüffer, T.; Weniger, A.-K.; Hofmann, T. Sorption of Organic Compounds by Aged Polystyrene Microplastic Particles. Environ. Pollut. 2018, 236, 218–225. [Google Scholar] [CrossRef] [PubMed]
- Ren, Z.; Gui, X.; Xu, X.; Zhao, L.; Qiu, H.; Cao, X. Microplastics in the Soil-Groundwater Environment: Aging, Migration, and Co-Transport of Contaminants – A Critical Review. J. Hazard. Mater. 2021, 419, 126455. [Google Scholar] [CrossRef] [PubMed]
- Aghaei, Y.; Badami, M.M.; Aldekheel, M.; Tohidi, R.; Sioutas, C. Seasonal Characterization of Primary and Secondary Sources of Fine PM-Bound Water-Soluble Organic Carbon in Central Los Angeles. Atmos. Environ. 2025, 346, 121084. [Google Scholar] [CrossRef] [PubMed]
- Sonwani, S.; Saxena, P.; Shukla, A. Carbonaceous Aerosol Characterization and Their Relationship With Meteorological Parameters During Summer Monsoon and Winter Monsoon at an Industrial Region in Delhi, India. Earth Space Sci. 2021, 8, e2020EA001303. [Google Scholar] [CrossRef]
- Jeong, C.-H.; Wang, J.M.; Evans, G.J. Source Apportionment of Urban Particulate Matter Using Hourly Resolved Trace Metals, Organics, and Inorganic Aerosol Components. Atmos. Chem. Phys. Discuss. 2016, 1–32. [Google Scholar] [CrossRef]
- Ren, Z.; Gui, X.; Xu, X.; Zhao, L.; Qiu, H.; Cao, X. Microplastics in the Soil-Groundwater Environment: Aging, Migration, and Co-Transport of Contaminants – A Critical Review. J. Hazard. Mater. 2021, 419, 126455. [Google Scholar] [CrossRef] [PubMed]
- Amato, F.; Pandolfi, M.; Moreno, T.; Furger, M.; Pey, J.; Alastuey, A.; Bukowiecki, N.; Prevot, A.S.H.; Baltensperger, U.; Querol, X. Sources and Variability of Inhalable Road Dust Particles in Three European Cities. Atmos. Environ. 2011, 45, 6777–6787. [Google Scholar] [CrossRef]
- Harrison, R.M.; Jones, A.M.; Gietl, J.; Yin, J.; Green, D.C. Estimation of the Contributions of Brake Dust, Tire Wear, and Resuspension to Nonexhaust Traffic Particles Derived from Atmospheric Measurements. Environ. Sci. Technol. 2012, 46, 6523–6529. [Google Scholar] [CrossRef] [PubMed]
- Altuwayjiri, A.; Pirhadi, M.; Kalafy, M.; Alharbi, B.; Sioutas, C. Impact of Different Sources on the Oxidative Potential of Ambient Particulate Matter PM10 in Riyadh, Saudi Arabia: A Focus on Dust Emissions. Sci. Total Environ. 2022, 806, 150590. [Google Scholar] [CrossRef] [PubMed]
- Preston, C.A.; McKenna Neuman, C.L.; Aherne, J. Effects of Shape and Size on Microplastic Atmospheric Settling Velocity. Environ. Sci. Technol. 2023, 57, 11937–11947. [Google Scholar] [CrossRef] [PubMed]
- Andrady, A.L. Weathering and Fragmentation of Plastic Debris in the Ocean Environment. Mar. Pollut. Bull. 2022, 180, 113761. [Google Scholar] [CrossRef] [PubMed]
- Xiao, S.; Cui, Y.; Brahney, J.; Mahowald, N.M.; Li, Q. Long-Distance Atmospheric Transport of Microplastic Fibres Influenced by Their Shapes. Nat. Geosci. 2023, 16, 863–870. [Google Scholar] [CrossRef]
- Kotchenruther, R.A. Source Apportionment of PM2.5 at Multiple Northwest U.S. Sites: Assessing Regional Winter Wood Smoke Impacts from Residential Wood Combustion. Atmos. Environ. 2016, 142, 210–219. [Google Scholar] [CrossRef]
- Fazelvalipour, S.; Aghaei, Y.; Badami, M.M.; Aldekheel, M.; Tohidi, R.; Subramanian, G.; Verma, V.; Zhang, J.; Sioutas, C. Contributions of Tailpipe and Non-Tailpipe Emissions to the Oxidative Potential of Source-Resolved PM10 from Major LDV- and HDV-Dominated Freeways in Los Angeles. Atmos. Environ. 2026, 365, 121686. [Google Scholar] [CrossRef]
- Oroumiyeh, F.; Jerrett, M.; Del Rosario, I.; Lipsitt, J.; Liu, J.; Paulson, S.E.; Ritz, B.; Schauer, J.J.; Shafer, M.M.; Shen, J.; et al. Elemental Composition of Fine and Coarse Particles across the Greater Los Angeles Area: Spatial Variation and Contributing Sources. Environ. Pollut. 2022, 292, 118356. [Google Scholar] [CrossRef] [PubMed]
- Habre, R.; Girguis, M.; Urman, R.; Fruin, S.; Lurmann, F.; Shafer, M.; Gorski, P.; Franklin, M.; McConnell, R.; Avol, E.; et al. Contribution of Tailpipe and Non-Tailpipe Traffic Sources to Quasi-Ultrafine, Fine and Coarse Particulate Matter in Southern California. J. Air Waste Manag. Assoc. 2021, 71, 209–230. [Google Scholar] [CrossRef] [PubMed]
- Kau, D.; Materić, D.; Holzinger, R.; Baumann-Stanzer, K.; Schauer, G.; Kasper-Giebl, A. Fine Micro- and Nanoplastics Concentrations in Particulate Matter Samples from the High Alpine Site Sonnblick, Austria. Chemosphere 2024, 352, 141410. [Google Scholar] [CrossRef] [PubMed]
- Badami, M.M.; Tohidi, R.; Jalali Farahani, V.; Sioutas, C. Size-Segregated Source Identification of Water-Soluble and Water-Insoluble Metals and Trace Elements of Coarse and Fine PM in Central Los Angeles. Atmos. Environ. 2023, 310, 119984. [Google Scholar] [CrossRef] [PubMed]
- Yang, Q.; Liu, G.; Falandysz, J.; Yang, L.; Zhao, C.; Chen, C.; Sun, Y.; Zheng, M.; Jiang, G. Atmospheric Emissions of Particulate Matter-Bound Heavy Metals from Industrial Sources. Sci. Total Environ. 2024, 947, 174467. [Google Scholar] [CrossRef] [PubMed]
- Almeida, S.M.; Manousakas, M.; Diapouli, E.; Kertesz, Z.; Samek, L.; Hristova, E.; Šega, K.; Alvarez, R.P.; Belis, C.A.; Eleftheriadis, K. Ambient Particulate Matter Source Apportionment Using Receptor Modelling in European and Central Asia Urban Areas. Environ. Pollut. 2020, 266, 115199. [Google Scholar] [CrossRef] [PubMed]
- Song, F.; Gao, Y. Size Distributions of Trace Elements Associated with Ambient Particular Matter in the Affinity of a Major Highway in the New Jersey–New York Metropolitan Area. Atmos. Environ. 2011, 45, 6714–6723. [Google Scholar] [CrossRef]
- Kim, E.; Hopke, P.K. Source Apportionment of Fine Particles in Washington, DC, Utilizing Temperature-Resolved Carbon Fractions. J. Air Waste Manag. Assoc. 2004, 54, 773–785. [Google Scholar] [CrossRef] [PubMed]
- Su, B.; Wang, T.; Zhang, G.; Liang, Y.; Lv, C.; Hu, Y.; Li, L.; Zhou, Z.; Wang, X.; Bi, X. A Review of Atmospheric Aging of Sea Spray Aerosols: Potential Factors Affecting Chloride Depletion. Atmos. Environ. 2022, 290, 119365. [Google Scholar] [CrossRef]
- Pakbin, P.; Ning, Z.; Shafer, M.M.; Schauer, J.J.; Sioutas, C. Seasonal and Spatial Coarse Particle Elemental Concentrations in the Los Angeles Area. Aerosol Sci. Technol. 2011, 45, 949–963. [Google Scholar] [CrossRef]
- Shirmohammadi, F.; Hasheminassab, S.; Wang, D.; Saffari, A.; Schauer, J.J.; Shafer, M.M.; Delfino, R.J.; Sioutas, C. Oxidative Potential of Coarse Particulate Matter (PM10–2.5) and Its Relation to Water Solubility and Sources of Trace Elements and Metals in the Los Angeles Basin. Environ. Sci. Process. Impacts 2015, 17, 2110–2121. [Google Scholar] [CrossRef] [PubMed]
- Kumar, S.; Nath, S.; Bhatti, M.S.; Yadav, S. Chemical Characteristics of Fine and Coarse Particles during Wintertime over Two Urban Cities in North India. Aerosol Air Qual. Res. 2018, 18, 1573–1590. [Google Scholar] [CrossRef]
- Matawle, J.; Pervez, S.; Dewangan, S.; Tiwari, S.; Bisht, D.; Pervez, Y. PM2.5 Chemical Source Profiles of Emissions Resulting from Industrial and Domestic Burning Activities in India. 2014. [Google Scholar] [CrossRef]
- Hama, S.; Kumar, P.; Alam, M.S.; Rooney, D.J.; Bloss, W.J.; Shi, Z.; Harrison, R.M.; Crilley, L.R.; Khare, M.; Gupta, S.K. Chemical Source Profiles of Fine Particles for Five Different Sources in Delhi. Chemosphere 2021, 274. [Google Scholar] [CrossRef] [PubMed]
- Murari, V.; Singh, N.; Ranjan, R.; Singh, R.S.; Banerjee, T. Source Apportionment and Health Risk Assessment of Airborne Particulates over Central Indo-Gangetic Plain. Chemosphere 2020, 257, 127145. [Google Scholar] [CrossRef] [PubMed]
- Munier, B.; Bendell, L.I. Macro and Micro Plastics Sorb and Desorb Metals and Act as a Point Source of Trace Metals to Coastal Ecosystems. PLoS ONE 2018, 13, e0191759. [Google Scholar] [CrossRef] [PubMed]
Figure 1.
Biweekly PM10 concentrations measured using PCIS samplers at the USC PIU site for (a) cool-season and (b) warm-season campaigns.
Figure 1.
Biweekly PM10 concentrations measured using PCIS samplers at the USC PIU site for (a) cool-season and (b) warm-season campaigns.
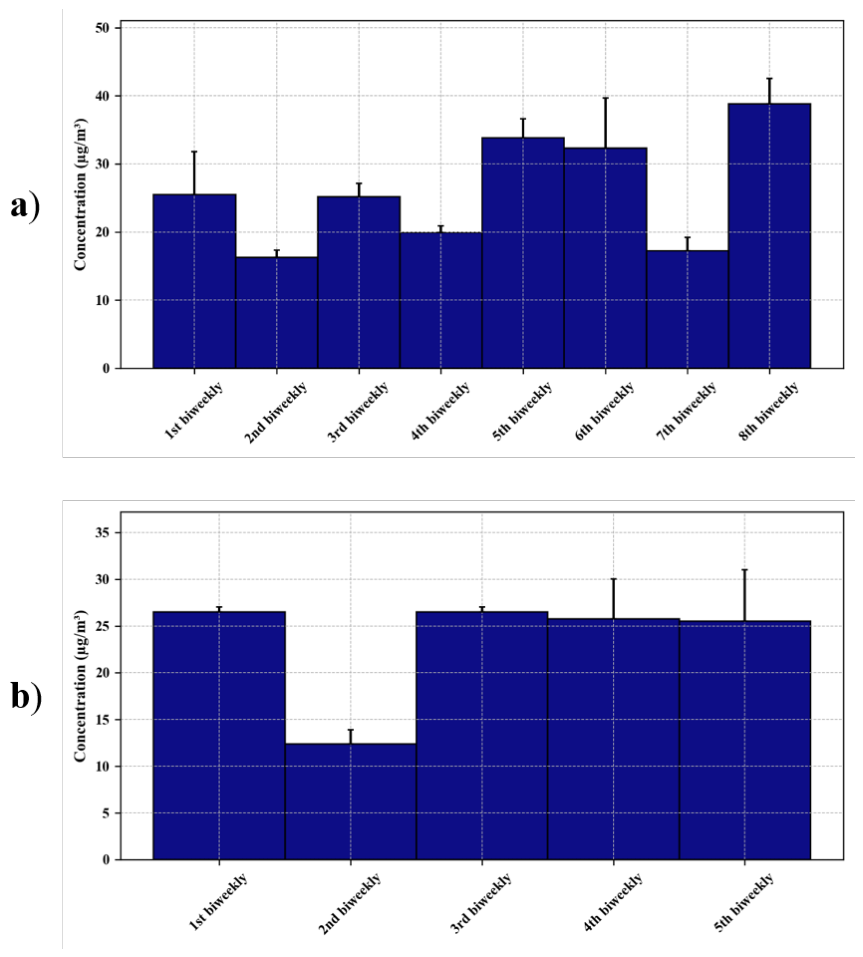
Figure 2.
Number concentrations of airborne MPs by morphological type (fibers, fragments, transparent spheres) across biweekly PM10 samples collected during (a) cool and (b) warm-season campaigns.
Figure 2.
Number concentrations of airborne MPs by morphological type (fibers, fragments, transparent spheres) across biweekly PM10 samples collected during (a) cool and (b) warm-season campaigns.
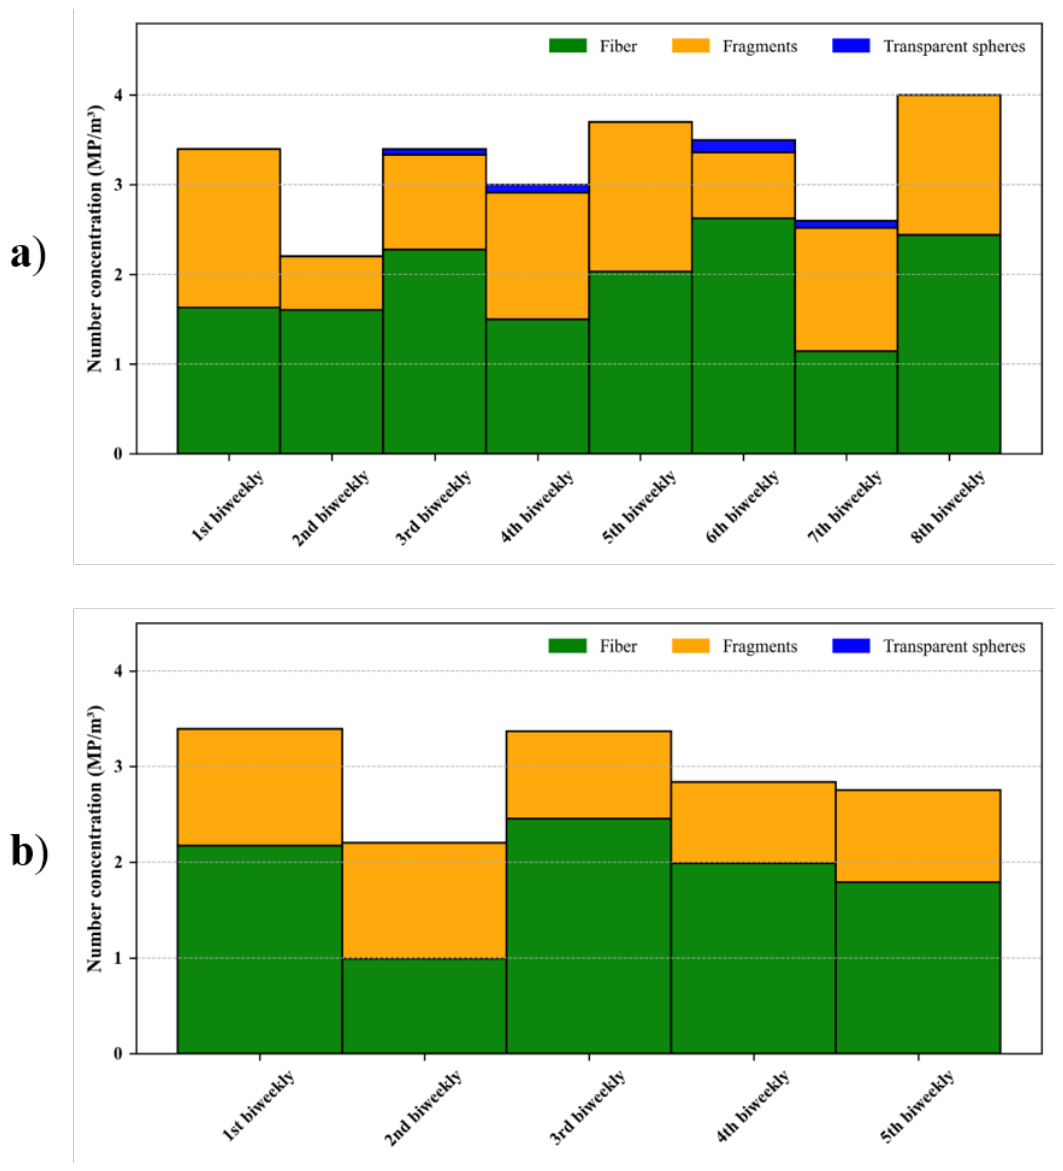
Figure 3.
EC and OC concentrations (µg/m3) measured across biweekly samples during (a) cool and (b) warm-season campaigns.
Figure 3.
EC and OC concentrations (µg/m3) measured across biweekly samples during (a) cool and (b) warm-season campaigns.
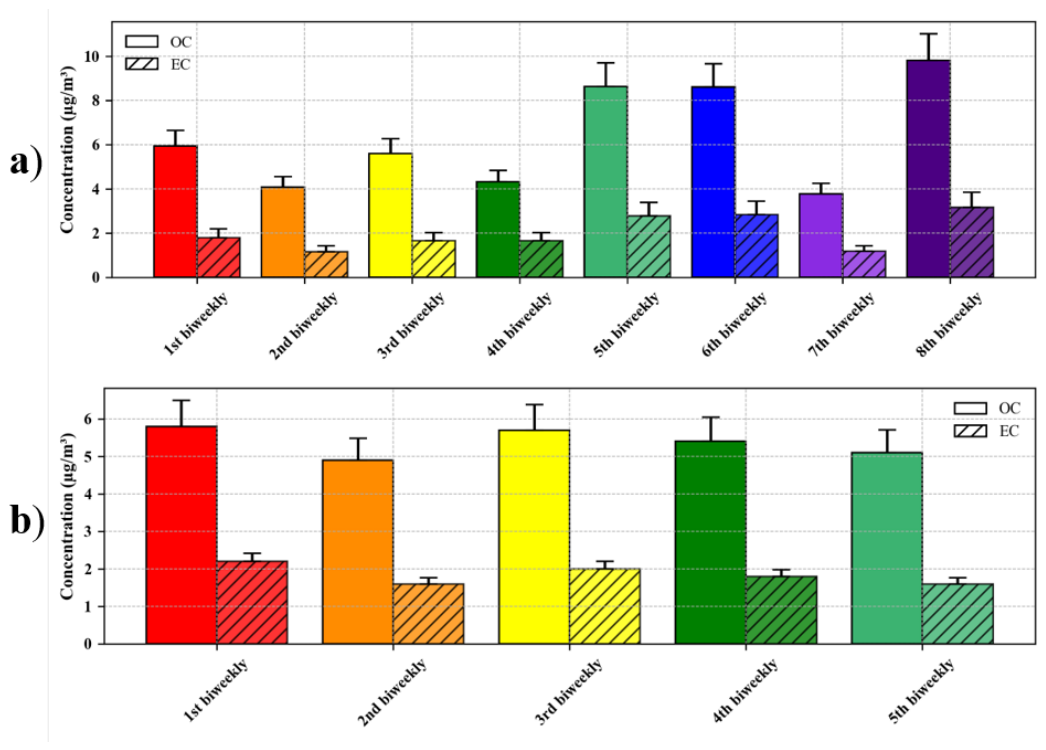
Figure 4.
Trace elemental concentrations (ng/m3) across (a) cool and (b) warm-season campaigns.
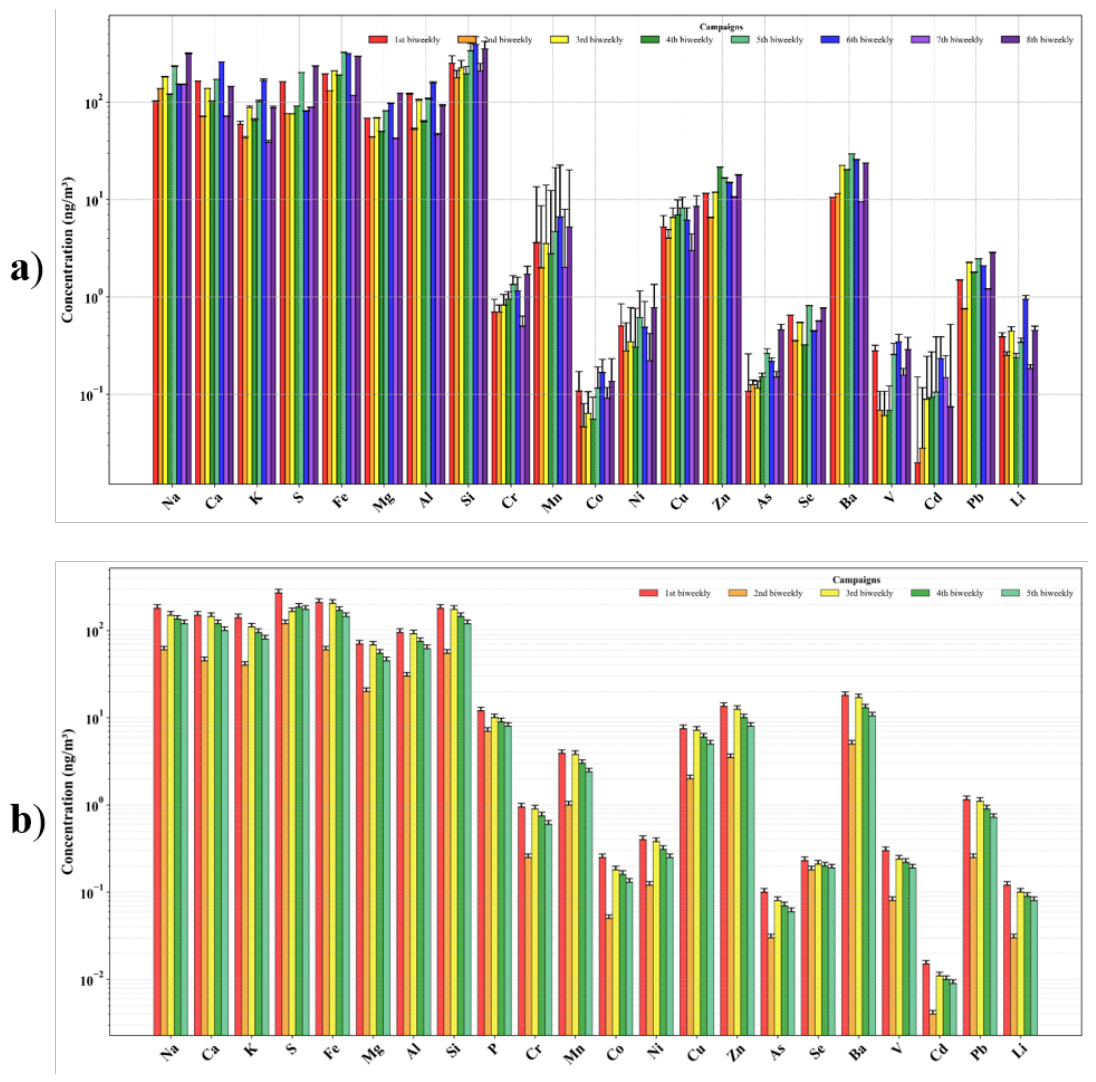
Figure 5.
Normalized count (%) of MP particles across 26 size bins (5-1300 µm), grouped by biweekly sampling period during (a) cool and (b) warm-season campaigns.
Figure 5.
Normalized count (%) of MP particles across 26 size bins (5-1300 µm), grouped by biweekly sampling period during (a) cool and (b) warm-season campaigns.
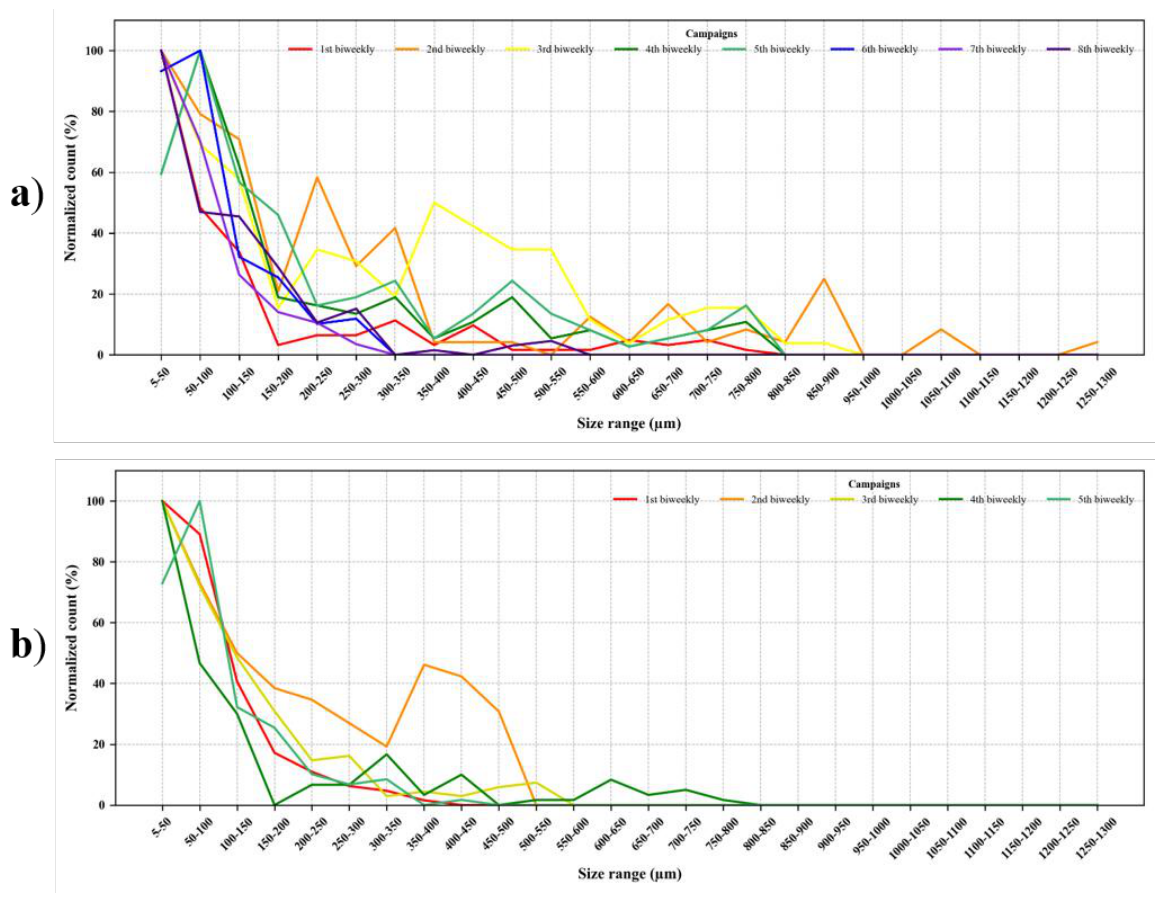
Figure 6.
Average normalized size distributions (%) for samples where maximum microplastic counts occurred in the 5-50 µm (orange) and 50-100 µm (blue) size ranges during (a) cool and (b) warm-season campaigns.
Figure 6.
Average normalized size distributions (%) for samples where maximum microplastic counts occurred in the 5-50 µm (orange) and 50-100 µm (blue) size ranges during (a) cool and (b) warm-season campaigns.
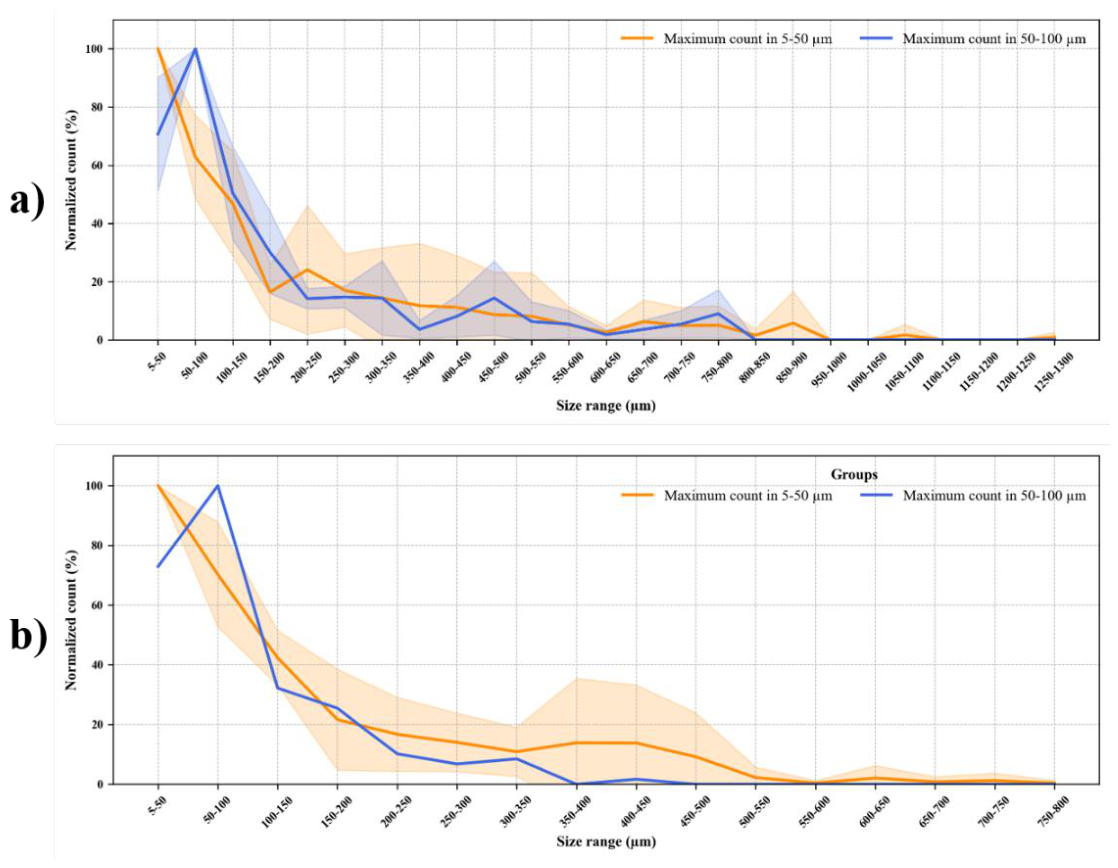
Figure 7.
Biweekly average relative humidity, temperature, and wind speed variations during (a) cool and (b) warm-season campaigns.
Figure 7.
Biweekly average relative humidity, temperature, and wind speed variations during (a) cool and (b) warm-season campaigns.
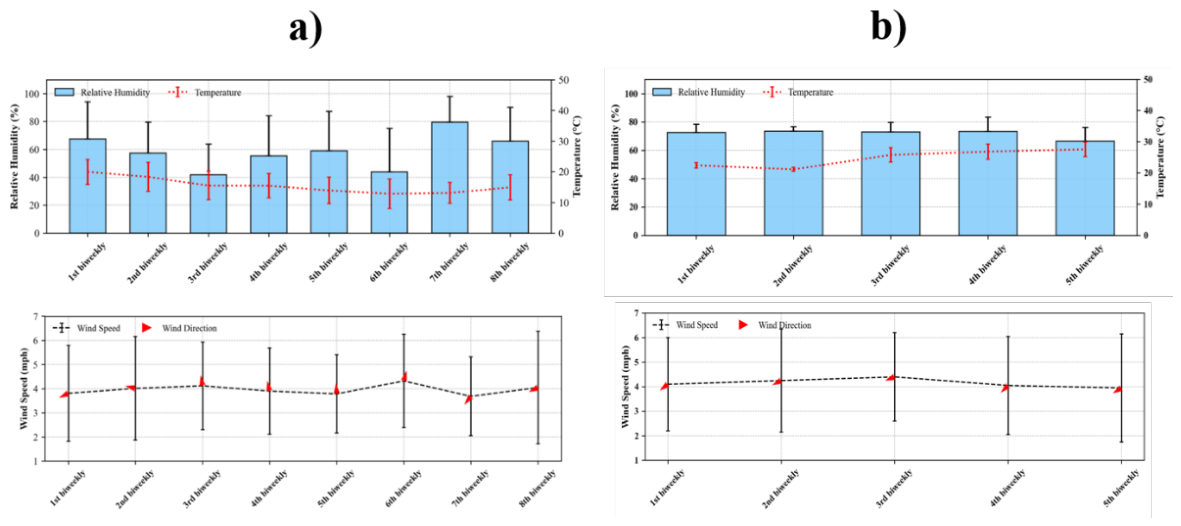

Table 1.
Spearman Correlation between chemical species and total MP concentrations, as well as morphological category concentrations (fibers, fragments, transparent spheres) during both campaigns, across all 13 biweekly sampling periods. Significant correlations are denoted by * for p ≤ 0.05 and ** for p ≤ 0.01.
Table 1.
Spearman Correlation between chemical species and total MP concentrations, as well as morphological category concentrations (fibers, fragments, transparent spheres) during both campaigns, across all 13 biweekly sampling periods. Significant correlations are denoted by * for p ≤ 0.05 and ** for p ≤ 0.01.
| Species | Total MP | Fiber | Fragment | Transparent sphere |
|---|---|---|---|---|
| Al | 0.87** | 0.72** | 0.23 | 0.13 |
| Ba | 0.79** | 0.73** | 0.07 | 0.26 |
| Ca | 0.90** | 0.74** | 0.29 | 0.07 |
| Cd | 0.44 | 0.20 | 0.21 | 0.73** |
| Cr | 0.85** | 0.74** | 0.24 | 0.11 |
| Cu | 0.80** | 0.70* | 0.34 | -0.07 |
| EC | 0.91** | 0.80** | 0.28 | -0.06 |
| Fe | 0.94** | 0.82** | 0.24 | 0.09 |
| Li | 0.72** | 0.48 | 0.21 | 0.42 |
| Mg | 0.95** | 0.84** | 0.24 | 0.04 |
| Mn | 0.93** | 0.86** | 0.21 | 0.07 |
| Na | 0.65* | 0.67* | 0.10 | 0.09 |
| Ni | 0.93** | 0.71** | 0.39 | -0.13 |
| OC | 0.92** | 0.75** | 0.33 | -0.21 |
| Pb | 0.87** | 0.49 | 0.51 | 0.39 |
| S | 0.34 | 0.23 | 0.39 | -0.63 |
| Si | 0.81** | 0.47 | 0.41 | 0.43 |
Disclaimer/Publisher’s Note: The statements, opinions and data contained in all publications are solely those of the individual author(s) and contributor(s) and not of MDPI and/or the editor(s). MDPI and/or the editor(s) disclaim responsibility for any injury to people or property resulting from any ideas, methods, instructions or products referred to in the content. |
© 2026 by the authors. Licensee MDPI, Basel, Switzerland. This article is an open access article distributed under the terms and conditions of the Creative Commons Attribution (CC BY) license (http://creativecommons.org/licenses/by/4.0/).
Copyright: This open access article is published under a Creative Commons CC BY 4.0 license, which permit the free download, distribution, and reuse, provided that the author and preprint are cited in any reuse.