

Submitted:
06 October 2026
Posted:
08 October 2026
You are already at the latest version
Abstract
E-commerce expands farmers’ access to customers, but its financial value depends on the costs of securing and fulfilling sales. Drawing on the resource-based view and transaction cost economics, this study examines how marketing expenditure, video use, and platform choice relate to online revenue and return on sales (ROS). Telephone interviews covered 186 farms: 74 in Ukraine and 112 in China, including 175 certified producers and 11 uncertified comparison farms. Welch’s t-tests, country-specific ordinary least squares regressions with HC3 standard errors, and moderation analysis identify contrasting financial profiles. Mean monthly online revenue is higher in China (USD 12,878.30 versus USD 4,237.30), whereas mean ROS is higher in Ukraine (30.85% versus 17.72%). The ROS difference is 13.13 percentage points (95% confidence interval: 11.43–14.83). Ukraine’s positive marketing coefficient is specification-sensitive and becomes negative in the log model; China’s marketing association is not statistically significant. Video moderation and within-country platform differences in ROS are not supported at the 5% level. Instagram and WeChat cases illustrate personalised communication and integrated purchasing. The findings support separate assessment of sales scale and margin retention, full channel-cost accounting, and controlled trials of marketing practices. Panel data are needed to investigate the mechanisms underlying these associations.
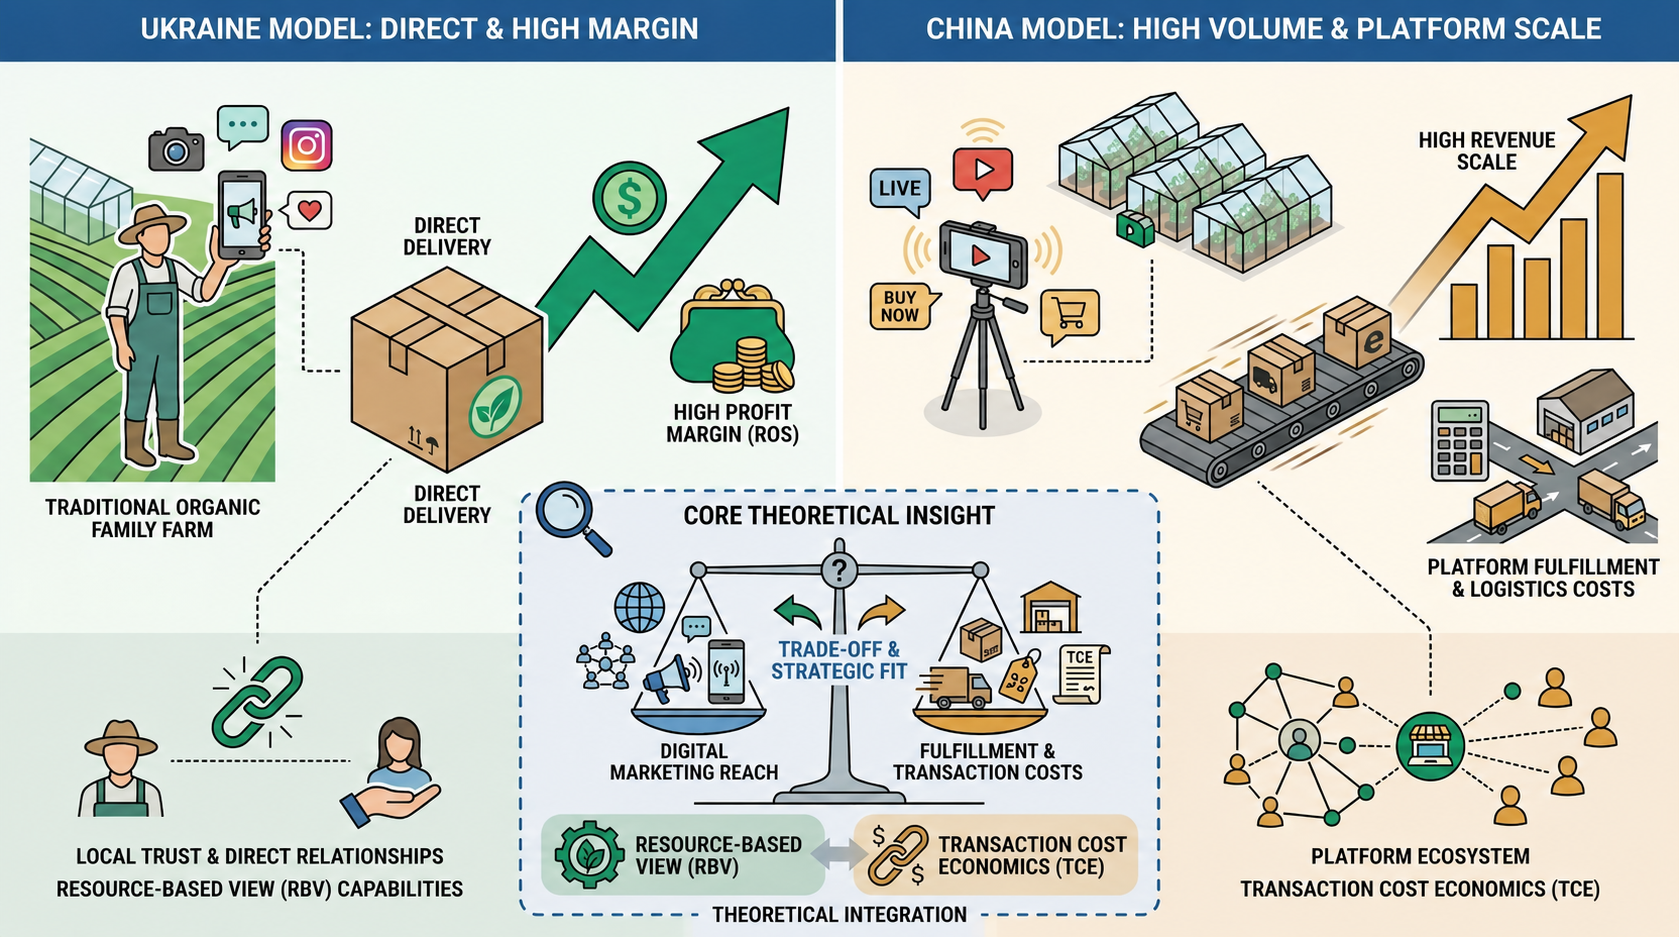
Keywords:
digital capability
; resource-based view
; transaction costs
; marketing expenditure
; video market-ing
; profitability
; moderation
; channel management
1. Introduction
Digital selling redistributes commercial work along agri-food supply chains. Producers can reach customers and negotiate orders themselves, while assuming responsibility for promotion and sales support. The constraints faced by short food supply chains are closely connected to the organization of successive operational tasks [1]. Their considerable diversity makes a single model of direct exchange an inadequate basis for evaluating performance [2]. Digital platforms add value when their functions align with the farm’s needs rather than merely expanding its technological options [3]. The economic question is therefore one of commercial organization: who performs each function, which resources are committed, and how the resulting value is distributed.
Direct contact with final consumers can retain part of the intermediary’s margin within the producer–customer relationship, but it also transfers the intermediary’s work to the farm. The often under-recognized labor contribution of local producers is central to this trade-off [4]. Digital marketing performance similarly depends on strategy and organizational capabilities, rather than expenditure alone [5], while the choice of agricultural marketing arrangements reflects asset specificity and the conditions of exchange [6]. The resource-based view (RBV) and transaction cost economics (TCE) offer complementary explanations: RBV addresses the firm’s ability to organize sales, and TCE addresses the relative costs of performing particular functions internally or delegating them.
Organic products add an information problem to these commercial tasks. Buyers rely on provenance and certification because product appearance does not reveal production practices. Verifying such credence attributes involves several supply chain participants and mechanisms to address information asymmetry [7]. Evidence on the joint use of product certification and e-commerce shifts the focus from quality assurance to farm-level economic outcomes [8]. Certification provides a basis for differentiating an offer, while a digital channel communicates that differentiation to the customer. Financial performance depends on how effectively the two are combined.
The presentation of the product also matters. Consumer responses to information about organic food depend on trust [9], whereas producers evaluate digital tools in relation to their own commercial needs [3]. This creates a potential complementarity between marketing, finance, and communication: expenditure secures access to an audience, but the content of the offer shapes the customer’s response. The relevant farm-level question is whether a given marketing budget is associated with greater online revenue when video is used to present the product.
Comparing Ukraine and China places this question in contrasting production and marketing environments. Maintaining access to customers during wartime is particularly important in Ukraine. Research on disruptions to production and trade establishes the wider economic context [10], while work on marketing in the bioeconomy [11] and the local identity of artisanal foods [12] highlights two related priorities: sustaining sales and differentiating the farm’s offer. Artisanal positioning concerns the brand’s identity; certification concerns the product’s production status. These can coexist within the same business model.
Chinese literature places greater emphasis on the organization of market access. Cooperative membership is associated with participation in e-commerce [13], and rural online trading is examined in terms of market integration and household income [14]. Studies of rural livestreaming add the acquisition of commercial skills and dependence on platforms to this account [15], as well as knowledge sharing within agricultural clusters [16]. Small landholdings can thus coexist with access to commercial resources beyond the individual farm. This provides a useful starting point for comparison: the capacity to sell digitally develops both within the business and through its organizational relationships.
The present study covers 186 farms, including 74 in Ukraine and 112 in China. Ukrainian landholdings range from 8 to 2,800 ha, with a median of 31.5 ha; Chinese holdings range from 0.3 to 20 ha, with a median of 0.8 ha. Owners are aged 32–45 and 35–66 years, respectively. All Ukrainian farms and 101 Chinese farms report certification; the remaining 11 Chinese observations form an uncertified comparison group. The main platforms are Instagram, Viber/Telegram, TikTok, and Prom.ua in Ukraine, and Taobao Live, WeChat, and Pinduoduo in China. All participants already sell online, so the analysis concerns the organization and performance of existing digital sales rather than initial adoption.
The objective is to establish how marketing expenditure, video use, and the main platform are associated with online revenue and profitability. Combining RBV and TCE connects the resources committed to selling with the allocation of exchange costs. The contribution is an economic assessment of digital practices in two contrasting farm samples. Environmental outcomes require a separate set of measures [17]. Local markets provide the study’s substantive context, while the econometric analysis focuses on producers’ financial outcomes.
2. Literature Review and Hypotheses Development
2.1. Digital Capability, Resource Complementarity, and Coordination
Access to a digital channel and the ability to earn a return from it are distinct. A platform may be available to many sellers, but each brings a different assortment, customer-service experience, and order-fulfilment capacity. RBV explains this heterogeneity through the combination of technology and organisational capabilities [5]. What matters is the suitability of digital functions for the commercial task. A tool that broadens reach may also complicate the coordination of small consignments or demand skills the producer has yet to acquire. Its expected value consequently depends on its fit with established farm practices [3]. Finance enables access; the organization of use determines how productive that access becomes.
Digital capability develops through combinations of resources rather than within a single application. Multidimensional measures used in agricultural marketing research capture a wider range of practices than online presence alone; even direct selling may encompass both electronic transactions and physical markets [18]. Configurational studies of digital transformation and research on value creation in farmers’ markets place similar emphasis on organizational conditions and resource complementarity [19,20]. Land, customer knowledge, and communication practices do not operate independently. An additional opportunity to present a product becomes commercially useful when the farm can deliver the promised quality and fulfill the resulting order. The coordination of these activities distinguishes capability from a collection of technical tools.
Resource productivity also depends on the organization of exchange. Customer search, negotiation, monitoring, and the protection of specialized investments are central concerns of TCE. Cooperative marketing can distribute these functions among participants, and its association with access to e-commerce makes institutional coordination relevant to digital selling [6,13]. Market access helps explain the attraction of participation, but the financial benefit to an individual farm also depends on the price of that access. An intermediary’s service should be assessed against the work it replaces. Performing the same tasks internally requires resources of its own.
For organic products, establishing a shared understanding of quality can be particularly demanding. Buyers assess both the product and the credibility of information about its production. Exchange, therefore, relies on verification mechanisms involving producers, retailers, and certification bodies [7]. Price barriers intertwine with information barriers: acceptance of a more expensive offer depends on whether its distinctive attributes are intelligible and credible. The literature on organic consumption in China, synthesized from studies conducted between 2011 and 2021, reflects this interdependence [21]. Digital channels provide alternative ways to address it by placing certification information, provenance, and access to the seller alongside the product. Transaction costs may fall when this arrangement makes relevant answers easier to obtain and agreements easier to reach.
The boundary between work performed by the farm and services supplied by a platform is shaped by both resource capacity and coordination costs. Managing an offer internally preserves control over its content while assigning the producer responsibility for sales support. Delegation changes both workload and payment obligations. This distinction separates the capacity to expand sales from the capacity to retain profit. Revenue records the scale of demand served, whereas return on sales (ROS) expresses the profit remaining after the costs of serving it.
2.2. Marketing Expenditure and the Scale of Online Revenue
Marketing expenditure purchases access to customer attention. Its relationship with revenue runs through exposure to the offer, visits to the digital channel, and the eventual purchase, with different conditions affecting each stage. Agri-food web analytics treats traffic composition and acquisition expenditure as distinct elements of marketing activity [22]. Revenue can also change without an equivalent change in customer numbers: access to digital markets is associated with selling prices and the timing of transactions, as shown in research on apple producers [23]. Sales expansion, therefore, has both quantity and price dimensions. Identical promotional budgets may support product flows that differ substantially in volume and value.
Accumulated reputation lies between current spending and customer response. Price differentiation in the organic segment is linked to certification, advertising support, production costs, and consumers’ evaluations of the brand. The classification of premiums for nine green brands, drawing on assessments by 250 buyers, illustrates the multiple factors involved [24]. Loyalty, calculated from satisfaction and the importance of product attributes, reflects an evaluation of the offer; a repeat order is a realized behavior. The object of trust matters as well. Information about an organic product is interpreted through trust in its source, and confidence in the producer and retailer may reinforce or weaken one another [9,25]. A monthly budget thus captures current communication expenditure, while the return on that expenditure also reflects relationships developed over time.
Expenditure and performance can influence each other. Promotion helps attract demand, but existing turnover also provides the funds for the next campaign. Comparisons across farms are subject to self-selection because resources and commercial opportunities differ before a particular tool is used. Instrumental-variable approaches to market integration and endogenous switching models of joint certification and e-commerce choices address this problem explicitly [8,14]. When budgets and revenue are observed simultaneously, a regression coefficient describes their conditional association across farms. Its interpretation depends on the resource differences included in the model as well as on its sign.
A positive association remains a reasonable theoretical expectation: promotional finance expands opportunities to present the offer and maintain contact with prospective buyers. Assessing that expectation requires controls on available landholding characteristics, owner age, video use, and the main platform, together with certification where status varies. The relevant outcome is current monthly online revenue, evaluated separately within each country.
H1. Controlling for observed farm characteristics and the main platform, higher monthly digital marketing expenditure is positively associated with current online revenue. This association is tested separately for Ukraine and China.
2.3. Video Content as a Complementary Marketing Practice
Audience reach acquires commercial value when customers find a reason to choose the offer. In social commerce, that reason is shaped by the information environment, presentation, and interaction with the seller as well as by price and product identity [26,27]. Video extends the scope of presentation through visual demonstration; live broadcasts also allow audience questions to become part of the presentation itself. Associations between livestreaming system characteristics and intentions to purchase agricultural products underscore the importance of this interactive component [28]. Interest must nevertheless be followed by agreement on price, availability, and fulfillment. Communication operates within the trading process rather than replacing it.
What the message emphasizes is equally consequential. An information experiment involving 1,019 respondents identified a difference in willingness to make environmentally motivated purchases between health-focused and environment-focused messages, while the control and environmental groups did not differ significantly [29]. Persuasiveness, therefore, depends on the particular emphasis and comparison. Trust and the mixed reception of digitalized short supply chains help explain why a more convenient or visually engaging format can have different value for different buyers [9,30]. A provenance demonstration, a consultation, and a promotional offer may all use video, but each serves a different commercial purpose. Richer information is useful when it helps the buyer assess the offer.
Potential complementarity between expenditure and video follows from this distinction between attracting attention and converting contact into an order. Finance brings the offer to an audience; communication practices shape how that contact is handled. Their combination requires skills. Presentation, customer responses, and sales coordination develop through learning and knowledge exchange, while dependence on the platform can increase alongside commercial opportunity [15,16]. The costs of acquiring and applying these skills remain part of the channel’s economics. Models of agricultural livestreaming link profitability to the terms of interaction among participants, thereby distinguishing sales expansion and margin improvement as distinct outcomes [31].
Complementarity implies more than higher average revenue among video users: it implies a stronger association between revenue and marketing expenditure. Econometrically, this is a difference in elasticities, represented by the interaction ln(Marketing_USD) × Video_Stream in a model of ln(Sales_USD), with both main effects included. Variation in video use within Instagram and Taobao Live provides a basis for this comparison. Because Video_Stream covers both live and recorded material, the hypothesis concerns video use broadly. A positive interaction coefficient corresponds to a higher marketing–revenue elasticity among farms that use video.
H2. Video use positively moderates the association between marketing expenditure and current online revenue: holding other characteristics constant, the corresponding elasticity is higher for farms with Video_Stream = 1 than for farms with Video_Stream = 0.
2.4. Platform Differences in Profitability and the Allocation of Transaction Costs
Expanding digital demand raises the question of how much commercial work the producer will perform internally. Reducing intermediation in direct selling leaves more tasks on the farm: negotiation, small-order assembly, and customer relationship maintenance all require time and organizational effort [4]. The diversity of short supply chains reflects different allocations of this workload, while their resilience depends on coordination across successive stages [2,32]. The absence of a separate payment to an intermediary does not remove the cost of the intermediary’s functions. What matters is whether the retained trading margin exceeds the cost of the work taken on.
A platform offers a different allocation of responsibility. The producer delegates part of the coordination to a specialized participant and accepts its charges and rules. This can be financially worthwhile even with a lower profit share if access to buyers and the cost of serving them remain favorable. In models of agricultural video commerce, this balance depends on seller–platform arrangements and incentives for quality control involving logistics providers [31,33]. Intermediation is therefore a choice about how to perform commercial functions, rather than a contrast between an unnecessary commission and a costless direct relationship. Research on cooperative organization similarly distinguishes the decision to participate from its financial consequences [6].
In organic production, these costs interact with opportunities for price differentiation. The economic performance associated with joint certification and e-commerce use varies by scale and production type, while the benefits of digital access can appear separately in selling prices and transaction timing [8,23]. Quality assurance adds further work: credible information must be prepared and communicated to the buyer, and the associated tasks are distributed across the exchange relationship [7]. A higher price creates scope for greater profit, but the retained share depends on production and marketing costs. ROS provides a common financial measure of these potentially offsetting changes.
Comparing profitability requires separating the platform from the environment in which it operates. The Ukrainian and Chinese platform sets do not overlap in this sample. A direct comparison of Instagram and Taobao Live would consequently need to account for platform differences, production structures, and country-specific conditions. Within-country analysis addresses a more focused question: do ROS differences between platform groups persist after controlling for farm characteristics and video use? The platform identifies the principal digital channel, whereas direct-to-consumer (D2C) selling is defined by the transaction itself. Both internal coordination and specialized intermediation can generate advantages, leaving the direction of profitability differences open.
H3. Controlling for observed resource and demographic characteristics and video use, mean online ROS differs between farms using different main digital platforms within the same country.
2.5. Economic Logic of the Empirical Model
Digital sales performance emerges from the relationship between demand acquisition and the cost of serving that demand. Marketing expenditure finances the presentation of the offer, video changes the mode of communication, and the platform provides the setting for the transaction. Resource complementarity explains how combining these elements may expand revenue; the allocation of transaction functions explains why margins may follow a different path. H1 and H2 therefore address sales scale and the revenue association of marketing resources, while H3 concerns the share retained by the farm.
The empirical framework comprises eight substantive variables—Age, Area_ha, Sales_USD, Marketing_USD, ROS_%, Certificate, Platform, and Video_Stream—alongside ID and Country. Land area represents the physical resource base; owner age and certification capture demographic and production-status differences. Country defines the comparison setting. Revenue and ROS cover the farm’s overall online activity, while grouping by the main platform identifies its principal channel orientation. The precision of comparisons depends on group size, particularly for Prom.ua, which is represented by two Ukrainian farms. The platform hypothesis is therefore assessed through the joint test of platform coefficients.
RBV and TCE connect these observations through the economics of commercial decision-making: acquiring resources is valuable when their deployment yields an acceptable financial return after order fulfillment. The regressions estimate conditional relationships among the observed measures, preserving the distinction between current revenue and reported profitability. Direct measurement of transaction costs would extend the analysis from these outcomes to the underlying mechanism. As sales expand, so do the producers’ obligations to customers. Managing that relationship is central to the economic value of digital selling.
3. Materials and Methods
3.1. Data Collection and Sample Profile
A cross-sectional telephone survey covered 186 farms engaged in online selling: 74 in Ukraine and 112 in China. Respondents were contacted through publicly available telephone numbers. Ukrainian co-authors conducted the interviews in Ukraine, while Chinese co-authors conducted the interviews in China. The farm is the unit of observation, and the outcomes are average monthly online revenue and reported return on sales. The analytical dataset contains ten fields: ID, Country, Age, Area_ha, Sales_USD, Marketing_USD, ROS_%, Certificate, Platform, and Video_Stream. All identifiers are unique and all fields are complete. The corrected dataset supplied by the authors was analyzed without imputation, winsorization, or further alteration of the observations.
All 74 Ukrainian farms and 101 Chinese farms report certification. These 175 producers form the certified subsample; the 11 Chinese farms without certification are retained as an uncertified comparison group. Primary estimates use the full sample, with additional analyses restricted to certified farms. Landholdings range from 8 to 2,800 ha in Ukraine (median 31.5 ha) and from 0.3 to 20 ha in China (median 0.8 ha). Owners’ ages range from 32 to 45 and from 35 to 66 years, respectively. The Ukrainian platforms are Instagram, Viber/Telegram, TikTok, and Prom.ua; the Chinese platforms are Taobao Live, WeChat, and Pinduoduo. Differences in landholding structure and the non-overlapping platform sets motivate separate country models.
Sales_USD measures average monthly gross online revenue, R; Marketing_USD measures monthly digital marketing expenditure, M; Area_ha records landholding area, A; and Age records the owner’s age. ROS is the respondent-reported percentage of revenue remaining as profit after production, logistics, and marketing costs. Certificate equals 1 for farms reporting certification and 0 otherwise. Video Stream similarly records video use, including both live broadcasts and recorded material. Platform identifies the main channel, whereas revenue and ROS encompass the farm’s entire online activity. Monetary variables are expressed in US dollars as supplied in the dataset; no further currency conversion was applied.
The contact-based sample comprises active online sellers with completed telephone interviews. Statistical inference assumes independence across farms; cooperative identifiers were unavailable for modeling within-cooperative dependence. The commercial organization of the channels is examined through two illustrative business cases: INBERRI’s Instagram profile and a video-based product offer on WeChat. Author-supplied screenshots support the comparison of positioning, assortment navigation, seller contact, and ordering.
3.2. Econometric Strategy
The analysis distinguishes sales scale, the association of marketing resources with revenue, and profitability across channel orientations. Before estimating the models, revenue, marketing expenditure, and ROS were checked for internal financial consistency. For the same accounting period and sales coverage, total costs implied by ROS must be at least as large as marketing expenditure. The implied balance of other costs must therefore satisfy:
Observations with a negative balance of other costs were flagged for sensitivity analysis. Full-sample estimates were compared with estimates excluding those records. Quantitative distributions were summarised using means, sample standard deviations, medians, and ranges. Between-country differences in age, area, revenue, ROS, and marketing expenditure were tested using two-sided Welch’s t-tests for independent samples. Mean differences were calculated as Ukraine minus China, with 95% confidence intervals (CIs). Holm adjustment was applied across the five comparisons. The significance level was set at 0.05.
H1 was assessed using country-specific multiple linear regressions estimated by ordinary least squares (OLS). The level specification preserves the monetary interpretation of coefficients and includes land area, owner age, video use, certification, and the main platform:
Here, V denotes Video_Stream, C denotes Certificate, and Pₖ denotes platform indicators. The coefficient β₁ represents the difference in online revenue associated with a USD 1 increase in marketing expenditure, holding the other included predictors constant; β₂ represents the corresponding difference per hectare. Instagram and WeChat are the reference platforms for Ukraine and China, respectively. The certificate is omitted from the Ukrainian model because it is constant across all 74 farms. The design matrices have full column rank. Heteroskedasticity-consistent HC3 standard errors were used, with t-tests and CIs based on residual degrees of freedom. Tables report unstandardized coefficients, B. The predictor set was retained irrespective of individual coefficient significance.
For H2, the log-revenue model includes an interaction between marketing expenditure and video use. The natural logarithm of Marketing_USD was centered on its mean within each country:
Revenue, expenditure, and area are strictly positive, allowing the use of natural logarithms without added constants. The model includes the interaction together with both main effects and the control variables:
The parameter θ measures the difference in marketing–revenue elasticities between video users and non-users. For V = 0, the elasticity is β₁; for V = 1, it is β₁ + θ. The standard error of the latter was calculated from the coefficient variances and covariance. H2 was assessed using the interaction’s sign, p-value, and 95% CI. For H3, ROS replaces revenue as the dependent variable in Equation (2), retaining the same controls. Platform indicators were assessed jointly using an HC3-robust Wald test reported in F form. Pairwise contrasts were Holm-adjusted across all six platform pairs in Ukraine and all three pairs in China. The joint test determined the assessment of H3.
Diagnostics examined the marketing–area correlation, variance inflation factors (VIFs), and observation leverage. H1 was additionally assessed in a log specification and in a level, model excluding land area. Sensitivity analyses were conducted for certified farms only, after excluding financially inconsistent records, after omitting the two Ukrainian Prom.ua observations, and after omitting the Chinese farm with 20 ha. Individual regression tests are two-sided and unadjusted. Marketing intensity is total expenditure divided by total online revenue within each country. A common revenue base of USD 1,000 illustrates the monetary meaning of mean ROS. Computations were performed in Python 3.13.5 using NumPy 2.3.5, SciPy 1.17.0, and statsmodels 0.14.6. Full coefficient tables, simple slopes, and sensitivity results are included in the accompanying reproducibility package.
4. Results
4.1. Descriptive Statistics and the ROS Gap
The two samples exhibit contrasting financial profiles: Chinese farms have higher online revenue and marketing expenditure, whereas Ukrainian farms maintain a larger reported profit share relative to smaller turnover. The comparison also involves different landholding structures and owner ages. All five between-country differences remain significant after Holm adjustment (p < 0.001). Table 1 provides the descriptive baseline for these resource and financial contrasts.
The Ukrainian median of 31.5 ha conceals considerable dispersion: relatively small farms coexist with much larger producers, raising the mean above the median. Chinese holdings are concentrated at a much smaller scale, with a median of 0.8 ha. Yet the mean Chinese online revenue is 3.04 times the Ukrainian value, and the mean marketing expenditure is 4.26 times as large. Landholding size and digital sales scale, therefore, capture different aspects of the business. Market access and the organization of selling merit attention alongside the production base.
The principal profitability result is a 13.13-percentage-point ROS gap in favor of the Ukrainian group (95% CI: 11.43–14.83; p < 0.001). On a common USD 1,000 revenue base, the unrounded mean ratios correspond to USD 308.51 and USD 177.23 of reported profit, respectively: a difference of USD 131.28. This standardized comparison expresses margin retention on a per-turnover basis. Farms scaling their digital operations must manage the value of incoming orders and the share retained after fulfillment together.
Marketing expenditure accounts for 6.69% of aggregate Ukrainian online revenue and 9.39% of Chinese online revenue. The mean Chinese budget of USD 1,209.64 accompanies higher turnover but also requires a larger share of revenue to finance promotion. This measured cost contrast is consistent with different demands on the sales organization. Direct negotiation keeps more tasks on-farm, whereas platform-based selling combines access to organized demand with investment in visibility and service provision. Separating promotional expenditure, commissions, logistics, and the producer’s own labor would establish the full cost of each arrangement.
The ROS difference is stable across the accounting and certification checks. Three Chinese records have a negative implied balance of other costs under Equation (1). Excluding these observations yields a difference of 13.15 percentage points (95% CI: 11.44–14.87); restricting the analysis to the 175 certified producers yields 13.09 percentage points (95% CI: 11.36–14.82). Both comparisons remain significant at p < 0.001. The country-level profitability pattern is therefore not driven by the three flagged accounts or by the uncertified comparison group.
Video use is reported by 48.65% of Ukrainian farms and 35.71% of Chinese farms. It is concentrated on Instagram in Ukraine and on Taobao Live and WeChat in China. The presence of both users and non-users within these channels permits assessment of the expenditure–video interaction while accounting for the main platform.
4.2. Regression Results
The financial contrast between countries is clearer than the explanatory pattern within each country. Both level models yield positive marketing coefficients, but only the Ukrainian estimate is statistically significant. The regressions retain the same economic controls: land area, owner age, video use, and the main platform, with certification additionally estimated in China (Table 2 and Table 3).
In the Ukrainian level model, USD 1 higher marketing expenditure is associated with USD 57.786 higher online revenue, holding the other included predictors constant (p = 0.0016). The result changes sharply with specification. Excluding area reduces the coefficient to USD 1.739 (p = 0.615), while the log model produces a negative marketing elasticity of −2.068 (p = 0.0187). Expenditure and land area are almost linearly related (r = 0.990; VIFs of 61.59 and 56.33). The positive budget coefficient consequently sits alongside a negative area coefficient in a model with little independent variation in resources to separate them. H1 receives support in the primary Ukrainian-level specification, but the positive association is not robust across alternative models.
The Chinese coefficient is USD 1.190 of revenue per USD 1 of marketing expenditure (p = 0.224; 95% CI: −0.739–3.119). The log estimate is also positive and non-significant (0.080; p = 0.462). Resource multicollinearity is limited, with VIFs close to 1, but the level model explains only 4.00% of the variation in revenue. Removing the three financially flagged observations increases the marketing estimate to USD 1.650 (p = 0.086), but it does not reach the adopted significance level. The available expenditure measure and farm characteristics provide no stable statistical support for H1 in the Chinese sample.
The main platform does not jointly distinguish revenue after controlling for the other characteristics (p = 0.485 in Ukraine and p = 0.789 in China). Profitability remains a separate economic outcome: similar turnover can involve different amounts of service work and external payments. Table 4, therefore, compares platform groups using ROS.
Ukrainian mean ROS values are close across platforms, and the joint test of adjusted differences gives p = 0.765. In China, Taobao Live users have an adjusted ROS 2.58 percentage points lower than WeChat users (individual 95% CI: -4.79 to −0.38). At an identical USD 1,000 revenue base, the point estimate represents USD 25.84 in profit. Its unadjusted p-value is 0.0221, rising to 0.0664 after Holm adjustment; the joint Chinese platform test gives p = 0.0628. H3 is not supported by either of the primary country models at the 5% level.
The Chinese platform test remains above the significance threshold after excluding the three flagged financial records (p = 0.0664) and within the certified subsample (p = 0.1074). Excluding the 20 ha farm gives p = 0.0579. In Ukraine, removing the two Prom.ua observations leaves platform differences non-significant (p = 0.595). These checks preserve the distinction between the persistent country-level ROS gap and the weaker evidence for differences among platforms within countries.
Video use does not significantly alter the marketing–revenue elasticity (Table 5). The interaction estimate is 0.059 in Ukraine (p = 0.853) and 0.331 in China (p = 0.166); both confidence intervals include zero. Adding the interaction increases R² by 0.0006 and 0.0189, respectively. In the Ukrainian moderation model, the estimated elasticities are negative for both non-users (−2.059; p = 0.021) and users (−2.000; p = 0.045), reinforcing the sensitivity of the budget relationship to functional form. Their difference is non-significant. Chinese simple slopes are −0.043 for non-users and 0.287 for users, neither statistically significant. H2 is unsupported in both primary models.
The Chinese interaction becomes larger after the three flagged records are excluded (0.407; p = 0.0506), indicating sensitivity to accounting consistency while remaining above the 5% threshold. Restricting the sample to certified farms or omitting the 20-ha holding also leaves H2 unsupported. For commercial decisions, the useful distinction is between adopting video and organizing its contribution to an order. Provenance demonstrations, consultations, and product promotions are combined in one binary indicator, although their demands on content preparation and fulfillment differ.
4.3. Applied Business Cases
The Instagram and WeChat cases illustrate two ways of organizing commercial contact. INBERRI’s profile directs prospective buyers towards a personal exchange with the producer. WeChat offers the product demonstration, price, and ordering functions within the same interface (Figure 1 and Figure 2). These arrangements allocate work differently between the seller and the digital system.
INBERRI uses blueberry_sumy as a recognizable storefront for vegetables and berries from the Sumy region. The farm name, regional identity, and themed categories give the assortment a clear origin and help buyers locate relevant products. Images of harvesting, cultivation, and packaging connect the offer to the production story. Message and contact buttons then provide a route to inquiries about availability, quantities, and dispatch. Returning customers can address the same seller through the same channel. The commercial value of this arrangement lies in the ability to maintain customer relationships and negotiate orders around seasonal availability. Where the transaction bypasses a trading intermediary, itsbased onn remains within the producer–buyer relationship, while the time spent on correspondence and order assembly becomes part of the cost of selling.
WeChat provides a different purchasing route. A video of purple carrots appears alongside a starting price of CNY 23.9, a shopping cart, and a purchase button. The crop setting and the seller’s emphasis on minimal post-harvest handling position the offer around proximity to production. Commercial action is available directly next to the presentation: customers can review the product and its price before placing an order in the same interface. This arrangement moves part of the information needed for ordering from personal correspondence into the product listing. To turn video attention into revenue, the seller must align the displayed consignment with stock availability, price, and fulfillment. Preparation, promotion, and servicing all enter the economics of the video-based offer.
The contrast concerns commercial organization as much as content format. The Ukrainian profile leaves greater scope for individual agreement and repeated contact within a small customer community; WeChat provides an integrated route to a more standardized purchase. Under a transaction-cost interpretation, the choice depends on the resources required to acquire and serve a completed order. A personalized profile can incorporate explicit prices and delivery terms, while a video-based product listing can give the farm a clearer identity. Combining a distinctive offer with straightforward ordering is a practical option to evaluate through repeat purchases, labor time, and channel profit.
5. Discussion
5.1. Sales Scale, Margins, and Channel Organization
The central economic contrast is between the scale of demand served and the profitability of that demand. Chinese farms report higher mean monthly online revenue, USD 12,878.30 compared with USD 4,237.30, but lower ROS, 17.72% compared with 30.85%. The 13.13-percentage-point difference (95% CI: 11.43–14.83) persists across sensitivity analyses. For the farm, these represent distinct management objectives: increasing the value of orders and retaining a sufficient share after fulfilling them. A higher margin raises profit per unit of revenue, whereas the absolute result also depends on turnover and the distribution of individual farm outcomes.
Previous research describes the benefits of digital access through several outcomes: higher prices and more favorable selling times, income associated with market integration, and complementarity between e-commerce and certification [8,14,23]. Designs accounting for endogenous participation compares different adoption states; this study compares producers who already trade online. Lower ROS in the Chinese sample is compatible with gains from market access. It identifies a tension between turnover and the resources required to sustain it, extending the adoption discussion to the channel’s ongoing economics.
The Ukrainian configuration combines universal reported certification, a median area of 31.5 ha, and the predominance of Instagram, the main channel for 48 of 74 farms. The mean area of 660.66 ha reflects the presence of much larger producers, making the resource profile heterogeneous. The mean ROS of Instagram users (30.88%) are close to the means for the other Ukrainian channels. Higher margins consequently characterize the broader sample rather than an isolated advantage on Instagram. The INBERRI case shows one commercial arrangement within this setting: recognizable provenance, assortment navigation, and direct contact are combined around a named farm. This organization is consistent with the emphasis on technological fit and value creation in short supply chains [3,20].
For a producer negotiating available products and dispatch dates directly with customers, flexibility means being able to change an order while maintaining the relationship. War-related disruption makes this control particularly relevant in Ukraine [10]. Its economic content includes labor; however, individual responses, small-order assembly, and repeated coordination remain farm responsibilities. Research on short supply chains connects their diversity to differences in the allocation of precisely these operations and workloads [2,4]. Retained trading margins support adaptation when they cover this work as well as production costs.
Chinese farms, with a median area of 0.8 ha, operate through different channel structures: Taobao Live, WeChat, and Pinduoduo account for 56, 28, and 28 observations, respectively. High online revenue alongside small holdings draws attention to commercial resources beyond the individual plot. Cooperative services and knowledge exchange within agricultural clusters are discussed as ways to broaden those resources [13,16]. They provide a possible organizational explanation of platform integration; the variables observed here are platform choice, expenditure, and financial outcomes. The WeChat case makes the commercial arrangement concrete by placing video within the ordering process.
Market access requires finance. Chinese marketing expenditure is 4.26 times the Ukrainian mean, compared with a revenue ratio of 3.04, and accounts for a larger share of aggregate turnover: 9.39% versus 6.69%. The distribution of value between the producer, the digital channel, and order fulfillment becomes a central business question. Research on rural livestreaming links skill acquisition to platform dependence, while models of digital supply chains make profitability sensitive to intermediation arrangements [15,31]. Platform services can replace the seller’s own work; direct interaction leaves more tasks in-house. TCE locates the comparison in the cost and organization of these functions [6]. Separating advertising, commissions, delivery, and labor would establish where scaling increases profit and where it primarily expands turnover.
5.2. Marketing Resources, Video Content, and the Limits of Platform Advantages
The Ukrainian results place a sharp qualification on the expected positive relationship between marketing resources and revenue. The level coefficient is large and positive (B = 57.786; p = 0.0016), but it shrinks after area is excluded and becomes negative in the log specification (elasticity = −2.068; p = 0.0187). This sign reversal, together with pronounced expenditure–area multicollinearity, makes specification sensitivity the substantive finding. Resource-based research connects performance to the fit between strategy, organizational capability, and farm needs [3,5]. The monthly budget captures financing, while the records leave campaign design, customer targeting, and fulfillment capability unmeasured. H1, therefore, has support in one Ukrainian specification but not in a stable positive relationship across models.
The Chinese budget coefficient is positive (B = 1.190) but imprecisely estimated (p = 0.224). Its log counterpart and the sensitivity analyses likewise do not establish the positive association proposed in H1. Web analytics studies distinguish traffic composition and visitor behavior as separate elements of marketing performance [22]; aggregate expenditure may finance both new audiences and existing demand. The sequence can also run in the opposite direction: revenue funds advertising, while weak sales can prompt additional promotion. Approaches addressing selection and endogeneity explicitly separate such relationships [8,14]. These differences in measurement and identification explain why a monthly farm budget does not carry the same interpretive content as a campaign-level response estimate.
Neither primary moderation model supports H2. The expenditure–video interaction is 0.059 in Ukraine (p = 0.853) and 0.331 in China (p = 0.166), with 95% CIs of [−0.580, 0.699] and [−0.139, 0.800]. The larger Chinese coefficient after removal of the accounting flags (p = 0.0506) merits attention as a sensitivity result, not a change in the primary hypothesis decision. Consumer research captures information responses, purchase intentions, and social-commerce interactions [27,28]; farm revenue aggregates realized transactions. Stock availability, pricing, order acceptance, and fulfillment intervene between these outcomes. A favourable audience response can therefore coexist with an uncertain difference in revenue elasticities.
The cases illustrate this organizational transition. INBERRI centres the offer on familiarity with the producer and direct dialogue, whereas WeChat places purchasing functions beside the video. Provenance information, confidence in its source, and an accessible ordering route perform different tasks [9,28]. Their coordination, rather than video presence alone, offers a basis for learning across the two settings. Video is already reported by 48.65% of Ukrainian and 35.71% of Chinese farms. Seller preparation, presentation structure, responses to buyers, and fulfilment discipline are therefore more relevant areas for exchange than simply increasing broadcast frequency. Research on knowledge sharing and livestreaming skills supports this organizational focus [15,16]. Trials should record completed sales alongside content production and labor costs.
Within-country platform differences in ROS are less persistent than the country-level gap. The primary joint tests yield p = 0.765 in Ukraine and p = 0.0628 in China, while the Taobao Live–WeChat contrast has p = 0.0664 after Holm adjustment. The additional sample checks retain the non-significant joint result. H3 remains unsupported at the adopted threshold. A channel’s contribution depends on contractual arrangements, the allocation of work, and audience access. Intermediaries can perform functions that are costly for individual farms, while direct channels retain more of the trading margin alongside the producer’s own labour [4,6,31]. Comparing the full cost of completed orders is therefore more informative for management than ranking applications by a single sample mean.
Certification occupies a distinct position in this account. Every Ukrainian farm reports certification, whereas the Chinese revenue estimate relies on a comparison with 11 uncertified farms and is not significant (p = 0.595). Published evidence of certification–e-commerce complementarity concerns broader combinations of practices [8], and quality assurance involves several supply-chain participants [7]. The commercial value of certification depends on how the relevant information enters the offer, customer choice, and transaction terms. Measuring these activities would complement the binary status indicator.
The comparison clarifies how RBV and TCE connect access to a resource, its commercial deployment, and the retention of value. Expenditure finances contact, video supports presentation, and the platform provides the transaction setting; profitability depends on their fit with the farm’s operations [3,5,6]. A persistent ROS gap alongside unstable digital-practice coefficients makes order fulfilment and customer management important targets for further explanation. Financial viability remains one dimension of sustainability. Environmental effects require their own measures [17].
5.3. Limitations and Future Research
The comparison covers 186 active online sellers reached through publicly available telephone numbers. This recruitment route can favour businesses with accessible contact details and those willing and able to complete an interview. Sampling probabilities were not supplied, limiting population-level inference. Differences in landholding, owner age, and platform composition also constrain comparability, particularly with only two Ukrainian Prom.ua observations. A broader design should use comparable production specialisations and farm sizes and include producers who have left digital channels or have yet to adopt them. Recording the number of attempted contacts and non-responses would make telephone-survey coverage and participation more transparent.
Farm-level aggregates reveal overall performance but provide limited detail on individual transactions. The ten fields do not separate product assortment, physical quantities, revenue by channel, commissions, delivery costs, and labour time. Recording these components would distinguish price, volume, and organizational explanations of turnover. Buyer locations and transaction types would also establish the geographical scope of local sales and the share of D2C activity. Cooperative identifiers would enable the modelling of shared conditions and clustered observations. Linking the business cases to survey and transaction records would give the qualitative account of the interface a farm-specific financial basis.
Behavioral mechanisms require a different level of measurement. Trust, perceived quality, digital self-efficacy, and risk attitudes were not measured psychometrically, while Video_Stream combines several communication practices. Matching farm accounts with seller and buyer responses for the same period and channel would help trace how content and interaction lead to repeat orders. Distinguishing among provenance videos, consultations, and product promotions is particularly relevant because their costs and roles in the purchasing process differ.
Accounting comparability remains important. Three Chinese records require reconciliation because reported marketing expenditure exceeds the total costs implied by ROS for a common period and sales coverage. Excluding them preserves the country-level margin gap but alters some Chinese coefficients, particularly those for video interaction. Certification was reported by respondents rather than independently verified. Strong expenditure–area multicollinearity constrains the Ukrainian model, in which the marketing coefficient changes sign across specifications. More budget variation among comparable farms, larger platform groups, and separate measures of video frequency and format would strengthen subsequent estimates.
Panel data would bring these extensions together. Monthly observations of the same farms, including budgets, revenue, returns, commissions, and service time, would distinguish persistent producer characteristics from seasonality and the sequence of marketing decisions. Dates of platform changes, the introduction of video selling, and logistics disruptions would support analysis of adaptation over time. A panel, combined with well-defined comparison groups and field experiments, could then examine the causal effects of specific changes in product presentation and ordering.
6. Conclusions
Telephone interviews with 186 farms indicate higher mean monthly online revenue in China—USD 12,878.30 versus USD 4,237.30—and a higher reported ROS in Ukraine —30.85% versus 17.72%. The 13.13-percentage-point margin gap persists across sensitivity checks. The contrasting profiles underline the need to manage the expansion of demand and the costs of serving it together.
The proposed positive marketing–revenue association is not robust across Ukrainian specifications and is not statistically supported in China. Neither primary model supports video moderation or within-country platform differences in ROS at the 5% level. Changes in budgets, video practices, and platform choice should consequently be tested at the farm level against the additional profit from completed orders.
Chinese cooperatives could trial producer-specific product lines within their existing platform sales. The INBERRI case offers a practical basis: a recognizable producer, regional provenance, a clearly organized assortment, and direct contact. A farm profile, batch information, and documented production attributes could strengthen the offer’s identity. A trial should compare the branded line with the existing offer by considering profit after all costs, repeat orders, and customer service time.
Ukrainian producers could adapt the organization of video selling described in Chinese research on skill formation and knowledge exchange [15,16]. Product demonstrations, responses to questions, stated availability, and clear ordering terms should operate as a single process. Comparing video-, photographic-, and text-based offers within comparable budgets would establish their relationship to completed purchases, returns, and labor requirements. Scaling is justified when the additional financial return exceeds the costs of content and fulfillment.
Both approaches require full channel-cost accounting, covering customer acquisition, packaging, delivery, commissions, returns, and labor. This provides a basis for adopting specific practices that fit the farm’s needs, combining a distinctive offer with convenient ordering and reliable fulfillment. Effective digital selling culminates in a profitable completed order, not simply a product view.
Supplementary Materials
https://doi.org/10.5281/zenodo.23121914.
Author Contributions
Conceptualization, J.Z., V.L., O.N. and Y.D; methodology, Y.D. and V.L.; software, Y.D. and O.N.; validation, J.Z., V.L., O.N. and Y.D.; formal analysis, Y.D. and O.N.; investigation, J.Z., V.L., O.N. and Y.D.; resources, J.Z., V.L., O.N. and Y.D.; data curation, J.Z., V.L., O.N. and Y.D.; writing-original draft preparation, Y.D. and O.N.; writing-eview and editing, J.Z., V.L., O.N. and Y.D.; visualization, Y.D. and O.N.; supervision, Y.D. and O.N.; project administration, Y.D. and O.N.; funding acquisition, Y.D.
Funding
This research was funded by the Ministry of Education and Science of Ukraine, grant number 012U000308 (project “Circular strategies and economic feasibility of implementing alternative protein technologies in the food security system”).
Institutional Review Board Statement
The study was conducted in accordance with the Declaration of Helsinki and approved by the Academic Ethics Committee of Sumy National Agrarian University (protocol code 14 and date of approval 15 March 2026).
Informed Consent Statement
Informed consent was obtained from all subjects involved in the study. Due to the telephone-based nature of the interviews, verbal informed consent was obtained from each participant prior to the start of the survey. Respondents were informed about the purpose of the study, the voluntary nature of their participation, and the strict confidentiality of their data. The interviewers formally recorded the participants’ verbal consent in the data collection protocol before proceeding with the questionnaire.
Data Availability Statement
The original contributions presented in this study are included in the article. Further inquiries can be directed to the corresponding author.
Acknowledgments
The authors would like to express their sincere gratitude to all organic farmers, with a special appreciation for the Ukrainian producers who remain dedicated to high-quality organic food production even in times of war. Furthermore, the authors acknowledge the use of ChatGPT (OpenAI) to verify the results and format the manuscript, as well as Grammarly for language editing and proofreading. The authors take full responsibility for the final analysis, interpretation, and content of the published work.
Conflicts of Interest
The author declares no conflicts of interest.
Abbreviations
CI, confidence interval; D2C, direct-to-consumer; HC3, heteroskedasticity-consistent covariance estimator; OLS, ordinary least squares; RBV, resource-based view; ROS, return on sales; SD, standard deviation; SE, standard error; TCE, transaction cost economics; VIF, variance inflation factor.
References
- Bayir, B.; Charles, A.; Sekhari, A.; Ouzrout, Y. Issues and Challenges in Short Food Supply Chains: A Systematic Literature Review. Sustainability 2022, 14, 3029. [Google Scholar] [CrossRef]
- Gori, F.; Castellini, A. Alternative Food Networks and Short Food Supply Chains: A Systematic Literature Review Based on a Case Study Approach. Sustainability 2023, 15, 8140. [Google Scholar] [CrossRef]
- Masi, M.; De Rosa, M.; Charatsari, C.; Lioutas, E.D.; Vecchio, Y. Enhancing value creation in short food supply chains through digital platforms. Agric. Food Econ. 2025, 13, 27. [Google Scholar] [CrossRef]
- O’Connor, G.; Reis, K.; Desha, C.; Burkett, I. Valuing farmers in transitions to more sustainable food systems: A systematic literature review of local food producers’ experiences and contributions in short food supply chains. Agric. Hum. Values 2025, 42, 565–592. [Google Scholar] [CrossRef]
- Wu, C.-W.; Botella-Carrubi, D.; Blanco-González-Tejero, C. The empirical study of digital marketing strategy and performance in small and medium-sized enterprises (SMEs). Technol. Forecast. Soc. Change 2024, 200, 123142. [Google Scholar] [CrossRef]
- Trejo-Pech, C.O.; Servín-Juárez, R.; Reyes-Duarte, Á. What sets cooperative farmers apart from non-cooperative farmers? A transaction cost economics analysis of coffee farmers in Mexico. Agric. Food Econ. 2023, 11, 14. [Google Scholar] [CrossRef]
- Schrobback, P.; Zhang, A.; Loechel, B.; Ricketts, K.; Ingham, A. Food Credence Attributes: A Conceptual Framework of Supply Chain Stakeholders, Their Motives, and Mechanisms to Address Information Asymmetry. Foods 2023, 12, 538. [Google Scholar] [CrossRef] [PubMed]
- Liu, S.; Jin, Y.; Zheng, F. Did product certification and e-commerce benefit agricultural producers in China? Food Policy 2024, 127, 102688. [Google Scholar] [CrossRef]
- Yuan, R.; Jin, S.; Wu, W. Interactive effects of information and trust on consumer choices of organic food: Evidence from China. Appetite 2024, 192, 107115. [Google Scholar] [CrossRef] [PubMed]
- Jia, N.; Xia, Z.; Li, Y.; Yu, X.; Wu, X.; Li, Y.; Su, R.; Wang, M.; Chen, R.; Liu, J. The Russia-Ukraine war reduced food production and exports with a disparate geographical impact worldwide. Commun. Earth Environ. 2024, 5, 765. [Google Scholar] [CrossRef]
- Kucher, O.; Hutsol, O.; Prokopchuk, L.; Hutsol, T.; Vasylyshen, Y.; Tryhuba, A.; Gajda, J.; Kornas, R.; Borusiewicz, A. Application of Marketing Tools in the Bioeconomic Sector. Sustainability 2025, 17, 3590. [Google Scholar] [CrossRef]
- Danko, Y.; Kolodiazhna, V.; Nifatova, O.; Halynska, A.; Bliumska-Danko, K.; Kovbasa, O.; Turchyn, L. From Local Crafts to Market Niches: The Marketing Potential of Artisanal Foods in Ukraine. Foods 2025, 14, 2249. [Google Scholar] [CrossRef] [PubMed]
- Chen, C.; Gan, C.; Li, J.; Lu, Y.; Rahut, D. Linking farmers to markets: Does cooperative membership facilitate e-commerce adoption and income growth in rural China? Econ. Anal. Policy 2023, 80, 1155–1170. [Google Scholar] [CrossRef]
- Li, W.; He, W. Revenue-increasing effect of rural e-commerce: A perspective of farmers’ market integration and employment growth. Econ. Anal. Policy 2024, 81, 482–493. [Google Scholar] [CrossRef]
- Wu, Y.; Li, D. Skill generation and distribution in rural livestreaming E-commerce: A case study of livestreaming villages in Haitou Town, China. J. Rural Stud. 2026, 122, 103990. [Google Scholar] [CrossRef]
- Li, J.; Li, X. Coopetition in social commerce: What influences livestreaming knowledge sharing in agricultural clusters? Electron. Commer. Res. Appl. 2024, 64, 101383. [Google Scholar] [CrossRef]
- Huck, C.; Gobrecht, A.; Salou, T.; Bellon-Maurel, V.; Loiseau, E. Environmental assessment of digitalisation in agriculture: A systematic review. J. Clean. Prod. 2024, 472, 143369. [Google Scholar] [CrossRef]
- Zhang, Y.; Lin, Z.; Zhang, R.; Zhao, K. The impact of digital capabilities on farmers’ choice of marketing channels: Evidence from rural areas of the Yellow River Basin in China. Humanit. Soc. Sci. Commun. 2025, 12, 1629. [Google Scholar] [CrossRef]
- Zheng, Y.; Liao, F.; Tian, M. Examining the factors influencing the digital transformation of new agricultural operating entities: Insights from Zhejiang, China. Humanit. Soc. Sci. Commun. 2025, 12, 608. [Google Scholar] [CrossRef]
- De Rosa, M.; Charatsari, C.; Lioutas, E.D.; Vecchio, Y.; Masi, M. Staging value creation processes in short food supply chains of Italy. Agric. Food Econ. 2024, 12, 47. [Google Scholar] [CrossRef]
- Castro Campos, B.; Qi, X. A literature review on the drivers and barriers of organic food consumption in China. Agric. Food Econ. 2024, 12, 18. [Google Scholar] [CrossRef]
- Kanellos, N.; Karountzos, P.; Giannakopoulos, N.T.; Terzi, M.C.; Sakas, D.P. Digital Marketing Strategies and Profitability in the Agri-Food Industry: Resource Efficiency and Value Chains. Sustainability 2024, 16, 5889. [Google Scholar] [CrossRef]
- Liu, M.; Liu, T.; Ren, Y.; Wu, L. How Does the Adoption of e-Commerce Impact the Selling Prices of Agricultural Products? Empirical Evidence From Apple Farmers in China. Rev. Dev. Econ. 2025, 29, 1464–1485. [Google Scholar] [CrossRef]
- Danko, Y.; Nifatova, O. Agro-sphere determinants of green branding: Eco-consumption, loyalty, and price premium. Humanit. Soc. Sci. Commun. 2022, 9, 77. [Google Scholar] [CrossRef]
- Duong, C.D.; Vu, T.N.; Ngo, T.V.N.; Chu, T.V.; Pham, L.H.T. Who can you trust? The curvilinear effects of producer-retailer trust (im)balance in organic food consumption—The moderation role of trust in blockchain technology. J. Retail. Consum. Serv. 2024, 81, 104039. [Google Scholar] [CrossRef]
- Wiedenroth, C.F.; Otter, V. Can new healthy luxury food products accelerate short food supply chain formation via social media marketing in high-income countries? Agric. Food Econ. 2022, 10, 31. [Google Scholar] [CrossRef] [PubMed]
- Sadeli, A.H.; Perdana, T.; Deliana, Y.; Onggo, B.S. Consumers’ purchase behavior in short food supply chains using social commerce in Indonesia. J. Clean. Prod. 2023, 386, 135812. [Google Scholar] [CrossRef]
- Gu, C.; Sun, X.; Wei, W.; Sun, J.; Zeng, Y.; Zhang, L. How to improve users’ purchase intention of agricultural products through live streaming systems? Acta Psychol. 2025, 254, 104883. [Google Scholar] [CrossRef] [PubMed]
- Nifatova, O.; Danko, Y.; Bliumska-Danko, K. Rethinking organic food messaging: An experimental study on health and environmental motives. Clean. Food Syst. 2026, 3, 100029. [Google Scholar] [CrossRef]
- Charatsari, C.; Lioutas, E.D.; De Rosa, M. Going Short and Going Digital: How Do Consumers View the Impacts of Digitalizing Short Food Supply Chains? Sustainability 2024, 16, 11241. [Google Scholar] [CrossRef]
- Xu, X.; Chen, X.; Hou, J.; Cheng, T.C.E.; Yu, Y.; Zhou, L. Should live streaming be adopted for agricultural supply chain considering platform’s quality improvement and blockchain support? Transp. Res. Part E Logist. Transp. Rev. 2025, 195, 103950. [Google Scholar] [CrossRef]
- Jia, F.; Shahzadi, G.; Bourlakis, M.; John, A. Promoting resilient and sustainable food systems: A systematic literature review on short food supply chains. J. Clean. Prod. 2024, 435, 140364. [Google Scholar] [CrossRef]
- Hu, Q.; Guo, E.; Feng, F.; Zhao, S. Green agricultural product quality supervision based on prospect theory and evolutionary game theory for logistics enterprise live streaming. Sci. Rep. 2026, 16, 283. [Google Scholar] [CrossRef] [PubMed]
Figure 1.
INBERRI on Instagram: regional branding, product assortment, and direct customer contact.
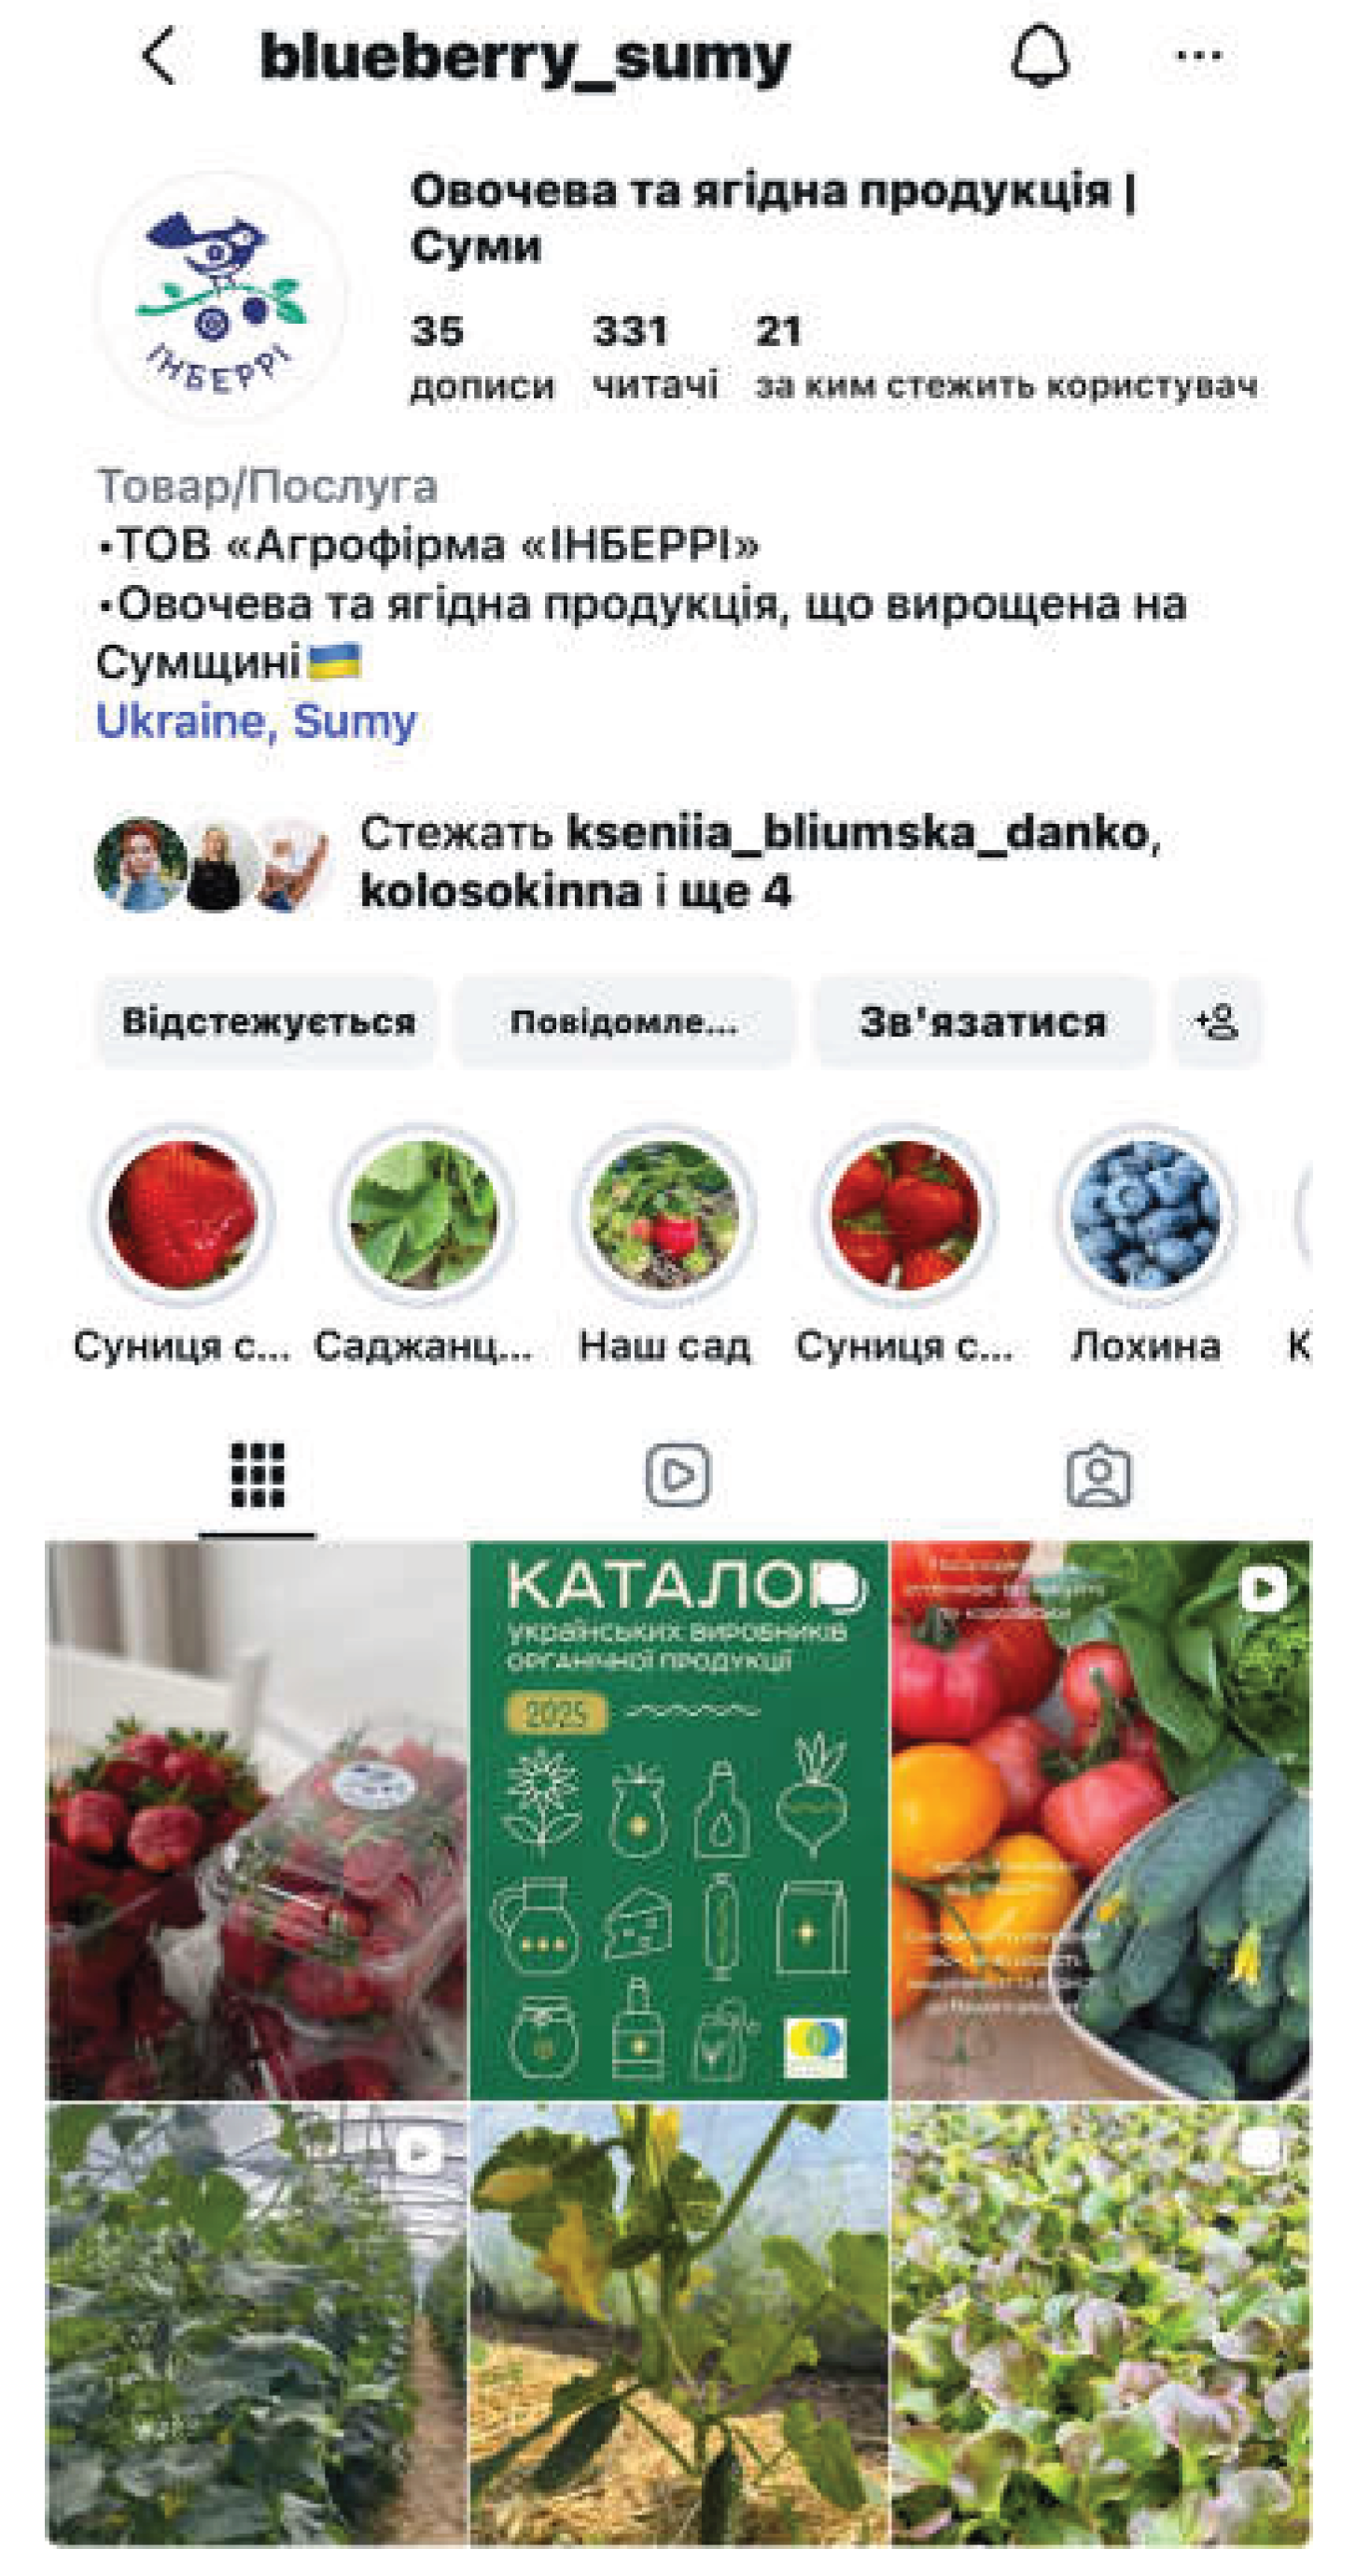
Figure 2.
A video-based product offer on WeChat: purple carrots, price, and purchasing functions.


Table 1.
Descriptive statistics and between-country comparisons.
| Variable |
Ukraine, N = 74 Mean ± SD |
China, N = 112 Mean ± SD |
Difference Ukraine − China |
Welch t | p |
| Owner age, years | 40.39 ± 3.46 | 54.53 ± 8.73 | −14.13 | −15.408 | <0.001 |
| Land area, ha | 660.66 ± 824.02 | 1.05 ± 1.85 | 659.61 | 6.886 | <0.001 |
| Online revenue, USD/month | 4,237.30 ± 3,494.35 | 12,878.30 ± 8,921.43 | −8,641.01 | −9.234 | <0.001 |
| ROS, % | 30.85 ± 6.43 | 17.72 ± 4.47 | 13.13 | 15.281 | <0.001 |
| Marketing expenditure, USD/month | 283.65 ± 178.25 | 1,209.64 ± 712.35 | −925.99 | −13.148 | <0.001 |
Notes: SD is the sample standard deviation. Differences are Ukraine minus China; the ROS difference is in percentage points. Tests are two-sided Welch’s t-tests. Unadjusted p-values are reported; all five comparisons remain significant after Holm adjustment. Degrees of freedom, in row order, are 156.615, 73.000, 155.762, 119.119, and 131.244. Calculations use unrounded values. Source for all statistical tables: the corrected author-supplied dataset of 186 farms.
Table 2.
OLS estimates for Ukraine. Dependent variable: Sales_USD.
| Predictor | B | SE (HC3) | t | p |
| Intercept | −2,707.889 | 3,712.966 | −0.729 | 0.468 |
| Marketing expenditure, USD 1 | 57.786 | 17.563 | 3.290 | 0.002 |
| Land area, 1 ha | −11.829 | 3.701 | −3.196 | 0.002 |
| Owner age, 1 year | 11.064 | 125.510 | 0.088 | 0.930 |
| Video use: 1 vs. 0 | −2,262.691 | 1,782.314 | −1.270 | 0.209 |
| Certification: 1 vs. 0 | NE | NE | NE | NE |
| Viber/Telegram vs. Instagram | −2,876.903 | 1,889.606 | −1.522 | 0.133 |
| TikTok vs. Instagram | −2,338.491 | 2,043.259 | −1.144 | 0.257 |
| Prom.ua vs. Instagram | −3,509.452 | 3,889.465 | −0.902 | 0.370 |
Notes: N = 74; R² = 0.2692; adjusted R² = 0.1917; residual df = 66. B is an unstandardised coefficient; SE is the HC3 robust standard error. NE: not estimated because all Ukrainian farms report certification. Instagram is the reference platform.
Table 3.
OLS estimates for China. Dependent variable: Sales_USD.
| Predictor | B | SE (HC3) | t | p |
| Intercept | 4,744.332 | 7,090.625 | 0.669 | 0.505 |
| Marketing expenditure, USD 1 | 1.190 | 0.973 | 1.224 | 0.224 |
| Land area, 1 ha | 281.714 | 225.494 | 1.249 | 0.214 |
| Owner age, 1 year | 124.039 | 114.996 | 1.079 | 0.283 |
| Video use: 1 vs. 0 | 1,101.057 | 2,164.057 | 0.509 | 0.612 |
| Certification: 1 vs. 0 | −1,553.931 | 2,912.984 | −0.533 | 0.595 |
| Taobao Live vs. WeChat | 439.531 | 2,196.043 | 0.200 | 0.842 |
| Pinduoduo vs. WeChat | 1,693.895 | 2,497.839 | 0.678 | 0.499 |
Notes: N = 112; R² = 0.0400; adjusted R² = −0.0247; residual df = 104. B is an unstandardized coefficient; SE is the HC3 robust standard error. WeChat is the reference platform.
Table 4.
Return on sales by the main platform and adjusted contrasts with the reference platform.
| Country / platform | N |
ROS, % Mean ± SD |
B, percentage points |
95% CI for B | p (Holm) |
| Ukraine / Instagram | 48 | 30.88 ± 6.79 | Reference | — | — |
| Ukraine / Viber/Telegram | 17 | 30.18 ± 6.95 | 1.03 | [−5.15, 7.22] | 1.000 |
| Ukraine / TikTok | 7 | 31.86 ± 2.79 | 2.29 | [−2.84, 7.43] | 1.000 |
| Ukraine / Prom.ua | 2 | 32.50 ± 3.54 | 2.98 | [−4.83, 10.79] | 1.000 |
| China / WeChat | 28 | 19.21 ± 2.96 | Reference | — | — |
| China / Taobao Live | 56 | 16.80 ± 5.13 | −2.58 | [−4.79, −0.38] | 0.066 |
| China / Pinduoduo | 28 | 18.07 ± 3.97 | −0.10 | [−2.20, 1.99] | 0.924 |
Notes: Means and SDs describe the observed platform groups. B and CIs are estimated from the ROS regression controlling for Marketing_USD, Area_ha, Age, Video_Stream, and Certificate where it varies. B is expressed in percentage points. CIs are individual, unadjusted 95% intervals; p-values are Holm-adjusted across all within-country platform pairs. An individual CI can therefore exclude zero while the adjusted p-value exceeds 0.05. Financial outcomes cover each farm’s overall online activity, grouped by its main platform.
Table 5.
Moderation of the marketing–revenue association by video use.
| Country | Interaction θ | SE (HC3) | t | p | 95% CI |
| Ukraine | 0.059 | 0.320 | 0.186 | 0.853 | [−0.580, 0.699] |
| China | 0.331 | 0.237 | 1.395 | 0.166 | [−0.139, 0.800] |
Notes: The dependent variable is ln(Sales_USD). The interaction is country-centred ln(Marketing_USD) × Video_Stream. Models include both main effects, ln(Area_ha), Age, platform indicators, and Certificate for China. R² is 0.1629 for Ukraine and 0.0695 for China; residual df are 65 and 103. SEs and CIs use HC3.
Disclaimer/Publisher’s Note: The statements, opinions and data contained in all publications are solely those of the individual author(s) and contributor(s) and not of MDPI and/or the editor(s). MDPI and/or the editor(s) disclaim responsibility for any injury to people or property resulting from any ideas, methods, instructions or products referred to in the content. |
© 2026 by the authors. Licensee MDPI, Basel, Switzerland. This article is an open access article distributed under the terms and conditions of the Creative Commons Attribution (CC BY) license (http://creativecommons.org/licenses/by/4.0/).
Copyright: This open access article is published under a Creative Commons CC BY 4.0 license, which permit the free download, distribution, and reuse, provided that the author and preprint are cited in any reuse.