

Submitted:
06 October 2026
Posted:
08 October 2026
You are already at the latest version
Abstract
Two assumptions dominate deep learning research on pneumonia detection from chest radiographs: that newer architectures outperform older ones, and that intra-dataset evaluation suffices to establish clinical utility. This study tested both. Nine architectures, spanning classical, efficient-scaling, and modern convolutional networks and Vision Transformers, plus a weighted soft-voting ensemble, were compared under a unified protocol on the pediatric Chest X-Ray Images dataset. None of the post-2020 architectures outperformed InceptionV3 (2016), which achieved the best individual accuracy (98.18%). The validation-weighted ensemble reached 98.52% accuracy and 99.22% pneumonia sensitivity on the internal test set; because its components were selected using test-set rankings, these values are upper-bound estimates. Bonferroni-corrected McNemar tests found no significant differences among the top-performing models. A cross-population external evaluation on an adult RSNA subset, which combines age, institutional, acquisition, and label shifts, revealed markedly different behavior: InceptionV3 retained 85.30% accuracy, whereas VGG16 fell to 59.60%, and the ensemble underperformed InceptionV3 alone. Ablation, Grad-CAM, and efficiency analyses complemented these findings. Architectural recency is not a proxy for performance, and external evaluation should be an architecture-selection criterion rather than an optional addendum.
Keywords:
pneumonia detection
; chest X-ray
; convolutional neural networks
; vision transformer
; ensemble learning
; external evaluation
; domain shift
; Grad-CAM
1. Introduction
Pneumonia is an acute infection of the pulmonary parenchyma and remains one of the leading causes of childhood morbidity and mortality worldwide, particularly in developing countries where access to specialist radiologists is limited. Early detection through chest imaging is critical for timely treatment and for reducing complications, especially in pediatric populations where the disease can progress rapidly.
Traditional diagnosis from chest radiographs depends on a radiologist's visual interpretation, a process that requires specialized clinical expertise and is subject to interobserver variability, particularly when distinguishing bacterial from viral pneumonia. Bacterial pneumonia typically manifests as focal lobar consolidation, whereas viral pneumonia presents a more diffuse bilateral interstitial pattern, although this distinction is not always evident even to experienced observers, which constitutes one of the central challenges for any automated classification system, human or computational.
Deep learning has transformed medical image analysis by enabling the automatic extraction of discriminative patterns directly from pixel data, without manual feature engineering. Since the pioneering work of Kermany et al. [1], who demonstrated the feasibility of CNN-based diagnostic support for pediatric pneumonia, multiple architectures have been evaluated in this domain, including CheXNet [2], variants of ResNet, DenseNet, and VGG, and, more recently, Vision Transformers.
Convolutional architectures (VGG, ResNet, DenseNet, InceptionV3, and EfficientNet) have historically dominated medical image classification through the extraction of local hierarchical features, although their limited receptive field constrains the capture of long-range spatial dependencies, a limitation that Vision Transformers [3] address through self-attention. More recently, architectures such as ConvNeXt [4] and the Swin Transformer [5] have sought to combine the advantages of both paradigms. A question rarely examined in the medical domain is whether these architectural advances, validated on natural-image benchmarks, translate into genuine improvements on chest radiographs.
The adoption of Transformers in medical imaging has been rapid. A comprehensive survey by Shamshad et al. [6] documents their use in segmentation, detection, classification, reconstruction, synthesis, registration, and clinical report generation, motivated mainly by their ability to capture global context, in contrast to the local receptive fields of CNNs. Whether this theoretical advantage yields measurable gains in a binary radiographic screening task, however, remains an empirical question that this study addresses directly.
Deep learning has reached notable maturity in this domain: reported accuracies consistently exceed 95%, and the literature has accumulated dozens of studies on the same dataset. Paradoxically, this apparent saturation coexists with limited empirical validation of the assumptions on which it rests.
The abundance of studies in this domain, of which nine directly comparable works are summarized in Table 1, might suggest that the problem is solved. However, that abundance rests on two assumptions that are rarely subjected to empirical scrutiny and that the present work sets out to examine.
The first assumption is that architectural recency translates into better performance. The field tends to adopt the most recent architectures on the premise that their advantages on natural-vision benchmarks (ImageNet, COCO) transfer automatically to the medical domain, a premise rarely tested under controlled conditions on chest radiographs.
The second assumption is that intra-dataset evaluation suffices to establish a model’s clinical utility. According to the scoping review by Rickard et al. [7], thirty-one of the thirty-five studies reviewed rely exclusively on the Kermany et al. dataset, reporting intra-dataset accuracy as evidence of applicability. If this metric fails to predict out-of-domain behavior, much of the field’s guidance on which architecture to deploy would lack empirical grounding.
Recent high-impact studies show why this assumption is risky. Brown et al. [8] showed that clinical models can base predictions on improper correlations in the training data (shortcut learning) and illustrated how patient age can act as such a shortcut in a chest radiograph model. Yang et al. [9], analyzing six chest X-ray datasets, confirmed that medical imaging models leverage demographic shortcuts in disease classification and that fairness achieved in the training distribution does not necessarily transfer to new deployment settings. Both findings are directly relevant to the Kermany dataset, whose population is exclusively pediatric, and they motivate the external, cross-population evaluation performed here.
These considerations motivate the two research questions that structure this work. RQ1: Do architectures published after 2020 (ConvNeXt, Swin Transformer, EfficientNetV2) outperform classical convolutional architectures on binary pneumonia detection under a unified experimental protocol? RQ2: Does intra-dataset performance predict an architecture's ability to generalize to populations and institutions different from those on which it was trained?
The present study addresses this gap through the following contributions: (a) a comparative evaluation of nine architectures under a unified experimental protocol, spanning classical convolutional, efficient-scaling, modern convolutional, and transformer-based designs; (b) a weighted soft-voting ensemble whose weights are optimized on the validation set rather than on the test set, with empirical quantification of the bias that the incorrect procedure would introduce; (c) a stratified re-partitioning of the dataset that addresses the limitation of the official validation split (16 images); (d) statistical validation of inter-architecture differences through McNemar tests with Bonferroni correction for multiple comparisons, complemented by 95% confidence intervals and a cross-seed stability analysis; (e) an interpretability analysis using Grad-CAM; (f) an ablation study that quantifies the individual contribution of each methodological component; (g) a cross-population and cross-institutional external evaluation on an independent dataset (RSNA) that quantifies the generalization gap; and (h) a computational efficiency analysis that assesses deployment feasibility. The remainder of the article is organized as follows: Section 2 reviews related work; Section 3 describes the materials and methods; Section 4 reports the results; Section 5 discusses the findings, limitations, and future research; and Section 6 presents the conclusions.
2. Related Work
The Chest X-Ray Images (Pneumonia) dataset, compiled by Kermany et al. [1] and published in Cell, is the standard benchmark for research on automated pediatric pneumonia detection. It comprises 5,856 anteroposterior chest radiographs collected from retrospective cohorts of patients aged one to five years at the Guangzhou Women and Children’s Medical Center, with diagnoses assessed by two expert physicians and independently reviewed by a third on the evaluation set.
In its publicly distributed version, the dataset comprises 4,273 pneumonia and 1,583 normal radiographs. The original public split reserves only 16 images for validation, a sample size insufficient for hyperparameter tuning and early-stopping decisions, which motivated the stratified re-partitioning described in Section 3.1.
Since its publication, numerous studies have evaluated deep learning architectures on this dataset. Chouhan et al. [10] demonstrated the feasibility of transfer learning without extensive preprocessing; Hashmi et al. [11] combined multiple pretrained architectures through weighted ensembling; and Kundu et al. [12] proposed a three-model ensemble with weights assigned according to multiple metrics, validated on both the Kermany and RSNA datasets, reaching 98.81% accuracy.
Regarding the individual architectures evaluated here, prior work has explored improved VGG16 variants [13], deep residual networks for pediatric diagnosis [14], different optimizers within transfer learning schemes [15,16], and direct comparisons among VGG16, ResNet50, and Xception [17], the latter being methodologically close to the present study.
The incorporation of Vision Transformers into this domain is more recent. Singh et al. [18] reported an efficient pneumonia-detection framework using Vision Transformers on chest radiographs, integrating self-attention mechanisms to capture global context and spatial relationships and reaching 97.61% accuracy, 95% sensitivity, and 98% specificity. This work is a central reference justifying the inclusion of ViT-B/16 as a comparative architecture in the present study.
The most directly comparable prior work is the PELM framework [19], published in Applied Sciences, which integrates four architectures (InceptionV3, VGG16, ResNet50, and Vision Transformer) through feature-level concatenation, evaluated on a curated dataset combining NIH ChestX-ray14, CheXpert, PadChest, and Kaggle CXR Pneumonia, and reaching 96% accuracy, 99% precision, 91% sensitivity, and 91% specificity in binary classification. The present study shares three of PELM’s four architectures and adds DenseNet121, EfficientNet-B4, EfficientNetV2-S, ConvNeXt-Tiny, and Swin-T, evaluating each individually before building a weighted soft-voting ensemble of the three best models on the same binary task.
Other ensemble studies have approached this domain differently. Mabrouk et al. [20] combined DenseNet169, MobileNetV2, and Vision Transformer through feature extraction, reaching 93.91% accuracy on the Kermany dataset. Rajeashwari and Arunesh [21] introduced a modified ensemble classifier with transfer learning to improve diagnosis from chest radiographs, and Trivedi and Gupta [22] proposed a lightweight architecture for automatic detection in resource-constrained environments.
Although the present study addresses binary classification, the finer bacterial-versus-viral distinction has been explored elsewhere. As summarized in the scoping review by Rickard et al. [7], several studies have applied transfer learning with convolutional architectures to this three-class problem, generally reporting lower performance than for binary disease-presence detection. This etiological distinction is proposed as an extension of the present work in Section 5.8.
Recent studies (2024–2025) have continued to evaluate these architectures in the same domain. On the Kermany et al. dataset, Chakraborty et al. [23] proposed DeepPneuNet; Bundea and Danciu [24] evaluated three DenseNet variants, reaching 96% accuracy; Katreddi et al. [25] compared DenseNet-169, DenseNet-121, and VGG16, finding that both DenseNet variants (91.66% and 90.41%) substantially outperformed VGG16 (76.63%), a ranking opposite to the one obtained here and discussed in Section 5.1; and Rabbah et al. [26] reached 97.2% with InceptionV3 combined with integrated gradients. Among the architectures evaluated here, Hroub et al. [27] compared 16 methods and found that InceptionV3 outperformed most of them; Hadhoud et al. [28] integrated ResNet50 with ViT-B/16, two architectures also evaluated in this work; and Kumaran et al. [29] combined VGG16, ResNet50, and InceptionV3 with Grad-CAM interpretability for lung cancer classification. Hybrid and explainable models have also been proposed by Zhou et al. [30], Fu et al. [31], and Huang et al. [32], the last of whom applied the McNemar test to validate inter-architecture differences statistically, a procedure the present study also adopts.
In parallel, the literature offers systematic reviews [7,33], lightweight architectures for resource-constrained settings [22], ensemble approaches [21], and VGG16-based architectures [13]. Table 1 synthesizes the studies most directly comparable to the present work.
Beyond the pneumonia literature, this work also builds on the authors’ recent contributions applying transfer learning and ensemble strategies to other medical imaging domains. López-Córdova et al. [34] combined ResNet50V2, DenseNet121, and InceptionV3 for pleural fluid cytological classification, finding that a two-model soft-voting ensemble generalized better externally (89.61%) than the full three-model ensemble despite a marginally lower local accuracy, a fragility pattern that parallels the external-validation findings in Section 4.7. Separately, Vega-Huerta et al. [35] compared six transfer learning and Vision Transformer architectures for cataract diagnosis from fundus images and likewise reported a marked accuracy drop on external validation (99.10% to 92.55%). Both studies reinforce, in independent imaging domains, the central argument of this work: intra-dataset performance is an unreliable predictor of cross-domain robustness, and external validation should be a standard component of architecture selection.

Table 1.
Synthesis of prior studies directly comparable on the dataset of Kermany et al. [1].
Table 1.
Synthesis of prior studies directly comparable on the dataset of Kermany et al. [1].
| Reference | Architecture(s) | Classes | Reported accuracy |
| Kermany et al. [1] | Custom CNN | 2 | 92.8% |
| Kundu et al. [12] | GoogLeNet, ResNet-18, DenseNet-121 (ensemble) | 2 | 98.81% |
| Mabrouk et al. [20] | DenseNet169, MobileNetV2, ViT (ensemble) | 2 | 93.91% |
| Singh et al. [18] | ViT (standalone) | 2 | 97.61% |
| Bundea and Danciu [24] | DenseNet121/169/201 | 2 | 96% |
| Katreddi et al. [25] | DenseNet-169/121, VGG16 | 2 | 91.66% (DenseNet-169) |
| Rabbah et al. [26] | InceptionV3 + integrated gradients | 2 | 97.2% |
| Yanar et al., PELM [19] | InceptionV3, VGG16, ResNet50, ViT (ensemble) | 2 | 96% |
| Rickard et al. [7] | Review of 35 studies | 3 | Median 91.8% (76.8–99.7%) |
| Present study | 9 architectures + weighted ensemble | 2 | 98.52% (ensemble) |
Note. Only studies employing the Kermany et al. dataset, or directly comparable in architecture or methodology, are included. The present study additionally reports statistical validation (McNemar), interpretability (Grad-CAM), an ablation study, a seed-stability analysis, and a cross-population external evaluation, elements absent from most of the studies listed.
3. Materials and Methods
3.1. Dataset
The present study uses the Chest X-Ray Images (Pneumonia) dataset, compiled by Kermany et al. [1] from retrospective pediatric cohorts at the Guangzhou Women and Children’s Medical Center, China, and distributed through Kaggle. The publicly distributed version contains 5,856 anteroposterior chest radiographs in two categories: Normal (1,583 images) and Pneumonia (4,273 images, pooling bacterial and viral cases). The present study addresses binary classification (Normal versus Pneumonia), the formulation most relevant to an automated screening system aimed at identifying disease presence and the one most commonly used in the comparable literature.
Because the original validation split contains only 16 images, insufficient for statistically reliable validation, the full dataset was re-partitioned through stratified random sampling (fixed seed = 42), preserving the original class proportions, into a nominal 70/15/15 training/validation/test split. Due to integer rounding within each class during stratified sampling, the realized proportions are approximately 70% training, 13% validation, and 17% test (see exact per-class figures in Table 2's note). During preprocessing, 624 images were excluded before the train/validation/test partitioning. Exact duplicate files were identified using file-level hashing. Because a file-level hash detects only byte-identical files, this procedure cannot identify visually similar (near-duplicate) images or different images from the same patient; it should therefore not be interpreted as patient-level deduplication, and it only reduces the risk of identical files being distributed across different partitions. The resulting working dataset contained 5,232 images. Consequently, although the preprocessing procedure reduces an important source of potential leakage, complete patient-level independence cannot be guaranteed from the publicly distributed metadata alone. Table 2 details the resulting composition.
3.2. Preprocessing and Data Augmentation
Training images were resized to the input resolution required by each architecture (224 × 224 pixels for EfficientNet-B4, ResNet50, DenseNet121, ViT-B/16, and VGG16, and 299 × 299 pixels for InceptionV3, a requirement specific to that architecture) and normalized using the ImageNet mean and standard deviation ([0.485, 0.456, 0.406] and [0.229, 0.224, 0.225], respectively, per RGB channel).
Stochastic data augmentation was applied to the training set: random horizontal flip (p = 0.5), random rotation (±10°), and brightness and contrast adjustment (±15%). Validation and test images were only resized and normalized, without augmentation, so that performance was evaluated on unaltered data.
3.3. Architectures Evaluated
Nine architectures were trained and evaluated. They were selected to represent distinct design families (classical convolutional, efficient-scaling, modern convolutional, and attention-based) and for their recurrent presence in recent medical image classification literature. Three of them (ConvNeXt-Tiny, Swin-T, and EfficientNetV2-S) were included specifically to test whether post-2020 architectural advances translate into an advantage in this domain.
The selected architectures span four design families. Among classical convolutional models: VGG16 [36], based on sequential 3 × 3 convolutions; ResNet50 [37], with residual connections that mitigate gradient vanishing; DenseNet121 [38], with dense connectivity favoring feature reuse; and InceptionV3 [39], with parallel multi-scale convolution modules.
Among efficient-scaling designs: EfficientNet-B4 [40] and EfficientNetV2-S [41], based on compound scaling of depth, width, and resolution. Among modern convolutional models: ConvNeXt-Tiny [4], which incorporates transformer-inspired design principles into a purely convolutional architecture. Among attention-based models: ViT-B/16 [3], which processes images as patch sequences without convolutions, and Swin-T [5], a hierarchical transformer with shifted windows.
All architectures were initialized with ImageNet-pretrained weights and fine-tuned end-to-end (full-parameter transfer learning) on the chest-radiograph domain, adapting the final classification layer to the study's two classes (Normal and Pneumonia).
3.4. Training Protocol
Table 3. summarizes the training hyperparameters applied uniformly across the nine architectures.
3.5. Evaluation Metrics
Performance was evaluated using accuracy, macro-averaged precision, macro-averaged recall (sensitivity), macro-averaged F1-score, and specificity, computed on the held-out test set (880 images) with scikit-learn. Specificity is the proportion of correctly identified normal cases. Particular attention was given to pneumonia-class sensitivity, since the costliest error in a screening system is classifying a pneumonia patient as normal (false negative). A full confusion matrix was generated for each architecture and for the ensemble. For the ensemble, Wilson 95% confidence intervals were also computed for pneumonia-class sensitivity, specificity, positive predictive value (PPV), and negative predictive value (NPV), derived from its confusion matrix.
3.6. Weighted Soft-Voting Ensemble
In addition to individual evaluation, an ensemble was built by combining the three best-performing models through weighted soft voting: each model’s softmax probability vector is multiplied by an assigned weight, and the weighted probabilities are summed for the final prediction. Optimal weights were determined by grid search on the validation set, not the test set, selecting the configuration that maximizes validation accuracy; the test set was not used to tune the weights, which avoids the optimistic bias that calibrating them on the reporting set would introduce. However, as explained below, the test set was not fully independent of the ensemble design, because it informed the choice of the component models. The magnitude of that bias was also quantified empirically by comparing both protocols (Section 4.11). This approach is consistent with reference frameworks such as PELM [19] and with other studies reporting that combining architectures improves on individual models.
This test-set independence applies strictly to weight optimization. The three component architectures themselves were chosen because they ranked highest in the initial test-set comparison (Table 4), so their selection was informed, indirectly, by the test set. Consequently, the reported ensemble accuracy should be read as an upper-bound estimate rather than as a fully test-independent figure, and the ensemble is described throughout as a validation-weighted ensemble with test-set selection leakage; Section 5.8 discusses this leakage and the nested cross-validation protocol recommended to eliminate it in future work.
3.7. Statistical Validation and Interpretability
To determine whether performance differences between architectures are statistically significant rather than due to sampling variability, the McNemar test [42] was applied to each pair of models, comparing paired per-image predictions and analyzing discordant cases (where one model succeeds and the other fails). Continuity correction was used and, when discordant pairs were few (fewer than 25), the exact version of the test was applied, at α = 0.05. Because 21 pairwise comparisons were performed, p-values were adjusted for multiplicity using the Bonferroni method (adjusted p = min[1, 21 × raw p]), which controls the family-wise error rate.
95% confidence intervals for accuracy were computed for each architecture using Wilson’s score interval [43], which is appropriate for binomial proportions and preferable to the normal approximation near the extremes of the range, as with accuracies above 95%. These intervals describe the precision of each estimate; pairwise inference relies on the McNemar test, because overlapping intervals do not by themselves demonstrate the absence of a difference. To assess the clinical plausibility of model decisions, Grad-CAM [44] was applied to InceptionV3 (the best-performing architecture, using its last convolutional block, Mixed_7c, as the target layer) and to DenseNet121 (denseblock4) for comparison. Grad-CAM produces heatmaps that weight each region’s contribution to the prediction, allowing verification of whether the model relies on anatomically relevant regions or on spurious artifacts, for representative examples of both classes.
3.8. Ablation Study Design
To quantify each methodological component's individual contribution, rather than reporting only aggregate performance, an ablation study was designed on DenseNet121, trained under three configurations: (A) full configuration, with ImageNet transfer learning and augmentation; (B) without transfer learning, training from randomly initialized weights; and (C) without data augmentation. All other settings, including the data split (seed 42), epochs, and optimizer, were held constant so that any performance difference is attributable to the ablated component. The ensemble's contribution is derived from comparing the weighted ensemble against the individual models of the main experiment.
3.9. Cross-Population External Evaluation Protocol
To assess generalization beyond the training domain, the RSNA Pneumonia Detection Challenge dataset [45] was used as an external set; it is an independent collection of adult chest radiographs from institutions in the United States. A balanced subset of 2,000 images (1,000 Normal and 1,000 Lung Opacity) was converted from DICOM to PNG using pydicom with intensity normalization. A balanced subset was used so that RSNA’s different class prevalence would not confound domain shift with class imbalance, while 1,000 images per class provide sufficient precision within the available computing resources; sampling used a fixed seed (42). RSNA’s third category (“No Lung Opacity/Not Normal”), covering non-pneumonia pathologies, was excluded because it has no equivalent in the binary class space on which the models were trained. Because the two datasets differ simultaneously in patient age (pediatric versus adult), institution and country, acquisition equipment and protocols, and reference standard (clinical diagnosis versus radiological lung opacity), this experiment measures the combined effect of age, institutional, acquisition, and label shifts, which cannot be attributed to any single factor.
The protocol keeps the external evaluation independent of model development: models were trained exclusively on the Kermany training set and evaluated on RSNA without retraining, fine-tuning, or domain adaptation of any kind. The ensemble evaluated externally uses a simple average of probabilities rather than the optimized weights from the main experiment, since optimizing on the external set would introduce target-domain information and compromise test validity.
3.10. Computational Efficiency Analysis
Because potential deployment depends on both accuracy and deployment feasibility, computational cost was characterized using three metrics: total trainable parameters, floating-point complexity per inference (GFLOPs, computed with fvcore at the input resolution used in training), and inference latency (average of twenty single-image inferences after warm-up). These metrics relate diagnostic performance to deployment cost, which is particularly relevant for healthcare facilities with limited computational infrastructure.
3.11. Experimental Configuration
3.11.1. Processing Workflow
The experimental workflow comprised the following stages, executed identically for all nine architectures: (1) download of the dataset from Kaggle; (2) organization into the two classes; (3) stratified re-partitioning (nominal 70/15/15, realized approximately 70/13/17; Section 3.1) with a fixed seed; (4) construction of DataLoaders at each architecture’s input resolution; (5) model initialization with ImageNet-pretrained weights and adaptation of the output layer; (6) training with early stopping and best-checkpoint selection by validation accuracy; (7) evaluation of each model and construction of the weighted ensemble; and (8) final evaluation of the ensemble on the held-out test set.
3.11.2. Architecture-Specific Considerations
InceptionV3 requires a 299x299-pixel input, unlike the other architectures (224x224 pixels), owing to its design. The timm implementation also includes an auxiliary output by default during training; this was disabled to keep optimization comparable across architectures, none of which include auxiliary outputs.
3.11.3. Reproducibility
A global random seed (value 42) was fixed in NumPy, PyTorch, and the dataset-partitioning process to support reproducibility of the stratified sampling. Nevertheless, certain GPU operations (particularly within cuDNN) can introduce minor non-deterministic variability between runs, a common limitation of deep network training on GPU that is explicitly acknowledged here.
4. Results
This section presents the experimental results obtained for the nine architectures evaluated and for the weighted soft-voting ensemble, computed on the held-out test set of 880 images (238 normal, 642 pneumonia).
4.1. Overall Performance by Architecture and Ensemble
Table 4 presents the global metrics obtained by each of the nine architectures and by the ensemble, ordered from highest to lowest accuracy.
All nine architectures exceeded 95% accuracy, confirming the maturity of transfer learning for binary pneumonia detection. InceptionV3 achieved the best individual performance (98.18% accuracy), followed by VGG16 (97.95%) and, tied, ConvNeXt-Tiny and Swin-T (97.61% each). The weighted soft-voting ensemble of the three best individual models outperformed all of them, reaching 98.52% accuracy with weights optimized on the validation set (Section 4.11); because its components were selected using test-set rankings, this value is an upper-bound estimate.
The most notable finding is that the three most recently designed architectures (ConvNeXt-Tiny, 2022; Swin-T, 2021; EfficientNetV2-S, 2021) did not outperform InceptionV3, published in 2016. ConvNeXt-Tiny and Swin-T tied for third place (97.61% each), and EfficientNetV2-S tied with ResNet50 for fifth place (96.93%), contrary to the expectation that more modern architectures should transfer their natural-image advantage to the medical domain. The most plausible interpretation is that the advantages of ConvNeXt and Swin, designed for texture- and context-rich natural images, do not materialize in a binary task with a comparatively simple, localized discriminative signal (pulmonary opacity) on grayscale radiographs. This finding is revisited in Section 5.2.
4.2. Ensemble Analysis and Class-Level Performance
In a potential pneumonia-screening support system, the most critical metric is pneumonia-class sensitivity: the ability to avoid passing off as healthy patients who actually have the disease (minimizing false negatives).
The ensemble correctly classified 637 of 642 pneumonia cases, a pneumonia-class sensitivity of 99.22% (95% CI: 98.19–99.67%): only 5 true cases were misclassified as normal. For the normal class, 230 of 238 cases were correctly identified (specificity 96.64%; 95% CI: 93.51–98.29%), with 8 false positives, which would trigger an additional specialist review rather than a missed diagnosis. The corresponding positive and negative predictive values were 98.76% (637/645; 95% CI: 97.57–99.37%) and 97.87% (230/235; 95% CI: 95.12–99.09%), respectively; these values depend on the pneumonia prevalence of the test set (73.0%) and would differ in populations with other prevalences. The pneumonia-class sensitivity (99.22%) differs from the macro-averaged sensitivity in Table 4 (97.93%), which is the mean recall of both classes and is equivalent to balanced accuracy, a metric less affected by the class imbalance of the working dataset (3,883 pneumonia versus 1,349 normal images).
4.3. Confusion Matrices
Figure 1 presents the confusion matrices on the test set. All models show a high proportion of correct predictions on the main diagonal. The ensemble shows the most balanced matrix, with only 13 errors out of 880 images (5 false negatives and 8 false positives).
4.4. Statistical Validation via the McNemar Test
To determine whether the observed performance differences are statistically significant or attributable to sampling variability, the McNemar test was applied to each pair of models, analyzing image-by-image disagreements. Table 5 presents the most relevant comparisons; continuity correction was used and, when discordant pairs were few, the exact version of the test. Both raw and Bonferroni-adjusted p-values are reported.
The statistical analysis reveals two consistent patterns. First, after Bonferroni correction, the comparisons involving EfficientNet-B4, the lowest-performing architecture, remained significant against the ensemble, InceptionV3, and VGG16, indicating that its lower accuracy is unlikely to be due to chance. In contrast, the comparisons ResNet50 versus InceptionV3 and ViT-B/16 versus the ensemble, which were significant at the uncorrected level, did not remain significant after correction. Second, the differences among the top-performing models (InceptionV3, VGG16, and the ensemble) were not statistically significant, either before or after correction. Non-significance does not demonstrate equivalence, but it shows that the test set provides no evidence to rank these models.
4.5. Interpretability via Grad-CAM
To assess whether model decisions are grounded in anatomically relevant regions, Grad-CAM [44] was applied to InceptionV3 (the best-performing architecture, recommended for deployment) and, for comparison, to DenseNet121, which was also used in the ablation study. Figure 2 presents InceptionV3 visualizations for examples of both classes.
The analysis reveals heterogeneous behavior that warrants detailed discussion. In correctly classified pneumonia cases, the strongest activations localize over pulmonary regions showing opacity or consolidation, in one example the right paracardiac region, coinciding with the areas a radiologist would examine to identify infiltrates. In normal cases, attention distributes over the lung fields and hilar region, consistent with a clear-parenchyma reading.
Notably, however, in one correctly classified pneumonia example the strongest activation lies at the upper-right edge of the image, over the shoulder and extra-thoracic background, entirely outside the pulmonary parenchyma. In other words, the model reaches the correct prediction while partly relying on information with no diagnostic meaning. The same pattern was observed in DenseNet121, ruling out an idiosyncrasy specific to a single architecture.
This finding connects directly with the central thesis of this work: a model reaching 98.18% intra-dataset accuracy while partly attending to extra-thoracic regions is exploiting dataset-specific spurious correlations, possibly related to patient positioning or acquisition artifacts. Such shortcuts work only while test images share training characteristics, and collapse under domain shift. Interpretability should therefore be understood not only as confirming what a model does well, but as a quality-control tool revealing fragilities that aggregate accuracy conceals, the same fragilities that external validation (Section 4.7) exposes quantitatively.
4.6. Ablation Study
To quantify the contribution of each component rather than reporting only overall performance, an ablation study was carried out on DenseNet121 under three configurations, holding constant the data split (seed 42), number of epochs, and remaining hyperparameters, and varying only the component under study. The contribution of the ensemble is derived from the comparison with the individual models reported in Section 4.1. Table 6 reports the results.
The results allow a quantified contribution to be attributed to each component: transfer learning from ImageNet-pretrained weights contributes +1.25 accuracy percentage points; data augmentation contributes +0.91 points; and the weighted ensemble contributes +0.22 points over the best individual model of its own run (98.52% versus 98.30%, Section 4.11). All three components contribute positively and consistently, with none proving redundant or counterproductive.
A finding warranting explicit discussion is that the model trained from scratch, without transfer learning, still reaches 96.36% accuracy, well above what would be expected under the common assumption that ImageNet pretraining is indispensable for medical imaging. The most plausible interpretation is that this binary task has sufficiently marked separability, and the training set sufficient size (approximately 3,662 images), for effective filters to be learned without prior knowledge. This does not invalidate transfer learning, which still provides the largest individual contribution and accelerates convergence, but tempers its necessity for this task and suggests its advantage may be smaller than commonly assumed in data-sufficient binary domains. Overall, the ablation shows the three components' improvements are real and consistent, though moderate (about 2.4 accumulated points), as expected near the task's performance ceiling.
4.7. Cross-Population External Evaluation (Kermany to RSNA)
This cross-population external evaluation addresses a limitation that Rickard et al. [7] identify as endemic in this field, where 31 of 35 reviewed studies rely exclusively on the Kermany et al. dataset. Three representative architectures (DenseNet121, InceptionV3, and VGG16) were trained only on the Kermany dataset and evaluated, without retraining, fine-tuning, or domain adaptation, on a balanced subset of 2,000 RSNA radiographs (1,000 normal and 1,000 with pulmonary opacity). The domains differ substantially: RSNA comprises an adult population (versus the pediatric population aged 1–5 years in the Kermany dataset), from institutions in the United States (versus Guangzhou, China), with different acquisition equipment and a labeling criterion based on pulmonary opacity rather than clinical diagnosis. RSNA’s ambiguous category was excluded because it has no equivalent in the models’ class space. Accordingly, this evaluation measures the combined effect of age, institutional, acquisition, and label shifts and should be interpreted as a robustness analysis rather than as a direct estimate of clinical performance in an equivalent pediatric population. Table 7 compares internal and external performance.
The results reveal three methodologically relevant findings. First, all models experience a substantial performance drop in the external domain, with gaps ranging from 11.63 to 37.90 percentage points. This degradation is expected given the magnitude of the between-dataset differences and shows that intra-dataset performance, however high, does not guarantee comparable performance in different populations and institutions; because several shifts act simultaneously, the drop cannot be attributed exclusively to visual domain shift.
Second, the magnitude of the degradation varies drastically among architectures that perform similarly in the internal domain. InceptionV3, which did not differ significantly from VGG16 according to the McNemar test (Section 4.4), generalizes markedly better (85.30% externally, −11.63 points), whereas VGG16 collapses severely (59.60%, −37.90 points). This shows that intra-dataset evaluation, the dominant practice in this literature, is insufficient to discriminate between architectures with very different generalization capacities, which supports the use of external validation as a model-selection criterion.
Third, the specificity analysis clarifies the failure: the drop concentrates in the Normal class, VGG16 misclassifies 801 of 1,000 normal adult radiographs as pneumonia (19.90% specificity), and DenseNet121 makes 376 such errors (62.40%), while sensitivity for the pathological class stays high. The most plausible interpretation is that the models learned a pediatric-specific representation of "normality" that does not transfer to adult anatomy, causing systematic over-diagnosis.
A fourth, counterintuitive finding deserves mention: the ensemble, which outperformed all individual models in the internal domain (98.07%), underperforms InceptionV3 evaluated alone in the external domain (78.75% versus 85.30%). This occurs because averaging probabilities incorporates VGG16's biased predictions, degrading the combined performance. This result qualifies the widely held assumption that ensembling systematically improves performance: under domain shift, an ensemble can be dragged down by its least robust components.
4.8. Computational Efficiency Analysis
The feasibility of deploying a diagnostic support system in real clinical settings, particularly in healthcare facilities with limited computational resources, precisely those where radiologist scarcity makes an automated screening system most valuable, depends not only on model accuracy but on computational cost. Table 8 contrasts each architecture's performance with its parameter count, floating-point complexity (GFLOPs), and inference latency.
The analysis reveals a marked dissociation between accuracy and cost. DenseNet121 reaches 96.70% accuracy with 6.96 million parameters, nineteen times fewer than VGG16 and twelve times fewer than ViT-B/16, at a cost of only 1.25 points relative to VGG16. Its latency (119.9 ms) is five times lower than VGG16's and three times lower than ViT-B/16's. VGG16 and ViT-B/16 show the worst performance-to-cost ratio: VGG16 has the most parameters without being the most accurate, and ViT-B/16 has the highest complexity (16.87 GFLOPs) while ranking fifth by accuracy. InceptionV3, the most accurate overall (98.18%), has an intermediate cost (21.79 million parameters, 5.73 GFLOPs), favorable on the accuracy-cost trade-off.
This gains relevance when combined with the cross-population external evaluation (Section 4.7). VGG16 combines the highest cost (134.27 million parameters, 599.7 ms) with the worst out-of-domain robustness (59.60% on RSNA), making it the least recommendable choice despite its competitive intra-dataset performance (97.95%). InceptionV3 shows the most balanced profile: the most accurate (98.18%), the most robust externally (85.30%), and with an intermediate cost, well below those of VGG16 and ViT-B/16. DenseNet121 offers the best cost–performance ratio for severely resource-constrained scenarios, with only 6.96 million parameters and an external robustness (78.75%) exceeding that of VGG16. Architecture selection should therefore combine accuracy, robustness to domain shift, and computational cost: InceptionV3 is preferable when sufficient resources are available, and DenseNet121 under severe computational constraints.
4.9. Stability Analysis Across Initialization Seeds
Deep neural network training involves multiple sources of randomness (classification-layer initialization, batch presentation order, stochastic data augmentation) that can introduce run-to-run variability. Reporting the result of a single run, a common practice in the literature, makes it impossible to distinguish a model's true performance from a favorable random fluctuation. To quantify this variability, the three best-performing architectures were retrained under three different initialization seeds (42, 123, and 2024), holding the data split and all other hyperparameters constant. Table 9 reports the resulting mean and standard deviation.
- The results show notable stability: all three architectures have standard deviations below 0.30 percentage points, indicating that reported performance is not an artifact of a particularly favorable initialization but a robust property of each model under this protocol. ConvNeXt-Tiny shows the lowest variability (SD = 0.13), while VGG16 shows the highest (SD = 0.28).
More importantly, the mean ± SD intervals for the three architectures overlap substantially: InceptionV3 [97.69, 98.15], ConvNeXt-Tiny [97.63, 97.89], and VGG16 [97.37, 97.93]. This converges independently with the conclusion of the McNemar test (Section 4.4): the high-performing architectures cannot be distinguished on this task. That two methodologically distinct approaches, paired-prediction comparison and cross-run variability, reach the same conclusion strengthens its robustness and warns against declaring a “winning” architecture from tenths-of-a-point differences in a single run.
4.10. Confidence Intervals and Precision of the Estimates
The 95% Wilson confidence intervals reported in Table 4 describe the precision of each accuracy estimate. The ensemble’s interval [97.49, 99.13] overlaps substantially with those of InceptionV3 [97.07, 98.88], VGG16 [96.79, 98.70], and ConvNeXt-Tiny and Swin-T [96.38, 98.43]; with differences of 0.34–0.91 points, a test set of 880 images cannot estimate these differences precisely. Because overlapping intervals do not by themselves demonstrate the absence of a difference, pairwise conclusions rest on the McNemar test (Section 4.4). EfficientNet-B4’s interval [93.48, 96.35], by contrast, does not overlap with those of the ensemble or InceptionV3, which is consistent with the significant Bonferroni-adjusted McNemar comparisons.
4.11. Quantification of Ensemble Optimization Bias
A common but methodologically questionable practice when building ensembles is to optimize combination weights directly on the test set on which performance is later reported, which introduces an optimistic bias because the selected configuration is, by construction, the one that maximizes the reported result. The present protocol avoids this by optimizing weights exclusively on the validation set (Section 3.6). To quantify the bias that the incorrect procedure would have introduced, which is useful for interpreting published results that do use it, both protocols were compared under controlled conditions (Table 10).
The quantified optimistic bias is 0.11 accuracy points (98.64% versus 98.52%), a modest magnitude attributable to the small search space (discrete three-weight combinations summing to one) and the similar individual performances of the combined models (98.30%, 98.07%, 97.95%), so no weight configuration can drastically alter the result. The weights selected by each protocol differ appreciably, (0.20, 0.30, 0.50) versus (0.40, 0.20, 0.40), yet the performance difference remains minimal, suggesting the ensemble is robust to weight choice within a reasonable range.
The adopted ensemble (Protocol B, 98.52%) outperforms the three architectures that compose it, InceptionV3 (98.30%), ConvNeXt-Tiny (98.07%), and VGG16 (97.95%), with weights selected without access to the test set; because the component models were selected using test-set rankings, this advantage should be interpreted as an upper-bound estimate.
5. Discussion
The experimental results yield several relevant findings regarding the comparative behavior of the nine architectures evaluated and of the weighted ensemble for binary pediatric pneumonia classification.
5.1. Overall Performance and Architecture Ranking
All nine architectures exceeded 95% accuracy, confirming the robustness of ImageNet-based transfer learning for this task. InceptionV3 achieved the best individual performance (98.18%), followed by VGG16 (97.95%) and, tied, ConvNeXt-Tiny and Swin-T (97.61%). DenseNet121, despite ranking seventh (96.70%), remained competitive, consistent with Katreddi et al. [25] and Bundea and Danciu [24], who also reported DenseNet as effective on this dataset. Katreddi et al., however, reported a ranking opposite to ours between DenseNet and VGG16; differences in training protocol and data partitioning may account for this discrepancy, which reinforces the value of comparing all architectures under a unified protocol. As detailed in Section 4.4, differences among the top-performing models compared in Table 5 (InceptionV3, VGG16, and the ensemble) were not statistically significant, so no single one can be claimed to be superior; the lower performance of EfficientNet-B4 (95.11%), by contrast, was significant and may reflect the need for more careful tuning of this architecture under the present protocol.
5.2. Do Modern Architectures Provide an Advantage? An Informative Negative Finding
Including ConvNeXt-Tiny (2022), Swin-T (2021), and EfficientNetV2-S (2021) tests a common assumption: that architectural advances validated on natural-vision benchmarks transfer automatically to medical imaging. The results do not support it. None of the three modern architectures outperformed InceptionV3 (2016): ConvNeXt-Tiny and Swin-T reached 97.61% and EfficientNetV2-S 96.93%, versus InceptionV3's 98.18%. VGG16 (2015), the oldest architecture evaluated, ranked second (97.95%).
A plausible explanation lies in the nature of the discriminative signal. ConvNeXt and Swin incorporate mechanisms, large kernels, shifted-window attention, hierarchical representations, designed to model complex, long-range dependencies in texture- and context-rich natural images. The task addressed here is comparatively simple and localized: detecting pulmonary opacity in grayscale radiographs. In that regime, the added capacity of modern architectures finds little structure to exploit, and their greater complexity may even hinder optimization with a moderately sized training set (about 3,662 images).
Surveys of Transformers in medical imaging attribute their appeal mainly to the capture of global context, in contrast to the local receptive fields of CNNs [6]. The present results indicate that, for a binary task whose discriminative signal is localized, this theoretical advantage did not translate into higher accuracy, either for the pure Transformer (ViT-B/16) or for the hierarchical one (Swin-T).
This finding is independently supported by Yanar et al. [46], who compared fourteen architectures, including CNNs, Transformers, and Mamba-type state-space models, under identical conditions on NIH ChestX-ray14 and found that the newest architectures (Mamba) were systematically outperformed by established CNNs and Transformers, with EfficientNet among the best overall performers. The convergence of both studies, on different datasets and tasks, suggests a domain-level pattern rather than an artifact: architecture selection for medical imaging should be guided by empirical evidence on the specific domain and task, not by design recency or natural-image benchmark performance. It is a negative but informative finding that discourages uncritical migration toward more complex and costlier architectures when classical ones suffice.
Training-induced variability is a recognized problem in medical imaging: Åkesson et al. [47] trained the same algorithm with fifty seeds and found statistically significant differences among runs, while Semmelrock et al. [48] identify seed reporting as essential for reproducibility. The stability analysis performed here (Section 4.9) supports two conclusions. First, the results are robust: standard deviations for the three best architectures stayed below 0.30 points across three runs, ruling out a fortunate initialization. Second, the mean ± SD intervals overlap among InceptionV3 (97.92 ± 0.23), ConvNeXt-Tiny (97.76 ± 0.13), and VGG16 (97.65 ± 0.28), confirming, independently of the McNemar test, that these architectures are not distinguishable in performance. This convergence underscores a broader problem in the literature: declaring a “winning” architecture from tenths-of-a-point differences in a single run lacks statistical support.
5.3. Ensemble Value and Potential Clinical Relevance
The weighted ensemble reached 98.52% accuracy, outperforming all individual models of its own run, including the best one (InceptionV3, 98.30%). This is consistent with the well-documented principle that combining architectures with partially independent errors produces a more robust classifier, as reported for PELM [19] and by Mabrouk et al. [20] and Kundu et al. [12]. Grid-search optimization assigned greater weight to the two best-performing models of the run (InceptionV3 and ConvNeXt-Tiny). As noted in Section 3.6, this advantage is an upper-bound estimate because the component models were selected using test-set rankings.
From a clinical perspective, the most relevant internal result is the ensemble’s pneumonia-class sensitivity of 99.22% (95% CI: 98.19–99.67%), with 5 of 642 test-set cases missed. In a screening context, a false negative is the costliest error, whereas the 8 false positives would trigger an additional radiologist review rather than a missed diagnosis. This balance suggests experimental screening potential. However, given the internal nature of these estimates, the drop observed in the external evaluation, and the absence of threshold-independent (ROC-AUC and PR-AUC) and calibration metrics, any use as a decision-support model remains subject to prospective, multi-institutional validation.
5.4. Comparison with the State of the Art
The ensemble’s accuracy (98.52%) is competitive with that of the main reference studies on binary pneumonia classification. It is higher than the values reported for PELM (96%) [19] and by Mabrouk et al. (93.91%) [20], and close to that of Kundu et al. (98.81%) [12] on the same dataset. Among individual architectures, InceptionV3 (98.18%) and VGG16 (97.95%) align with the best results reported by Bundea and Danciu [24] and Katreddi et al. [25]. These comparisons are indicative only, because the studies use different data partitions, preprocessing, and, in the case of PELM, a different composite dataset; in addition, the ensemble figure reported here is an upper-bound estimate (Section 3.6).
5.5. Interpretation of the Ablation Study
The ablation study (Section 4.6) empirically justifies each pipeline decision. All three components contribute positively: transfer learning (+1.25 points), data augmentation (+0.91 points), and the weighted ensemble (+0.22 points over the best individual model). None proved redundant, validating the proposed pipeline.
The magnitude of these contributions invites a nuanced reading. The model trained from scratch, without transfer learning, still reached 96.36% accuracy, only 1.25 points below the full configuration, contrasting with the common assumption that ImageNet pretraining is nearly indispensable for medical imaging. The most plausible explanation is that this binary task has marked class separability and a sufficiently large training set (about 3,662 images) for effective filters to be learned without prior knowledge. This suggests transfer learning's value may be greater in lower-data or finer-grained tasks, such as the bacterial/viral distinction, a hypothesis left for future work.
5.6. The Generalization Gap
The cross-population external evaluation (Section 4.7) is the most methodologically informative component of this study because it reveals differences in robustness that are not apparent from intra-dataset performance alone: the simple-average ensemble evaluated in that run reached 98.07% on the Kermany test set but dropped to 78.75% on RSNA. This degradation agrees with Hofmeister et al. [49] and falls within the range reported for domain shift in chest radiography [50,51,52], suggesting a systematic phenomenon rather than an artifact of this study, although in the present design age, institutional, acquisition, and label shifts act jointly.
The more significant finding is not the drop itself, which is expected given the between-domain differences, but its heterogeneity across architectures. Internally, InceptionV3, DenseNet121, and VGG16 performed similarly; externally, the same architectures scored 85.30%, 78.75%, and 59.60%, a spread of more than twenty-five points. Intra-dataset evaluation, the practice that Rickard et al. [7] report in 31 of 35 reviewed studies, proved unable to anticipate which architecture would be robust outside its training domain. Architecture selection based solely on intra-dataset performance can therefore lead to choosing a fragile model; external evaluation should be a selection criterion, not an optional addition.
The specificity analysis characterizes the failure mechanism: degradation concentrates in the Normal class (VGG16 misclassifies 801 of 1,000 healthy adults as pneumonia, 19.90% specificity), while sensitivity remains high. The models appear to have learned what a healthy pediatric chest looks like rather than what pneumonia looks like, treating any deviation, including a healthy adult chest of different anatomy, as abnormal. Deployed without adaptation in an adult population, such a system would generate an unacceptable rate of false positives.
Patient age is a plausible contributor to this failure mode. Because the Kermany cohort is exclusively pediatric and the RSNA cohort is adult, age is perfectly confounded with domain in this experiment. Brown et al. [8] illustrated precisely how age can act as a shortcut in chest radiograph models, and Yang et al. [9] showed that medical imaging models encode demographic attributes and that properties achieved in-distribution do not necessarily hold in new deployment settings. The Normal-class collapse observed here is consistent with such a mechanism, although the present design cannot isolate it; evaluating pediatric cohorts from other institutions would allow the age effect to be separated from the institutional effect.
Finally, ensemble behavior under domain shift challenges a common assumption. Internally, the ensemble outperformed all its components, in line with PELM [19], Kundu et al. [12], and Mabrouk et al. [20]. Externally, it underperformed InceptionV3 alone (78.75% versus 85.30%), because the average incorporates VGG16’s biased predictions. Ensembling does not automatically confer robustness to domain shift: its benefit depends on components failing independently, a condition that is violated when one of them degrades systematically. A clinical ensemble should therefore be validated externally rather than assumed adequate from intra-dataset performance alone.
5.7. Computational Efficiency and Deployment
The computational efficiency analysis (Section 4.8) adds a dimension usually absent from a literature that reports accuracy alone. The dissociation between performance and cost is pronounced: DenseNet121 reaches 96.70% accuracy with 6.96 million parameters, versus VGG16's 134.27 million (nineteen times more) for only 1.25 points higher accuracy. DenseNet121's latency (119.9 ms) is five times lower than VGG16's (599.7 ms). InceptionV3, the most accurate architecture (98.18%), requires only 21.79 million parameters, six times fewer than VGG16, showing that higher cost does not translate into better performance.
These analyses converge in the same direction. InceptionV3 combines the highest accuracy (98.18%), the highest out-of-domain robustness (85.30% versus VGG16's 59.60%), and an intermediate cost (21.79 million parameters), well below VGG16's and ViT-B/16's. VGG16 shows the opposite profile: the costliest architecture (134.27 million parameters) and the least robust to domain shift, despite competitive intra-dataset performance (97.95%). DenseNet121, though not the most accurate (96.70%, seventh place), offers the best cost-performance ratio for resource-constrained scenarios. This illustrates why architecture selection based solely on internal test-set accuracy can lead to suboptimal deployment decisions: VGG16 and DenseNet121 differ by only 1.25 points of internal accuracy but by 19.15 points of external robustness and a factor of nineteen in parameter count.
5.8. Limitations and Future Research
This work has limitations that should be stated transparently. First, training used a single-institution dataset (Guangzhou Medical Center) with an exclusively pediatric population; the external evaluation quantifies the cost of this restriction but does not resolve it, since real clinical use would require multi-institutional, multi-population data. Second, the external evaluation used a single dataset (RSNA) with a marked demographic difference (pediatric versus adult); part of the observed degradation may stem from the different labeling criterion (diagnosed pneumonia versus pulmonary opacity) rather than purely from visual domain shift, and multiple external datasets would help disentangle both effects. Third, although ensemble weights were optimized on the validation set, avoiding the optimistic bias quantified at 0.11 points (Section 4.11), the three architectures composing the ensemble were selected based on test-set performance from the initial comparison; this means the test set was not completely independent for that selection decision, even though it remained untouched for weight optimization. A stricter protocol would select that subset from validation performance as well, though the Bonferroni-corrected McNemar analysis (Section 4.4) found no significant differences among the top-performing models, which limits, but does not eliminate, the practical impact of this leakage; the reported ensemble performance should therefore be interpreted as an upper-bound estimate rather than a fully test-independent figure. Fourth, Grad-CAM revealed that even InceptionV3 occasionally relies on extra-thoracic regions to reach correct predictions, a behavior also seen in DenseNet121, suggesting that prior lung segmentation would help restrict model attention to the pulmonary parenchyma and eliminate acquisition-artifact shortcuts. Fifth, performance was reported with threshold-dependent metrics at the default decision threshold; ROC-AUC, PR-AUC, calibration (e.g., Brier score or calibration curves), and threshold analysis were not reported and should accompany any claim of clinical utility.
Future directions include: (a) extending the approach to three-class classification (Normal, Bacterial, and Viral), with techniques for class imbalance and the added difficulty of the etiological distinction; (b) extending the external evaluation to additional datasets (ChestX-ray14 and CheXpert) and to pediatric cohorts from other institutions, in order to disentangle demographic from institutional effects, and exploring domain adaptation and few-shot fine-tuning to reduce the generalization gap quantified here; (c) incorporating automatic lung segmentation so that model attention, verified through Grad-CAM, is restricted to the pulmonary parenchyma; and (d) closing the leakage identified in the third limitation by selecting ensemble components exclusively from training and validation data, ideally through nested cross-validation, or by reserving a final test set that is used only once, after every modeling decision (component selection and weight optimization alike) has been finalized, following the sequence training → validation → model and ensemble selection → final test → external evaluation; and (e) reporting ROC-AUC, PR-AUC, and calibration metrics for all models. Future reports would also benefit from following the CLAIM 2024 checklist [53], whose items on data sources, inclusion and exclusion criteria, and selection of data subsets are particularly relevant to the partitioning of the Kermany dataset discussed in Section 3.1.
6. Conclusions
This study examined two dominant assumptions in the deep learning literature on pneumonia detection, and the results answer both research questions negatively. Regarding RQ1, whether post-2020 architectures outperform classical convolutional models: they do not. None of the three modern architectures (ConvNeXt-Tiny, Swin-T, and EfficientNetV2-S) outperformed InceptionV3 (2016), which achieved the best individual accuracy (98.18%). This finding, independently supported by Yanar et al. [46] on a different dataset, suggests that architectural advantages conceived for natural images do not materialize in a binary task with marked separability on grayscale radiographs. Regarding RQ2, whether intra-dataset performance predicts generalization: it does not, and the implications are broader. The Bonferroni-corrected McNemar tests found no significant differences among the top-performing models, and the confidence intervals and cross-seed stability analysis are consistent with this result. On the external RSNA dataset, however, InceptionV3 and VGG16 scored 85.30% and 59.60%, respectively, a spread that intra-dataset evaluation could not anticipate, and the ensemble underperformed InceptionV3 alone. Both findings converge on one conclusion: publication recency and intra-dataset accuracy are poor indicators of robustness across populations and institutions, and external evaluation should be a selection criterion rather than an optional addition. The computational efficiency analysis reinforces this conclusion: InceptionV3 combines the highest accuracy, the highest external robustness, and an intermediate cost, whereas VGG16, competitive intra-dataset, is the costliest and least robust option. The work further contributes a reproducible protocol: ensemble weights optimized on validation data with the resulting bias explicitly quantified (0.11 points), ablation of each pipeline component, multiplicity-corrected statistical testing, and Grad-CAM interpretability; because the ensemble components were selected using test-set rankings, the internal ensemble result is reported as an upper-bound estimate. The limitations discussed in Section 5.8, single-institution training and external evaluation on one dataset with a marked demographic difference, bound the scope of these conclusions but not their direction.
Author Contributions
JJT; HVH; LGG: Conceptualization, Formal analysis, Methodology, Writing-original draft. JPC; RGC; JHLV; AMLF: Validation, Writing-review & editing, MC; JCLG; JIVF; ML: Formal analysis, Methodology, Writing – review & editing, visualization.
Funding
The author(s) declared that financial support was received for this work and/or its publication. This research was supported by Universidad Nacional Mayor de San Marcos - RR_007064-2026-R and Project number C26200181 - Project type PCONFIGI 2026.
Institutional Review Board Statement
Not applicable. This study analyzed only publicly available, de-identified datasets.
Informed Consent Statement
Not applicable.
Data Availability Statement
Publicly available datasets were analyzed in this study: the Chest X-Ray Images (Pneumonia) dataset [1] and the RSNA Pneumonia Detection Challenge dataset [45]. The data supporting the findings of this study are available at https://doi.org/10.5281/zenodo.18500873.
Conflicts of Interest
The authors declare no conflicts of interest.
References
- Kermany, D.S.; Goldbaum, M.; Cai, W.; Valentim, C.C.S.; Liang, H.; Baxter, S.L.; et al. Identifying Medical Diagnoses and Treatable Diseases by Image-Based Deep Learning. Cell 2018, 172, 1122–1131.e9. [CrossRef]
- Rajpurkar, P.; Irvin, J.; Zhu, K.; Yang, B.; Mehta, H.; Duan, T.; et al. CheXNet: Radiologist-Level Pneumonia Detection on Chest X-Rays with Deep Learning. arXiv 2017, arXiv:1711.05225. [CrossRef]
- Dosovitskiy, A.; Beyer, L.; Kolesnikov, A.; Weissenborn, D.; Zhai, X.; Unterthiner, T.; et al. An Image Is Worth 16x16 Words: Transformers for Image Recognition at Scale. In Proceedings of the 9th International Conference on Learning Representations (ICLR 2021), Virtual, 3–7 May 2021.
- Liu, Z.; Mao, H.; Wu, C.-Y.; Feichtenhofer, C.; Darrell, T.; Xie, S. A ConvNet for the 2020s. In Proceedings of the IEEE/CVF Conference on Computer Vision and Pattern Recognition (CVPR 2022), New Orleans, LA, USA, 18–24 June 2022; pp. 11976–11986. [CrossRef]
- Liu, Z.; Lin, Y.; Cao, Y.; Hu, H.; Wei, Y.; Zhang, Z.; Lin, S.; Guo, B. Swin Transformer: Hierarchical Vision Transformer Using Shifted Windows. In Proceedings of the IEEE/CVF International Conference on Computer Vision (ICCV 2021), Montreal, QC, Canada, 10–17 October 2021; pp. 10012–10022. [CrossRef]
- Shamshad, F.; Khan, S.; Zamir, S.W.; Khan, M.H.; Hayat, M.; Khan, F.S.; Fu, H. Transformers in Medical Imaging: A Survey. Med. Image Anal. 2023, 88, 102802. [CrossRef]
- Rickard, D.; Kabir, M.A.; Homaira, N. Machine Learning-Based Approaches for Distinguishing Viral and Bacterial Pneumonia in Paediatrics: A Scoping Review. Comput. Methods Programs Biomed. 2025, 268, 108802. [CrossRef]
- Brown, A.; Tomasev, N.; Freyberg, J.; Liu, Y.; Karthikesalingam, A.; Schrouff, J. Detecting Shortcut Learning for Fair Medical AI Using Shortcut Testing. Nat. Commun. 2023, 14, 4314. [CrossRef]
- Yang, Y.; Zhang, H.; Gichoya, J.W.; Katabi, D.; Ghassemi, M. The Limits of Fair Medical Imaging AI in Real-World Generalization. Nat. Med. 2024, 30, 2838–2848. [CrossRef]
- Chouhan, V.; Singh, S.K.; Khamparia, A.; Gupta, D.; Tiwari, P.; Moreira, C.; Damaševičius, R.; de Albuquerque, V.H.C. A Novel Transfer Learning Based Approach for Pneumonia Detection in Chest X-ray Images. Appl. Sci. 2020, 10, 559. [CrossRef]
- Hashmi, M.F.; Katiyar, S.; Keskar, A.G.; Bokde, N.D.; Geem, Z.W. Efficient Pneumonia Detection in Chest X-ray Images Using Deep Transfer Learning. Diagnostics 2020, 10, 417. [CrossRef]
- Kundu, R.; Das, R.; Geem, Z.W.; Han, G.-T.; Sarkar, R. Pneumonia Detection in Chest X-ray Images Using an Ensemble of Deep Learning Models. PLoS ONE 2021, 16, e0256630. [CrossRef]
- Jiang, Z.P.; Liu, Y.Y.; Shao, Z.E.; Huang, K.W. An Improved VGG16 Model for Pneumonia Image Classification. Appl. Sci. 2021, 11, 11185. [CrossRef]
- Liang, G.; Zheng, L. A Transfer Learning Method with Deep Residual Network for Pediatric Pneumonia Diagnosis. Comput. Methods Programs Biomed. 2020, 187, 104964. [CrossRef]
- anickam, A.; Jiang, J.; Zhou, Y.; Sagar, A.; Soundrapandiyan, R.; Dinesh Jackson Samuel, R. Automated Pneumonia Detection on Chest X-ray Images: A Deep Learning Approach with Different Optimizers and Transfer Learning Architectures. Measurement 2021, 184, 109953. [CrossRef]
- Jain, R.; Nagrath, P.; Kataria, G.; Sirish Kaushik, V.; Jude Hemanth, D. Pneumonia Detection in Chest X-ray Images Using Convolutional Neural Networks and Transfer Learning. Measurement 2020, 165, 108046. [CrossRef]
- Desai, A.B.; Gangodkar, D.R.; Pant, B.; Pant, K. Comparative Analysis Using Transfer Learning Models VGG16, ResNet50 and Xception to Predict Pneumonia. In Proceedings of the 2022 2nd International Conference on Innovative Sustainable Computational Technologies (CISCT), Dehradun, India, 23–24 December 2022; pp. 1–6. [CrossRef]
- Singh, S.; Kumar, M.; Kumar, A.; Verma, B.K.; Abhishek, K.; Selvarajan, S. Efficient Pneumonia Detection Using Vision Transformers on Chest X-rays. Sci. Rep. 2024, 14, 2487. [CrossRef]
- Yanar, E.; Hardalaç, F.; Ayturan, K. PELM: A Deep Learning Model for Early Detection of Pneumonia in Chest Radiography. Appl. Sci. 2025, 15, 6487. [CrossRef]
- Mabrouk, A.; Díaz Redondo, R.P.; Dahou, A.; Abd Elaziz, M.; Kayed, M. Pneumonia Detection on Chest X-ray Images Using Ensemble of Deep Convolutional Neural Networks. Appl. Sci. 2022, 12, 6448. [CrossRef]
- Rajeashwari, S.; Arunesh, K. Enhancing Pneumonia Diagnosis with Ensemble-Modified Classifier and Transfer Learning in Deep-CNN Based Classification of Chest Radiographs. Biomed. Signal Process. Control 2024, 93, 106130. [CrossRef]
- Trivedi, M.; Gupta, A. A Lightweight Deep Learning Architecture for the Automatic Detection of Pneumonia Using Chest X-ray Images. Multimed. Tools Appl. 2022, 81, 5515–5536. [CrossRef]
- Chakraborty, S.; Nag, T.; Pandey, S.K.; Ghosh, J.; Dey, L. Deep Learning and X-ray Imaging Innovations for Pneumonia Infection Diagnosis: Introducing DeepPneuNet. Comput. Intell. 2025, 41, e70029. [CrossRef]
- Bundea, M.; Danciu, G.M. Pneumonia Image Classification Using DenseNet Architecture. Information 2024, 15, 611. [CrossRef]
- Katreddi, S.; Midatani, A.; Roy, A.P.; Velpuri, U.; Kasani, S. Pediatric Pneumonia X-ray Image Classification: Predictive Model Development with DenseNet-169 Transfer Learning. J. Med. Artif. Intell. 2025, 8, 37. [CrossRef]
- Rabbah, J.; Ridouani, M.; Hassouni, L. Improving Pneumonia Diagnosis with High-Accuracy CNN-Based Chest X-ray Image Classification and Integrated Gradient. Biomed. Signal Process. Control 2025, 101, 107239. [CrossRef]
- Hroub, N.A.; Alsannaa, A.N.; Alowaifeer, M.; Alfarraj, M.; Okafor, E. Explainable Deep Learning Diagnostic System for Prediction of Lung Disease from Medical Images. Comput. Biol. Med. 2024, 170, 108012. [CrossRef]
- Hadhoud, Y.; Mekhaznia, T.; Bennour, A.; Amroune, M.; Kurdi, N.A.; Aborujilah, A.H.; Al-Sarem, M. From Binary to Multi-Class Classification: A Two-Step Hybrid CNN-ViT Model for Chest Disease Classification Based on X-ray Images. Diagnostics 2024, 14, 2754. [CrossRef]
- Kumaran S, Y.; Jeya, J.J.; R, M.T.; Khan, S.B.; Alzahrani, S.; Alojail, M. Explainable Lung Cancer Classification with Ensemble Transfer Learning of VGG16, ResNet50 and InceptionV3 Using Grad-CAM. BMC Med. Imaging 2024, 24, 176. [CrossRef]
- Zhou, T.; Peng, C.; Guo, Y.; Wang, H.; Niu, Y.; Lu, H. Identity-Mapping ResFormer: A Computer-Aided Diagnosis Model for Pneumonia X-ray Images. IEEE Trans. Instrum. Meas. 2025, 74, 1–12. [CrossRef]
- Fu, X.; Lin, R.; Du, W.; Tavares, A.; Liang, Y. Explainable Hybrid Transformer for Multi-Classification of Lung Disease Using Chest X-rays. Sci. Rep. 2025, 15, 6650. [CrossRef]
- Huang, K.A.; Choudhary, H.K.; Santiago, A.; Prakash, N.S. Squeeze-and-Excitation Enhanced Convolutional Neural Networks for Multi-Class Pneumonia Classification on Chest Radiographs. Cureus 2025, 17, e99649. [CrossRef]
- Khan, W.; Zaki, N.; Ali, L. Intelligent Pneumonia Identification from Chest X-rays: A Systematic Literature Review. IEEE Access 2021, 9, 51747–51771. [CrossRef]
- López-Córdova, F.; Vega-Huerta, H.; Maquen-Niño, G.L.E.; Cáceres-Pizarro, J.; Rodriguez, C.; Calderón, D.; Gamarra-Moreno, J.; De-la-Cruz-VdV, P.; Guerra-Grados, L.; Moquillaza-Henríquez, S.; et al. Ensemble Based in Transfer Learning for Cytological Classification in Pleural Fluid. Front. Digit. Health 2026, 8, 1849898. [CrossRef]
- Vega-Huerta, H.; Cuba-Aquino, C.I.; Suca-Mariño, G.M.; Adrianzén-Olano, I.; Maquen-Niño, G.L.E.; López-Córdova, F.; Lázaro-Guillermo, J.C.; Carrión-Barco, G.; Rodriguez-Zevallos, K.V.; Fuentes-Adrianzén, D.J.; et al. Transfer Learning and Vision Transformer for the Automatic Diagnosis of Cataracts in Ophthalmological Images. Front. Digit. Health 2026, 8, 1805311. [CrossRef]
- Simonyan, K.; Zisserman, A. Very Deep Convolutional Networks for Large-Scale Image Recognition. In Proceedings of the 3rd International Conference on Learning Representations (ICLR 2015), San Diego, CA, USA, 7–9 May 2015.
- He, K.; Zhang, X.; Ren, S.; Sun, J. Deep Residual Learning for Image Recognition. In Proceedings of the IEEE Conference on Computer Vision and Pattern Recognition (CVPR 2016), Las Vegas, NV, USA, 27–30 June 2016; pp. 770–778. [CrossRef]
- Huang, G.; Liu, Z.; van der Maaten, L.; Weinberger, K.Q. Densely Connected Convolutional Networks. In Proceedings of the IEEE Conference on Computer Vision and Pattern Recognition (CVPR 2017), Honolulu, HI, USA, 21–26 July 2017; pp. 4700–4708. [CrossRef]
- Szegedy, C.; Vanhoucke, V.; Ioffe, S.; Shlens, J.; Wojna, Z. Rethinking the Inception Architecture for Computer Vision. In Proceedings of the IEEE Conference on Computer Vision and Pattern Recognition (CVPR 2016), Las Vegas, NV, USA, 27–30 June 2016; pp. 2818–2826. [CrossRef]
- Tan, M.; Le, Q.V. EfficientNet: Rethinking Model Scaling for Convolutional Neural Networks. In Proceedings of the 36th International Conference on Machine Learning (ICML 2019), Long Beach, CA, USA, 9–15 June 2019; pp. 6105–6114.
- Tan, M.; Le, Q.V. EfficientNetV2: Smaller Models and Faster Training. In Proceedings of the 38th International Conference on Machine Learning (ICML 2021), Virtual, 18–24 July 2021; pp. 10096–10106.
- McNemar, Q. Note on the Sampling Error of the Difference between Correlated Proportions or Percentages. Psychometrika 1947, 12, 153–157. [CrossRef]
- Wilson, E.B. Probable Inference, the Law of Succession, and Statistical Inference. J. Am. Stat. Assoc. 1927, 22, 209–212. [CrossRef]
- Selvaraju, R.R.; Cogswell, M.; Das, A.; Vedantam, R.; Parikh, D.; Batra, D. Grad-CAM: Visual Explanations from Deep Networks via Gradient-Based Localization. Int. J. Comput. Vis. 2020, 128, 336–359. [CrossRef]
- Shih, G.; Wu, C.C.; Halabi, S.S.; Kohli, M.D.; Prevedello, L.M.; Cook, T.S.; Sharma, A.; Amorosa, J.K.; Arteaga, V.; Galperin-Aizenberg, M.; et al. Augmenting the National Institutes of Health Chest Radiograph Dataset with Expert Annotations of Possible Pneumonia. Radiol. Artif. Intell. 2019, 1, e180041. [CrossRef]
- Yanar, E.; Kutan, F.; Ayturan, K.; Kutbay, U.; Algın, O.; Hardalaç, F.; Ağıldere, A.M. A Comparative Analysis of the Mamba, Transformer, and CNN Architectures for Multi-Label Chest X-ray Anomaly Detection in the NIH ChestX-Ray14 Dataset. Diagnostics 2025, 15, 2215. [CrossRef]
- Åkesson, J.; Töger, J.; Heiberg, E. Random Effects during Training: Implications for Deep Learning-Based Medical Image Segmentation. Comput. Biol. Med. 2024, 180, 108944. [CrossRef]
- Semmelrock, H.; Ross-Hellauer, T.; Kopeinik, S.; Theiler, D.; Haberl, A.; Thalmann, S.; Kowald, D. Reproducibility in Machine-Learning-Based Research: Overview, Barriers, and Drivers. AI Mag. 2025, 46, e70002. [CrossRef]
- Hofmeister, J.; Garin, N.; Montet, X.; Scheffler, M.; Platon, A.; Poletti, P.-A.; Stirnemann, J.; Debray, M.-P.; Claessens, Y.-E.; Duval, X.; et al. Validating the Accuracy of Deep Learning for the Diagnosis of Pneumonia on Chest X-ray against a Robust Multimodal Reference Diagnosis: A Post Hoc Analysis of Two Prospective Studies. Eur. Radiol. Exp. 2024, 8, 20. [CrossRef]
- Musa, A.; Ibrahim Adamu, M.; Kakudi, H.A.; Hernandez, M.; Lawal, Y. Analyzing Cross-Population Domain Shift in Chest X-ray Image Classification and Mitigating the Gap with Deep Supervised Domain Adaptation. In Medical Image Computing and Computer Assisted Intervention—MICCAI 2024; Lecture Notes in Computer Science; Springer: Cham, Switzerland, 2024; Volume 15003, pp. 585–595. [CrossRef]
- Musa, A.; Prasad, R.; Hernandez, M. Addressing Cross-Population Domain Shift in Chest X-ray Classification through Supervised Adversarial Domain Adaptation. Sci. Rep. 2025, 15, 11383. [CrossRef]
- He, B.; Chen, Y.; Zhu, D.; Xu, Z. Domain Adaptation via Wasserstein Distance and Discrepancy Metric for Chest X-ray Image Classification. Sci. Rep. 2024, 14, 2690. [CrossRef]
- Tejani, A.S.; Klontzas, M.E.; Gatti, A.A.; Mongan, J.T.; Moy, L.; Park, S.H.; Kahn, C.E., Jr.; CLAIM 2024 Update Panel. Checklist for Artificial Intelligence in Medical Imaging (CLAIM): 2024 Update. Radiol. Artif. Intell. 2024, 6, e240300. [CrossRef]
Figure 1.
Confusion matrices for the nine architectures and for the weighted ensemble, evaluated on the test set (n = 880). Classes: Normal and Pneumonia.
Figure 1.
Confusion matrices for the nine architectures and for the weighted ensemble, evaluated on the test set (n = 880). Classes: Normal and Pneumonia.
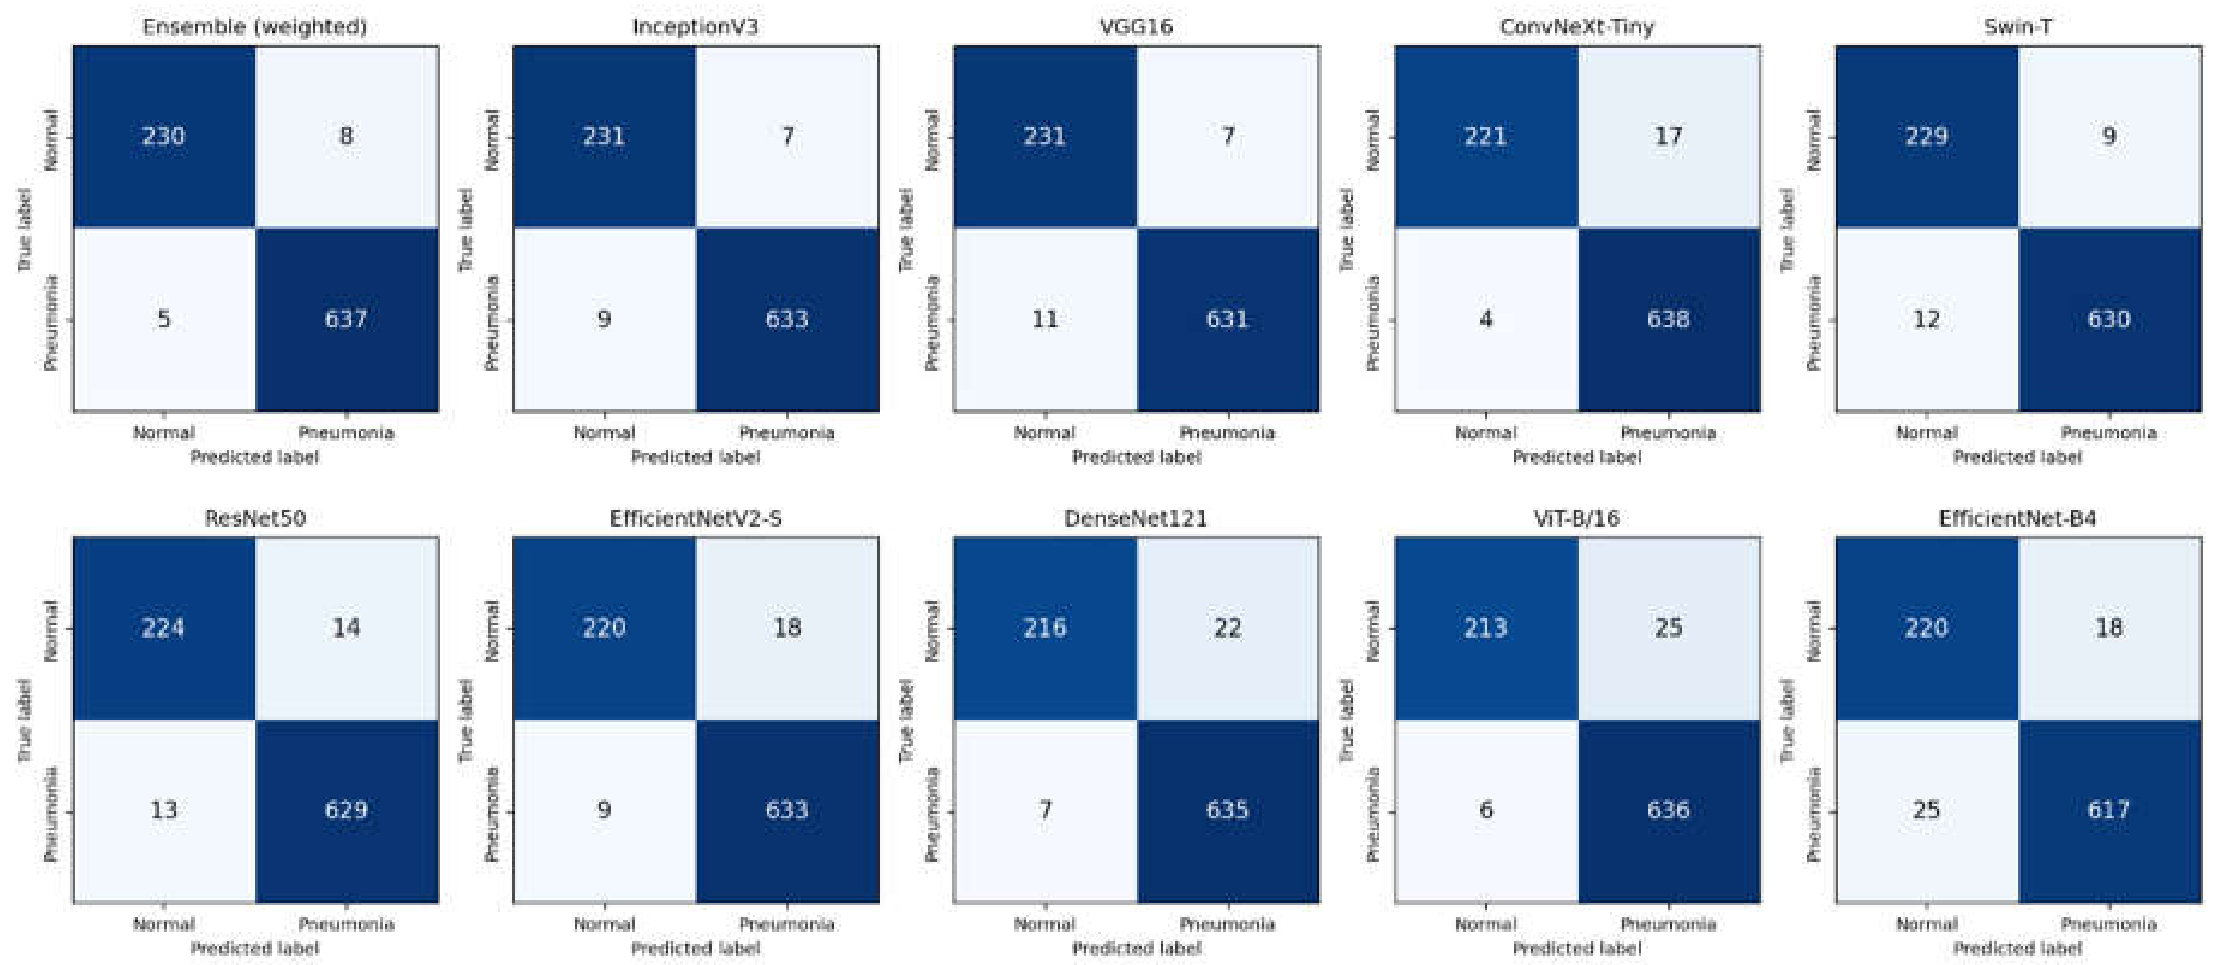
Figure 2.
Grad-CAM visualizations for InceptionV3 (recommended architecture) on examples of the Normal and Pneumonia classes. Each pair shows the original radiograph (left) and the overlaid heatmap (right).
Figure 2.
Grad-CAM visualizations for InceptionV3 (recommended architecture) on examples of the Normal and Pneumonia classes. Each pair shows the original radiograph (left) and the overlaid heatmap (right).
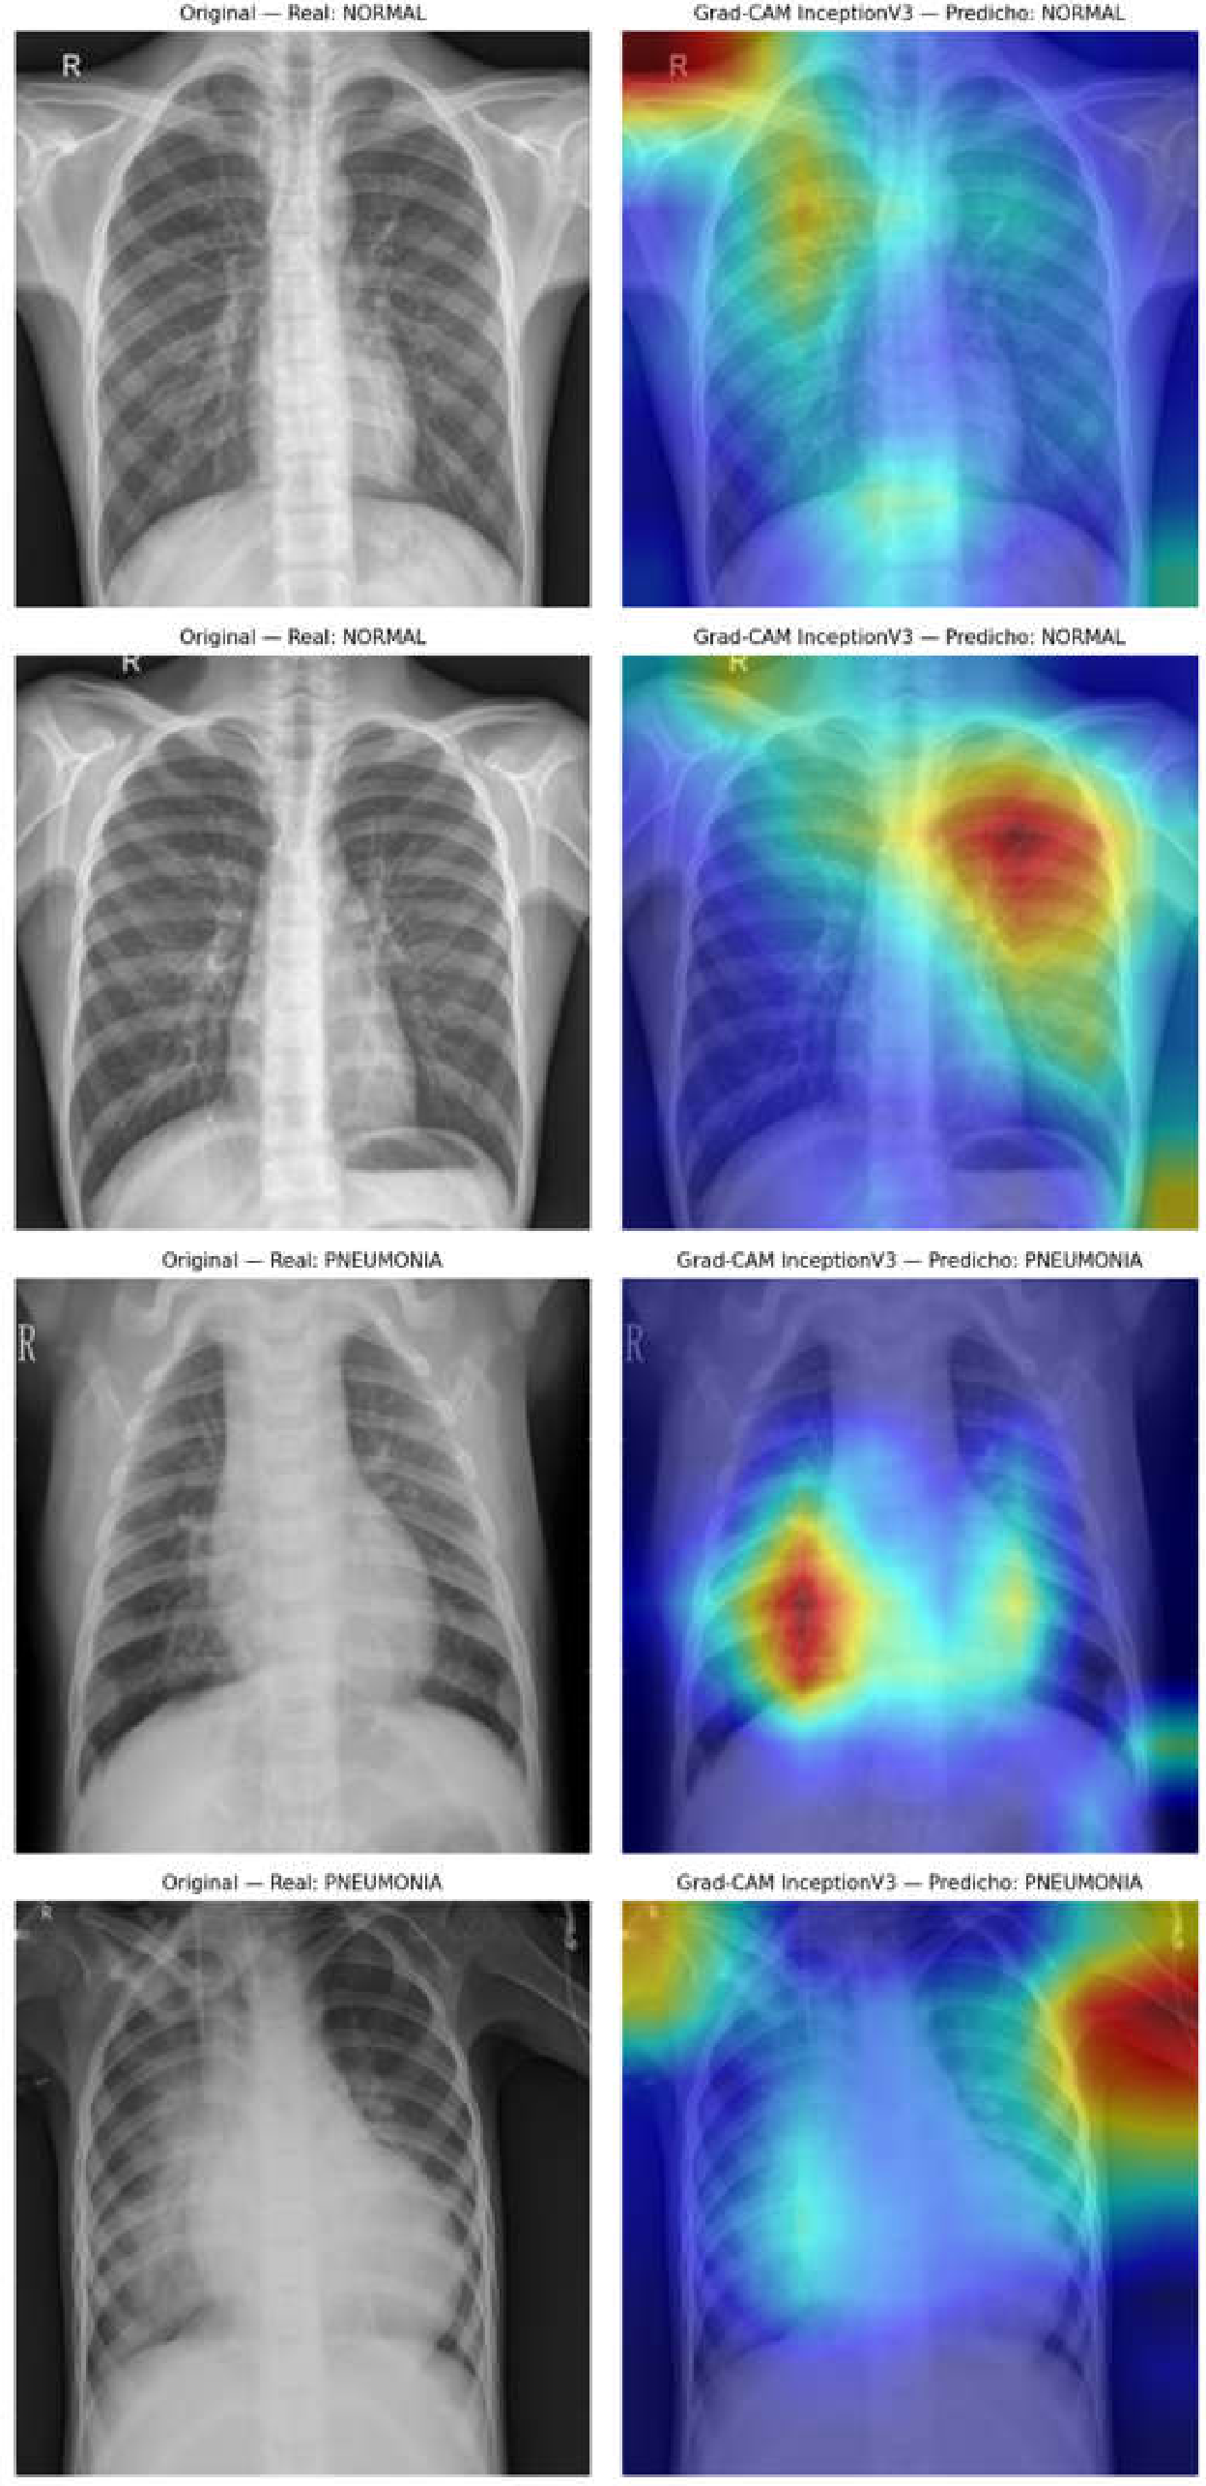
Table 2.
Class distribution in the re-partitioned working dataset (n = 5,232).
| Class | Training (70%) | Validation (13%) | Test (17%) | Total |
| Normal | 944 | 167 | 238 | 1,349 |
| Pneumonia | 2,718 | 523 | 642 | 3,883 |
| Total | 3,662 | 690 | 880 | 5,232 |
Note. The test-set count was confirmed directly from the confusion matrices obtained during evaluation (880 images: 238 normal, 642 pneumonia). The Pneumonia class pools bacterial and viral cases. A nominal 70/15/15 split was applied in a stratified manner within each class separately; integer rounding of class-wise counts yields realized proportions of 69.98/12.38/17.64% for Normal and 69.99/13.47/16.53% for Pneumonia (approximately 70/13/17% overall).
Table 3.
Training hyperparameter configuration.
| Parameter | Value |
| Epochs | 10 (with early stopping) |
| Batch size | 32 |
| Optimizer | AdamW (beta1 = 0.9, beta2 = 0.999, weight decay = 0.01) |
| Initial learning rate | 0.0001 |
| Learning-rate schedule | Cosine annealing |
| Loss function | Categorical cross-entropy |
| Pretraining | ImageNet |
| Best-model selection criterion | Highest validation accuracy |
| Random seed | 42 |
| Compute environment | NVIDIA T4 GPU (Google Colaboratory) |
| Framework | PyTorch 2.x, timm library |
Note. A maximum of 10 epochs was used with early stopping (patience of 4 epochs on validation accuracy), sufficient for convergence on this binary task; the best checkpoint of each model was selected according to validation accuracy.
Table 4.
Comparative performance of the nine architectures and the ensemble (test set, n = 880).
| Model | Accuracy (%) | 95% CI | Precision (%) | Sensitivity (%) | Specificity (%) | F1 (%) |
| Ensemble (validation-weighted; upper bound) | 98.52 | [97.49, 99.13] | 98.32 | 97.93 | 96.64 | 98.12 |
| InceptionV3 | 98.18 | [97.07, 98.88] | 97.58 | 97.83 | 97.06 | 97.70 |
| VGG16 | 97.95 | [96.79, 98.70] | 97.18 | 97.67 | 97.06 | 97.42 |
| ConvNeXt-Tiny | 97.61 | [96.38, 98.43] | 97.81 | 96.12 | 92.86 | 96.92 |
| Swin-T | 97.61 | [96.38, 98.43] | 96.81 | 97.17 | 96.22 | 96.99 |
| ResNet50 | 96.93 | [95.57, 97.88] | 96.17 | 96.05 | 94.12 | 96.11 |
| EfficientNetV2-S | 96.93 | [95.57, 97.88] | 96.65 | 95.52 | 92.44 | 96.07 |
| DenseNet121 | 96.70 | [95.31, 97.70] | 96.76 | 94.83 | 90.76 | 95.74 |
| ViT-B/16 | 96.48 | [95.04, 97.51] | 96.74 | 94.28 | 89.50 | 95.42 |
| EfficientNet-B4 | 95.11 | [93.48, 96.35] | 93.48 | 94.27 | 92.44 | 93.87 |
Note. The ensemble combines the three best individual models (InceptionV3, VGG16, ConvNeXt-Tiny) via weighted soft voting, weights (0.40, 0.20, 0.40) optimized on the validation set, not the test set (Section 4.11). Ensemble metrics correspond to an independent retraining run; individual accuracies in that run (InceptionV3 98.30%, ConvNeXt-Tiny 98.07%, VGG16 97.95%) differ slightly from this table due to training randomness (Section 4.9). Precision and sensitivity are macro-averaged; specificity is on the Normal class. 95% CIs via Wilson’s method. Because the three component models were selected using the initial test-set ranking, ensemble metrics are an upper-bound estimate (Section 3.6).
Table 5.
McNemar test: selected pairwise comparisons with Bonferroni-adjusted p-values (test set, n = 880).
Table 5.
McNemar test: selected pairwise comparisons with Bonferroni-adjusted p-values (test set, n = 880).
| Comparison | Statistic | p-value | Significant (raw p < 0.05) | Bonferroni-adjusted p | Significant (adjusted) |
| EfficientNet-B4 vs. Ensemble | 15.57 | < 0.001 | Yes | < 0.021 | Yes |
| EfficientNet-B4 vs. InceptionV3 | 12.41 | 0.0004 | Yes | 0.0084 | Yes |
| EfficientNet-B4 vs. VGG16 | 10.03 | 0.0015 | Yes | 0.0315 | Yes |
| ResNet50 vs. InceptionV3 | 5.00 | 0.0106 | Yes | 0.2226 | No |
| ViT-B/16 vs. Ensemble | 4.00 | 0.0490 | Yes | 1.000 | No |
| InceptionV3 vs. VGG16 | (exact test) | 0.6776 | No | 1.000 | No |
| InceptionV3 vs. Ensemble | 2.00 | 0.6875 | No | 1.000 | No |
| VGG16 vs. Ensemble | 2.00 | 0.1797 | No | 1.000 | No |
Note. Representative comparisons from the 21 performed are shown. The statistic is omitted when the exact version of the test was used owing to a low number of discordant pairs. Adjusted p = min(1, 21 × raw p).
Table 6.
Ablation study: contribution of each component (DenseNet121, test set).
| Configuration | Accuracy (%) | F1 (%) | Sensitivity (%) | Delta vs. full |
| A. Full (TL + augmentation) | 97.61 | 96.94 | 96.38 | - |
| B. Without transfer learning | 96.36 | 95.33 | 94.73 | -1.25 |
| C. Without data augmentation | 96.70 | 95.76 | 95.10 | -0.91 |
Note. TL = transfer learning. All configurations use DenseNet121 with an identical data split, seed, and hyperparameters; only the indicated component is altered. Delta is the difference in accuracy percentage points relative to the full configuration.
Table 7.
External evaluation: internal (Kermany) versus external (RSNA) performance.
| Model | Internal (%) | External (%) | Gap (pts) | External specificity (%) |
| InceptionV3 | 96.93 | 85.30 | -11.63 | 83.10 |
| DenseNet121 | 97.39 | 78.75 | -18.64 | 62.40 |
| Ensemble (average) | 98.07 | 78.75 | -19.32 | 61.70 |
| VGG16 | 97.50 | 59.60 | -37.90 | 19.90 |
Note. Models were trained exclusively on Kermany and evaluated on RSNA without retraining. The external evaluation used three representative architectures (DenseNet121, InceptionV3, VGG16) trained in an independent run; their internal accuracies differ slightly from those in Table 4 because they correspond to different runs. The ensemble uses a simple average of probabilities, without weight optimization on the external set, to avoid bias. External set: n = 2,000 (1,000 normal, 1,000 with pulmonary opacity).
Table 8.
Computational efficiency versus performance (subset of six architectures).
| Architecture | Accuracy (%) | Parameters (M) | GFLOPs | Latency (ms) |
| InceptionV3 | 98.18 | 21.79 | 5.73 | 229.1 |
| VGG16 | 97.95 | 134.27 | 15.47 | 599.7 |
| ResNet50 | 96.93 | 23.51 | 4.11 | 132.5 |
| DenseNet121 | 96.70 | 6.96 | 2.86 | 119.9 |
| ViT-B/16 | 96.48 | 85.80 | 16.87 | 354.6 |
| EfficientNet-B4 | 95.11 | 17.55 | 1.54 | 101.4 |
Note. Efficiency analysis was performed on the six architectures from the original comparison; the three added later (ConvNeXt-Tiny, Swin-T, EfficientNetV2-S) were not profiled, acknowledged as a limitation. Accuracies as in Table 4. GFLOPs computed at native resolution using fvcore. Latency is the average of 20 single-image inferences after warm-up, on CPU; absolute values would be lower on GPU, but relative ordering is preserved.
Table 9.
Stability of performance across initialization seeds (n = 3 seeds).
| Architecture | Accuracy (mean ± SD) | Range observed | Individual values |
| InceptionV3 | 97.92 ± 0.23 | 97.73–98.18 | 98.18; 97.73; 97.84 |
| ConvNeXt-Tiny | 97.76 ± 0.13 | 97.61–97.84 | 97.61; 97.84; 97.84 |
| VGG16 | 97.65 ± 0.28 | 97.39–97.95 | 97.95; 97.61; 97.39 |
Note. SD = sample standard deviation. Seeds used: 42, 123, and 2024. The data split is identical across all runs; only training randomness varies.
Table 10.
Comparison of ensemble weight-optimization protocols (test set, n = 880).
| Protocol | Weights (Inc., VGG, ConvNeXt) | Accuracy (%) | F1 (%) | Specificity (%) |
| A. Weights optimized on the test set (biased) | (0.20, 0.30, 0.50) | 98.64 | 98.26 | 96.64 |
| B. Weights optimized on the validation set (adopted) | (0.40, 0.20, 0.40) | 98.52 | 98.12 | 96.64 |
| Difference (optimistic bias) | - | +0.11 | +0.14 | 0.00 |
Note. Inc. = InceptionV3. Both protocols use the same three trained models and the same grid search; only the set on which weights are selected differs. Protocol B is the one adopted in the present study and reported in Table 4.
Disclaimer/Publisher’s Note: The statements, opinions and data contained in all publications are solely those of the individual author(s) and contributor(s) and not of MDPI and/or the editor(s). MDPI and/or the editor(s) disclaim responsibility for any injury to people or property resulting from any ideas, methods, instructions or products referred to in the content. |
© 2026 by the authors. Licensee MDPI, Basel, Switzerland. This article is an open access article distributed under the terms and conditions of the Creative Commons Attribution (CC BY) license (http://creativecommons.org/licenses/by/4.0/).
Copyright: This open access article is published under a Creative Commons CC BY 4.0 license, which permit the free download, distribution, and reuse, provided that the author and preprint are cited in any reuse.