

Submitted:
05 October 2026
Posted:
08 October 2026
You are already at the latest version
Abstract
Background/Objectives: Nonfunctioning pituitary neuroendocrine tumors (NF-PitNETs) frequently present with mass effect and may recur despite successful surgical treatment. Long-term outcomes from homogeneous surgical cohorts remain limited. Methods: We retrospectively reviewed consecutive patients who underwent microscopic transsphenoidal surgery (mTSS) of NF-PitNETs by a single surgeon at a tertiary center between 2003 and 2025. Demographic, radiographic, pathological, surgical, and follow-up data were analyzed. The primary outcome was recurrence, defined as loss of tumor control requiring additional treatment. Recurrence-free survival (RFS) was evaluated using Kaplan-Meier and Cox regression analyses. Results: A total of 381 patients were included with a median follow-up of 57 months. Median tumor size was 27 mm, and 98.5% were macroadenomas. Visual outcomes were available for 228 patients; 65.8% demonstrated postoperative improvement, while 4.8% worsened. Among 359 patients with available EOR data, GTR was achieved in 195 (54.3%), NTR in 89 (24.8%), and STR in 75 (20.9%). On multivariable logistic regression, Knosp grade >2 (OR 2.89, 95% CI 1.50-5.63; p=0.002) and subtotal resection (STR) (OR 7.62, 95% CI 3.25-17.83; p<0.001) were independently associated with recurrence. Cox regression demonstrated STR as the sole independent predictor of reduced RFS (HR 2.82, 95% CI 1.64-4.90; p<0.001). Conditioned RFS improved with longer recurrence-free intervals after GTR; however, late recurrences continued to occur, indicating persistent long-term risk. Conclusions: mTSS provides favorable visual outcomes and durable tumor control for most patients with NF-PitNETs. Knosp grade >2 and, particularly, STR are the strongest predictors of recurrence. Persistent late recurrence risk supports prolonged postoperative MRI surveillance.
Keywords:
nonfunctioning pituitary neuroendocrine tumor
; pituitary adenoma
; microscopic transsphenoidal surgery
; recurrence
; extent of resection
; long-term outcomes
; skull base surgery
; tumor control
1. Introduction
Pituitary neuroendocrine tumors (PitNETs), formerly classified as pituitary adenomas, account for approximately 10-15% of intracranial neoplasms in radiological and autopsy series, including 12.5% of adult intracranial tumors in U.S. national registry data[1,2,3]. Nonfunctioning PitNETs (NF-PitNETs) represent a major subgroup and are characterized by the absence of clinically significant hormonal hypersecretion[4]. Importantly, this is a clinical designation, as some NF-PitNETs may demonstrate hormone immunopositivity without hormone hypersecretion and are therefore classified as clinically silent tumors. [5]. Consequently, these tumors frequently remain clinically silent until they enlarge sufficiently to produce symptoms related to mass effect, including visual impairment and headaches[6]. Accordingly, NF-PitNETs often present as macroadenomas at the time of diagnosis and represent a substantial proportion of lesions treated in contemporary skull-base surgery practice[7].
Transsphenoidal surgery (TSS) remains the standard treatment for symptomatic NF-PitNETs and provides effective decompression of surrounding neurovascular structures[7]. Both microscopic and endoscopic techniques are well-established approaches, although endoscopic TSS has been commonly adopted because of its panoramic visualization and improved access to the sellar and parasellar regions[8]. Contemporary comparative studies suggest that endoscopic surgery may achieve higher rates of gross-total resection (GTR), while both approaches provide comparable perioperative safety and favorable visual outcomes[9]. Nevertheless, microscopic TSS (mTSS) still remains an effective surgical approach with well-established long-term outcomes[8]. Across published series, GTR rates range from approximately 60-90% and are strongly influenced by tumor characteristics and invasiveness[7,10]. Regardless of surgical approach, GTR remains challenging in tumors with invasive growth, particularly those involving the cavernous sinus[7,10].
Reported recurrence rates for NF-PitNETs vary considerably according to duration of follow-up, extent of resection (EOR), and use of adjuvant therapy. Recurrence has been reported in approximately 15% of patients after GTR but may exceed 50% among those with residual postoperative disease[11,12]. Previous investigations have identified residual tumor, cavernous sinus invasion, and extrasellar extension as important predictors of recurrence. These factors are interrelated, as larger and invasive tumors are less amenable to GTR, increasing residual disease and subsequent recurrence. Thus, postoperative residual tumor may be the most direct determinant of long-term tumor control[13,14,15,16,17].
Because NF-PitNETs often demonstrate indolent growth and recurrence risk persists even after prolonged periods of recurrence-free imaging following GTR, extended follow-up is required to accurately characterize recurrence patterns and durable tumor control[18,19]. However, relatively few studies have reported extended follow-up within a uniform treatment environment, and many are limited by multicenter heterogeneity, variability in surgical technique, or differences among treating surgeons. Furthermore, few investigations have combined extended follow-up with contemporary molecular classification to examine the potential contribution of molecular lineage to long-term outcomes. [7,20].
Accordingly, we evaluated the long-term surgical outcomes of patients with NF-PitNETs treated over a 22-year period by a single surgeon using a consistent mTSS. Our objectives were to assess visual outcomes, identify predictors of recurrence, and characterize long-term recurrence-free survival following surgical treatment. In the present study, available lineage-specific transcription-factor expression (SF1, PIT1, and TPIT) was incorporated as an exploratory analysis to characterize molecular subgroups and examine their relationship with recurrence. This large single-surgeon cohort with extended follow-up provides a unique opportunity to evaluate durable tumor control and factors associated with recurrence within a highly standardized treatment environment.
2. Materials and Methods
2.1. Study Design and Patient Population
We performed a retrospective cohort study of consecutive patients who underwent mTSS for a NF-PitNET at a tertiary-care institution between January 2003 and April 2025. All procedures were performed by a single neurosurgeon (J.P.C.) using a consistent microscopic transsphenoidal technique. Patients with pathologically confirmed NF-PitNETs and available clinical, radiographic, and follow-up data were included. For patients with multiple surgeries, the first surgery was considered the index procedure; subsequent surgery for radiographic recurrence or progression was recorded as a recurrence event rather than as a separate case. A total of 541 patients were screened, of whom 381 were included and 160 were excluded. Most exclusions were due to clinically functioning PitNETs, while 16 patients underwent craniotomy rather than microscopic transsphenoidal surgery. Additional exclusions included insufficient required data or follow-up and recurrent cases without available initial-surgery data.
Demographic, clinical, radiographic, pathological, operative, and follow-up data were collected from the electronic medical record following institutional review board approval (STU00201726). The requirement for informed consent was waived because of the retrospective nature of the study.
2.2. Clinical and Radiographic Assessment
Baseline demographic and clinical variables included age, sex, presenting symptoms, visual deficits, and radiographic characteristics. Preoperative magnetic resonance imaging (MRI) was reviewed to determine maximum tumor diameter, suprasellar extension, optic chiasm compression (chiasmal lift), cavernous sinus invasion (Knosp grading), and sellar invasion (Hardy-Wilson classification).
Tumors measuring ≥40 mm in maximal diameter were classified as giant adenomas. Chiasmal lift was measured on preoperative MRI and analyzed as a continuous variable. Tumor invasiveness was evaluated using the Knosp and Hardy-Wilson classification systems. MRI measurements were obtained from radiology reports and independently reviewed by two neurosurgeons (A.P. and J.P.C.). Discrepancies were resolved by consensus review of imaging. Tumors were classified as radiographically invasive if they demonstrated Knosp grade >2 (3-4) or Hardy-Wilson classification >IIC (grade III-IV or stage D-E), thereby incorporating complementary measures of cavernous sinus involvement, sellar destruction, and advanced extrasellar extension[11,21].
2.3. Surgical Treatment and EOR
All patients underwent mTSS, and EOR was determined using 3-month postoperative MRI and operative reports. Given the extended study period, MRI acquisition protocols evolved over time, and no single standardized protocol was applied throughout the cohort. However, all preoperative and postoperative examinations included dedicated MRI of the sellar and parasellar regions adequate for assessment of tumor extent and postoperative residual disease. EOR was categorized as GTR, near-total resection (NTR), and subtotal resection (STR). GTR indicated no visible residual tumor, NTR indicated minimal residual disease, and STR indicated definite residual tumor. These categories were analyzed separately in descriptive, recurrence, and survival analyses, with GTR as the reference category.
2.4. Histopathologic and Molecular Evaluation
Histopathological diagnosis was established by neuropathological review according to contemporary WHO criteria for PitNETs and was confirmed by our neuropathologist (P.J). A Ki-67 proliferation index ≥3% was used as the cutoff for increased proliferative activity, based on previously established prognostic classifications of PitNETs[22,23,24]. Immunohistochemical staining included pituitary hormones and lineage-specific transcription factors when available. Molecular lineage classification was performed in the subset of tumors with available immunohistochemical profiling and categorized as: SF1-lineage, PIT1-lineage, TPIT-lineage, or Null-cell tumors. Associations between molecular lineage and clinical outcomes, including recurrence, were explored.
2.5. Outcome Measures
The primary outcome was tumor recurrence. Recurrence was defined as loss of tumor control requiring additional treatment, including radiographic recurrence after GTR or radiographic progression of residual tumor after NTR or STR. Recurrence-free survival (RFS) was calculated from the date of first surgery to the date of first recurrence or last radiographic follow-up. For analytic purposes, recurrence and progression were combined as a single event reflecting loss of tumor control.
Secondary outcomes included postoperative visual outcomes, EOR, recurrence patterns, and RFS. Visual outcomes were determined from postoperative ophthalmologic and clinical evaluations and were categorized as improved, stable, or worsened.
2.6. Statistical Analysis
Continuous variables are presented as median and interquartile range (IQR), while categorical variables are presented as frequencies and percentages. Comparisons between groups were performed using the Mann-Whitney U test for continuous variables and the chi-square test or Fisher’s exact test for categorical variables, as appropriate.
EOR was entered into logistic and Cox regression models as a three-level categorical variable, with GTR as the reference category. Adjusted estimates were therefore calculated for NTR versus GTR and STR versus GTR. Visual outcomes were reported descriptively as improved, stable, or worsened. Paired changes in VFI were assessed using the Wilcoxon signed-rank test.
Factors associated with tumor recurrence were initially evaluated using univariable logistic regression analysis. Variables demonstrating statistical significance on univariable analysis or considered clinically relevant were subsequently entered into a multivariable logistic regression model to identify independent predictors of recurrence. Results are reported as odds ratios (ORs) with corresponding 95% confidence intervals (CIs).
RFS was estimated using the Kaplan-Meier method and compared between groups using the log-rank test. Univariable and multivariable Cox proportional hazards regression analyses were performed to identify factors associated with RFS. Results were reported as hazard ratios (HRs) with corresponding 95% CIs. Because follow-up duration varied substantially among patients, time-to-event analyses were considered the primary approach for evaluating recurrence patterns. Logistic regression analyses were additionally performed as complementary analyses to assess factors associated with the occurrence of recurrence during follow-up regardless of timing.
All statistical tests were two-sided, and a p-value < 0.05 was considered statistically significant. Missing data were handled by complete-case analysis. Statistical analyses were performed using R (R Foundation for Statistical Computing, Vienna, Austria) and SPSS software (IBM Corp., Armonk, NY, USA).
3. Results
3.1. Patient and Tumor Characteristics
A total of 381 patients underwent mTSS for NF-PitNETs during the study period. The cohort comprised 201 males (52.8%) and 180 females (47.2%), with a median age at surgery of 57 years (IQR 46-67). Median follow-up duration was 57 months (IQR 13.5-124.5) with a median tumor size of 27 millimeters, and 98.5% of tumors were macroadenomas. Visual outcomes were available for 228 patients. Vision improved in 150 patients (65.8%), remained stable in 67 (29.4%), and worsened in 11 (4.8%) (Table 1).
3.2. Surgical Outcomes and Complications
Among 359 patients with available EOR data, GTR was achieved in 195 (54.3%), NTR in 89 (24.8%), and STR in 75 (20.9%). GTR and NTR together accounted for 284 cases (79.1%). Overall surgical morbidity was low. The most common postoperative complication was cerebrospinal fluid (CSF) leak, occurring in 40 patients (10.5%). Postoperative diabetes insipidus (DI) developed in 63 patients (16.5%), including transient and permanent in 9.2% and 7.3%, respectively. Additionally, postoperative hemorrhagic events occurred in 20 patients (5.2%), one of whom sustained an intraoperative internal carotid artery injury. Table 2 shows postoperative consequences in detail.
3.3. Transcription-Factor Expression and Exploratory Lineage Analysis
Lineage-specific immunohistochemical profiling was available in a subset of tumors. Among tumors with available staining, SF1 expression was identified in 35 tumors, PIT1 expression in 14 tumors, and TPIT expression in 3 tumors. Five tumors were negative for all three transcription factors and were classified as null-cell tumors. Because expression of lineage-specific transcription factors was not mutually exclusive in all cases, transcription-factor positivity was analyzed descriptively rather than assigning tumors with overlapping expression to mutually exclusive lineage categories.
Among SF1-positive tumors, 10 of 35 (28.6%) experienced recurrence, whereas no recurrences were observed among null-cell and PIT1-positive tumors. One of three TPIT-positive tumors (33.3%) experienced recurrence. Given the small sample sizes, particularly for TPIT-positive and triple-negative tumors, and the presence of overlapping transcription-factor expression, these findings should be considered exploratory and descriptive rather than definitive evidence of lineage-specific differences in recurrence risk (Table 3).
3.4. Visual Outcomes
Visual outcome data were available for 228 patients. Among the 97 patients with paired preoperative and postoperative Visual Field Index (VFI) measurements, median VFI improved from 87.5% preoperatively to 96.0% postoperatively (Wilcoxon signed-rank test, p < 0.001) (Figure 1A).
Overall, surgical decompression resulted in favorable visual outcomes. At the last ophthalmologic follow-up, visual function improved in 150 patients (65.8%), remained stable in 67 patients (29.4%), and worsened in 11 patients (4.8%) (Figure 1B). Thus, nearly two-thirds of patients experienced objective visual improvement, whereas visual deterioration occurred in fewer than 5% of patients.
Patients with invasive tumors demonstrated substantially lower rates of GTR than patients with non-invasive tumors (Figure 2A). Invasiveness was also associated with a significantly increased risk of postoperative tumor recurrence (Figure 2B).
When individual radiographic invasion metrics were examined separately, Knosp grade >2 and Hardy-Wilson classification >IIC were each significantly associated with increased odds of STR and tumor recurrence (Figure 2C-D). Forest plot analysis demonstrated that invasiveness was among the strongest predictors of both STR and postoperative recurrence (Figure 2D). Notably, the invasiveness metric demonstrated effect sizes comparable to or greater than those observed for the individual Knosp and Hardy-Wilson classifications, suggesting that the combined metric may more comprehensively capture clinically relevant tumor invasion.
Overall, these findings indicate that radiographic invasiveness is strongly associated with reduced likelihood of GTR and increased risk of postoperative recurrence in patients with PitNETs.
3.5. Predictors of Recurrence
Follow-up data were available for 376 patients. Overall, 94 patients (25.0%) experienced tumor recurrence during follow-up. Recurrence occurred in 30 of 192 evaluable patients after GTR (15.6%), 20 of 89 after NTR (22.5%), and 42 of 74 after STR (56.8%). EOR was significantly associated with recurrence overall. EOR data were available for 359 patients, while 22 patients lacked sufficient documentation to permit EOR classification and were excluded from EOR-specific analyses (Supplementary Table S1). Among the 359 patients with documented EOR, recurrence status was available for 355 patients. Time-to-event analysis was further restricted to 342 patients with both documented EOR and adequate survival information.
On univariate analysis, giant PitNETs (≥40 mm), cavernous sinus invasion (Knosp grade >2), higher Hardy-Wilson classification (>IIC), increased chiasmal lift (>10 mm), and EOR were significantly associated with recurrence. Recurrence occurred in 43.1% of tumors ≥40 mm (p=0.002), 35.4% of tumors with Knosp grade >2 (p=0.0003), 40.4% of tumors with Hardy-Wilson classification >IIC (p=0.0005), and 32.2% of tumors with chiasmal lift >10 mm compared with 21.1% among tumors with chiasmal lift ≤10 mm (p=0.04). EOR demonstrated the strongest association with recurrence, with recurrence occurring in 15.6% (30/192) of patients who underwent GTR compared with 56.8% (42/74) of those who underwent STR (p<0.001). Age, sex, and Ki-67 index were not significantly associated with recurrence (Table 4, Figure 3).
After adjustment for relevant covariates, Knosp grade >2 remained independently associated with recurrence (adjusted OR 2.89, 95% CI 1.50-5.63, p=0.002). EOR also remained a significant predictor, with STR associated with more than sevenfold higher odds of recurrence compared with GTR (adjusted OR 7.62, 95% CI 3.25-17.83, p<0.001). Although chiasmal lift >10 mm was associated with recurrence on univariate analysis, this association did not remain significant after adjustment (adjusted OR 1.03, 95% CI 0.60-1.80, p=0.90), suggesting that its relationship with recurrence was explained by other tumor characteristics. Similarly, the association between tumor size and recurrence was attenuated after adjustment, indicating that the increased recurrence risk associated with larger tumors may be largely attributable to their greater invasiveness and lower likelihood of GTR. Age, sex, tumor size, Hardy-Wilson classification, chiasmal lift, and Ki-67 index were not independently associated with recurrence in the multivariable model (Table 5).
3.6. Recurrence-Free Survival (RFS)
Follow-up data were available for 376 patients. During the study period, 94 patients (25%) experienced tumor recurrence. Kaplan-Meier analysis demonstrated a gradual decline in RFS over time (Figure 4A). Patients with invasive tumors demonstrated a trend toward shorter RFS compared with patients without radiographic evidence of invasion, although this difference did not reach statistical significance (log-rank p=0.056; Figure 4B). Most patients remained recurrence-free throughout long-term follow-up; nevertheless, late recurrences continued to occur, underscoring the importance of prolonged radiographic surveillance after surgery.
Kaplan-Meier analysis demonstrated significant differences in RFS across EOR groups (overall log-rank p < 0.001; Figure 5), with STR showing the poorest RFS compared with GTR and NTR.
3.7. Conditioned RFS Following GTR
Among patients who achieved GTR and had evaluable time-to-event data, conditioned RFS was assessed at progressively longer recurrence-free landmarks. A total of 140 patients remained recurrence-free beyond 12 months, 106 beyond 36 months, 82 beyond 60 months, 65 beyond 84 months, 42 beyond 120 months, and 15 beyond 180 months. Conditioned RFS increased with longer recurrence-free intervals. At 10 years after resection, estimated RFS was 80.8% among patients recurrence-free beyond 12 months, 84.3% after 36 months, 87.9% after 60 months, and 91.6% after 84 months. Nevertheless, recurrence risk persisted during extended follow-up, with 20-year conditioned RFS estimates ranging from 25% to 37.5% across landmark groups. Estimates at the longest landmarks should be interpreted cautiously because of the progressively smaller numbers of patients remaining at risk (Table 6, Figure 6 and Figure 7).
On multivariable Cox proportional hazards analysis, STR remained independently associated with reduced RFS compared with GTR (adjusted HR 2.82, 95% CI 1.64-4.9; p < 0.001), whereas NTR was not independently associated with RFS (adjusted HR 1.61, 95% CI 0.90-2.88; p = 0.11). Tumor size, Knosp grade, and Hardy-Wilson grade were not independently associated with RFS (Table 7, Figure 8).
4. Discussion
In this cohort of patients with NF-PitNETs treated over two decades, mTSS resulted in favorable long-term outcomes, including substantial visual improvement, acceptable complication rates, and durable tumor control for most patients. The strengths of the present study include its large sample size, extended follow-up, and uniform surgical management within a single-center, single-surgeon practice. In an era when endoscopic surgery has become increasingly common, this cohort provides long-term outcome data from a consistently applied microscopic transsphenoidal technique. Together, these characteristics provide a robust assessment of long-term visual outcomes, recurrence patterns, and factors associated with postoperative tumor control.
Visual outcomes were particularly favorable in our study. Among patients with available ophthalmologic follow-up, 65.8% experienced improvement and fewer than 5% experienced visual deterioration. Paired visual field analyses further demonstrated significant postoperative improvement in VFI. The duration of visual symptoms was not consistently documented and therefore could not be evaluated as a predictor of recovery. Although tumor size and the severity of preoperative visual impairment may reflect the degree of optic pathway compromise, visual recovery is likely influenced by the chronicity and reversibility of compression rather than tumor size alone. Prior evidence suggests that longer duration of visual loss is associated with a reduced likelihood of postoperative improvement, while tumor dimensions may correlate with preoperative visual impairment without necessarily predicting postoperative recovery. These findings reinforce the established role of surgical decompression as the primary treatment for symptomatic NF-PitNETs presenting with optic apparatus compression[25,26,27]. Contemporary series continue to report substantial visual recovery following endoscopic resection, particularly when surgical intervention occurs before irreversible optic nerve injury develops[7,25,26,27,28]. The favorable visual outcomes observed in the current study further support early surgical intervention for symptomatic tumors producing chiasmal compression.
Tumor invasiveness emerged as a major determinant of both resectability and recurrence. Patients with invasive tumors demonstrated significantly lower rates of GTR and substantially higher recurrence rates, while Knosp grade >2 remained independently associated with recurrence after multivariable adjustment. These findings are biologically plausible because cavernous sinus invasion frequently limits the ability to achieve complete tumor removal without unacceptable neurovascular risk. Recent systematic reviews focused on Knosp grade 3-4 NF-PitNETs have similarly demonstrated low rates of GTR and substantially increased rates of residual disease and recurrence among invasive tumors[7,29,30]. Notably, cavernous sinus invasion predicted the occurrence of recurrence but was not independently associated with RFS after adjustment. This may reflect its close relationship with EOR, as cavernous sinus invasion limits GTR and increases the likelihood of residual disease. Thus, its effect on recurrence may be mediated partly through incomplete resection, with STR representing the more direct predictor of time-to-event recurrence[17]. Additionally, unlike logistic regression, Cox analysis accounts for variable follow-up duration and censoring, which may further explain the difference between these findings. Taken together, these observations suggest that radiographic invasion remains one of the most clinically relevant preoperative predictors of long-term outcome.
STR was the strongest independent predictor of both recurrence and reduced RFS in our study. Patients undergoing STR showed more than sevenfold higher odds of recurrence and nearly threefold greater hazards of recurrence compared with patients achieving GTR. These findings are in line with prior long-term studies[7,15,31]. Although tumor invasion contributes substantially to recurrence risk, our findings suggest that substantial residual disease, as represented by STR, is a major determinant of long-term tumor control. In contrast, NTR was not significantly associated with either recurrence or reduced RFS compared with GTR, suggesting that the prognostic effect of residual disease may depend on its extent. This observation is consistent with several surgical series demonstrating that residual postoperative disease is a stronger predictor of recurrence than demographic factors, tumor size, or proliferative markers[7,18]. Recent evidence further suggests that surgical strategies designed to maximize resection, including pseudocapsular dissection when anatomically feasible, may reduce the likelihood of long-term regrowth after NF-PitNET surgery[13,14,15,16,18].
Notably, Ki-67 index was not independently associated with recurrence in our cohort. Although proliferative indices have historically been proposed as markers of aggressive tumor behavior, increasing evidence suggests that their prognostic utility is limited when considered in isolation. Neither univariable nor multivariable analysis demonstrated a significant association between Ki-67 ≥3% and recurrence. This aligns with prior studies showing that radiographic invasion and postoperative residual disease are stronger predictors of outcome than proliferative markers alone[11,12,13]. Consequently, our findings support the growing consensus that proliferative markers should be interpreted alongside radiographic and surgical factors rather than being used as independent predictors of postoperative outcome.
A particularly important finding of the present study was the persistence of recurrence risk over extended periods of follow-up. Kaplan-Meier and conditioned survival analyses demonstrated that recurrence risk decreased with longer recurrence-free intervals but was not completely eliminated, even among patients who initially achieved GTR. Conditioned RFS improved at intermediate follow-up horizons as patients remained recurrence-free for longer periods. However, the apparent decline in long-term estimates and the small numbers remaining at risk at later landmarks indicate substantial uncertainty in the tail of the survival curves. These late estimates should therefore be interpreted cautiously and primarily support the persistence, rather than the precise magnitude, of long-term recurrence risk. These observations closely parallel prior reports demonstrating continued recurrence many years after apparently successful surgery[18,32,33]. Collectively, these results argue against discontinuation of imaging surveillance solely based on prolonged radiographic stability and support continued long-term follow-up, particularly in patients with invasive tumors or residual postoperative disease.
McClure et al. demonstrated a persistent annual recurrence hazard following GTR, with recurrences observed up to 13 years postoperatively and no identifiable point at which surveillance could safely be discontinued[18]. Similarly, our Kaplan-Meier analyses demonstrated a progressive decline in RFS over time, emphasizing that NF-PitNETs cannot be regarded as definitively cured after initial treatment. In our cohort, follow-up extended to 31.5 years, with 26 recurrences occurring more than 10 years after surgery and the latest documented recurrence occurring 28.1 years postoperatively. These findings support prolonged MRI surveillance, particularly in patients with invasive tumors or residual postoperative disease.
Overall, our findings support literature concepts in NF-PitNET management, indicating that durable tumor control is strongly influenced by the extent of residual disease and radiographic tumor invasion. However, the goal of surgery should remain maximal safe resection, with operative strategy individualized according to tumor extension, cavernous sinus involvement, and the risks of injury to adjacent neurovascular structures. In invasive tumors, planned residual disease may be preferable to aggressive resection when complete removal carries substantial morbidity, with subsequent surveillance or adjuvant therapy tailored to residual tumor behavior. While advances in molecular classification continue to improve understanding of PitNET biology, radiographic invasiveness and residual postoperative disease appear to be among the most clinically relevant predictors of long-term outcome. These results emphasize the importance of individualized surgical decision-making, risk stratification, and continued radiographic surveillance following surgery[17].
4.1. Strength and Limitations of the Study
Several limitations should be acknowledged. First, the retrospective design introduces the potential for selection bias, information bias, and incomplete follow-up. Second, transcription-factor profiling was available only for a subset of tumors, limiting statistical power for molecular analyses based on recent WHO classification. Accordingly, a subset of those more aggressive "non-functioning" tumors might have been non-diagnosed null-cell PitNETs[34]. Third, surgical techniques, imaging quality, reconstruction methods, and pathological classification evolved during the 22-year study interval and may have influenced outcome assessment. Finally, the single-center design may limit generalizability to other institutions with different referral patterns and surgical practices.
4.2. Future Directions
Future studies should prospectively validate these findings in larger multicenter cohorts using standardized imaging, surgical, pathological, and follow-up protocols. Comprehensive transcription-factor and molecular profiling should be incorporated to better define NF-PitNET subtypes, including true null-cell tumors, and determine whether molecular lineage provides prognostic information beyond established clinical and radiographic predictors.
5. Conclusions
In this cohort of NF-PitNETs, long-term tumor control was achieved in most patients. Knosp grade >2 was independently associated with the occurrence of recurrence, whereas STR was the strongest predictor of both recurrence and reduced RFS. NTR was not significantly different from GTR in adjusted recurrence or survival analyses. Recurrence remained possible after prolonged recurrence-free intervals, supporting continued long-term postoperative surveillance.
Supplementary Materials
The following supporting information can be downloaded at the website of this paper posted on Preprints.org, Table S1: Characteristics of the 22 patients excluded from EOR-specific analyses.
Author Contributions
Conceptualization, A.P.; formal analysis, A.P.; investigation, A.P.; data curation, A.P., E.H.; writing-original draft preparation, A.P., E.H., P.J.; writing-review and editing, A.P., E.H., P.J., J.P.C.; supervision, J.P.C.; project administration, J.P.C. All authors have read and agreed to the published version of the manuscript.
Funding
The presented work did not receive external funding.
Institutional Review Board Statement
The study was conducted in accordance with the Declaration of Helsinki and was approved by the Institutional Review Board of the Northwestern (STU00201726, and date of approval is 25 July 2025).
Informed Consent Statement
Patient consent was waived owing to the retrospective design of the study.
Data Availability Statement
The data that support the findings of this study are available from the corresponding author upon reasonable request.
Conflicts of Interest
The authors have no relevant conflicts of interest to disclose.
Abbreviations
The following abbreviations are used in this manuscript:
| NF-PitNETs | Nonfunctioning Pituitary Neuroendocrine Tumors |
| mTSS | microscopic transsphenoidal surgery |
| RFS | Recurrence-free survival |
| STR | subtotal resection |
| GTR | gross-total resection |
| EOR | extent of resection |
| MRI | magnetic resonance imaging |
| NTR | near-total resection |
| VFI | Visual Field Index |
References
- Wu, N.; Wu, N.; Wang, N.; Zhu, Y. Progress in the pathogenesis and treatment of pituitary neuroendocrine tumors (PitNETs): From molecular mechanisms to emerging therapies. Mol. Cell Probes 2025. 83, 102039. [Google Scholar] [CrossRef]
- Castellanos, L.; Gutierrez, C.; Smith, T.; Iorgulescu, B. EPID-14. EPIDEMIOLOGY OF ADULT PITUITARY TUMORS IN THE U.S. ACCORDING TO THE 2017 WHO CLASSIFICATION OF ENDOCRINOLOGY TUMOURS. Neuro-Oncology 2021, 23, vi88–vi89. [Google Scholar] [CrossRef]
- Batista, R.L.; Castinetti, F.; Naves, L.A. Management of aggressive PitNETs: evidence gaps, molecular clues, and a roadmap for clinical trials. Endocr.-Relat. Cancer 2026, 33. [Google Scholar] [CrossRef]
- Al-Shamkhi, N.; Berinder, K.; Borg, H.; Burman, P.; Dahlqvist, P.; Höybye, C.; Olsson, D.S.; Ragnarsson, O.; Ekman, B.; Engström, B.E. Pituitary function before and after surgery for nonfunctioning pituitary adenomas—data from the Swedish Pituitary Register. Eur. J. Endocrinol. 2023, 189, 217–224. [Google Scholar] [CrossRef]
- Cooper, O.; Melmed, S. Subclinical hyperfunctioning pituitary adenomas: The silent tumors. Best Pr. Res. Clin. Endocrinol. Metab. 2012, 26, 447–460. [Google Scholar] [CrossRef]
- Neto, Vieira L; Boguszewski, C.L.; Araújo, L.A.; Bronstein, M.D.; Miranda, P.A.; Musolino, N.R.; Naves, L.A.; Vilar, L.; Ribeiro-Oliveira, A.; Júnior; Gadelha, M.R. A review on the diagnosis and treatment of patients with clinically nonfunctioning pituitary adenoma by the Neuroendocrinology Department of the Brazilian Society of Endocrinology and Metabolism. Arch. Endocrinol. Metab. 2016, 60(4), 374–90. [Google Scholar] [CrossRef]
- Choo, Y.-H.; Seo, Y.; Kim, O.-L. The outcomes of surgical treatment via transsphenoidal approach for patients with nonfunctioning pituitary adenoma: a single institution’s experience. Ann. Med. 2022, 54, 3135–3144. [Google Scholar] [CrossRef]
- Dhandapani, S.; Singh, H.; Negm, H.M.; Cohen, S.; Anand, V.K.; Schwartz, T.H. Cavernous Sinus Invasion in Pituitary Adenomas: Systematic Review and Pooled Data Meta-Analysis of Radiologic Criteria and Comparison of Endoscopic and Microscopic Surgery. World Neurosurg. 2016, 96, 36–46. [Google Scholar] [CrossRef]
- Guo, S.; Wang, Z.; Kang, X.; Xin, W.; Li, X. A Meta-Analysis of Endoscopic vs. Microscopic Transsphenoidal Surgery for Non-functioning and Functioning Pituitary Adenomas: Comparisons of Efficacy and Safety. Front. Neurol. 2021, 12. [Google Scholar] [CrossRef]
- Vishwakarma, V.; Rai, S.; Jaiswal, A.K.; Mehrotra, A.; Verma, P.K.; Kumar, A.; Kanjilal, S.; Jaiswal, S.; Srivastava, A.K.; Das, K.K.; et al. Giant pituitary adenomas: efficacy, complications, and predictors of surgical outcome with endoscopic endonasal surgery. Egypt. J. Neurosurg. 2026, 41. [Google Scholar] [CrossRef]
- Lu, L.; Wan, X.; Xu, Y.; Chen, J.; Shu, K.; Lei, T. Prognostic Factors for Recurrence in Pituitary Adenomas: Recent Progress and Future Directions. Diagnostics 2022, 12, 977. [Google Scholar] [CrossRef]
- Chen, Y.; Wang, C.D.; Su, Z.P.; Chen, Y.X.; Cai, L.; Zhuge, Q.C.; Wu, Z.B. Natural history of postoperative nonfunctioning pituitary adenomas: a systematic review and meta-analysis. Neuroendocrinology 2012, 96(4), 333–42. [Google Scholar] [CrossRef]
- Greenman, Y.; Ouaknine, G.; Veshchev, I.; Reider-Groswasser, I.I.; Segev, Y.; Stern, N. Postoperative surveillance of clinically nonfunctioning pituitary macroadenomas: markers of tumour quiescence and regrowth. Clin. Endocrinol. 2003, 58, 763–769. [Google Scholar] [CrossRef]
- Losa, M.; Mortini, P.; Barzaghi, R.; Ribotto, P.; Terreni, M.R.; Marzoli, S.B.; Pieralli, S.; Giovanelli, M. Early results of surgery in patients with nonfunctioning pituitary adenoma and analysis of the risk of tumor recurrence. J. Neurosurg. 2008, 108, 525–532. [Google Scholar] [CrossRef]
- Brochier, S.; Galland, F.; Kujas, M.; Parker, F.; Gaillard, S.; Raftopoulos, C.; Young, J.; Alexopoulou, O.; Maiter, D.; Chanson, P. Factors predicting relapse of nonfunctioning pituitary macroadenomas after neurosurgery: a study of 142 patients. Eur. J. Endocrinol. 2010, 163, 193–200. [Google Scholar] [CrossRef]
- O’sullivan, E.P.; Woods, C.; Glynn, N.; Behan, L.A.; Crowley, R.; O’kelly, P.; Smith, D.; Thompson, C.J.; Agha, A. The natural history of surgically treated but radiotherapy-naïve nonfunctioning pituitary adenomas. Clin. Endocrinol. 2009, 71, 709–714. [Google Scholar] [CrossRef]
- Hwang, J.; Seol, H.J.; Nam, D.-H.; Lee, J.-I.; Lee, M.H.; Kong, D.-S. Therapeutic Strategy for Cavernous Sinus-Invading Non-Functioning Pituitary Adenomas Based on the Modified Knosp Grading System. Brain Tumor Res. Treat. 2016, 4, 63–69. [Google Scholar] [CrossRef]
- McClure, J.J.; Chatrath, A.; Robison, T.R.; Jane, J.A. Conditioned recurrence-free survival following gross-total resection of nonfunctioning pituitary adenoma: a single-surgeon, single-center retrospective study. J. Neurosurg. 2024, 140, 1614–1619. [Google Scholar] [CrossRef]
- Whyte, E.; Nezu, M.; Chik, C.; Tateno, T. Update on Current Evidence for the Diagnosis and Management of Nonfunctioning Pituitary Neuroendocrine Tumors. Endocrinol. Metab. 2023, 38, 631–654. [Google Scholar] [CrossRef]
- Saju, A.C.; Krishnatry, R.; Goda, J.S.; Chatterjee, A.; Uke, A.; Sahu, A.; Sahay, A.; Epari, S.; Madan, S.; Dasgupta, A.; et al. Tumor Control and Long-Term Survival in Non-Functional Pituitary Adenoma Treated with Adjuvant Radiotherapy. A Retrospective Single Institutional Study. Neurol. India 2025, 73, 257–263. [Google Scholar] [CrossRef]
- Araujo-Castro, M.; Cancela, A.A.; Vior, C.; Pascual-Corrales, E.; Berrocal, V.R. Radiological Knosp, Revised-Knosp, and Hardy–Wilson Classifications for the Prediction of Surgical Outcomes in the Endoscopic Endonasal Surgery of Pituitary Adenomas: Study of 228 Cases. Front. Oncol. 2022, 11, 807040. [Google Scholar] [CrossRef]
- Alimohamadi, M.; Ownagh, V.; Mahouzi, L.; Ostovar, A.; Abbassioun, K.; Amirjmshidi, A. The impact of immunohistochemical markers of Ki-67 and p53 on the long-term outcome of growth hormone-secreting pituitary adenomas: A cohort study. Asian J. Neurosurg. 2014, 9, 130–136. [Google Scholar] [CrossRef]
- Stefanidis, P.; Kyriakopoulos, G.; Seretis, A.M.; Korfias, S.; Theocharis, S.; Angelousi, A. Prognostic Factors for Invasiveness and Recurrence of Pituitary Adenomas: A Series of 94 Patients. Diagnostics 2022, 12, 2413. [Google Scholar] [CrossRef]
- Ferreira, M.J.; Salazar, C.; Costa, C.; Gonçalves, V.; Belo, S.; Pedro, J.; Freitas, P.; Castedo, J.L.; Pereira, J.; Silva, R.; et al. MON-417 Is There a Cut-Off of Ki-67 Indicative of Pituitary Carcinoma? J. Endocr. Soc. 2019, 3. [Google Scholar] [CrossRef]
- Fredes, F.; Undurraga, G.; Rojas, P.; Constanzo, F.; Lazcano, C.; Pinto, J.; Schmidt, T. Visual Outcomes after Endoscopic Pituitary Surgery in Patients Presenting with Preoperative Visual Deficits. J. Neurol. Surg. Part B Skull Base 2017, 78, 461–465. [Google Scholar] [CrossRef]
- Fonk, L.Z.-G.; Tabak, M.; Notting, F.I.; Verbist, B.M.; Najafabadi, A.H.Z.; van Vught, L.; Luyten, G.P.M.; Verstegen, M.J.T.; van der Meeren, S.W.; Biermasz, N.R.; et al. Preoperative radiological compression features and their relationship with pre- and postoperative visual field defects in pituitary macroadenomas: a retrospective cohort from the neuro-ophthalmological clinic. Front. Ophthalmol. 2026, 6, 1724655. [Google Scholar] [CrossRef]
- Kerrison, J.B.; Lynn, M.J.; A Baer, C.; A Newman, S.; Biousse, V.; Newman, N.J. Stages of improvement in visual fields after pituitary tumor resection. Arch. Ophthalmol. 2000, 130, 813–820. [Google Scholar] [CrossRef]
- Uvelius, E.; Valdemarsson, S.; Bengzon, J.; Hammar, B.; Siesjö, P. Visual acuity in patients with non-functioning pituitary adenoma: Prognostic factors and long-term outcome after surgery. Brain Spine 2023, 3, 102667. [Google Scholar] [CrossRef]
- Mohyeldin, A.; Katznelson, L.J.; Hoffman, A.R.; Asmaro, K.; Ahmadian, S.S.; Eltobgy, M.M.; Nayak, J.V.; Patel, Z.M.; Hwang, P.H.; Fernandez-Miranda, J.C. Prospective intraoperative and histologic evaluation of cavernous sinus medial wall invasion by pituitary adenomas and its implications for acromegaly remission outcomes. Sci. Rep. 2022, 12, 1–13. [Google Scholar] [CrossRef]
- Dallapiazza, R.; Bond, A.E.; Grober, Y.; Louis, R.G.; Payne, S.C.; Oldfield, E.H.; Jane, J.A. Retrospective analysis of a concurrent series of microscopic versus endoscopic transsphenoidal surgeries for Knosp Grades 0–2 nonfunctioning pituitary macroadenomas at a single institution. J. Neurosurg. 2014, 121, 511–517. [Google Scholar] [CrossRef]
- Lee, M.H.; Lee, J.H.; Seol, H.J.; Lee, J.-I.; Kim, J.H.; Kong, D.-S.; Nam, D.-H. Clinical Concerns about Recurrence of Non-Functioning Pituitary Adenoma. Brain Tumor Res. Treat. 2016, 4, 1–7. [Google Scholar] [CrossRef]
- Portovedo, S.; Neto, L.V.; Soares, P.; de Carvalho, D.P.; Takiya, C.M.; Miranda-Alves, L. Aggressive nonfunctioning pituitary neuroendocrine tumors. Brain Tumor Pathol. 2022, 39, 183–199. [Google Scholar] [CrossRef]
- Taguchi, A.; Kinoshita, Y.; Amatya, V.J.; Onishi, S.; Go, Y.; Tominaga, A.; Takeshima, Y.; Yamasaki, F.; Horie, N. Differences in invasiveness and recurrence rate among nonfunctioning pituitary neuroendocrine tumors depending on tumor subtype. Neurosurg. Rev. 2023, 46, 1–9. [Google Scholar] [CrossRef]
- Almeida, J.P.; Stephens, C.C.; Eschbacher, J.M.; Felicella, M.M.; Yuen, K.C.J.; White, W.L.; Mooney, M.A.; Bernat, A.L.; Mete, O.; Zadeh, G.; et al. Clinical, pathologic, and imaging characteristics of pituitary null cell adenomas as defined according to the 2017 World Health Organization criteria: a case series from two pituitary centers. Pituitary 2019, 22, 514–519. [Google Scholar] [CrossRef]
Figure 1.
Visual outcomes following resection of NF-PitNETs. (A) Paired preoperative and postoperative VFI measurements demonstrating significant improvement in visual field function following surgery (p < 0.001, Wilcoxon signed-rank test) (Each thin line connects an individual patient’s preoperative and postoperative VFI measurements, with green indicating improvement and red indicating worsening). (B) Distribution of visual outcomes at the last ophthalmologic follow-up among 228 patients with available visual outcome data.
Figure 1.
Visual outcomes following resection of NF-PitNETs. (A) Paired preoperative and postoperative VFI measurements demonstrating significant improvement in visual field function following surgery (p < 0.001, Wilcoxon signed-rank test) (Each thin line connects an individual patient’s preoperative and postoperative VFI measurements, with green indicating improvement and red indicating worsening). (B) Distribution of visual outcomes at the last ophthalmologic follow-up among 228 patients with available visual outcome data.
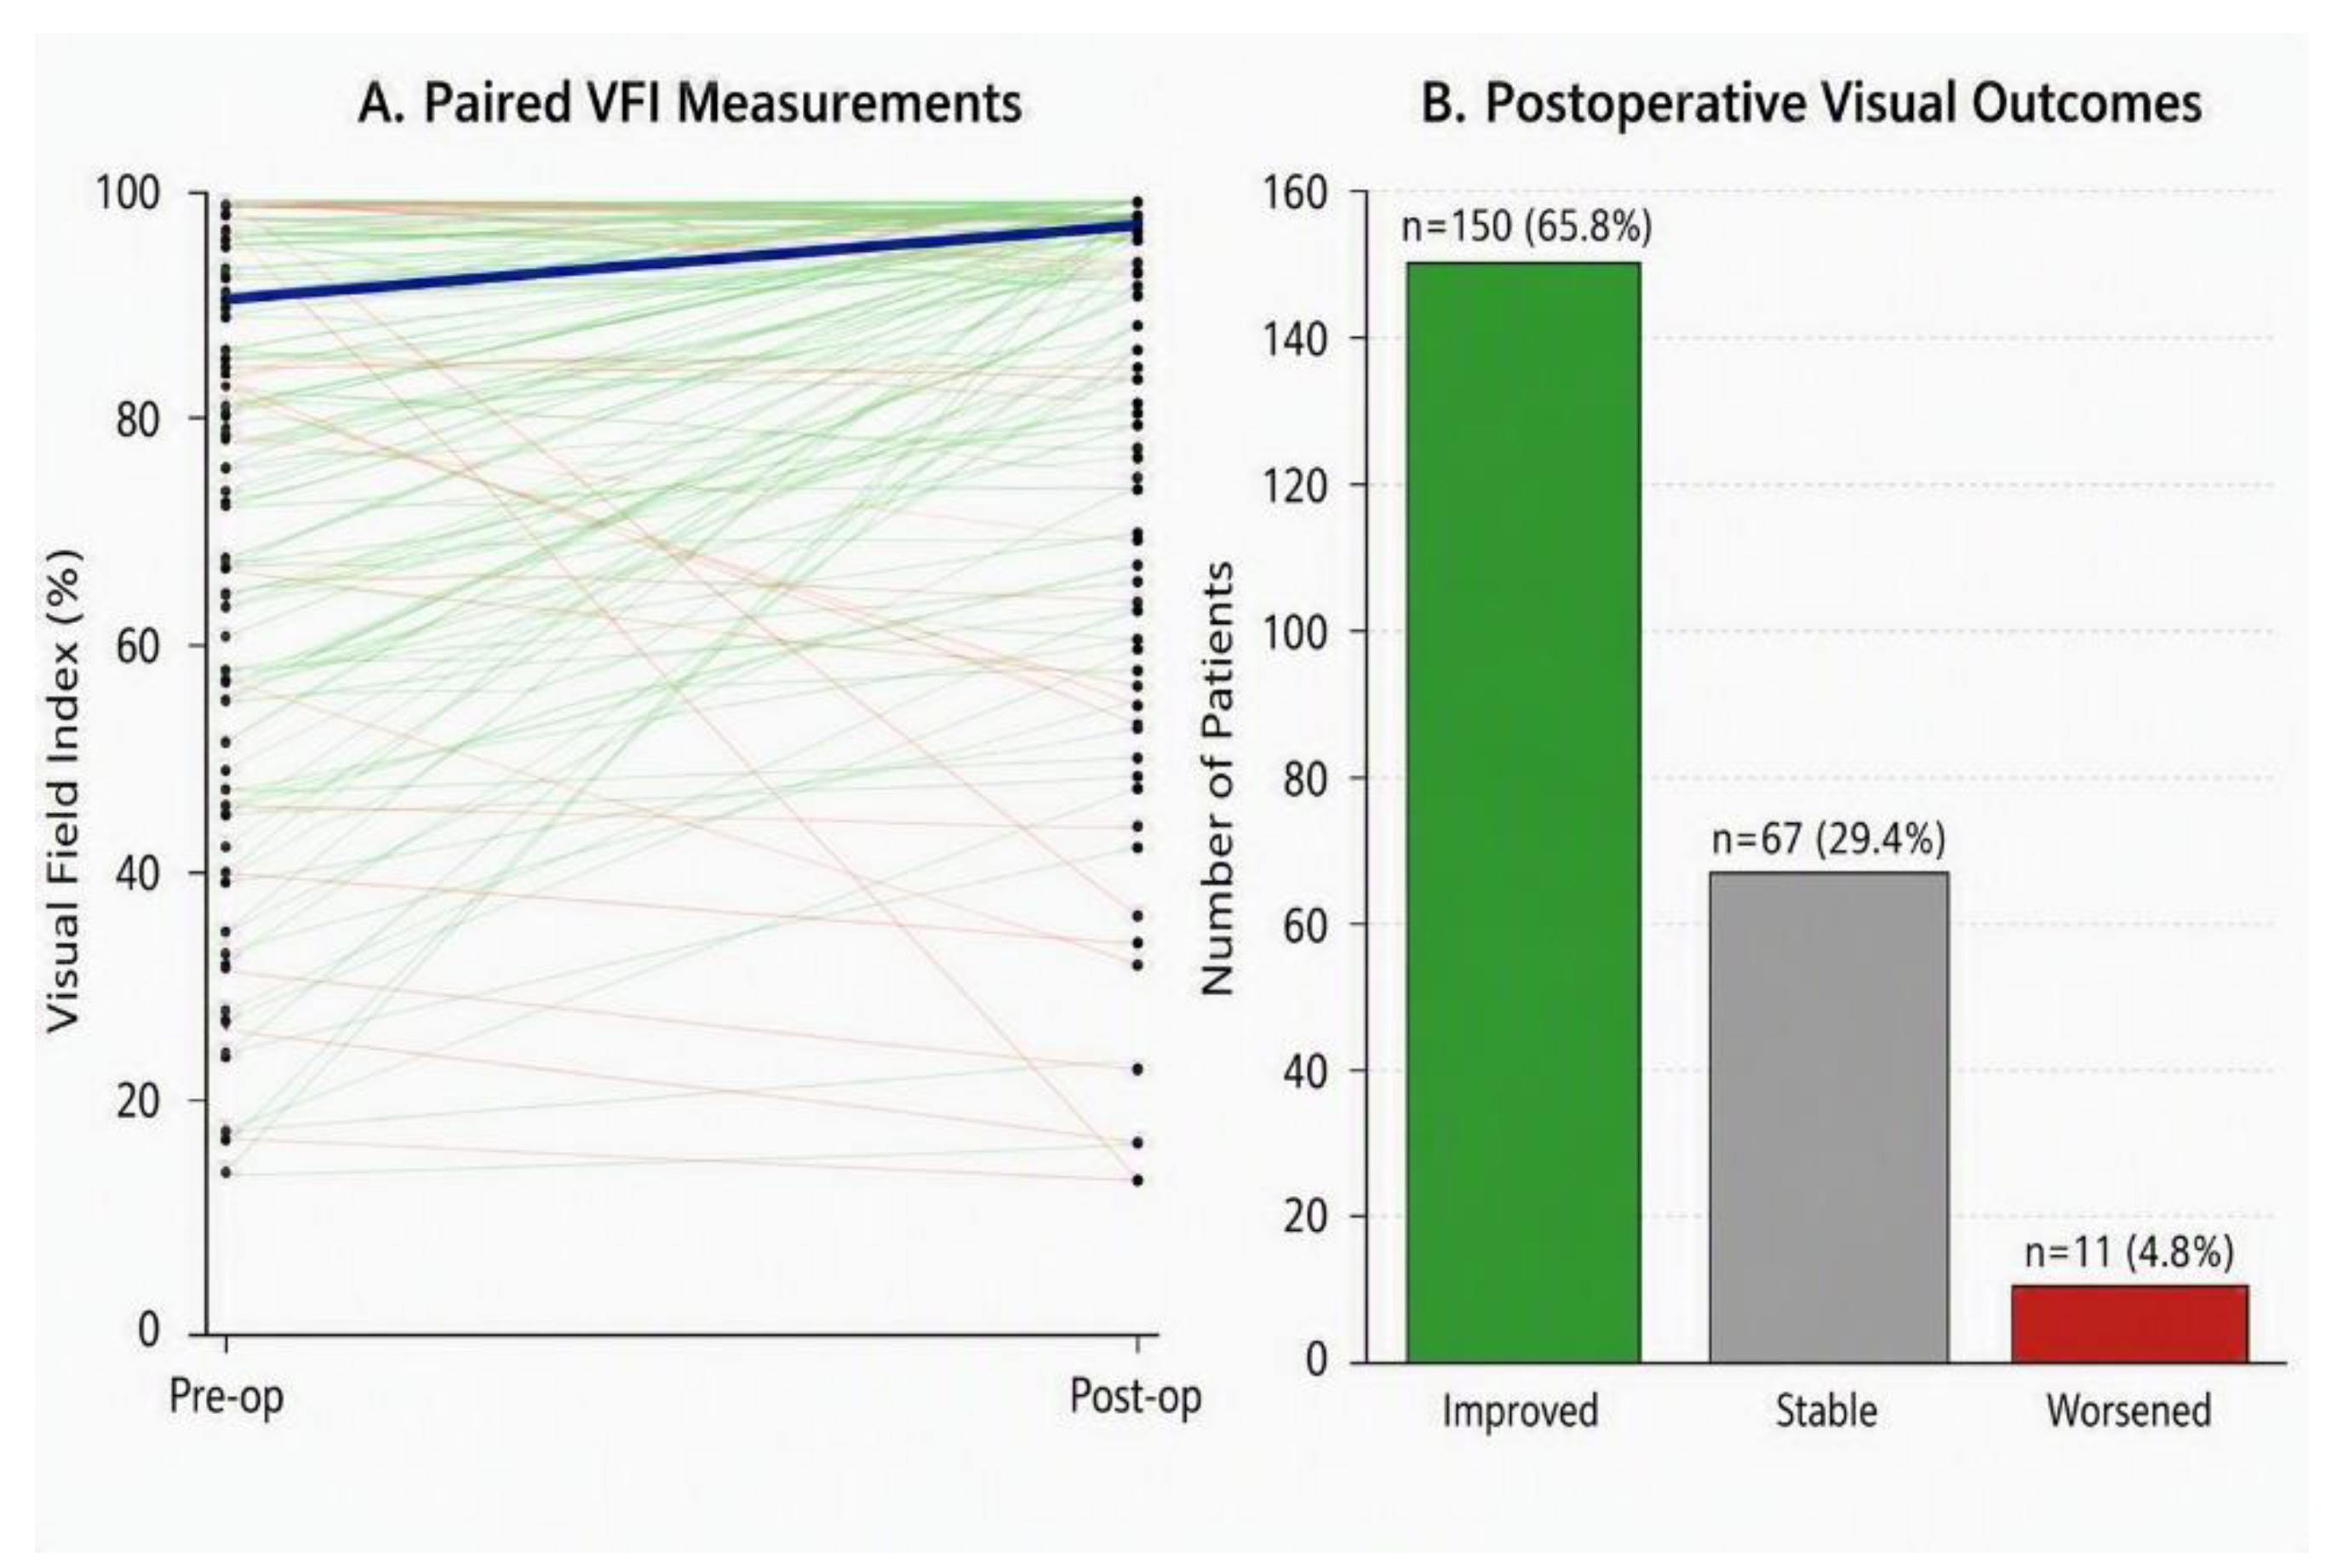
Figure 2.
Impact of radiographic invasiveness on EOR and recurrence. (A) Distribution of GTR, NTR, and STR according to overall invasiveness. (B) Tumor recurrence according to overall invasiveness. (C) Distribution of GTR, NTR, and STR according to individual radiographic invasiveness metrics, including Knosp grade, Hardy-Wilson grade, and Hardy-Wilson stage. (D) Univariate associations of individual and overall invasiveness metrics with STR and tumor recurrence, presented as odds ratios (ORs) with 95% confidence intervals (CIs).
Figure 2.
Impact of radiographic invasiveness on EOR and recurrence. (A) Distribution of GTR, NTR, and STR according to overall invasiveness. (B) Tumor recurrence according to overall invasiveness. (C) Distribution of GTR, NTR, and STR according to individual radiographic invasiveness metrics, including Knosp grade, Hardy-Wilson grade, and Hardy-Wilson stage. (D) Univariate associations of individual and overall invasiveness metrics with STR and tumor recurrence, presented as odds ratios (ORs) with 95% confidence intervals (CIs).
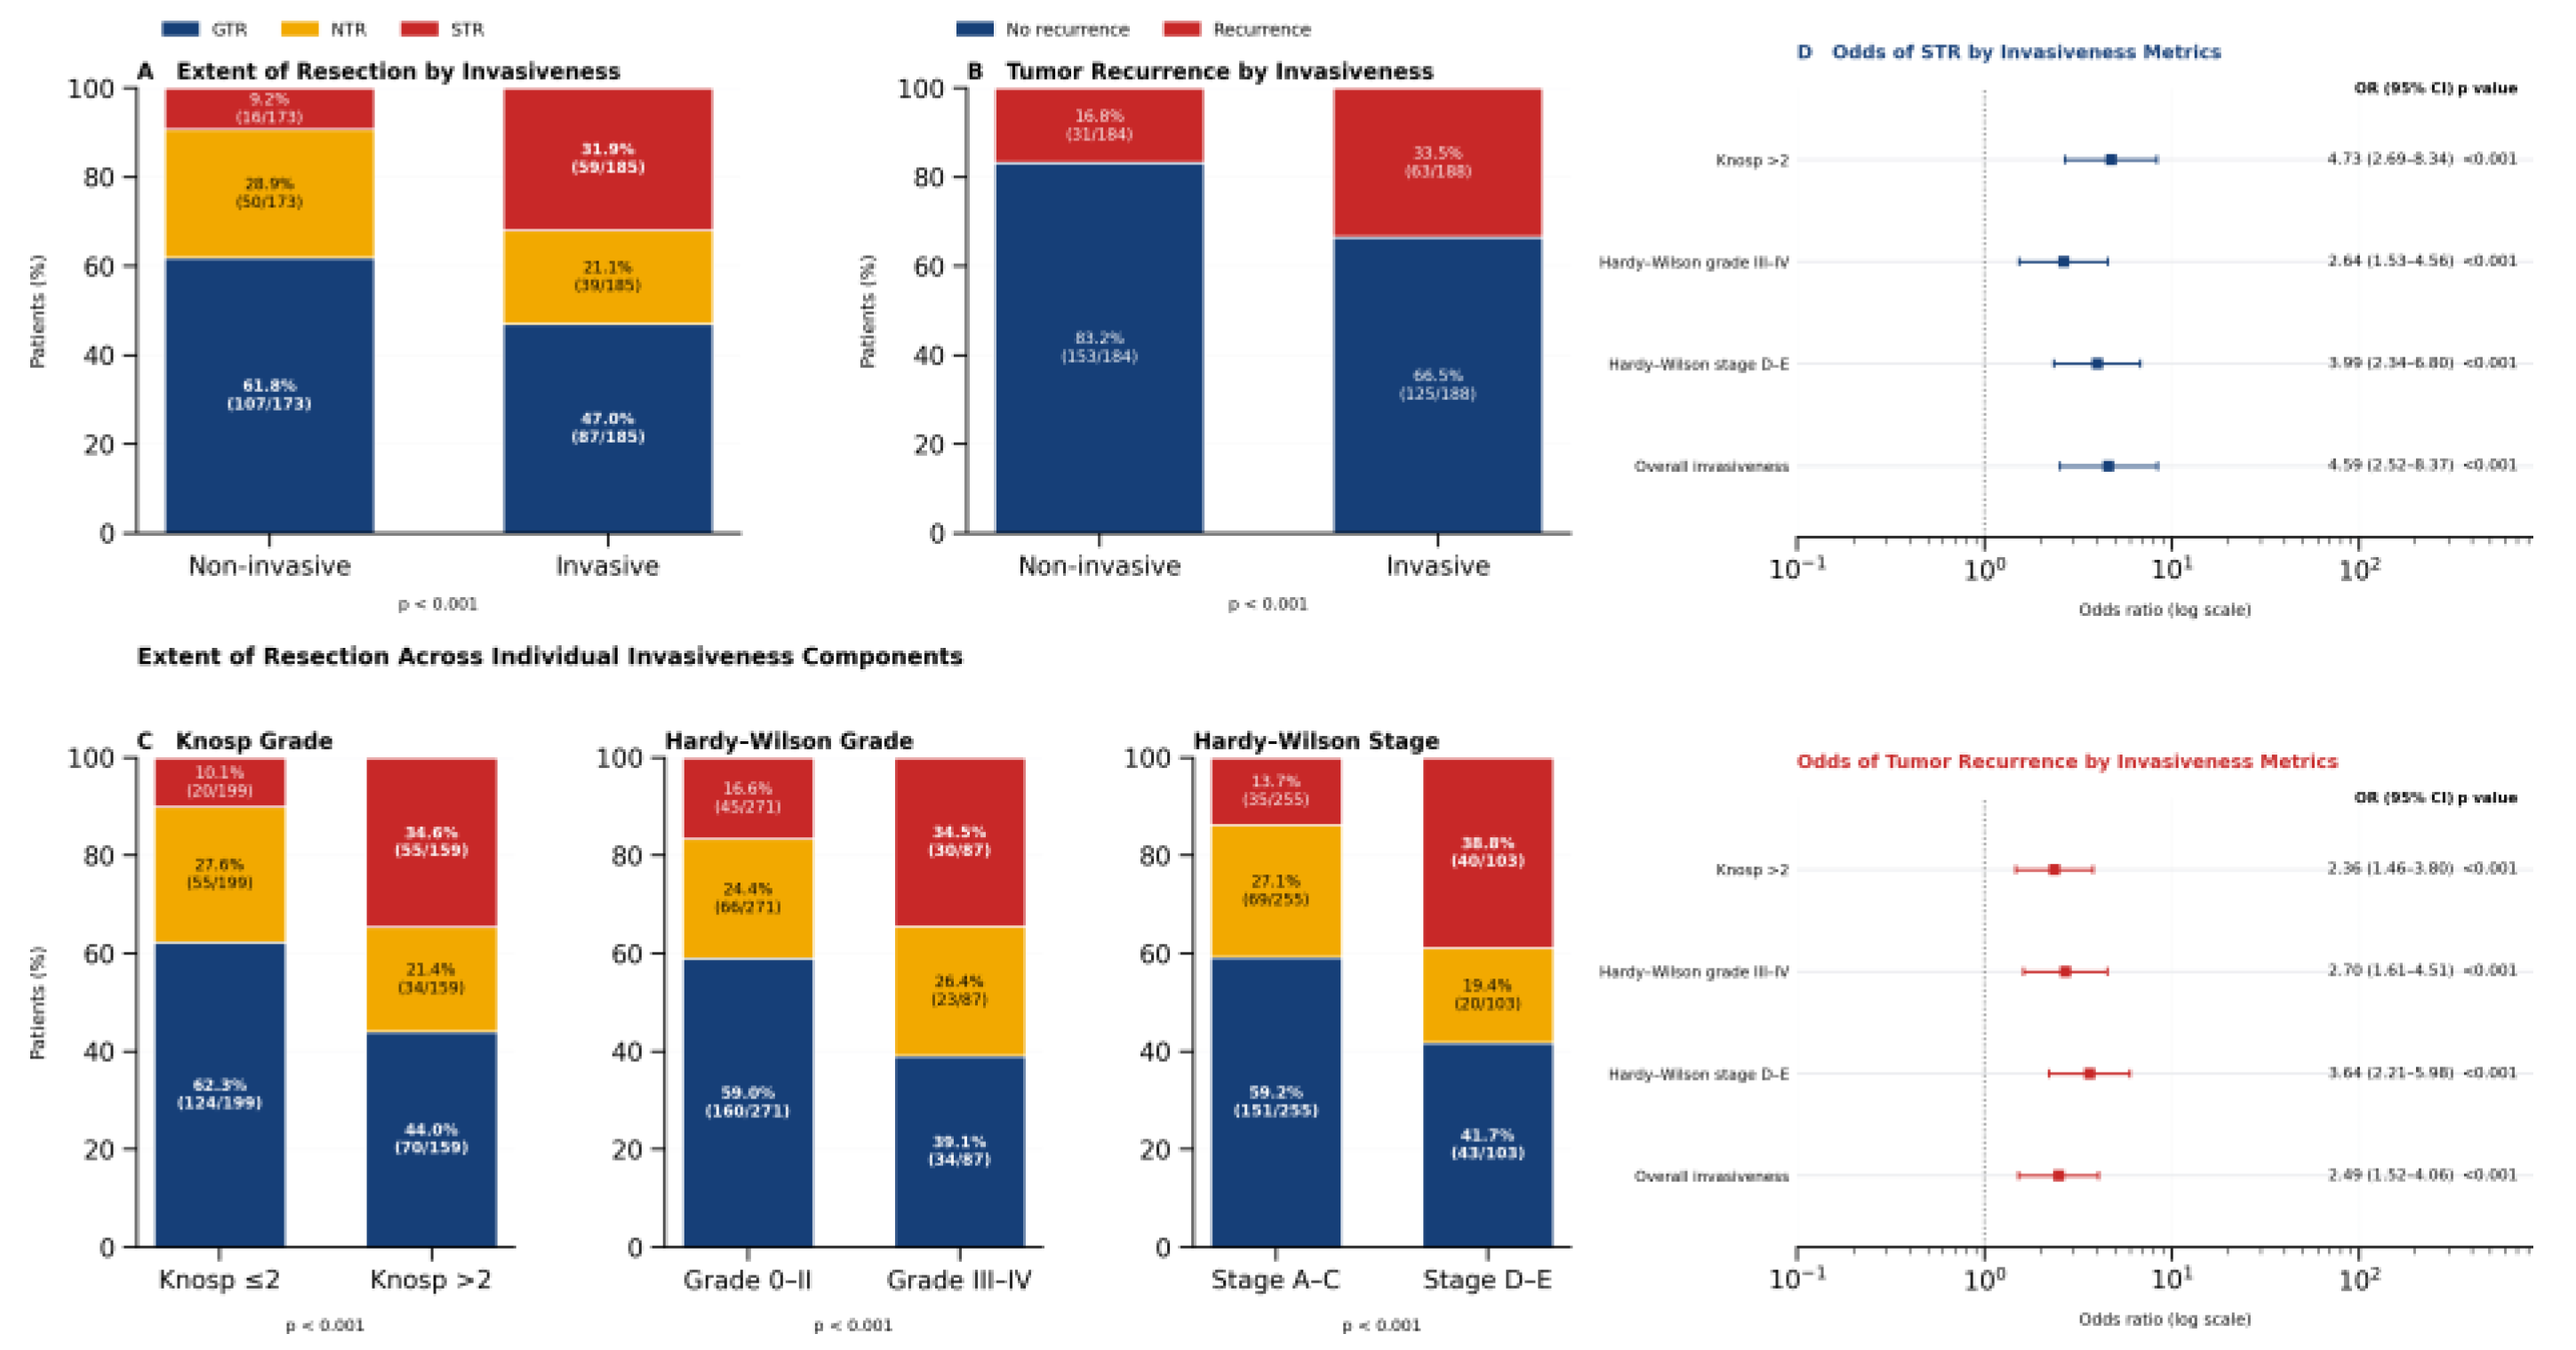
Figure 3.
Multivariable predictors of recurrence. Forest plot showing adjusted odds ratios (ORs) and 95% confidence intervals (CIs) from the multivariable logistic regression model. EOR was analyzed as a three-level categorical variable, with GTR serving as the reference category. STR was independently associated with recurrence, whereas NTR was not significantly different from GTR. The red dashed line indicates the null value of OR = 1.0. The analysis was restricted to 235 patients with complete data for all included covariates.
Figure 3.
Multivariable predictors of recurrence. Forest plot showing adjusted odds ratios (ORs) and 95% confidence intervals (CIs) from the multivariable logistic regression model. EOR was analyzed as a three-level categorical variable, with GTR serving as the reference category. STR was independently associated with recurrence, whereas NTR was not significantly different from GTR. The red dashed line indicates the null value of OR = 1.0. The analysis was restricted to 235 patients with complete data for all included covariates.
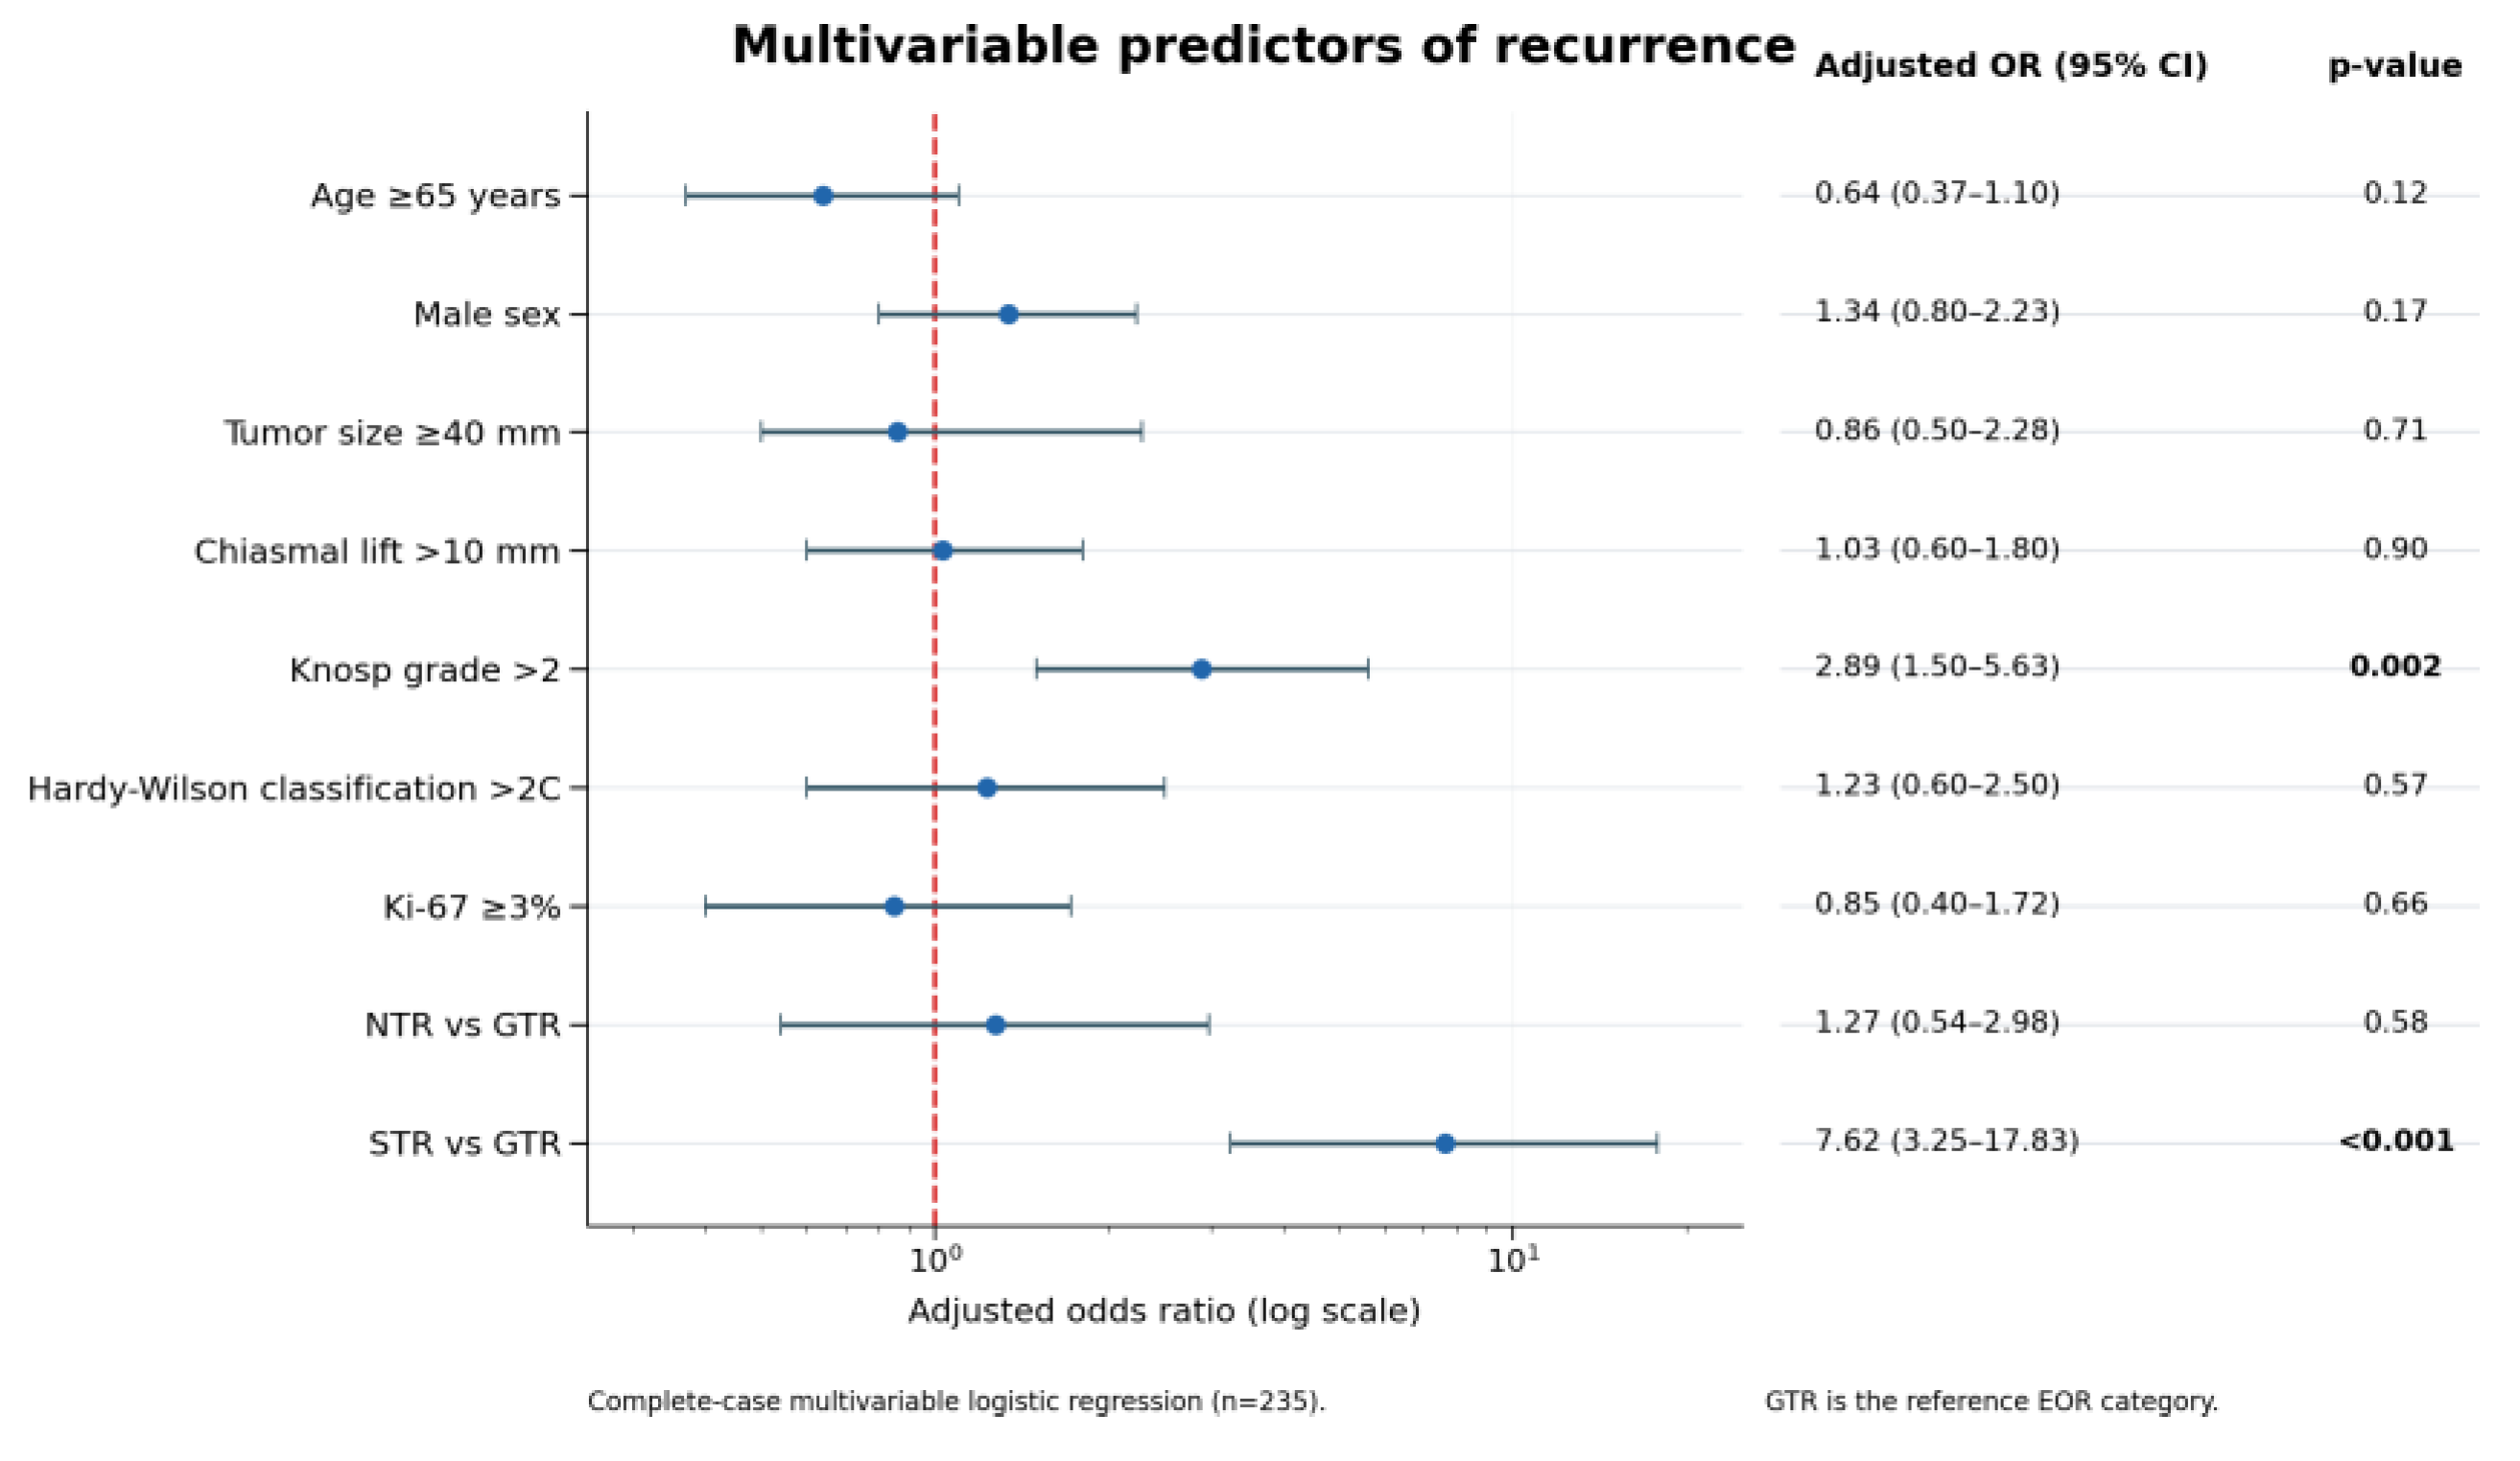
Figure 4.
RFS according to tumor invasiveness. (A) Kaplan-Meier estimates of overall RFS for the study cohort. (B) RFS stratified by invasiveness status. Patients with invasive tumors demonstrated a trend toward shorter RFS than patients without radiographic evidence of invasion (log-rank p = 0.056). Patients without documented recurrence were censored at their last available follow-up.
Figure 4.
RFS according to tumor invasiveness. (A) Kaplan-Meier estimates of overall RFS for the study cohort. (B) RFS stratified by invasiveness status. Patients with invasive tumors demonstrated a trend toward shorter RFS than patients without radiographic evidence of invasion (log-rank p = 0.056). Patients without documented recurrence were censored at their last available follow-up.
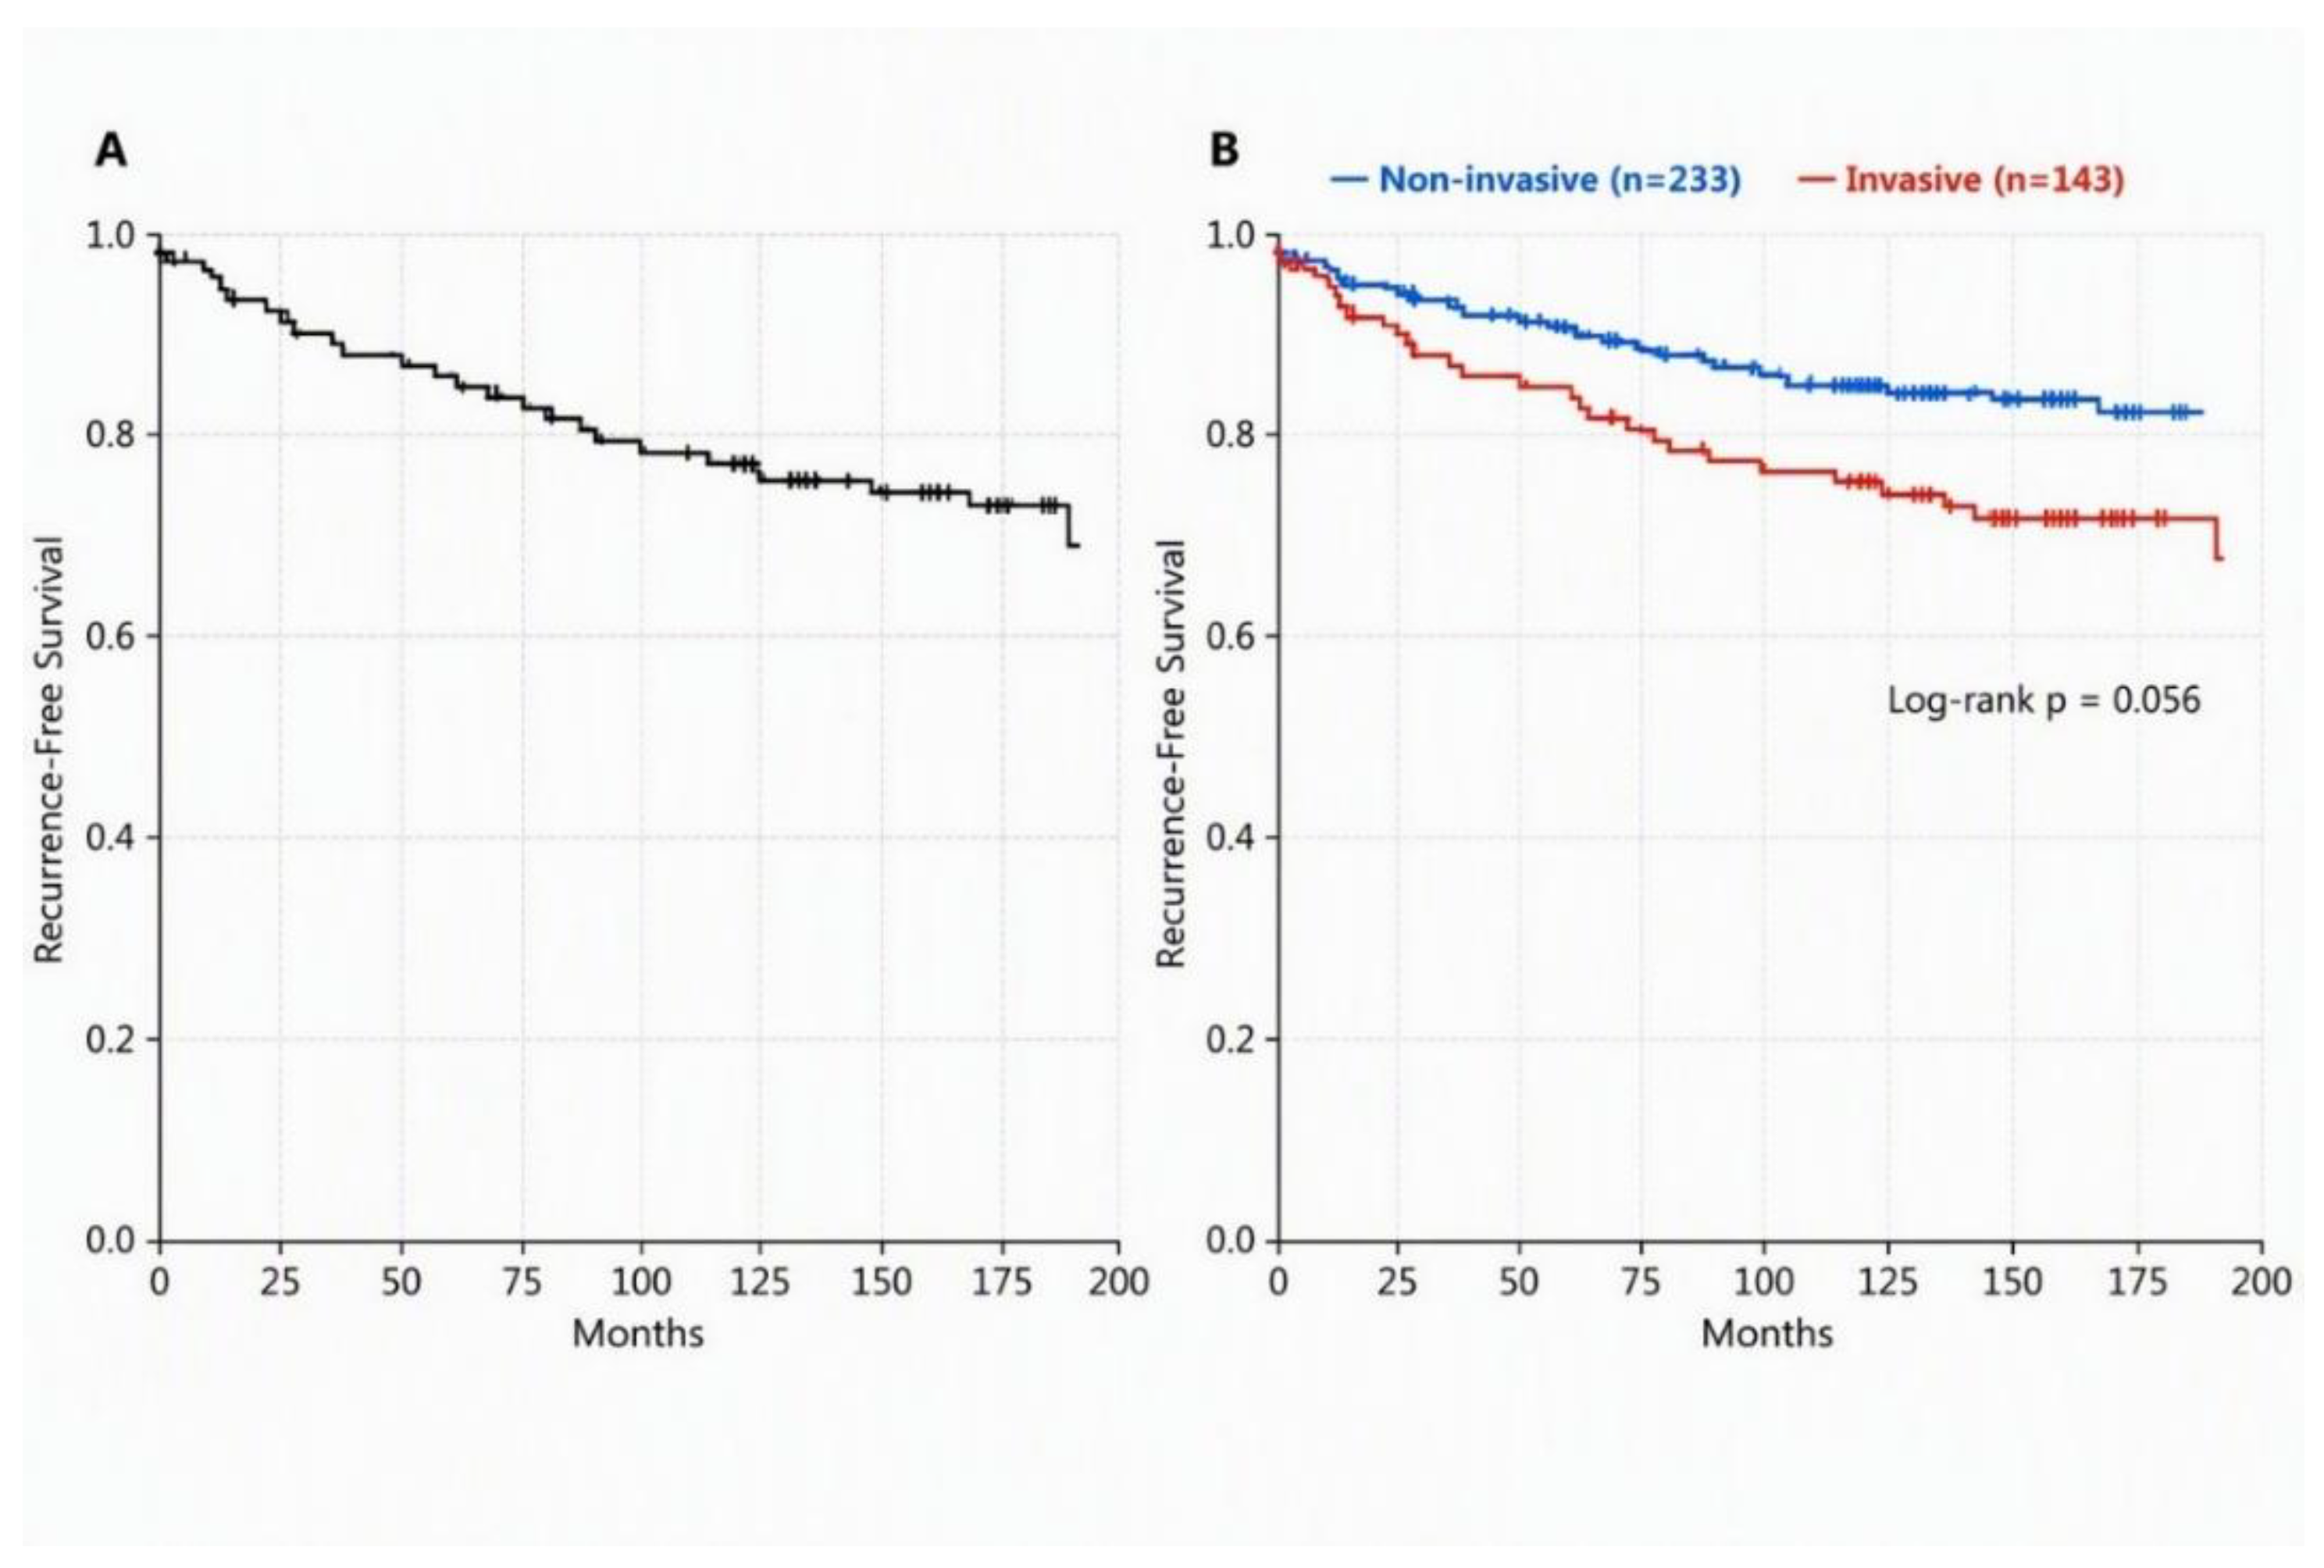
Figure 5.
Recurrence-free survival (RFS) according to EOR. Kaplan-Meier curves compare gross-total resection (GTR), near-total resection (NTR), and subtotal resection (STR). Patients without recurrence were censored at their last radiographic follow-up. Survival analyses were restricted to patients with available EOR and adequate time-to-event information. RFS differed significantly among the three EOR groups (overall log-rank p < 0.001).
Figure 5.
Recurrence-free survival (RFS) according to EOR. Kaplan-Meier curves compare gross-total resection (GTR), near-total resection (NTR), and subtotal resection (STR). Patients without recurrence were censored at their last radiographic follow-up. Survival analyses were restricted to patients with available EOR and adequate time-to-event information. RFS differed significantly among the three EOR groups (overall log-rank p < 0.001).
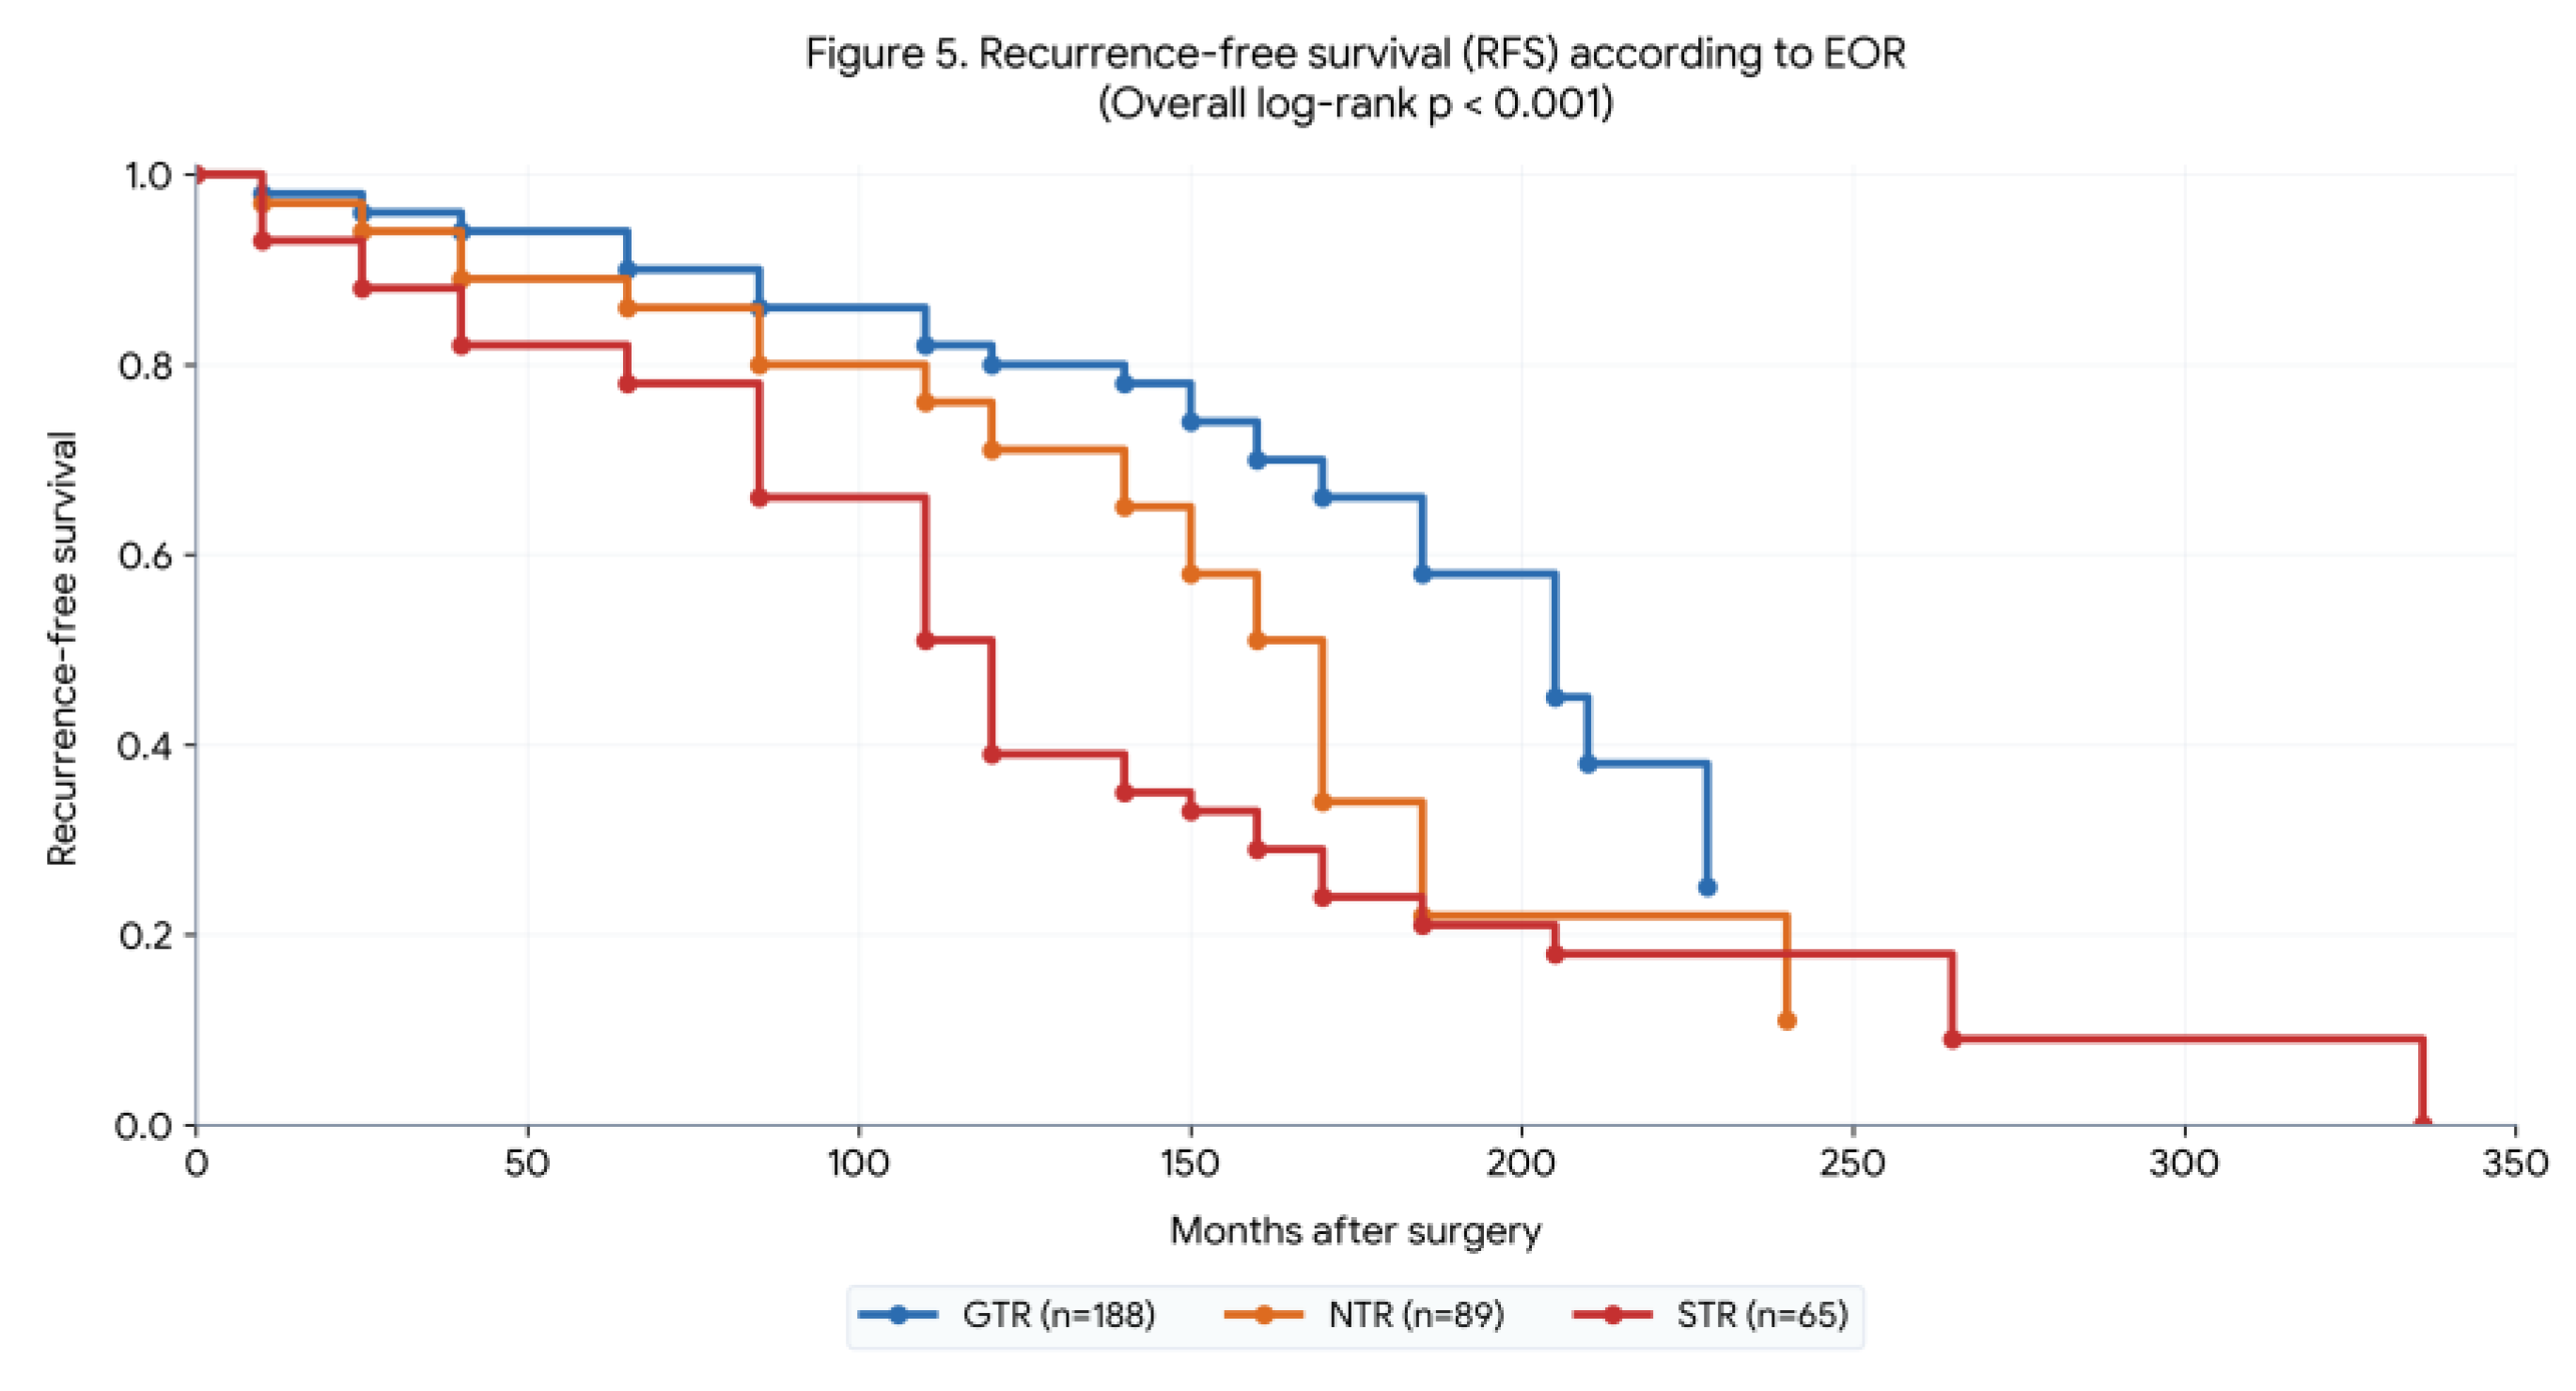
Figure 6.
Conditioned recurrence-free survival following gross-total resection. Conditioned RFS is shown for patients who remained recurrence-free for more than 12, 36, 60, 84, 120, and 180 months after GTR. RFS remained generally favorable across the landmark intervals; however, recurrence continued to occur despite prolonged recurrence-free follow-up, supporting continued long-term radiographic surveillance. Estimates for the >180-month landmark subgroup should be interpreted cautiously because only 15 patients remained eligible at this landmark.
Figure 6.
Conditioned recurrence-free survival following gross-total resection. Conditioned RFS is shown for patients who remained recurrence-free for more than 12, 36, 60, 84, 120, and 180 months after GTR. RFS remained generally favorable across the landmark intervals; however, recurrence continued to occur despite prolonged recurrence-free follow-up, supporting continued long-term radiographic surveillance. Estimates for the >180-month landmark subgroup should be interpreted cautiously because only 15 patients remained eligible at this landmark.
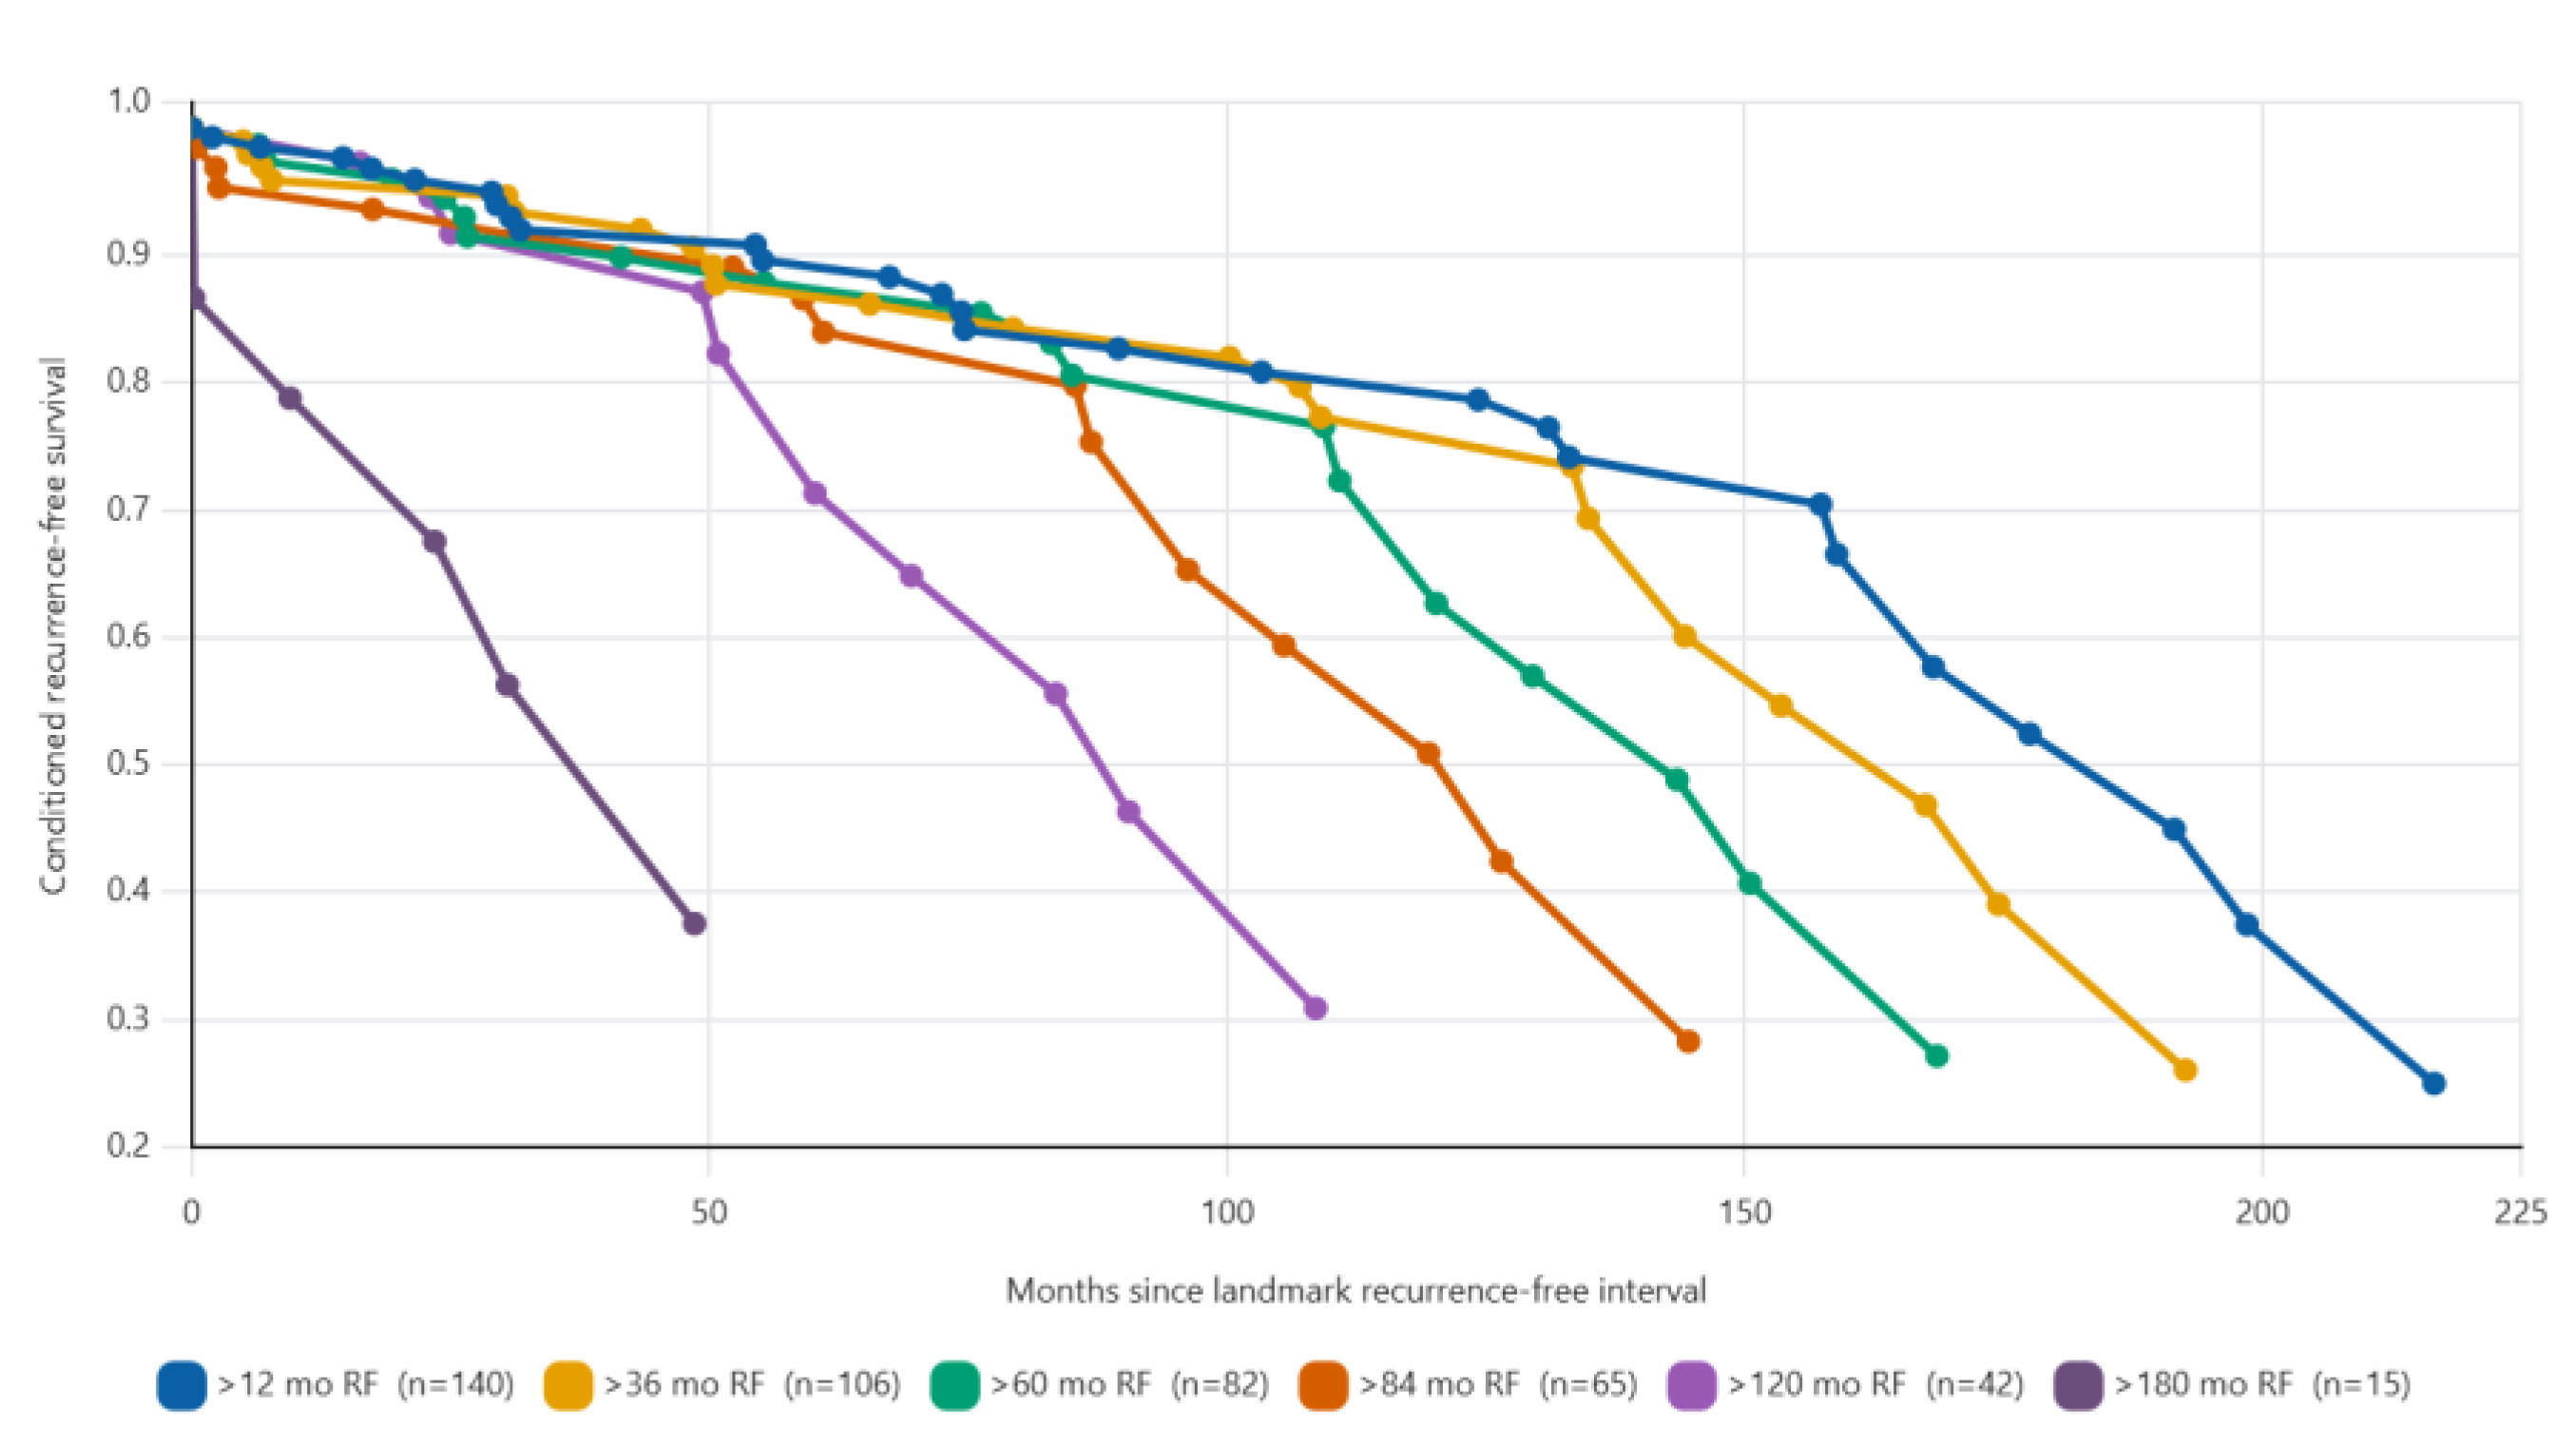
Figure 7.
Annual recurrence hazard following gross-total resection. Annual recurrence hazard was estimated across sequential 12-month follow-up intervals. Black vertical lines with caps represent 95% confidence intervals. Dashed vertical lines at 60 and 84 months indicate the landmark recurrence-free time points. Later estimates should be interpreted cautiously because of decreasing numbers of patients at risk.
Figure 7.
Annual recurrence hazard following gross-total resection. Annual recurrence hazard was estimated across sequential 12-month follow-up intervals. Black vertical lines with caps represent 95% confidence intervals. Dashed vertical lines at 60 and 84 months indicate the landmark recurrence-free time points. Later estimates should be interpreted cautiously because of decreasing numbers of patients at risk.
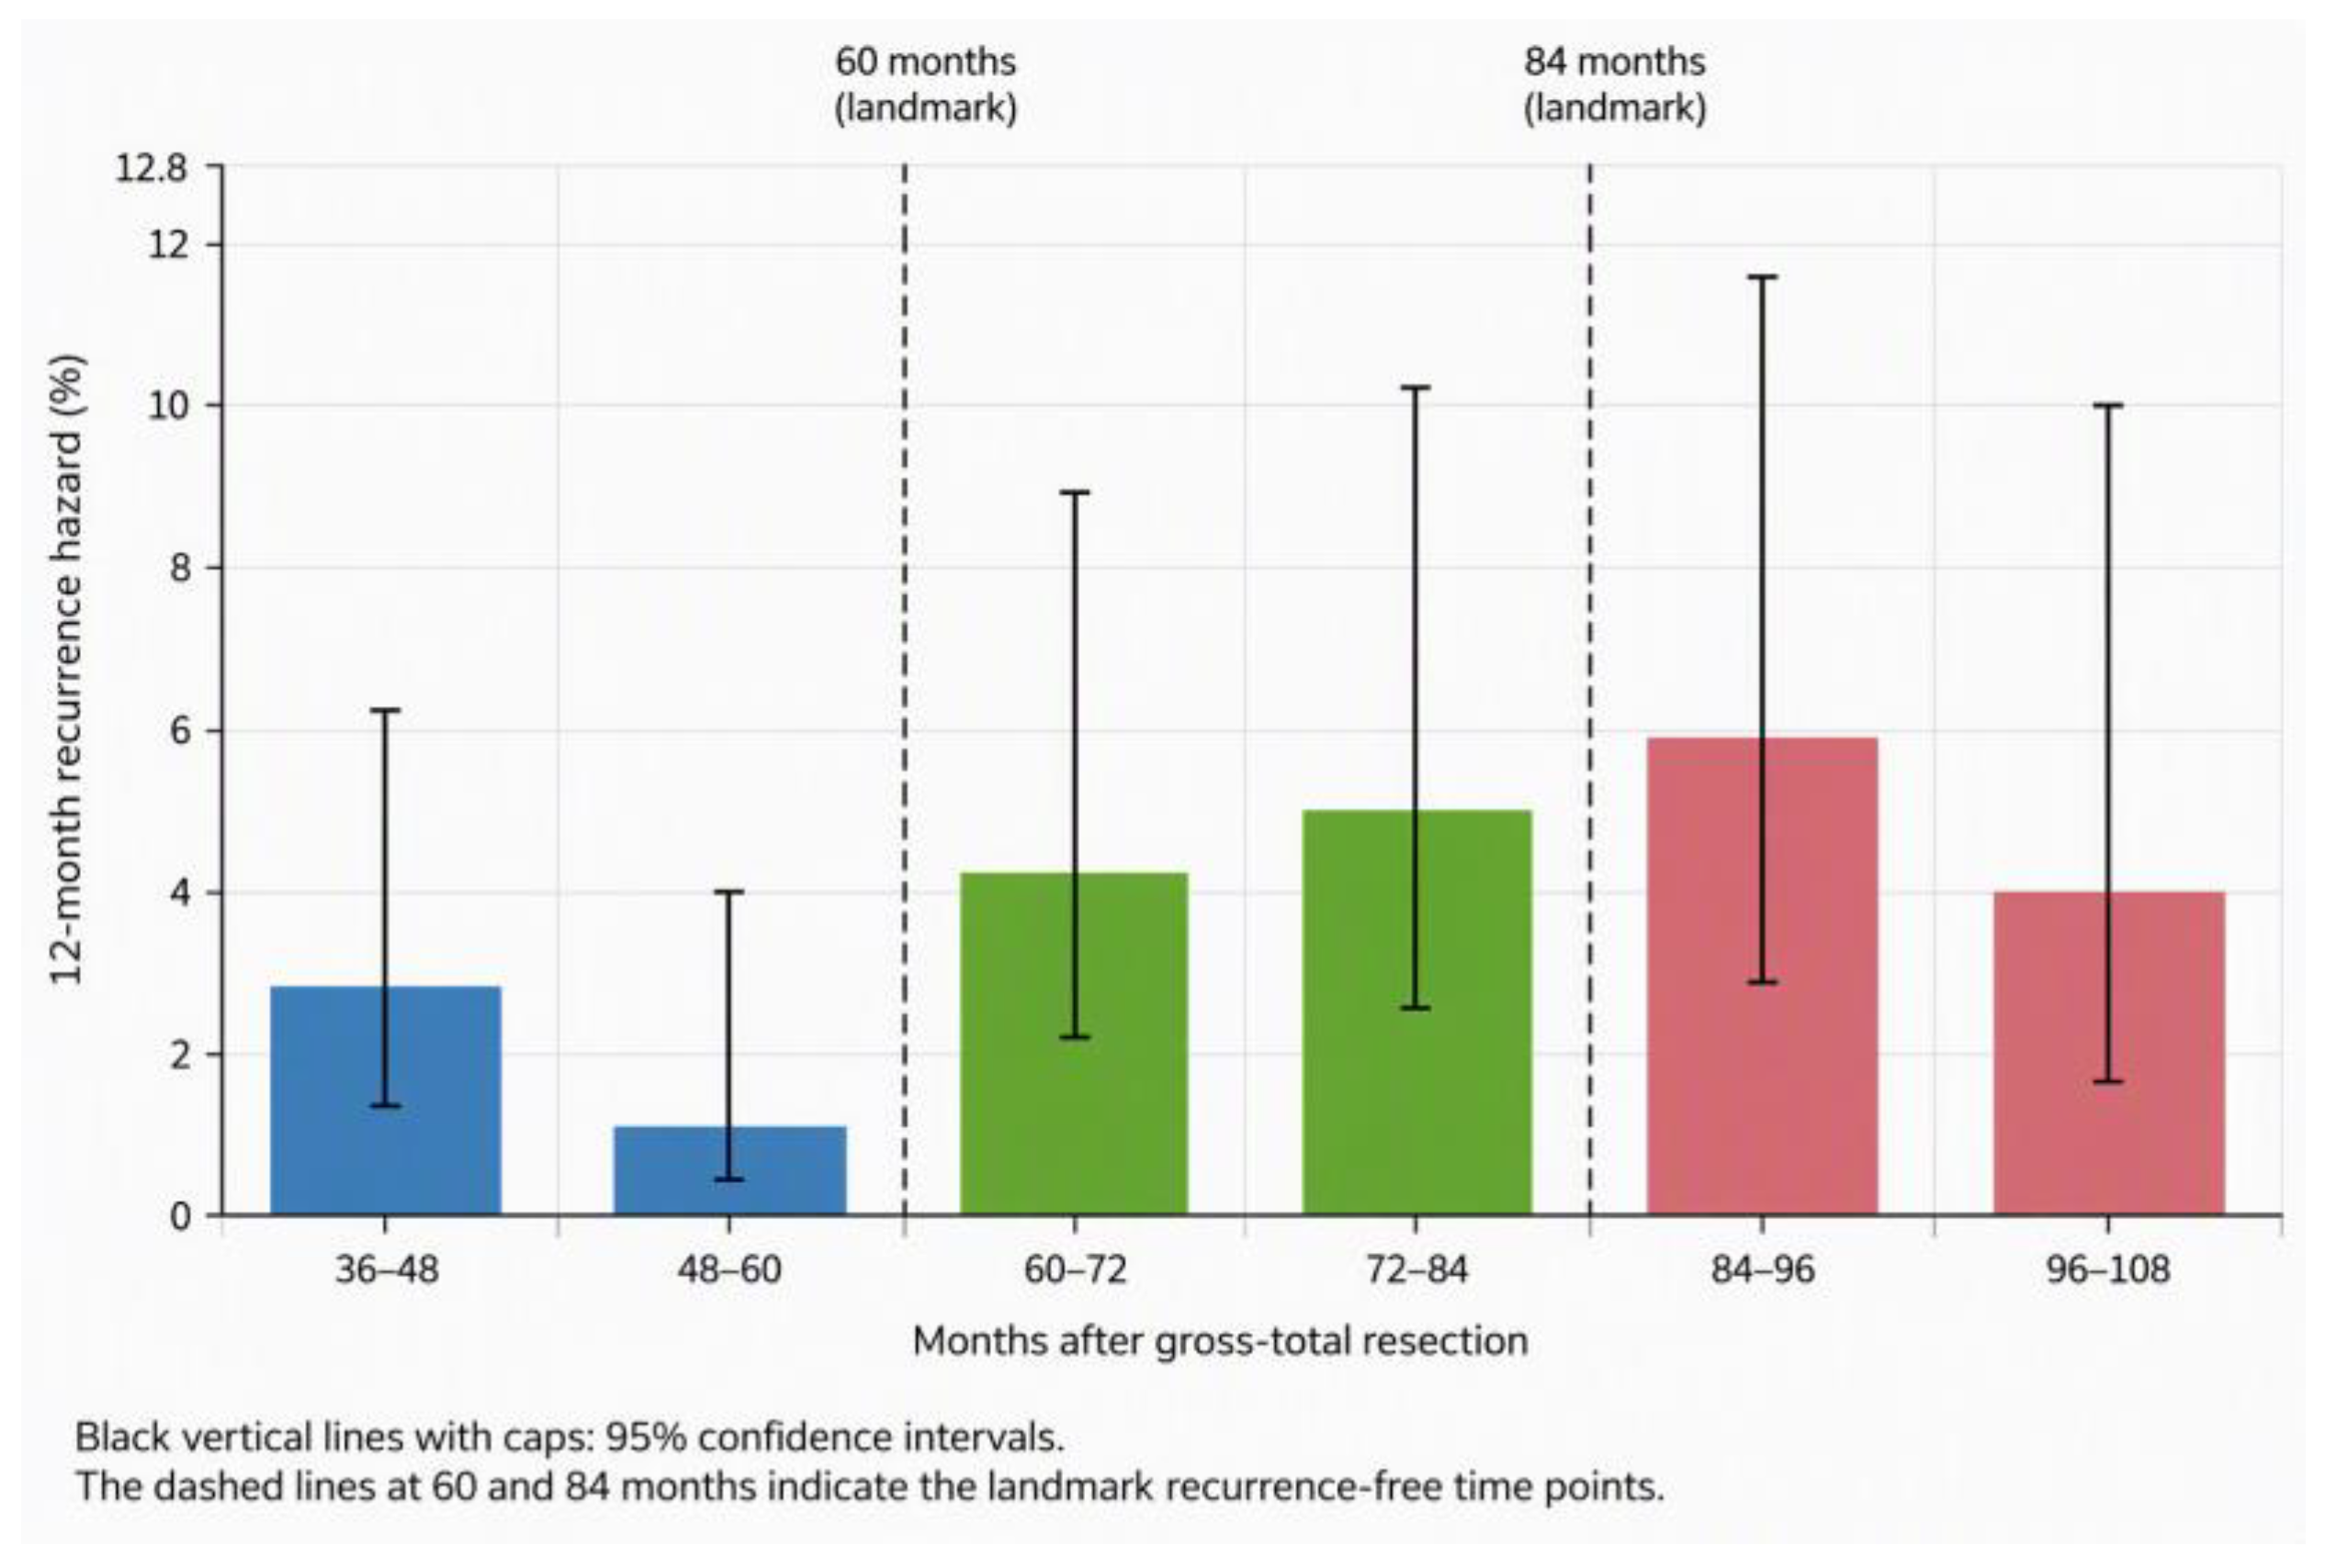
Figure 8.
Multivariable Cox proportional hazards analysis of predictors of recurrence-free survival (RFS). Forest plot showing adjusted hazard ratios (HRs) and 95% confidence intervals (CIs) for variables included in the multivariable Cox regression model. GTR served as the reference category for extent of resection. The red dashed vertical line indicates the null value (HR = 1.0).
Figure 8.
Multivariable Cox proportional hazards analysis of predictors of recurrence-free survival (RFS). Forest plot showing adjusted hazard ratios (HRs) and 95% confidence intervals (CIs) for variables included in the multivariable Cox regression model. GTR served as the reference category for extent of resection. The red dashed vertical line indicates the null value (HR = 1.0).
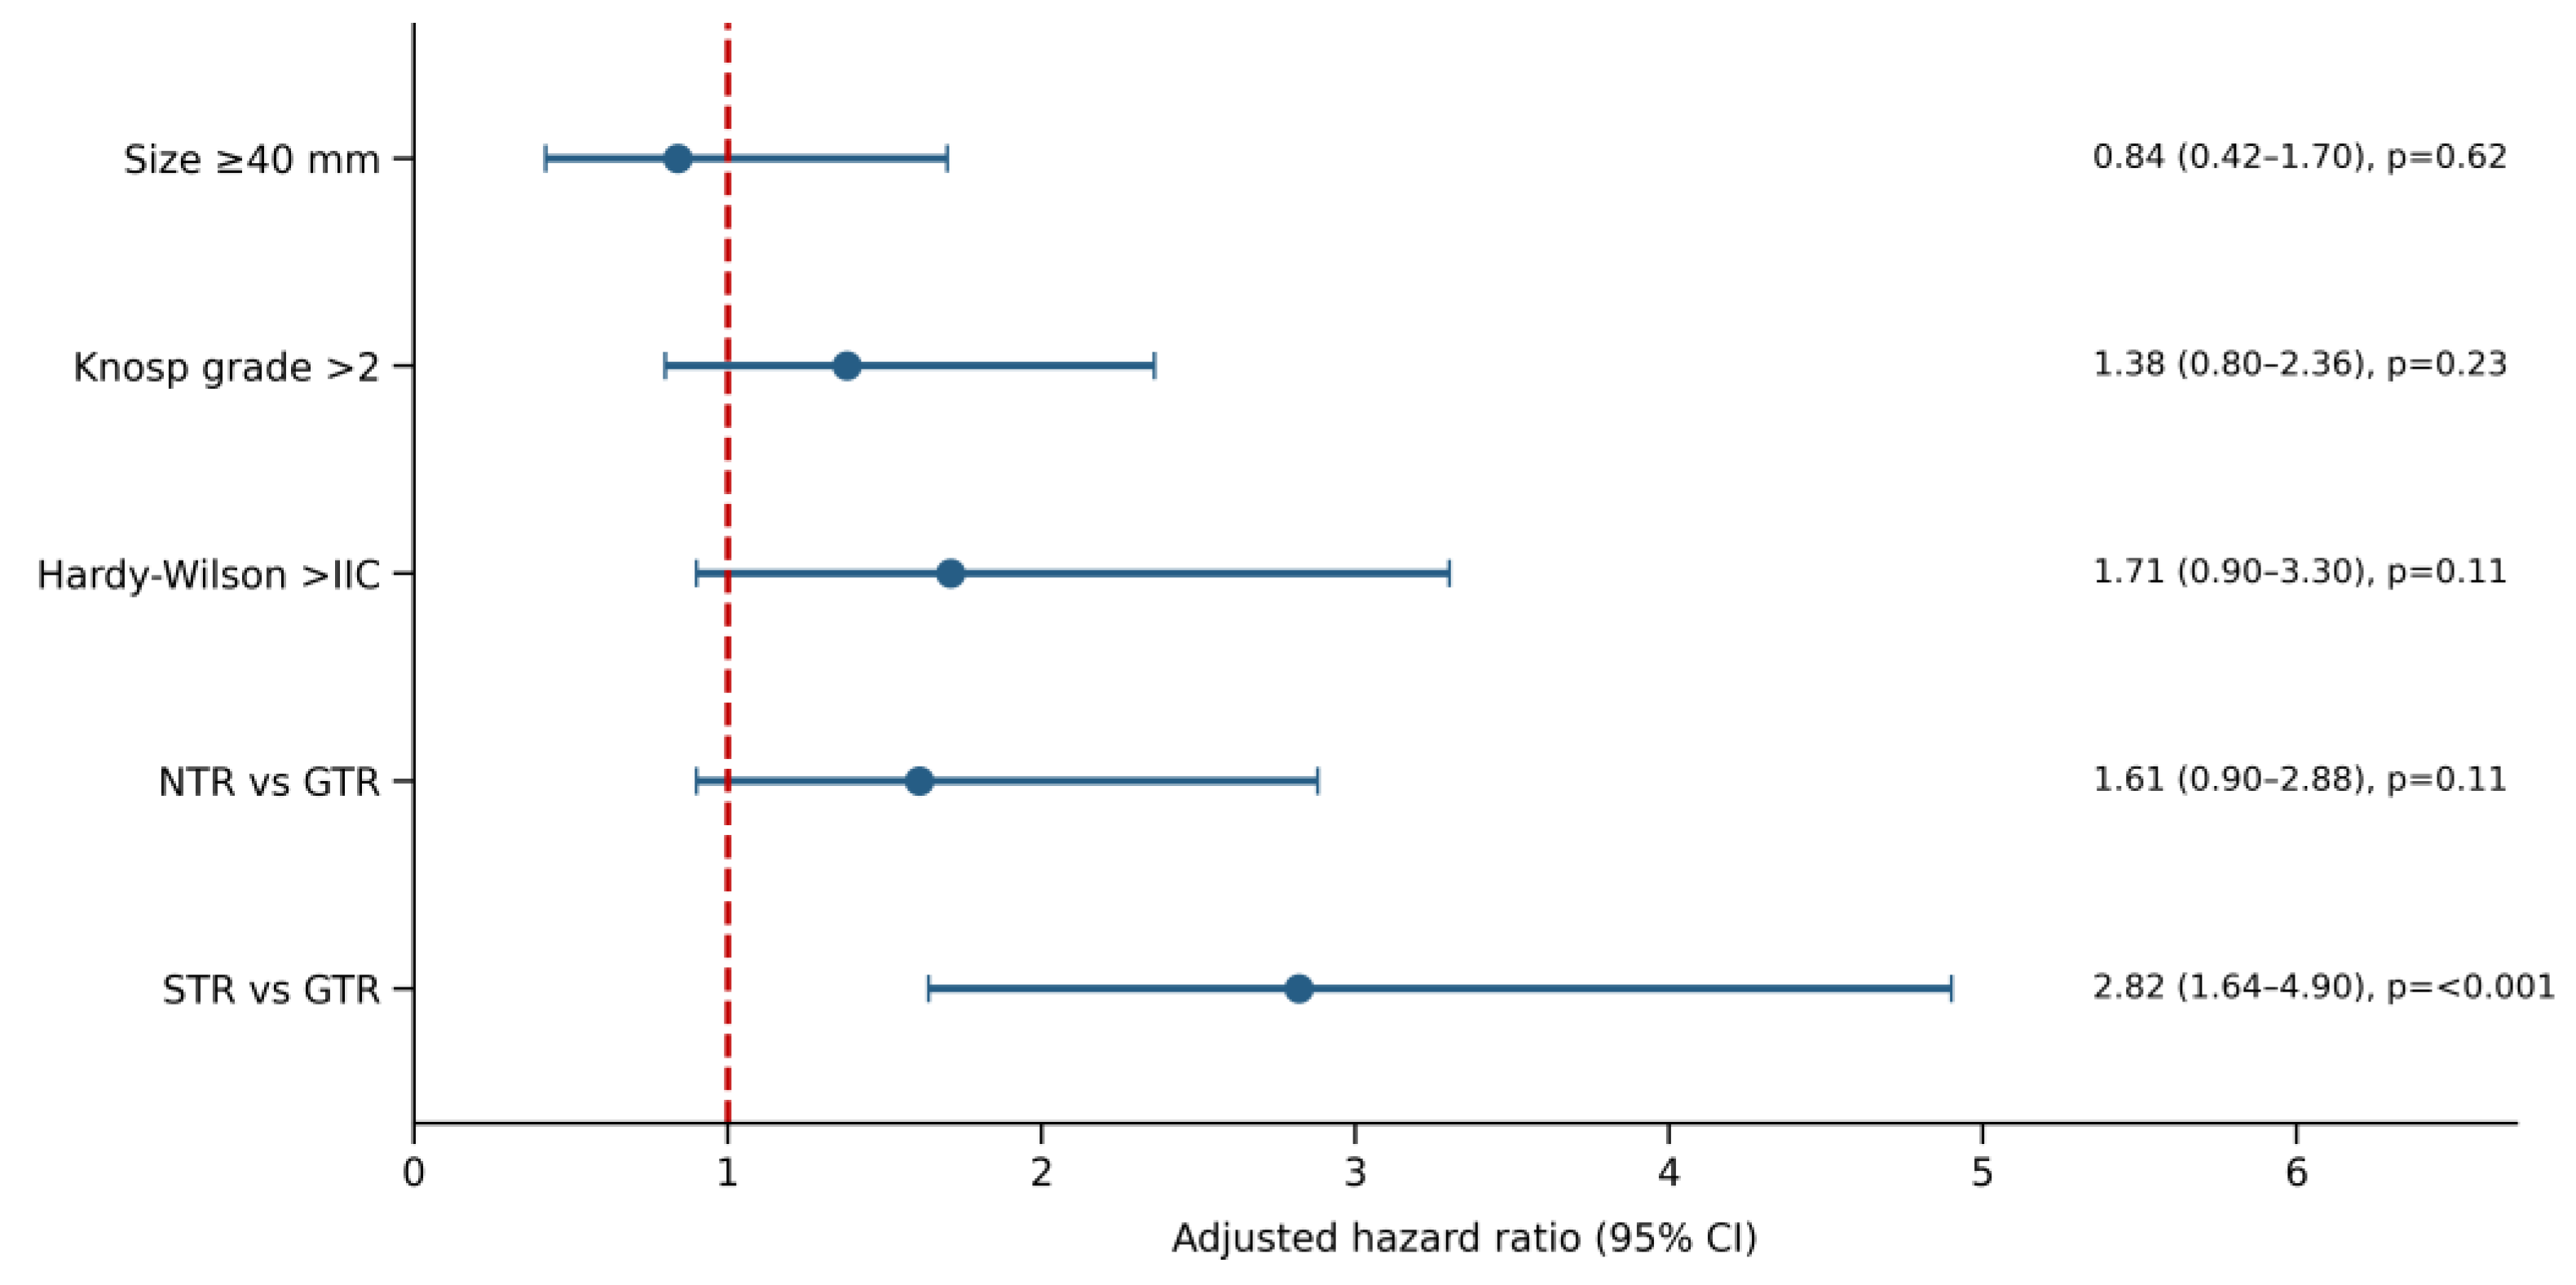

Table 1.
Patient and tumor characteristics.
| Variable | Value | |
| Total patients, n | 381 | |
| Gender, n (%) | Male | 201 (52.8) |
| Female | 180 (47.2) | |
| Age at surgery, median (IQR), years | 57 (46-67) | |
| Follow-up, median (IQR), months | 57 (13.5-124.5) | |
| Tumor size, n (%) | Microadenoma (<10 mm) | 0.0 |
| Macroadenoma (≥10 mm) | 376 (98.5) | |
| Unavailable data | 5 (1.5) | |
| Maximum tumor diameter, median (IQR), mm | 27 (22-34) | |
| Maximum suprasellar diameter, median (IQR), mm | 17 (11-23) | |
| Chiasmal lift, median (IQR), mm | 8.3 (4.3-13.2) | |
| Knosp grade, median (IQR) | 2 (1-3) | |
| Ki-67 index, median (IQR), % | 1 (1-3) | |
| Visual improvement*, n (%) | Improved | 150 (65.8) |
| Stable | 67 (29.4) | |
| Worsened | 11 (4.8) | |
*Among patients with available visual outcome data (n = 228).
Table 2.
Surgical complications.
| Complication | n (%) | |
| CSF leak | 40 (10.5) | |
| DI | Transient | 35 (9.2) |
| Permanent | 28 (7.3) | |
| SIADH | 26 (6.8) | |
| Postoperative hemorrhagic events | Sellar hematoma (5/20) | 20 (5.2) |
| SDH (5/20) | ||
| SAH (1/20) | ||
| Epistaxis (9/20) | ||
| Meningitis | 12 (3.1) | |
| Cranial nerve dysfunction | 8 (2.1) | |
| Hydrocephalus | 3 (0.8) | |
DI: diabetes insipidus; SIADH: syndrome of inappropriate antidiuretic hormone secretion; SDH: subdural hematoma; SAH: subarachnoid hemorrhage.
Table 3.
Transcription-factor expression profile.
| Transcription-factor profile | n | Recurrence n (%) | Median Ki-67 (%) | Median Tumor Size (mm) |
| Null cell | 5 | 0 | 2 | 29 |
| PIT1 | 14 | 0 | 2 | 23.5 |
| SF1 | 35 | 10 (28.6) | 2 | 30 |
| TPIT | 3 | 1 (33.3) | 1 | 23 |
Table 4.
Univariate predictors of recurrence.
| Variable | Group Size (n) | Recurrence Rate (%) | p value | |
| Age ≥65 years | 129 | 20.9 | 0.16 | |
| Male sex | 201 | 28.4 | 0.26 | |
| Tumor size ≥40 mm | 58 | 43.1 | 0.002 | |
| Chiasmal lift >10 mm | 143 | 32.2 | 0.04 | |
| Knosp grade >2 | 161 | 35.4 | 0.0003 | |
| Hardy-Wilson classification >IIC | 89 | 40.4 | 0.0005 | |
| Ki-67 ≥3% | 62 | 22.6 | 0.65 | |
| EOR* | GTR | 192 | 30 (15.6) | <0.001 |
| NTR | 89 | 20 (22.5) | ||
| STR | 74 | 42 (56.8) | ||
| Unavailable | 22 | - | ||
*EOR: extent of resection.
Table 5.
Multivariable logistic regression analysis for recurrence.
| Variable | Adjusted OR | 95% CI | p-value |
| Age ≥65 years | 0.64 | 0.37-1.1 | 0.12 |
| Male sex | 1.34 | 0.8-2.23 | 0.17 |
| Tumor size ≥40 mm | 0.86 | 0.5-2.28 | 0.71 |
| Chiasmal lift >10 mm | 1.03 | 0.60-1.8 | 0.9 |
| Knosp grade >2 | 2.89 | 1.5-5.63 | 0.002 |
| Hardy-Wilson classification >2C | 1.23 | 0.60-2.5 | 0.57 |
| Ki-67 ≥3% | 0.85 | 0.4-1.72 | 0.66 |
| NTR versus GTR | 1.27 | 0.54-2.98 | 0.58 |
| STR versus GTR | 7.62 | 3.25-17.83 | <0.001 |
Table 6.
Conditioned Recurrence-Free Survival (RFS).
| >12 mos RF | >36 mos RF | >60 mos RF | >84 mos RF | >120 mos RF | >180 mos RF | |
| No. of patients | 140 | 106 | 82 | 65 | 42 | 15 |
| % RF after resection | ||||||
| 3 yr | 95.9% | |||||
| 5 yr | 92.0% | 95.9% | ||||
| 7 yr | 88.3% | 92.0% | 96.0% | |||
| 10 yr | 80.8% | 84.3% | 87.9% | 91.6% | ||
| 15 yr | 66.5% | 69.4% | 72.3% | 75.3% | 82.3% | |
| 20 yr | 25.0% | 26.0% | 27.1% | 28.3% | 30.9% | 37.5% |
RF: recurrence free. The >180-month RF subgroup contained a limited number of patients (n=15); therefore, conditioned RFS estimates beyond this landmark may be less stable and should be interpreted cautiously.
Table 7.
Multivariable Cox regression for recurrence-free survival (RFS).
| Variable | Adjusted HR | 95% CI | p-value |
| Size ≥40 mm | 0.84 | 0.42-1.7 | 0.62 |
| Knosp grade >2 | 1.38 | 0.8-2.36 | 0.23 |
| Hardy-Wilson classification >IIC | 1.71 | 0.9-3.30 | 0.11 |
| NTR versus GTR | 1.61 | 0.90-2.88 | 0.11 |
| STR versus GTR | 2.82 | 1.64-4.9 | <0.001 |
Disclaimer/Publisher’s Note: The statements, opinions and data contained in all publications are solely those of the individual author(s) and contributor(s) and not of MDPI and/or the editor(s). MDPI and/or the editor(s) disclaim responsibility for any injury to people or property resulting from any ideas, methods, instructions or products referred to in the content. |
© 2026 by the authors. Licensee MDPI, Basel, Switzerland. This article is an open access article distributed under the terms and conditions of the Creative Commons Attribution (CC BY) license (http://creativecommons.org/licenses/by/4.0/).
Copyright: This open access article is published under a Creative Commons CC BY 4.0 license, which permit the free download, distribution, and reuse, provided that the author and preprint are cited in any reuse.