

Submitted:
05 October 2026
Posted:
08 October 2026
You are already at the latest version
Abstract
Background: Clinical data may not accurately diagnose pulmonary tuberculosis (PTB), mainly due to manifestation overlap with other diseases, causing delays and misdiagnoses. Many gaps in the interpretation of clinical and radiographic findings were addressed and updated in our study. Methods: An institutional-based study was carried out between 02/01/2018 and 26/06/2020 to clinically assess TB outpatients in high-burden zones. Those patients were identified through smear microscopy, GeneXpert Ultra, and chest X-rays and TB positives were interviewed. Of total, 329 patients were enrolled from Bench-Skeko, 23 from Skeka, and 29 from Keffa. Both descriptive and inferential statistics were performed using Stata 14/16. Results: A total of 410 TB confirmed cases, with 328 (80%) being PTB, 79 (19.3%) EPTB, and 3 (0.73%) involving both forms were involved in this study. The mean age was 27.65 ± 11.44 years, with 55% male. Most patients were recently identified (99.3%). GeneXpert was used in 62.4%, AFB in 8.78%, and lesion biopsy or FNAC for EPTB in 16.83%, and 98% was on the intensive therapy for susceptible TB. A febrile episode was diagnosed in 93% (5.4% >40°C, 87% < 39°C), night sweat in 93.17%, appetite loss in 89%, fatigue in 90%, and weight loss in 88%. Respiratory symptoms were very common, with cough reported in 94.2%: productive in 91%, and prolonged (>3 wks) in 77%. Abnormalities in chest X ray were reported in 16.3%, with pleural effusion in 11.2%, cavitary formations in 13%, and lymph node enlarged in 14%. Blood pressure abnormalities were relatively low, with 76.3% having normal. Only few findings were reported as statistically significant predictors of active PTB. Chest abnormalities (OR=6.87), prolonged cough (OR=6.4), mucoid (OR=14.6), and mucopurulent sputum (OR=56.4) increased PTB odds, while lymphadenopathy was less commonly reported (OR=0.16). Appetite loss (OR=3.26), pleural effusion (OR=2.41), and fibrosis (OR=2.31) showed weak associations. Conclusions: A high prevalence of the TB tetrad: prolonged cough, night sweat, fever and appetite loss were observed. PTB odds were higher with chest abnormalities, effusion, fibrosis, infiltration, and expansion, highlighting the diagnostic value of radiology.
Keywords:
chest X-ray abnormality
; clinical features
; imaging
; PTB
; EPTB
1. Background
Low bacillary loads may go undetected microbiologically, making clinical findings along with radiographic features a crucial for diagnosing PTB. TB presents with symptoms overlapping with pneumonia, COPD and other respiratory infections. Chest pain, persistent cough, dyspnea, and other respiratory symptoms are frequently encountered in clinical practice and are often linked to serious underlying pulmonary conditions[1,2].Additionally, radiographic findings such as pleural effusions, cavitary lesions, lymph node enlargement, and parenchymal changes can be indicative of various pathological processes, including infections, malignancies, and inflammatory conditions[3,4,5].Differential diagnosis of these findings professionally aids in determining the cause, disease severity, predicting outcomes, and tailoring treatment approaches[3,6,7].The identification of these abnormalities through imaging techniques, such as chest X-rays and CT scans, provides invaluable information for clinicians in making accurate diagnoses and creating individualized treatment plans[8,9,10].Moreover, radiographic assessments have become indispensable in the diagnostic process, especially with the rise of conditions such as tuberculosis, which present with complex clinical symptoms and imaging findings. Radiological features, including the presence of pleural effusions, cavitary lesions, and enlarged lymph nodes, are crucial indicators of disease activity and severity[11].These findings are often complemented by laboratory investigations, which provide further insights into the disease process, aiding in differentiating between infectious, inflammatory, and neoplastic conditions[7].As the role of imaging in the diagnosis and management of respiratory diseases continues to evolve, its integration with clinical findings remains a cornerstone of effective patient care[11,12,13].
Understanding the distribution and significance of various clinical and radiographic findings is essential not only for accurate diagnosis but also for developing strategies for early intervention and improved management of patients. The study of these findings helps in identifying patients at risk of complications, enables healthcare providers to implement timely interventions, and ensures optimal outcomes. By presenting a comprehensive overview of the clinical and radiographic abnormalities observed in the study cohort, this research aims to enhance the diagnostic approach and provide evidence-based insights into the management of pulmonary diseases[14].As healthcare systems continue to face challenges in managing respiratory diseases, especially in regions with limited resources, the importance of efficient and accurate diagnostic methods cannot be overstated. The integration of clinical assessments with radiographic evaluations offers a promising approach to improving disease detection, monitoring, and treatment[14,15].
Despite advances in TB diagnostic technologies, important gaps remain in the characterization and clinical interpretation of TB manifestations, particularly in resource-constrained, high-burden settings. Symptom-based evaluation alone may fail to identify all patients with TB, while the interpretation and implementation of chest radiography can be affected by limitations in resources, provider knowledge, training and health-system capacity[16].WHO therefore recognizes systematic screening using symptoms, chest radiography, and rapid molecular diagnostic tests as important approaches for improving TB case detection[17].However, the clinical and radiographic patterns of confirmed TB and their relationship with disease progression, clinical outcomes, and diagnostic decision making remain insufficiently characterized in many resource-constrained and geographically underserved settings. The continuing global case-detection gap and the need to strengthen diagnostic algorithms further highlight this evidence deficit. The present study addressed these gaps by systematically describing the clinical symptoms and chest radiographic abnormalities among patients with confirmed TB and examining their distribution and association with disease characteristics and outcomes. By generating context-specific evidence, the study contributes to improve understanding of the clinical and radiographic spectrum of TB and provides evidence to support more comprehensive clinical evaluation, appropriate integration of radiographic imaging, earlier recognition of disease and improved diagnostic and patient-management strategies in high-burden settings[18].
Methods and Materials
1.1. Study Design and Areas
A cross-sectional study was conducted to investigate clinical assessment and X-ray imaging of active TB among outpatients. As shown in Figure 1, three administrative zones in southwestern Ethiopia, namely Bench-Sheko, Kaffa, and Sheka, were selected, situated at 561km, 452.5km, and 596.8km, respectively, from Addis Ababa. Population sizes vary across these zones: 652,531 in Bench-Sheko, 2,151,716 in Kaffa, and 199,314 in Sheka, according to the 2007 census reports. Together, they host diverse populations, predominantly rural, with each smaller urbanization: bench-sheko at 11.53%, sheka at 17.2%, and kaffa at 7.4%. The topographical features are also diverse, ranging from low to highland, which many influence healthcare access and TB risk. Regional hospitals are MTU teaching hospital and Bachuman primary Hospital in bench-sheko, Gebretsadick Shawo General hospital in kaffa, and Teppi General hospital in sheka support the healthcare needs. The area provides diverse and complex settings for studying TB epidemiological traits, which ensures the validity and applicability of the research for TB control efforts.
1.1. Study Population and Sampling Techniques
A multistage sampling technique was applied to select high-risk zones in Southwest Ethiopia (Figure 1). These study areas were considered as each recorded a high TB burden and no data showing the real dynamic of the disease. Among many districts under each zone, healthcare settings equipped with TB diagnostic modalities (at least Xpert MTB/RIF) were selected. Those settings with low patient flow and inconsistencies, mainly in Bench-Sheko, were later excluded. Additionally, a primary hospital in the Kaffa zone was excluded after months due to irregularities observed. As a result, only two hospitals in the Bench-Sheko zone, one from Kaffa and one from Sheka, were used to conduct the study. Those eligible participants were identified through standard diagnostic procedures: confirmed bacteriologically (AFB smear or Xpert MTB/RIF) and/or clinically (radiologic imaging and compelling clinical evidence). Interviews were conducted consecutively with those active TB patients, both newly diagnosed and other types.
Exclusions were made for those unable to provide sputum samples, with mental illnesses, critically ill patients (ICU), or those not diagnosed at the MTU TB lab. ICU patients were excluded due to their vulnerability and ethical consideration related to patient safety. Patients unable to provide sputum samples or complete data were also excluded because alternative invasive procedures, including tracheobronchial or gastrointestinal lavages, were not routinely feasible in those settings, and the use of proxy information could compromise data quality.
1.1. Sample Size Estimation
A sufficient sample size was determined to ensure high statistical power and accurate population estimates. Using the single population proportion formula, the sample size was calculated based on three parameters: variability (heterogeneity), desired confidence level (95%), and an acceptable margin of error (5%). The formula used was:
where:
N = required Sample size,
Zα/2 = 1.96 (the Z-score corresponding to a 95% confidence interval),
P = 0.5 (the estimated population proportion, selected to maximize heterogeneity), and
ω = 0.05 (the acceptance margin of error)
The target of 384 participants per site was affected by patient flow. Ultimately, 329 patients (80.24%) were from MTU Teaching Hospital, with 23 (5.61%) from Teppi Hospital and 29 each (7.07%) from G/Tsadick Shawo General and Bachuma Primary Hospitals.
Data Collection Process and Study Period
The data was collected between 02/01/2018 and 26/06/2020. A structured and standardized instrument was used to record socio-demographic, clinical, and key environmental data. Only healthcare professionals made a face-to-face interview and recorded their responses accurately. Additionally, diagnostic data from smear microscopy and GeneXpert Ultra for detecting MTBC and assessing drug resistance, and high-resolution digital X-ray findings were accurately recorded. In case of low bacillary, X-ray findings suggestive of PTB were employed to confirm diagnoses, focusing on lung infiltrates, cavities, nodules, pleural effusion, fibrosis, and lymphadenopathy. Sputum samples were collected from adults, and only limited induced sputum or gastric lavage was used for children. FNAC analysis was also used to obtain samples for EPTB patients. Those diagnostic evaluations, mainly clinical and X-ray interpretations, were made by experts, adhering to strict protocols to ensure consistency and reliability. Figure 2 illustrates the diagnostic algorithm followed across the study sites.
1.1. Data Analyses
Structured data entry was created with EpiData 3.1. Data cleansing, including missing values, duplicates, and inconsistencies, was manually handled, and then those data were exported for analyses to Stata version 14. Categorical data were summarized descriptively by frequency distributions, percentages, and visual representations (tables and charts). Continuous measures were analyzed by means and standard errors. Normality of those data was tested with the Shapiro-Wilk test, and to identify factors associated with the outcomes, categorical variables were assessed using logistic regression analysis and Pearson chi-square tests. The SPost13 and estout packages were installed into Stata 14 and regression analysis was conducted. Those clinical predictors of TB type (both PTB and EPTB) were assessed using standardized odds radios (SORs) derived from multiple logistic regression analysis. The listcoef, std command from SPost13 was used to obtain standardized coefficients and odds ratios. The esttab from estout package was used to estimate and present regression results with their 95% confidence interval. A statistical significance was reported at a p-value of <0.05.
Clinical Review Reports
1.1. Participant Characteristics
A total of 410 records were analyzed, with slightly more males (55%). The mean age of all participants was 27.65±11.4 years (range: 1-73 years; male: 28.8±12.2; female: 26.2±10; t = -2.27, p = 0.024). Of all patients, new cases were predominantly diagnosed, 99.3% (407), while failure and relapse were each reported in only 0.24% (1). PTB was observed in 80% (328), making it the most common type; EPTB in 19.27% (79) of cases; and only a small proportion, 0.73% (3), had both. GeneXpert MTB/RIF was used in 62.44% (256), acid-fast bacilli (AFB) testing in 8.78% (36), and lesion biopsy or FNAC for EPTB in 16.83% (69). Both GeneXpert MTB/RIF and AFB staining were positive in 4.63% (19), and only 5.9% (24) were diagnosed clinically. Among the patients,97.8% (401) were on an intensive phase for susceptible TB, 0.49% (2) were on MDR TB drugs, and 1.46% (6) did not receive the standard first-line drugs, as fully presented by Weyesa et al[19].
1.1. Clinical Evaluations
1.1.1. Overt and Covert Evidences of Active TB
Diverse systemic and respiratory symptoms were diagnosed in this study. A high fever (>40 °C) was reported by 5.4% (22) of patients, not by 90.24% (370), and was not recorded in 4.4% (18). The majority of participants had a moderate fever (<39°C), present in 87.3% (358), absent in 9% (37), with 3.7% (15) missing data. Night sweat was experienced by 93.2% (382), appetite loss by89% (365), fatigue by 89.8% (368) and weight loss by 88.1% (361). all with minimal missing data. These clinical evidences were very commonly observed and carried high diagnostic relevance. Respiratory problems were also prevalent among individuals with active TB. A persistent cough (> 3 weeks) was reported in 76.8% (315), and the cough was very productive in 91% (373). The most commonly reported sputum type was mucoid in 74.9%, pus in 15.1%, mucopurulent in 3.4%, and bloody in 2.2%, as shown in Figure 3. Chest pain was experienced by 75.4% (309), dyspnea by 56.6% (232), and abnormal breath sounds by 53.4% (219). Dyspnea occurred in 2.4% (10) at rest, 8.8% (36) on exertion, with 62.9% (258) missing data. Abnormal respiratory rate was reported by 66.4% (272), normal by 26.10% (107), and impaired chest expansion by 48.3% (198). Among these patients, BMI data were not obtained for 73.9% (303), with 5.9% (24) underweight, 18.8% (77) normal, and only 1.5% (6) overweight. Pulse reading indicated normal in 93.6% and tachycardia in 6.2%. Blood pressure reading was found normal in 76.3% (313), elevated in 5.1% (21), Stage I hypertension in 6.1% (25), Stage II in 2% (8), and hypertensive crisis in only 0.24% (1). Hypotension was infrequently reported, being observed in only 0.73% (3). BP data was not recorded in 9.5% (39). Table 1 and Figure 3 report the clinical indicators that were observed.
1.1.1. X-Ray Findings
Bacteriologically negative and few positive cases showing clinical compatibility were subsequently evaluated using radiologic studies, as shown in Figure 4. Of these, chest abnormalities were detected in 16.3% (67), none were found in 13.7% (56), and not performed in 69.8% (285). Infiltration was diagnosed in 8.8% (36),16.6% (68) showed normal, and 74.4(305) had missing data. Lymph node was enlarged in 13.7% (56), showed normal size in 11.7% (48), and 74.6% (306) had missing data. Plural effusion was found in 11.2% (46) of cases,15.1% (62) had none, with most cases,73.4% (301) of the data unrecorded. Cavitary lesions were reported in 12.7% (52) of patients, and 12.9% had no cavitary lesions, with most cases,74.2% (304), having missing data. A scar of lymph node was present in 11.2% (46) and absent in 13.9% (57), and most cases had no imaging. Calcified lesions or scars in parenchyma were detected in 7.6% (31) of patients, and no such findings in 15.9% (65). Pleural fibrosis was recorded in 9.5% (39), and 15.6% (64) showed no fibrosis, with 74.6% (306) unrecorded. Finally, nodular lesions were diagnosed in 6.8% (28), and 16.6% (68) had no nodular lesions, with 76.6% (314) of the data unrecorded. Additionally, Figure 5, Figure 6, Figure 7, Figure 8, Figure 9 and Figure 10 illustrates those different X ray abnormalities consistent with PTB.
1.1. Clinical Evidence Statistically Suggestive of PTB
The classic features that suggest the likelihood of predicting PTB were statistically presented in Table 2 and Table 3. Several features have shown a stronger association with PTB than others in this study. Overall chest abnormalities, prolonged cough, and sputum characteristics were the strongest clinical features suggestive of PTB whereas other features showed weak or no statistical evidence. Fever ≥40ºC (OR=0.19, P=0.001) was a less likely predictor of PTB, indicating that this extreme fever was less likely to characterize PTB. Fever <39 ºC was more common than extreme temperature(≥40ºC) among those patients, although its association with PTB was not statistically significant (OR=1.42; P=0.47). Appetite loss (OR=3.26, P=0.09) was found to be a good clinical indicator of PTB with very weak statistical evidence. The presence of chest abnormalities (OR=6.87, P=0.00) was also among the strongest predictors of PTB. The diagnosis of pleural effusion on imaging (OR = 2.41, P = 0.09) was very weakly associated with PTB. Conversely, enlarged lymph nodes (OR=0.16, P=0.00) were less likely to be a clinical predictor of PTB. Pleural fibrosis (OR = 2.31, P = 0.19) slightly suggested the risk of PTB.
Cough >3weeks (OR=6,40, P<0.001) showed a positive association with PTB, but not statistically supported. Using bloody sputum as a reference, patients with mucoid sputum had significantly higher odds of PTB (OR=14.6, P<001). Similarly, mucopurulent sputum was significantly associated with increased odds of PTB (OR=56.40; P=0.01). In contrast, purulent sputum was associated with significantly lower odds of PTB compared with bloody sputum (OR=0.12, P=0.03). Using normal BMI as the reference, no significant association with PTB was observed among underweight (OR=1.45; P=0.71) or overweight participants (OR=0.47; P=0.71).Analysis of clinical data revealed that, compared with patients without dyspnea, those with dyspnea at rest showed a marginal association with PTB (OR=22.4; P=0.05), whereas dyspnea on exertion was not significantly associated PTB (OR=0.26; P=0.13).Blood pressure status was not significantly associated with PTB.Compared with normal blood pressure, elevated blood pressure (OR=1.20; P=0.86), stage I hypertension (OR=2.21; P=0,76), and stage II hypertension (OR=0.17; P=0.20) showed no significant associations. Similarly, increased respiratory rate was not significantly associated with PTB. Respiratory count of >21breaths/min (OR=0.22; P=0.14) and >41breaths/min (OR=0.17; P=0.10) were not significant indicators of PTB.
Discussions
Data from those patients clinically and bacteriologically confirmed with active TB were assessed to evaluate the predictive value of symptoms and signs for diagnosis[20].The study documented that the accuracy of clinical reports, particularly for smear-negative active PTB, was crucial, relying on clinician judgment and chest X-rays to ensure timely treatment. Respiratory and systemic manifestations were consistently observed in both PTB and EPTB cases; however, they were more prevalent and clinically pronounced in PTB [21,22].The combination of the tetrad of symptoms—cough, fever, night sweats, and weight loss—with X-ray findings was found to be vital for early diagnosis and preventing delays[23,24].However, many previous studies reported clinical findings as limited in accuracy, with chest X-rays enhancing detection but still requiring further tests[8,25].Gaps in those literature were highlighted by these findings, emphasizing the importance of these indicators for early PTB prediction[26].The clinical and radiologic observations in this study closely aligned with established diagnostic patterns in TB. Higher proportion of male patients (55%) was reported in this study, [27,28] linked to factors like increased exposure and lower healthcare-seeking behavior[29,30,31].PTB (80%) was most common, consistent with global trends. EPTB (20%) was less frequent, primarily in immunocompromised individuals[32,33,34,35].
Data from our study showed that moderate fever(≤39°C), observed in 87.32% of patients was identified as key indicators of PTB. The data suggested that extremely high fever was not a hallmark of PTB, potentially leading to misclassification in clinical practice. These findings aligned with previous studies[36].These symptoms were strongly suggestive of PTB and played a critical role in raising early clinical suspicion, with numerous studies affirming its diagnostic value [23]. Cough duration of more than 3 weeks (OR = 6.4, P = 0.00), reported by 76.83%, has been widely recognized as a potential indicator of PTB, with chronic cough often serving as a primary screening tool for PTB[37,38].In this study, consistently it was identified as a strong, statistically significant predictor. Previous studies have also highlighted persistent cough as one of the most common and early signs of PTB, with a duration of more than three weeks being a significant marker for diagnosing PTB, as specified by previous studies[24,39,40]. The presence of productive cough and chest pain in a significant portion of patients further supported the respiratory nature of the disease. The presence of a productive cough, seen in 90.98% of patients, and night sweats, observed in 93.17%, were further confirmed as hallmark signs of PTB[36,38].Mucoid was the most commonly observed type, and its diagnostic specificity for PTB appears to be strong. All evaluated sputum characteristics were statistically significant predictors and showed high diagnostic specificity for PTB in this study, although productive cough showed comparatively lower specificity. Those findings were supported with previous studies[41].
The presence of night sweat was observed in 93.17%, were further confirmed as hallmark signs of PTB.These findings disagreed with established literature, where night sweats are widely recognized as a prominent symptom in the majority of PTB cases [20].In fact, night sweats, along with weight loss and fatigue, are considered some of the triad of systemic symptoms, often occurring in conjunction with each other and raising clinical suspicion for TB, as suggested by many findings[36,39,42].Body weight was not statistically identified as a reliable PTB indicator, though prevalent in our findings. However, malnutrition in underweight individuals increased TB susceptibility. BMI, some dyspnea type, and blood pressure showed no significant associations with PTB, consistent with other studies. Dyspnea at rest was a strong predictor of PTB, with 22.4-fold higher odds compared with no dyspnea, consistent with findings from previous studies. However, because the confidence interval for dyspnea at rest was extremely wide and the p-value was exactly 0.05, this finding should be interpreted with great caution. In contrast, exertional dyspnea was not common among those patients and not statistically supported(OR = 0.26, p = 0.13) [41].Dyspnea at given the high frequency of these symptoms among PTB patients, they were considered crucial for early detection and were promptly investigated through sputum analysis and chest imaging. This was supported by previous studies highlighting their role in timely diagnosis. Overall, the systemic findings presented in this study were consistent with the WHO's recommendation for screening based on four symptoms: cough, fever, night sweats, and weight loss[20,37].
The radiological findings, particularly the absence of chest abnormalities in 69.76% of patients, reflected limitations in diagnostic infrastructure [8,43,44].Similar findings were noted in studies where chest X-ray abnormalities were not observed in a significant portion of patients, which could be attributed to differences in radiological interpretation or the use of less advanced imaging techniques[24,42,45,46].However, the identification of pleural effusion and cavitary lesions in a portion of patients pointed to more advanced disease and supported earlier reports of radiographic manifestations of TB[45,47,48]. Chest pain (OR = 2.00; P = 0.15) and chest abnormalities (OR = 6.87; P = 0.00) were identified as a statistically weak predictor of PTB. Thorough chest examinations and radiographic imaging results strongly suggested PTB. The clinical relevance of these findings emphasized the necessity of prompt evaluation in patients presenting with persistent chest pain and radiological abnormalities to facilitate early diagnosis and timely initiation of treatment, ultimately improving patient outcomes[49].Pleural effusion (OR = 2.41; P = 0.09) was identified as a weakly significant indicator, highlighting the importance of imaging studies in diagnosing PTB. Given its relevance, patients with pleural effusion should undergo further investigations, including pleural fluid analysis, to differentiate TB-related effusions from other potential causes. Enlarged hilar lymph nodes were less prevalent in this study and showed an inverse association with PTB (OR = 0.16, P = 0.00), suggesting that they should not be relied upon as a primary diagnostic indicator, emphasizing the need for further assessments in PTB. Pleural fibrosis (OR = 2.31, P = 0.19) showed a statistically non-significant association with PTB, indicating the need to consider a patient’s history of PTB or chronic lung conditions when interpreting imaging[50].Overall, the data indicated that imaging modalities played a significant role in the detection of smear-negative and clinically overt PTB cases. Previous literature also reported similar findings regarding these radiologic features[51].
The results reported in this study should be interpreted in light of several limitations. First, the evaluation of predictors of PTB against EPTP may have been influenced by the imbalance in sample sizes between the two groups, potentially affecting the precision and stability of the estimated associations. Second, the unequal distribution of participants across study sites may have also influenced the overall findings, which predominantly reflects situations in Bench-Sheko zone. Third, data collection in Sheka zone coincided with outbreak of ethnic conflict and a high level of insecurity, which disrupted fieldwork and interrupted data collection process, creating challenges to access the study site. Additionally, resource constraints and some operational irregularities encountered during the study may have affected the completeness and consistency of data collection. Collectively, these factors may have introduced selection bias and information biases and should therefore be considered when interpreting and generalizing the findings. Consequently, the actual TB burden observed in two of those study sites may have been underreported. Nevertheless, the study was conducted as rigorously as possible under the prevailing circumstances, and the findings provide an important representation and baseline data of the observed study population and study settings. Similar limitations were also presented in our previous work[19].
Conclusions
This study provided insights into the prevalence, clinical presentation, and diagnostic methods of active TB, with all participants being newly diagnosed and no cases of relapse, treatment defaults, or MDR TB. The most common symptoms were night sweats, fatigue, appetite loss, weight loss, and productive cough. Chest pain and dyspnea were also frequent. Similarly, lymphadenopathy, cavitation, and pleural effusion were the most prevalent abnormalities. Some respiratory symptoms and chest abnormalities were important predictors of active PTB, with mucopurulent, mucoid sputum, prolonged cough, and abnormal chest findings sharing the strongest associations. Lymphadenopathy was negatively associated, while appetite loss, pleural effusion and fibrosis showed weak associations. The low incidence of relapse and treatment defaults suggested the need for further research to understand these outcomes and improve TB control efforts. MDR TB was not fully addressed here but will be evaluated under subsequent publications.
Funding Statement: This study received financial support from Addis Ababa University, covering the entire process from the project’s inception through to the preparation of the manuscript.
Abbreviations and Acronyms
| AFB | Acid fast bacilli |
| ALIHR | Aklilu Lemma Institute of Health Research |
| CMHS | College of Medicine and health Sciences |
| EPTB | Extrapulmonary tuberculosis |
| FNAC | Fine needle aspiration cytology |
| HHC | Household close contacts |
| HIV | Human Immuno-deficiency |
| IREC | Institutional Research Ethics Committee |
| LJ | Lowenstein–Jensen medium |
| MDR | Multidrug-resistant |
| MTBC | Mycobacterium tuberculosis complex |
| MTU | Mizan-Tepi University |
| OPD | Outpatient department |
| PTB | Pulmonary tuberculosis |
| TB | Tuberculosis |
| SNNPR | Southern, Nation, Nationalities and People’s region |
| WHO | World Health Organization |
Author Contributions
Jelkeba Bali Weyesa, Mengistu Legesse, Balako Gumi, Wondwossen Amogne, Nega Berhe, and Eyob Tekalign contributed equally to the conceptualization and design of this study, review of literature, formation of research objectives, development of the methodology and data collection instruments, fieldwork, Clinical, radiological and laboratory investigations, data curation, and analysis, interpretation of findings, and manuscript preparation. All authors contributed to drafting, reviewing, and revising the manuscript and approval of the final version. All authors take full responsibility for the content of this manuscript.
Institutional Review Board Statement
The study was conducted in accordance with the principles of the Declaration of Helsinki and relevant national and institutional ethical standards for research involving human subjects. The study protocol and procedure were reviewed and approved by the Institutional Review Ethics Committee (IREC) of Aklilu Lemma Institute of health Research (ALIHR), Addis Ababa University, Ethiopia (Protocol code: ALIPB IRB/010/2028, approved on 13 December 2018). Additionally, administrative permission was obtained from the respective zonal health authorities and participating health facilities to facilitate data collection and access relevant patient data required for this study.
Informed consent: Written informed consent was obtained from all adult participants before the interview using a consent form adapted from WHO. Each participant was requested to provide a signature or fingerprint on the consent form to document their consent. For participants younger than 18 years, written informed consent was obtained from their parent or legal guardians using the same WHO-adapted consent procedures, and they also provided a signature or fingerprint to document their consent. Where applicable, written informed assent was also obtained from children were developmentally capable of providing assent. Participation was voluntary, and participants were informed about the study procedures, potential risks and benefits, and their right to withdraw at any time without affecting their access to healthcare services. Participant confidentiality was maintained throughout the study, and all data were securely handled, with access restricted to authorized members of the research team. Sample collection procedures were non-invasive except for fine-needle aspiration cytology (FNAC), which was performed according to standard clinical procedures by pathologist or medical experts. Participant comfort, safety and well-being were prioritized throughout all study procedures.
Data availability statement
The data generated and analyzed in this study are part of a larger ongoing dissertation project. Due to ethical, privacy, and confidentiality restrictions, the data are not publicly available but may be made available from the corresponding author upon request and subject to the necessary ethical approvals.
Acknowledgments
I express my sincere gratitude to Addis Ababa University and the Aklilu Lemma Institute of Health Research for their generous support, the opportunity to conduct this research, and the valuable resources they provide. I am deeply thankful to all those who provided invaluable contributions and collaboration throughout the study. I also sincerely acknowledge Mizan-Tepi University for its essential support and facilitation during the data collection process. Special thanks go to the study sites, their dedicated administrative staff, and the zone health officers for their cooperation and support during data collection. I also acknowledge the ALIHR digital library services and internet access, which play a crucial role in completing this dissertation. Lastly, I am profoundly appreciative of Mizan-Tepi University, CMHS, and their library service for their ongoing support throughout this study.
Conflicts of Interest
The authors declare that no conflicts of interest. The funders had no role in the study design, data collection, analysis, interpretation, manuscript preparation, and decision to publish the results. Prof. Gobena Ameni voluntarily withdrew himself from authorship for his personal reasons.
References
- Brien, F.S. The differential diagnosis of chest pain. Postgrad. Med. 1957, 22(1), 29–35, Epub 1957/07/01. [Google Scholar] [CrossRef] [PubMed]
- Franquet, T. Imaging of Community-acquired Pneumonia. J. Thorac. Imaging 2018, 33(5), 282–94. [Google Scholar] [CrossRef] [PubMed]
- Wei, M.; Yongjie, Z.; Zhuoyu, Q.; Biao, Y.; Xi, J.; Wei, J.; et al. Pneumonia caused by Mycobacterium tuberculosis. Microbes Infect. 2020, 22(6-7), 278–84, Epub 2020/06/21. [Google Scholar] [CrossRef] [PubMed]
- Gambato, M.; Scotti, N.; Borsari, G.; Zambon Bertoja, J.; Gabrieli, J.D.; De Cassai, A.; et al. Chest X-ray Interpretation: Detecting Devices and Device-Related Complications. Diagnostics 2023, 13(4). Epub 2023/02/26. [Google Scholar] [CrossRef] [PubMed]
- Speets, A.M.; van der Graaf, Y.; Hoes, A.W.; Kalmijn, S.; Sachs, A.P.; Rutten, M.J.; et al. Chest radiography in general practice: indications, diagnostic yield and consequences for patient management. Br. J. Gen. Pract. 2006, 56(529), 574–8, Epub 2006/08/03. [Google Scholar] [PubMed]
- Aktoğu, S.; Yorgancioglu, A.; Cirak, K.; Köse, T.; Dereli, S.M. Clinical spectrum of pulmonary and pleural tuberculosis: a report of 5,480 cases. Eur. Respir. J. 1996, 9(10), 2031–5, Epub 1996/10/01. [Google Scholar] [CrossRef] [PubMed]
- Bomanji, J.B.; Gupta, N.; Gulati, P.; Das, C.J. Imaging in tuberculosis. Cold Spring Harb. Perspect. Med. 2015, 5(6). Epub 2015/01/22. [Google Scholar] [CrossRef] [PubMed]
- Piccazzo, R.; Paparo, F.; Garlaschi, G. Diagnostic Accuracy of Chest Radiography for the Diagnosis of Tuberculosis (TB) and Its Role in the Detection of Latent TB Infection: a Systematic Review. J. Rheumatol. 2014, 91, 32. [Google Scholar] [CrossRef] [PubMed]
- Burrill, J.; Williams, C.J.; Bain, G.; Conder, G.; Hine, A.L.; Misra, R.R. Tuberculosis: A Radiologic Review. Radiographics 2007, 27(5), 1255–73. [Google Scholar] [CrossRef] [PubMed]
- Skinner, S. Guide to thoracic imaging. Aust. Fam. Physician 2015, 44(8), 558–62, Epub 2015/10/29. [Google Scholar] [PubMed]
- Skoura, E.; Zumla, A.; Bomanji, J. Imaging in tuberculosis. Int. J. Infect. Dis. 2015, 32, 87–93. [Google Scholar] [CrossRef] [PubMed]
- Alshoabi, S.A.; Almas, K.M.; Aldofri, S.A.; Hamid, A.M.; Alhazmi, F.H.; Alsharif, W.M.; et al. The Diagnostic Deceiver: Radiological Pictorial Review of Tuberculosis. Diagnostics 2022, 12(2). Epub 2022/02/26. [Google Scholar] [CrossRef] [PubMed]
- Jeong, Y.J.; Lee, K.S. Pulmonary tuberculosis: up-to-date imaging and management. AJR Am. J. Roentgenol. 2008, 191(3), 834–44, Epub 2008/08/22. [Google Scholar] [CrossRef] [PubMed]
- Piccazzo, R.; Paparo, F.; Garlaschi, G. Diagnostic accuracy of chest radiography for the diagnosis of tuberculosis (TB) and its role in the detection of latent TB infection: a systematic review. J. Rheumatol. Suppl. 2014, 91, 32–40, Epub 2014/05/03. [Google Scholar] [CrossRef] [PubMed]
- Alemayehu, A.; Wassie, L.; Neway, S.; Ayele, S.; Assefa, A.; Bobosha, K.; et al. Clinical and Imaging Characteristics of Smear Negative Pulmonary Tuberculosis Patients: A Comparative Study. Pulm. Med. 2024, 2024, 2182088, Epub 2024/03/15. [Google Scholar] [CrossRef] [PubMed]
- Abraham, Y.; Manyazewal, T.; Amdemariam, Z.; Petros, H.; Ayenadis, F.; Mekonen, H.; et al. Facilitators and barriers to implementing chest radiography in tuberculosis systematic screening of clinically high-risk groups in Ethiopia: A qualitative study. SAGE Open med. 2024, 12, 20503121241233232, Epub 2024/02/21. [Google Scholar] [CrossRef] [PubMed]
- WHO. WHO consolidated guidelines on tuberculosis: Module 3: Diagnosis. 2025.
- Mohammed, H.; Oljira, L.; Roba, K.T.; Ngadaya, E.; Tesfaye, D.; Manyazewal, T.; et al. Impact of early chest radiography on delay in pulmonary tuberculosis case notification in Ethiopia. Int. J. Mycobacteriology 2021, 10(4), 364–72, Epub 2021/12/18. [Google Scholar] [CrossRef] [PubMed]
- Weyesa, J.B.; Legesse, M.; Gumi, B.; Zewude, A.; Ameni, G. Key risk factors for pulmonary vs. extrapulmonary tuberculosis: a comparative study in Southwest Ethiopia. J. Clin. Tuber. Oth Myc. 2026, 44, 100631. [Google Scholar] [CrossRef] [PubMed]
- Martínez-Sanabria, C.; Méndez-Medina, N.F.; Garduño-Torres, A.E.; Salazar-Lezama, M.Á.; González-Hernández, Y. Clinical and immunologic characteristics of tuberculosis: comparison between children and adults. Neumol. Cir. Torax 2023, 82(2), 84–92. [Google Scholar]
- Sunnetcioglu, A.; Sunnetcioglu, M.; Binici, I.; Baran, A.I.; Karahocagil, M.K.; Saydan, M.R. Comparative analysis of pulmonary and extrapulmonary tuberculosis of 411 cases. Ann. Clin. Microbiol. Antimicrob. 2015, 14, 34, Epub 2015/06/25. [Google Scholar] [CrossRef] [PubMed]
- Ashkin, D.; Hale, Y.; Hollender, E.; Lauzardo, M.; Narita, M.; Pitchenik, A.E.; et al. Chapter 17 - Mycobacterial Disease in Patients with HIV Infection. In AIDS and Other Manifestations of HIV Infection (Fourth Edition); Wormser, G.P., Ed.; Academic Press: San Diego, 2004; pp. 423–78. [Google Scholar]
- Field, S.K.; Escalante, P.; Fisher, D.A.; Ireland, B.; Irwin, R.S.; Adams, T.M.; et al. Cough Due to TB and Other Chronic Infections: CHEST Guideline and Expert Panel Report. Chest 2018, 153(2), 467–97. [Google Scholar] [CrossRef] [PubMed]
- Cudahy, P.; Shenoi, S.V. Diagnostics for pulmonary tuberculosis. Postgrad. Med. J. 2016, 92(1086), 187–93. [Google Scholar] [CrossRef] [PubMed]
- Pinto, L.M.; Pai, M.; Dheda, K.; Schwartzman, K.; Menzies, D.; Steingart, K.R. Scoring systems using chest radiographic features for the diagnosis of pulmonary tuberculosis in adults: a systematic review. Eur. Respir. J. 2012, 42(2), 480–94. [Google Scholar] [CrossRef] [PubMed]
- Ndubuisi, N.; Chibuike, O.; Esther, U.; Christopher, O. Delay in diagnosis of pulmonary tuberculosis among presumptive tuberculosis cases in parts of Anambra State, Nigeria. J. Infect. Dis. Pathol. 2016, 1(120), 2. [Google Scholar]
- Humayun, M.; Chirenda, J.; Ye, W.; Mukeredzi, I.; Mujuru, H.A.; Yang, Z. Effect of Gender on Clinical Presentation of Tuberculosis (TB) and Age-Specific Risk of TB, and TB-Human Immunodeficiency Virus Coinfection. Open Forum Infect. Dis. 2022, 9(10), ofac512, Epub 2022/11/04. [Google Scholar] [CrossRef] [PubMed]
- Peer, V.; Schwartz, N.; Green, M.S. Gender differences in tuberculosis incidence rates-A pooled analysis of data from seven high-income countries by age group and time period. Front Public Health 2022, 10, 997025, Epub 2023/01/28. [Google Scholar] [CrossRef] [PubMed]
- Marçôa, R.; Ribeiro, A.; Zão, I.; Duarte, R. Tuberculosis and gender-Factors influencing the risk of tuberculosis among men and women by age group. Pulmonology 2018, 24(3), 199–202. [Google Scholar]
- Dale, K.; Tay, E.; Trauer, J.; Trevan, P.; Denholm, J. Gender differences in tuberculosis diagnosis, treatment and outcomes in Victoria, Australia, 2002–2015. Int. J. Tuberc. Lung Dis. 2017, 21(12), 1264–71. [Google Scholar] [CrossRef] [PubMed]
- Limenh, L.W.; Kasahun, A.E.; Sendekie, A.K.; Seid, A.M.; Mitku, M.L.; Fenta, E.T.; et al. Tuberculosis treatment outcomes and associated factors among tuberculosis patients treated at healthcare facilities of Motta Town, Northwest Ethiopia: a five-year retrospective study. Sci. Rep. 2024, 14(1), 7695. [Google Scholar] [CrossRef] [PubMed]
- Saunders, M.J.; Wingfield, T.; Datta, S.; Montoya, R.; Ramos, E.; Baldwin, M.R.; et al. A household-level score to predict the risk of tuberculosis among contacts of patients with tuberculosis: a derivation and external validation prospective cohort study. Lancet Infect. Dis. 2020, 20(1), 110–22. [Google Scholar] [CrossRef] [PubMed]
- Sreeramareddy, C.T.; Panduru, K.V.; Verma, S.C.; Joshi, H.S.; Bates, M.N. Comparison of pulmonary and extrapulmonary tuberculosis in Nepal- a hospital-based retrospective study. BMC Infect. Dis. 2008, 8, 8, Epub 2008/01/26. [Google Scholar] [CrossRef] [PubMed]
- Gunal, S.; Yang, Z.; Agarwal, M.; Koroglu, M.; Arıcı, Z.K.; Durmaz, R. Demographic and microbial characteristics of extrapulmonary tuberculosis cases diagnosed in Malatya, Turkey, 2001-2007. BMC Public Health 2011, 11, 1–8. [Google Scholar] [CrossRef] [PubMed]
- Walter, N.; Daley, C.L. Chapter 31 - Tuberculosis and Nontuberculous Mycobacterial Infections. In Clinical Respiratory Medicine (Fourth Edition); Spiro, S.G., Silvestri, G.A., Agustí, A., Eds.; W.B. Saunders: Philadelphia, 2012; pp. 383–405. [Google Scholar]
- Radović, B.; Ilić, A.; Trajković, G.; Savić, S.; Milanović, Z.; Mijović, M. Differences and similarities between the symptoms and clinical signs in patients with pulmonary tuberculosis and pneumonia. Vojnosanit. Pregl. 2019, 76(2). [Google Scholar] [CrossRef]
- Akkerman, O.W.; Guenther, G.; Munoz-Torrico, M.; Babalik, A.; Heyckendorf, J.; Zellweger, J.-P.; et al. Clinical presentation of pulmonary and extrapulmonary tuberculosis. Chall. Tuberc. 21st Century ERS Monogr. 101 2023, 101, 51. [Google Scholar]
- Zellweger, J.-P.; Sousa, P.; Heyckendorf, J. Clinical diagnosis. Tuberculosis (ERS Monograph); Migliori, G.B., Bothamley, G., Duarte, R., Rendon, A., Eds.; 2018; pp. 83–98. [Google Scholar]
- Luies, L.; du Preez, I. The Echo of Pulmonary Tuberculosis: Mechanisms of Clinical Symptoms and Other Disease-Induced Systemic Complications. Clin. Microbiol. Rev. 2020, 33(4). Epub 2020/07/03. [Google Scholar] [CrossRef] [PubMed]
- CDC. Signs and Symptoms of Tuberculosis. 2025.
- Alvarez, S.; Shell, C.; Berk, S.L. Pulmonary tuberculosis in elderly men. Am. J. Med. 1987, 82(3, Part 2), 602–6. [Google Scholar] [CrossRef] [PubMed]
- Rathman, G.; Sillah, J.; Hill, P.C.; Murray, J.F.; Adegbola, R.; Corrah, T.; et al. Clinical and radiological presentation of 340 adults with smear-positive tuberculosis in The Gambia. Int. J. Tuberc. Lung Dis. 2003, 7(10), 942–7, Epub 2003/10/14. [Google Scholar] [PubMed]
- Dholakia, Y.N.; D'Souza, D. T.; Tolani, M.P.; Chatterjee, A.; Mistry, N.F. Chest X-rays and associated clinical parameters in pulmonary tuberculosis cases from the National Tuberculosis Programme, Mumbai. Infect. Dis. Rep. 2012, 4(1), e10, Epub 2012/01/02. [Google Scholar] [CrossRef] [PubMed]
- Nachiappan, A.C.; Rahbar, K.; Shi, X.; Guy, E.S.; Mortani Barbosa, E.J.; Shroff, G.S.; et al. Pulmonary Tuberculosis: Role of Radiology in Diagnosis and Management. Radiographics 2017, 37(1), 52–72. [Google Scholar] [CrossRef] [PubMed]
- Rastoder, E.; Shaker, S.B.; Naqibullah, M.; Wille, M.M.W.; Lund, M.; Wilcke, J.T.; et al. Chest x-ray findings in tuberculosis patients identified by passive and active case finding: A retrospective study. J. Clin. Tuber. Oth Myc. 2019, 14, 26–30. [Google Scholar] [CrossRef] [PubMed]
- Icksan, A.G.; Napitupulu, M.R.S.; Nawas, M.A.; Nurwidya, F. Chest X-Ray Findings Comparison between Multi-drug-resistant Tuberculosis and Drug-sensitive Tuberculosis. J. Nat. Sci. Biol. Med. 2018, 9(1), 42–6, Epub 2018/02/20. [Google Scholar] [CrossRef] [PubMed]
- Ebrahimzadeh, A.; Mohammadifard, M.; Naseh, G. Comparison of chest x-ray findings of smear positive and smear negative patients with pulmonary tuberculosis. Iran. J. Radiol. 2014, 11(4), e13575, Epub 2015/03/18. [Google Scholar] [CrossRef] [PubMed]
- Arango, L.; Brewin, A.W.; Murray, J.F. The spectrum of tuberculosis as currently seen in a metropolitan hospital. Am. Rev. Respir. Dis. 1973, 108(4), 805–12. [Google Scholar] [CrossRef] [PubMed]
- Campbell, I.A.; Bah-Sow, O. Pulmonary tuberculosis: diagnosis and treatment. BMJ 2006, 332(7551), 1194. [Google Scholar] [CrossRef] [PubMed]
- McAdams, H.P.; Erasmus, J.; Winter, J.A. Radiologic Manifestations Of Pulmonary Tuberculosis. Radiol. Clin. North Am. 1995, 33(4), 655–78. [Google Scholar] [CrossRef]
- Swalehe, H.M.; Obeagu, E.I. Tuberculosis: Current diagnosis and management. EJPH 2024, 2(1), 23–33. [Google Scholar]
Figure 1.
Geographical location of those study sites, Southwest Ethiopia. The upper-left panel shows the location of southwest regions of Ethiopia, with study region highlighted. The lower-left panel presents the three selected study zones in SW Ethiopia, represented by different colors: Bench-sheko (light pink), Keffa(magenta), and Sheka(orange). The right panel provides an enlarged view of the study zones and their administrative districts, where districts within bench-sheko zone are shown in light pink, Keffa zone in magenta, and Shuka zone in orange. The maps were prepared using the WGS84 datum and protected coordinate system (PSC), with spatial data obtained from ESA.
Figure 1.
Geographical location of those study sites, Southwest Ethiopia. The upper-left panel shows the location of southwest regions of Ethiopia, with study region highlighted. The lower-left panel presents the three selected study zones in SW Ethiopia, represented by different colors: Bench-sheko (light pink), Keffa(magenta), and Sheka(orange). The right panel provides an enlarged view of the study zones and their administrative districts, where districts within bench-sheko zone are shown in light pink, Keffa zone in magenta, and Shuka zone in orange. The maps were prepared using the WGS84 datum and protected coordinate system (PSC), with spatial data obtained from ESA.
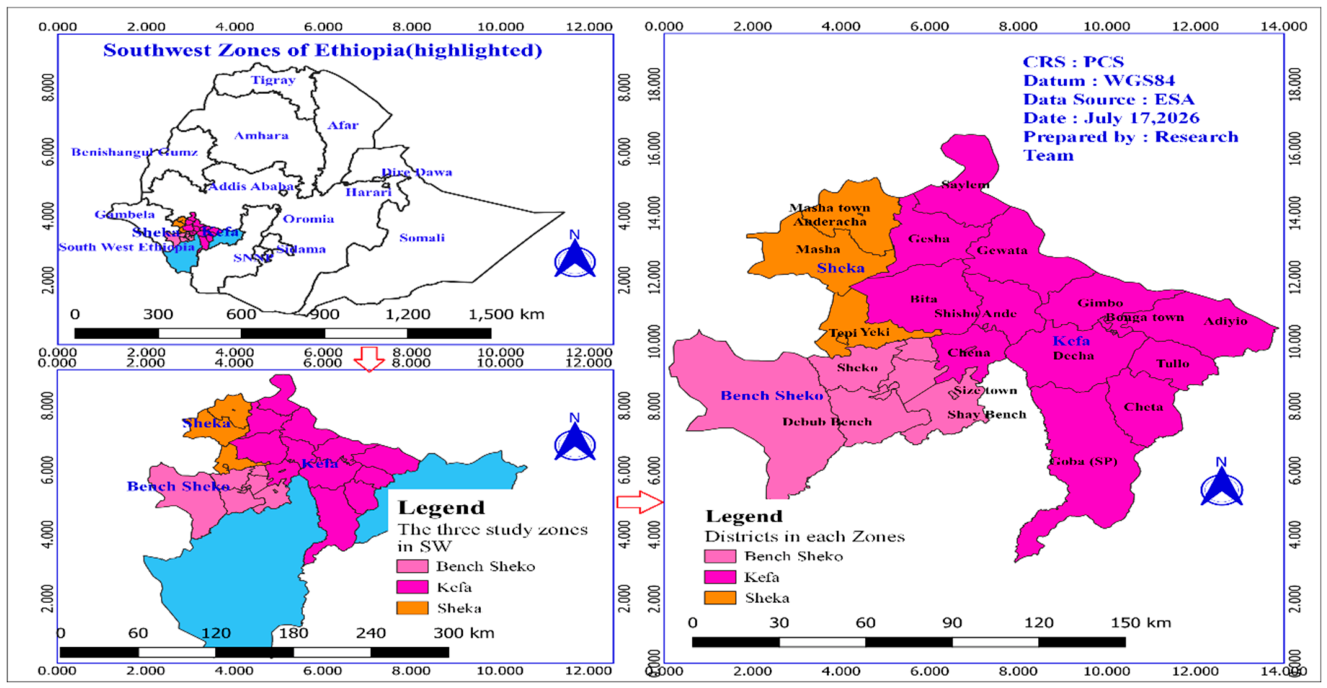
Figure 2.
Diagnostic algorithm for PTB evaluation in outpatient settings. The flowchart summarizes the systemic approaches for evaluation of patients with persistent cough, including bacteriological testing, clinical data and radiologic assessment, empirical antibiotic therapy and subsequent initiation of appropriate TB management based on diagnostic outcomes.
Figure 2.
Diagnostic algorithm for PTB evaluation in outpatient settings. The flowchart summarizes the systemic approaches for evaluation of patients with persistent cough, including bacteriological testing, clinical data and radiologic assessment, empirical antibiotic therapy and subsequent initiation of appropriate TB management based on diagnostic outcomes.
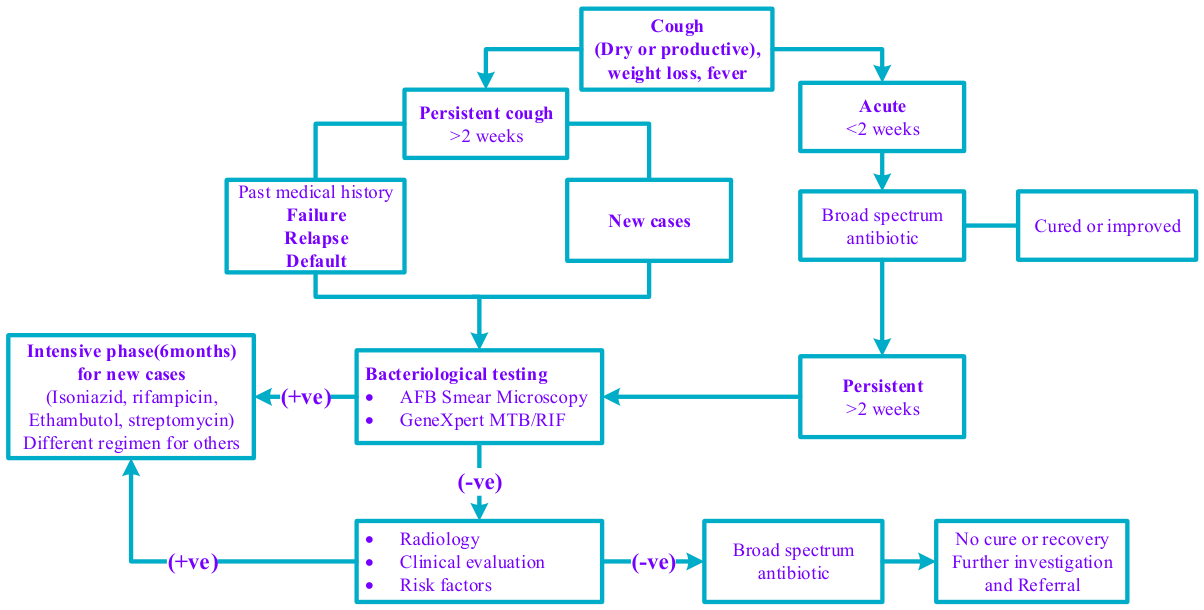
Figure 3.
Typical clinical picture of PTB among study participants. The bar chart shows the common signs and symptoms observed in this study. The X-axis shows lists of the clinical features of case and the Y-axis represents how many times each was reported. Each feature is displayed separately along the X axis with its corresponding count.
Figure 3.
Typical clinical picture of PTB among study participants. The bar chart shows the common signs and symptoms observed in this study. The X-axis shows lists of the clinical features of case and the Y-axis represents how many times each was reported. Each feature is displayed separately along the X axis with its corresponding count.
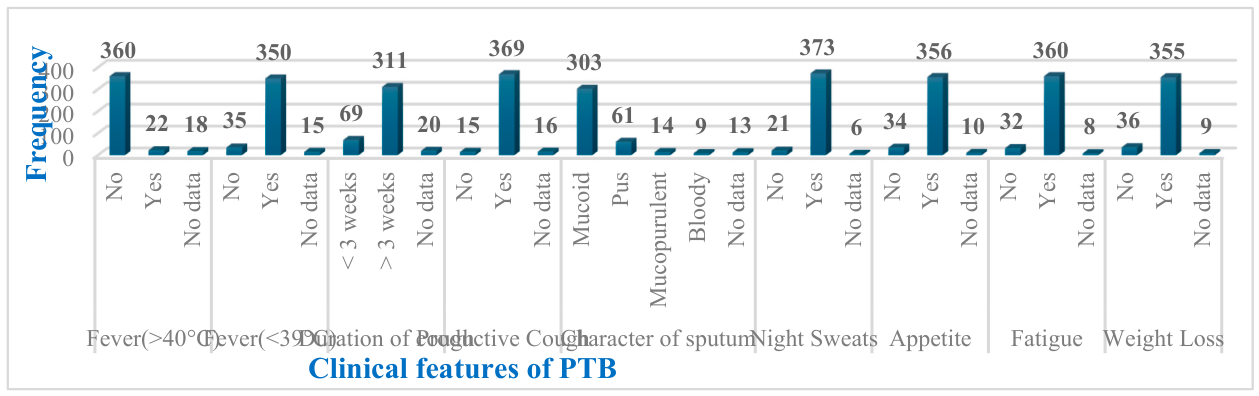
Figure 4.
Prominent radiologic abnormalities by TB form(right) and sex(left). The abnormalities appear on the x-axis, and the y-axis shows how often each one occurred. On the left, the presence of pleural effusion with cavitation in different TB forms is shown for separate sex. On the right, the distribution of lymphadenopathy, nodular lesions, and scarring across the TB forms is presented.
Figure 4.
Prominent radiologic abnormalities by TB form(right) and sex(left). The abnormalities appear on the x-axis, and the y-axis shows how often each one occurred. On the left, the presence of pleural effusion with cavitation in different TB forms is shown for separate sex. On the right, the distribution of lymphadenopathy, nodular lesions, and scarring across the TB forms is presented.
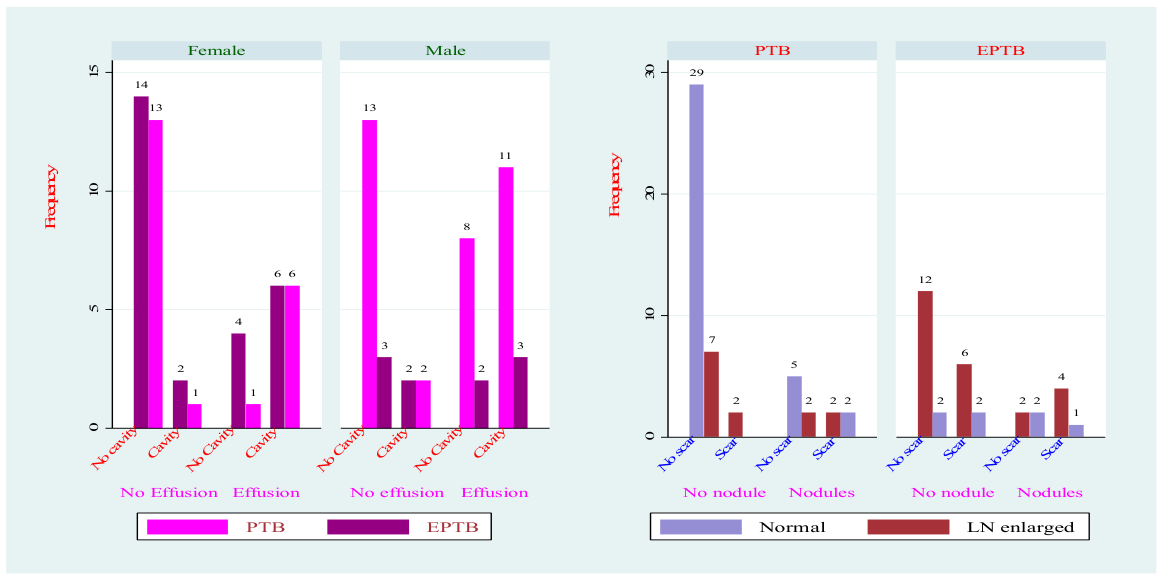
Figure 5.
Chest Radiograph (PA View). The chest radiograph showed findings consistent with chronic PTB. Bilateral patch opacities, fibrotic bands, and cavitary lesions were observed predominantly in the upper lobes, involving the apical and posterior segments, where reactivation TB typically manifests. Evidence of upper lobe volume loss was present, more pronounced on the left side, as indicated by ipsilateral hilar elevation and mild rightward tracheal deviation, suggesting underlying fibrotic remodeling. No focal airspace consolidation and pleural effusion were identified and the cardiac silhouette appeared normal in size. The mediastinum was not widened. Overall, the radiographic features, including upper lobe predominance, cavitation, fibrosis, and structural distortion were typical of chronic reactivation of TB.
Figure 5.
Chest Radiograph (PA View). The chest radiograph showed findings consistent with chronic PTB. Bilateral patch opacities, fibrotic bands, and cavitary lesions were observed predominantly in the upper lobes, involving the apical and posterior segments, where reactivation TB typically manifests. Evidence of upper lobe volume loss was present, more pronounced on the left side, as indicated by ipsilateral hilar elevation and mild rightward tracheal deviation, suggesting underlying fibrotic remodeling. No focal airspace consolidation and pleural effusion were identified and the cardiac silhouette appeared normal in size. The mediastinum was not widened. Overall, the radiographic features, including upper lobe predominance, cavitation, fibrosis, and structural distortion were typical of chronic reactivation of TB.
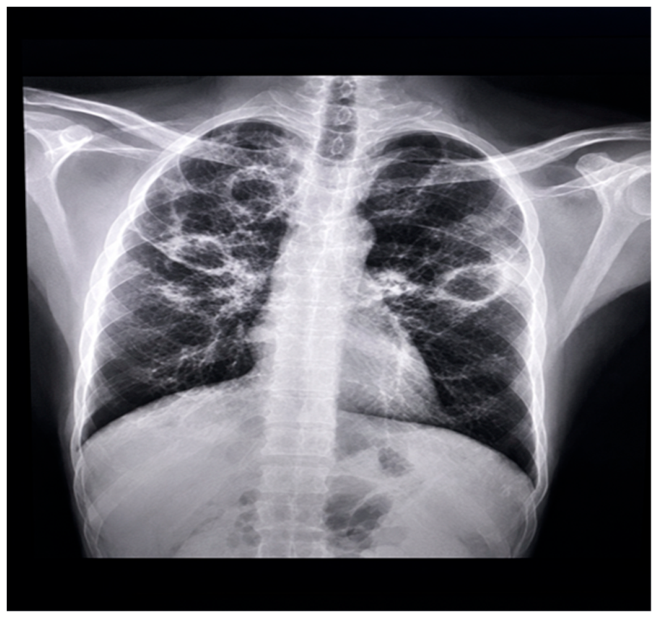
Figure 6.
Chest Imaging: PA Projection. The chest X-ray showed radiographic signs consistent with active PTB. Bilateral patchy infiltrates were present, with ill-defined opacities, involving both lungs, predominantly upper and perihilar regions. The upper lobe predominance is suggestive of reactivation PTB. Multiple cavitary lesions were seen as darker hallow spaces in the midzone areas, indicating damage caused by infection. Additionally, there was evidence of left-sided volume loss, most likely secondary to fibrosis and scarring, resulting in the mild ipsilateral mediastinal and tracheal deviation. The cardiac silhouette was within normal size limits, although it was partially obscured by the adjacent pulmonary abnormalities. Overall, the radiographic findings were highly suggestive of active PTB and were compatible with clinical data and the confirmed diagnosis.
Figure 6.
Chest Imaging: PA Projection. The chest X-ray showed radiographic signs consistent with active PTB. Bilateral patchy infiltrates were present, with ill-defined opacities, involving both lungs, predominantly upper and perihilar regions. The upper lobe predominance is suggestive of reactivation PTB. Multiple cavitary lesions were seen as darker hallow spaces in the midzone areas, indicating damage caused by infection. Additionally, there was evidence of left-sided volume loss, most likely secondary to fibrosis and scarring, resulting in the mild ipsilateral mediastinal and tracheal deviation. The cardiac silhouette was within normal size limits, although it was partially obscured by the adjacent pulmonary abnormalities. Overall, the radiographic findings were highly suggestive of active PTB and were compatible with clinical data and the confirmed diagnosis.
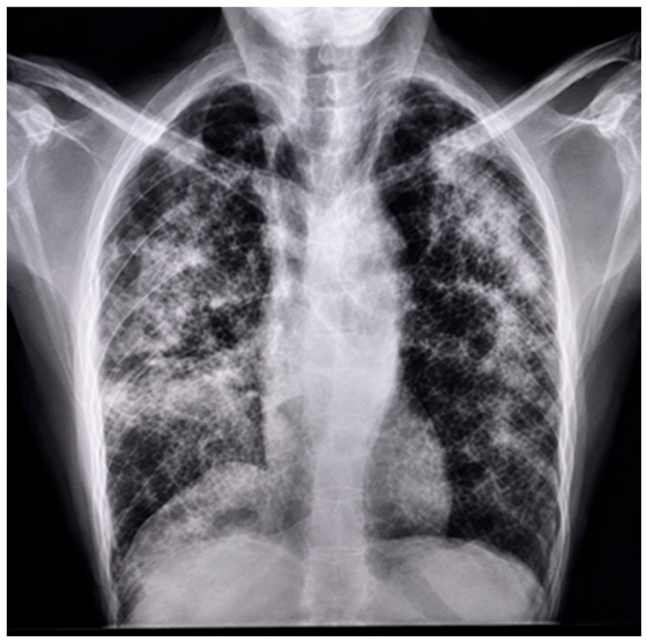
Figure 7.
Chest X ray (PA Projection). The chest x ray showed bilateral patchy infiltrates predominantly involving the upper and mid-lung zones, with no evidence of cavitary lesions. Lung volumes were preserved, and there was no pleural effusion, pneumothorax, or free extrapulmonary air. The cardiac silhouette was within normal size limits, and the mediastinal contours were normal, with no evidence of mediastinal widening or hilar lymphadenopathy. Overall, the radiographic findings were suggestive of early or moderately advanced PTB. Correlation with the clinical data, including cough, weight loss, and night sweats, was essential to support the diagnosis.
Figure 7.
Chest X ray (PA Projection). The chest x ray showed bilateral patchy infiltrates predominantly involving the upper and mid-lung zones, with no evidence of cavitary lesions. Lung volumes were preserved, and there was no pleural effusion, pneumothorax, or free extrapulmonary air. The cardiac silhouette was within normal size limits, and the mediastinal contours were normal, with no evidence of mediastinal widening or hilar lymphadenopathy. Overall, the radiographic findings were suggestive of early or moderately advanced PTB. Correlation with the clinical data, including cough, weight loss, and night sweats, was essential to support the diagnosis.
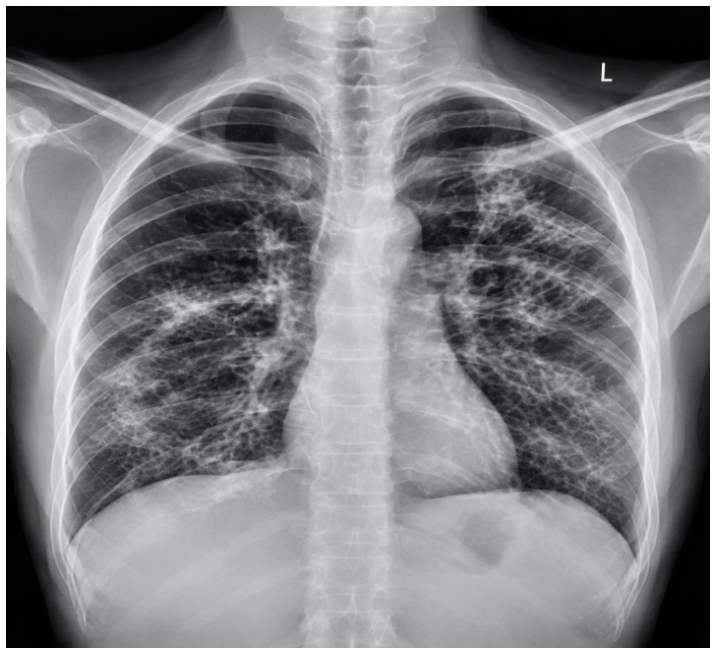
Figure 8.
Chest X-ray Imaging (PA view). The chest X-ray showed extensive bilateral pulmonary opacities involving both lung fields, with greater extension into the middle and lower lung zones. The opacities were heterogeneous and patchy, consistent with diffuse infiltrative changes, raising suspicion for disseminated PTB. The trachea was midline without significant deviation. The cardiac silhouette was partially obscured by the adjacent pulmonary opacities. The visualized thoracic bony structures were intact, with no evidence of fracture or focal osseous lesions. The costophrenic angles were partially obscured, likely reflecting adjacent lower lobe parenchymal diseases or a mild pleural reaction. Overall, the radiographic features were compatible with disseminated PTB and corrected with the clinical findings and confirmed diagnosis.
Figure 8.
Chest X-ray Imaging (PA view). The chest X-ray showed extensive bilateral pulmonary opacities involving both lung fields, with greater extension into the middle and lower lung zones. The opacities were heterogeneous and patchy, consistent with diffuse infiltrative changes, raising suspicion for disseminated PTB. The trachea was midline without significant deviation. The cardiac silhouette was partially obscured by the adjacent pulmonary opacities. The visualized thoracic bony structures were intact, with no evidence of fracture or focal osseous lesions. The costophrenic angles were partially obscured, likely reflecting adjacent lower lobe parenchymal diseases or a mild pleural reaction. Overall, the radiographic features were compatible with disseminated PTB and corrected with the clinical findings and confirmed diagnosis.
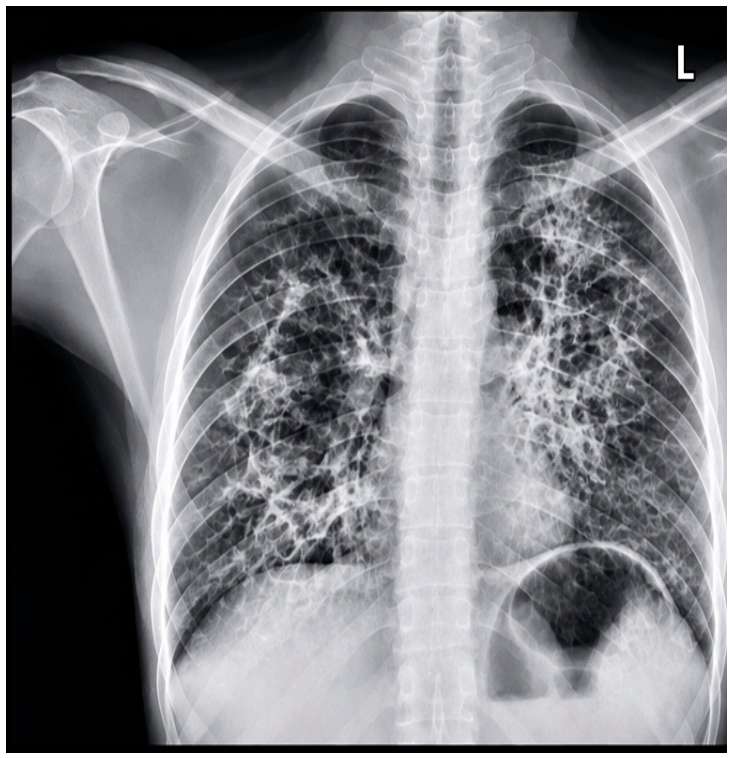
Figure 9.
Chest X ray (PA projection). A large area of consolidation was observed in the left middle and lower lung zones, with associated slightly volume loss. The right hilum appeared elevated, and the fissures were obscured, likely due to atelectasis or fibrosis. These findings were considered suggestive of post-infectious changes, or active PTB. The right lung field was mostly clear, with normal lung markings and no obvious infiltrates or mass lesions seen. The trachea was noted to be deviated toward the right, likely secondary to right lung volume loss. The left ventricle silhouette was obscured by the alveolar opacity. The costophrenic angles were clearly observed and sharp bilaterally, with no effusion detected. The bony thoracic cage, including ribs and clavicles, was showed no evidence of fractures or deformities.
Figure 9.
Chest X ray (PA projection). A large area of consolidation was observed in the left middle and lower lung zones, with associated slightly volume loss. The right hilum appeared elevated, and the fissures were obscured, likely due to atelectasis or fibrosis. These findings were considered suggestive of post-infectious changes, or active PTB. The right lung field was mostly clear, with normal lung markings and no obvious infiltrates or mass lesions seen. The trachea was noted to be deviated toward the right, likely secondary to right lung volume loss. The left ventricle silhouette was obscured by the alveolar opacity. The costophrenic angles were clearly observed and sharp bilaterally, with no effusion detected. The bony thoracic cage, including ribs and clavicles, was showed no evidence of fractures or deformities.
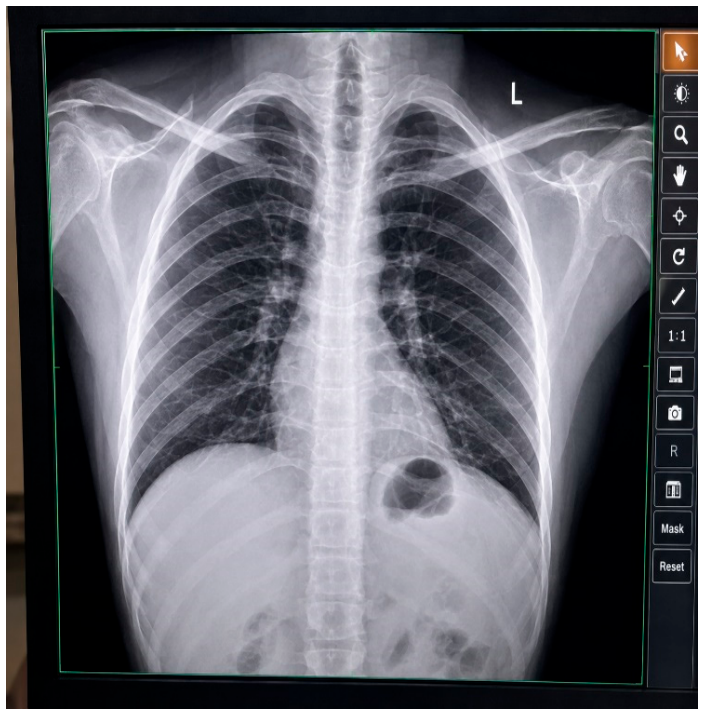
Figure 10.
Chest X-ray Imaging (PA view). Diffuse patchy opacities were observed in both lungs, with greater involvement of the middle and lower zones on the right side. These shows inflammatory process or infiltration. A suspicious cavitary lesion was detected in the right upper lung zone. This was considered suggestive of post-primary (reactivation)PTB. The trachea was found to be in the midline and the cardiac silhouette was seen with normal size and contour. No mediastinal shift was identified. However, the right costophrenic angle was partially obscured, raising suspicion for a possible pleural effusion or basal consolidation. The body thoracic structures, including ribs, clavicles, and spine were visualized and speared without not abnormalities or fractures.
Figure 10.
Chest X-ray Imaging (PA view). Diffuse patchy opacities were observed in both lungs, with greater involvement of the middle and lower zones on the right side. These shows inflammatory process or infiltration. A suspicious cavitary lesion was detected in the right upper lung zone. This was considered suggestive of post-primary (reactivation)PTB. The trachea was found to be in the midline and the cardiac silhouette was seen with normal size and contour. No mediastinal shift was identified. However, the right costophrenic angle was partially obscured, raising suspicion for a possible pleural effusion or basal consolidation. The body thoracic structures, including ribs, clavicles, and spine were visualized and speared without not abnormalities or fractures.
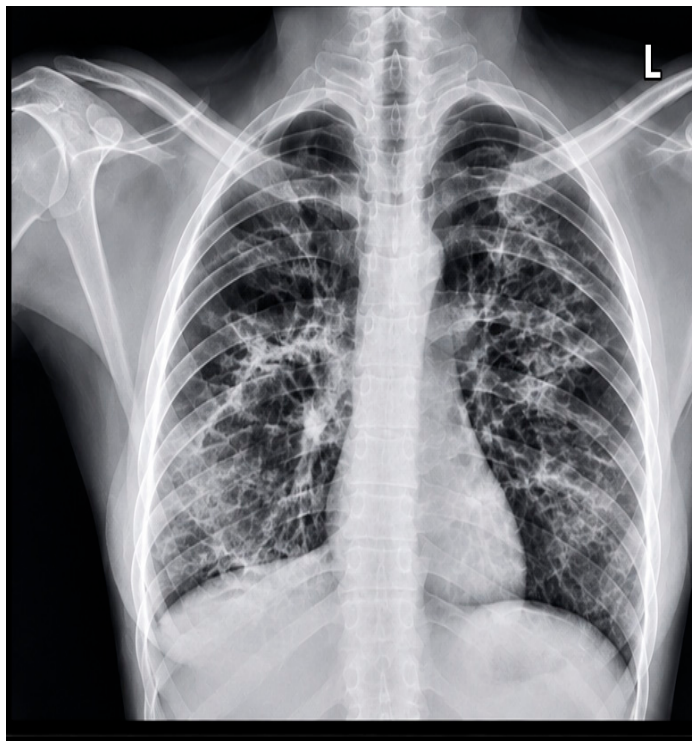

Table 1.
Clinical evidence of TB by form and sex of patients.
| Variable | PTB, N(%) | EPTB, N(%) | Male,N(%) | Female,N(%) |
|---|---|---|---|---|
| High Fever(≥40°C) | ||||
| No | 305(93.56) | 60(75.95) | 200(90.09) | 165(90.16) |
| Yes | 15(4.60) | 7(8.86) | 13(5.86) | 9(4.92) |
| No data | 6(1.84) | 12(15.19) | 9(4.05) | 9(4.92) |
| High Fever(≤39°C) | ||||
| No | 18(5.52) | 18(22.78) | 20(9.01) | 16(8.74) |
| Yes | 304(93.25) | 50(63.29) | 195(87.84) | 159(86.89) |
| No data | 4(1.23) | 11(13.92) | 7(3.15) | 8(4.37) |
| Duration of cough | ||||
| <3wks | 38(11.69) | 32(41.56) | 37(16.82) | 33(18.13) |
| >3wks | 284(87.38) | 27(35.06) | 173(78.64) | 138(75.82) |
| No data | 3(0.92) | 18(23.38) | 10(4.55) | 11(6.04) |
| Productive cough | ||||
| No | 4(1.23) | 13(16.88) | 8(3.64) | 9(4.95) |
| Yes | 320(98.46) | 49(63.64) | 205(93.18) | 164(90.11) |
| No data | 1(0.31) | 15(19.48) | 7(3.18) | 9(4.95) |
| Sputum character | ||||
| Mucoid | 290(89.23) | 13(17.33) | 176(80.00) | 127(70.56) |
| Pus | 6(1.85) | 55(73.33) | 25(11.36) | 36(20.00) |
| Mocoprulent | 13(4.00) | 1(1.33) | 9(4.09) | 5(2.78) |
| Bloody | 9(2.77) | 0 | 4(1.82) | 5(2.78) |
| No data | 7(2.15) | 6(8.00) | 6(2.73) | 7(3.89) |
| Night sweat | ||||
| No | 11(3.38) | 10(13.33) | 12(5.45) | 9(5.00) |
| Yes | 313(96.31) | 60(80.00) | 207(94.09) | 166(92.22) |
| No data | 1(0.31) | 5(6.67) | 1(0.45) | 5(2.78) |
| Appetite loss | ||||
| No | 13(4.00) | 21(28.00) | 18(8.18) | 16(8.89) |
| Yes | 311(95.69) | 45(60.00) | 198(90.00) | 158(87.78) |
| No data | 1(0.31) | 9(12.00) | 4(1.82) | 6(3.33) |
| Fatigue | ||||
| No | 14(4.31) | 18(24.00) | 16(7.27) | 16(8.89) |
| Yes | 310(95.38) | 50(66.67) | 201(91.36) | 159(88.33) |
| No data | 1(0.31) | 7(9.33) | 1(1.36) | 5(2.78) |
| Weight loss | ||||
| No | 16(4.92) | 20(26.67) | 18(8.18) | 18(10.00) |
| Yes | 308(94.77) | 47(62.67) | 199(90.45) | 156(86.67) |
| No data | 1(0.31) | 8(10.67) | 3(1.36) | 6(3.33) |
| Body mass index | ||||
| underweight | 17(5.23) | 6(8.00) | 10(4.55) | 13(7.22) |
| normal | 44(13.54) | 32(42.67) | 47(21.36 |) | 29(16.11) |
| overweight | 1(0.31) | 4(5.33) | 2(0.91) | 3(1.67) |
| No data | 263(80.92) | 33(44.00) | 161(73.18) | 135(75.00) |
| Blood pressure | ||||
| Hypotensive (<90 & <60) | 2(0.62) | 0 | 0 | 2(1.11) |
| Normal (<120 & <80) | 269(82.77) | 39(52.00) | 137(76.11) | 171(77.73) |
| Elevated (120-129 & <80) | 14(4.31) | 6(8.00) | 10(4.55) | 10(5.56) |
| Stage I (130-139 or 80-89) | 12(3.69) | 12(16.00) | 16(7.27) | 8(4.44) |
| Stage II (>140 &/or >90) | 3(0.92) | 5(6.67) | 5(2.27) | 3(1.67) |
| Hypertensive crisis (>180 &/or 120) | 0 | 1(1.33) | 0 | 1(0.56) |
| No data | 25(7.69) | 12(16.00) | 18(8.18) | 19(10.56) |
Table 2.
Association between PTB and prominent symptoms in Active PTB patients.
| Variable | b | z | P>z | e^b | 95%CI | e^bStdX | SDofX |
|---|---|---|---|---|---|---|---|
| Fever(≥40°C) | -1.66 | -5.03 | 0.00 | 0.19 | 0.10 - 0.36 | 0.46 | 0.47 |
| Fever(<39°C) | 0.35 | 0.73 | 0.47 | 1.42 | 0.55 - 3.65 | 1.13 | 0.36 |
| Cough duration | 0.16 | 0.38 | 0.71 | 1.17 | 0.52 - 2.62 | 1.07 | 0.45 |
| Productive cough | -0.47 | -0.69 | 0.49 | 0.62 | 0.16 - 2.36 | 0.88 | 0.27 |
| Night sweat | -0.77 | -1.1 | 0.28 | 0.46 | 0.11 - 1.85 | 0.81 | 0.27 |
| Appetite loss | 1.18 | 1.67 | 0.09 | 3.26 | 0.82 - 13.0 | 1.50 | 0.34 |
| Fatigue | 0.30 | 0.33 | 0.75 | 1.35 | 0.22 - 8.15 | 1.10 | 0.32 |
| Weight loss | 0.41 | 0.55 | 0.59 | 1.51 | 0.35 - 6.57 | 1.15 | 0.34 |
| Chest pain | 0.68 | 1.46 | 0.15 | 2.00 | 0.79 - 4.91 | 1.38 | 0.47 |
| Dyspnea | -0.23 | -0.55 | 0.59 | 0.80 | 0.35 - 1.82 | 0.87 | 0.58 |
| Breath sound | -0.39 | -1.00 | 0.33 | 0.68 | 0.31 - 1.49 | 0.79 | 0.59 |
| Respiratory rate | 0.23 | 0.60 | 0.55 | 1.27 | 0.58 - 2.76 | 1.14 | 0.53 |
| Chest expansion | 0.24 | 0.78 | 0.44 | 1.28 | 0.69 - 2.36 | 1.19 | 0.70 |
| Chest abnormalities | 1.93 | 3.90 | 0.00 | 6.87 | 2.61 - 18.1 | 3.93 | 0.71 |
| Parenchymal infiltration | 0.37 | 0.67 | 0.51 | 1.45 | 0.49 - 4.29 | 1.32 | 0.75 |
| Lymph Node enlarged | -1.81 | -2.87 | 0.00 | 0.16 | 0.05 - 0.56 | 0.29 | 0.69 |
| Pleural effusion | 0.88 | 1.70 | 0.09 | 2.41 | 0.87 - 6.67 | 1.89 | 0.72 |
| Cavity | -0.36 | -0.67 | 0.50 | 0.70 | 0.24 - 2.01 | 0.78 | 0.70 |
| Lymph node scars | 0.25 | 0.43 | 0.67 | 1.28 | 0.41 - 4.03 | 1.20 | 0.71 |
| Parenchymal calcification | -0.91 | -1.62 | 0.11 | 0.40 | 0.13 - 1.21 | 0.51 | 0.73 |
| Pleural fibrosis | 0.84 | 1.32 | 0.19 | 2.31 | 0.66 - 8.08 | 1.84 | 0.72 |
| Nodular lesion | -0.33 | -0.54 | 0.59 | 0.72 | 0.22 - 2.38 | 0.78 | 0.75 |
| constant | -0.61 | -0.74 | 0.46 | . | . | . |
Table 3.
Multiple logistic regression (SOR) analysis for each parameter of PTB patients.
| Variable (Reference) | Subcategory | b | z | P>z | e^b | 95%CI | e^bStdX | SDofX |
|---|---|---|---|---|---|---|---|---|
| Cough duration (<3wks) | >3 weeks | 1.86 | 2.89 | 0.00 | 6.40 | 1.81 - 22.6 | 2.12 | 0.41 |
| No data | -1.21 | -1.13 | 0.26 | 0.30 | 0.04 - 2.44 | 0.76 | 0.22 | |
| Sputum character(Bloody) | Mucoid | 2.68 | 2.91 | 0.00 | 14.6 | 2.40 - 88.4 | 3.05 | 0.42 |
| Pus | -2.16 | -2.13 | 0.03 | 0.12 | 0.02 - 0.84 | 0.46 | 0.36 | |
| Mucopurulent | 4.03 | 2.51 | 0.01 | 56.4 | 2.42 - 1315 | 2.17 | 0.19 | |
| BMI(Normal) | Underweight | 0.37 | 0.37 | 0.71 | 1.45 | 0.20 - 10.4 | 1.08 | 0.21 |
| Overweight | -0.75 | -0.37 | 0.71 | 0.47 | 0.01 - 24.7 | 0.92 | 0.12 | |
| No data | 1.77 | 2.59 | 0.01 | 5.90 | 1.54 - 22.5 | 2.16 | 0.43 | |
|
Dyspnea Severity (No dyspnea) |
Rest | 3.10 | 1.96 | 0.05 | 22.4 | 1.01 - 498 | 1.66 | 0.16 |
| Exertion | -1.35 | -1.52 | 0.13 | 0.26 | 0.05 - 1.48 | 0.71 | 0.25 | |
| No data | 0.43 | 0.66 | 0.51 | 1.53 | 0.43 - 5.43 | 1.22 | 0.47 | |
|
Blood Pressure (Normal) |
Elevated (120-129 & <80) | 0.18 | 0.17 | 0.86 | 1.20 | 0.16 - 9.04 | 1.04 | 0.22 |
| Stage I (130-139 or 80-89) | 0.79 | 0.76 | 0.45 | 2.21 | 0.29 - 17.0 | 1.20 | 0.23 | |
| Stage II (>140 &/or >90) | -1.79 | -1.29 | 0.20 | 0.17 | 0.01 - 2.52 | 0.77 | 0.15 | |
| No data | 0.75 | 0.79 | 0.42 | 2.13 | 0.33 - 13.8 | 1.24 | 0.29 | |
|
Respiratory Count (NFR) |
>21 breaths/min | -1.51 | -1.47 | 0.14 | 0.22 | 0.03 - 1.65 | 0.48 | 0.49 |
| >41 breaths/min | -1.79 | -1.63 | 0.10 | 0.17 | 0.02 - 1.44 | 0.41 | 0.50 | |
| Constant | -0.98 | -0.72 | 0.46 | . | 0.03 - 5.30 | . | . |
Abbreviations: b = raw coefficient; e^b = exp(b) = factor change in odds for unit increase in X; e^bStdX = exp (b*SD of X) = change in odds for SD increase in X; SDofX = standard deviation of X.
Disclaimer/Publisher’s Note: The statements, opinions and data contained in all publications are solely those of the individual author(s) and contributor(s) and not of MDPI and/or the editor(s). MDPI and/or the editor(s) disclaim responsibility for any injury to people or property resulting from any ideas, methods, instructions or products referred to in the content. |
© 2026 by the authors. Licensee MDPI, Basel, Switzerland. This article is an open access article distributed under the terms and conditions of the Creative Commons Attribution (CC BY) license (http://creativecommons.org/licenses/by/4.0/).
Copyright: This open access article is published under a Creative Commons CC BY 4.0 license, which permit the free download, distribution, and reuse, provided that the author and preprint are cited in any reuse.