

Submitted:
04 October 2026
Posted:
08 October 2026
You are already at the latest version
Abstract
Background: We examined whether health literacy and chronic-disease self-efficacy were independently associated with healthcare use among older adults with multimorbidity. Methods: This secondary cross-sectional analysis included 464 community-dwelling adults aged ≥65 years with ≥2 chronic conditions receiving primary care in Vlora Municipality, Albania. Six-month general practitioner (GP), emergency department (ED), admission, and hospital-night counts were analysed using negative-binomial, logistic, and zero-truncated count models. Models adjusted for age, gender, education, BMI, self-rated health, chronic-disease count, health centre, and residence. Results: Health literacy was not associated with GP-visit frequency (IRR 1.002, 95% CI 0.982–1.023; p=0.820), whereas higher self-efficacy was associated with fewer GP visits (IRR 0.909, 95% CI 0.857–0.964; p=0.002). Higher health literacy was associated with greater odds of ED use (OR 1.112, 95% CI 1.055–1.172), admission (OR 1.097, 95% CI 1.034–1.164), and hospital use (OR 1.092, 95% CI 1.031–1.157), while self-efficacy was associated with lower odds (ORs 0.731, 0.636, and 0.647; all p<0.001). Among users, health literacy predicted more admissions (IRR 1.085, 95% CI 1.014–1.160; p=0.018), but neither exposure predicted ED frequency or hospital-night duration. Conclusions: Self-efficacy and health literacy were associated mainly with entry into acute and hospital care, rather than subsequent intensity. Prospective, record-linked studies are needed to clarify these relationships.
Keywords:
health literacy
; chronic-disease
; self-efficacy
; multimorbidity
; older adults
; healthcare utilisation
; emergency department
; hospitalisation
; primary healthcare
; Albania
1. Introduction
1.1. Multimorbidity and Patterns of Healthcare Use in Later Life
Earlier work in this Albanian primary-care cohort showed that health literacy and chronic-disease self-efficacy were positively related, but that analysis did not address healthcare use [1]. The present study moves from the relationship between the two capabilities to a different question: how each is associated with contact with primary, emergency, and hospital services. Multimorbidity changes the practical meaning of healthcare use. Older adults must often reconcile several treatment plans, monitor overlapping symptoms, manage polypharmacy, and decide which professional to contact when advice conflicts. These demands grow as function declines or treatment burden rises [2,3]. At population level, multimorbidity is associated with substantially higher odds of hospitalisation and a modest increase in readmission, although its relationship with length of stay is less consistent [4]. Service use is therefore produced by more than the number of diagnoses. Clinical severity matters, but so do access, continuity, family support, transport, referral practice, and the organisation of local services. Reviews of multimorbidity care emphasise comprehensive assessment, shared decisions, individualised plans, and coordination across settings because disease-by-disease systems can leave patients carrying the work of integration themselves [5,6].
1.2. Health Literacy, Navigation, and Help-Seeking
Health literacy concerns the knowledge, motivation, and competencies used to access, understand, appraise, and apply health information [7]. In multimorbidity, this includes more than reading instructions. Patients must compare recommendations, recognise warning signs, communicate across professional groups, and judge when a problem can be managed at home and when it requires routine, urgent, or hospital care. The HLS-EU-Q16 captures perceived difficulty with these tasks across healthcare, disease prevention, and health promotion [8,9]. Limited health literacy has repeatedly been linked with poorer health outcomes, less effective communication, and greater use of emergency or hospital services [10,11,12,13]. Yet the literature is not uniform. Studies use different instruments, populations, and definitions of utilisation, and the same contact can represent delayed crisis care in one setting but timely, appropriate help-seeking in another [11,12]. Preventable ED use is only one part of the picture [14]. For that reason, the expected direction of association is not straightforward. Better health literacy may reduce avoidable use by improving adherence, symptom monitoring, and use of routine care. It may also increase appropriate contact by helping people identify deterioration, describe symptoms clearly, request a referral, or navigate a complex system. A positive association with service use cannot, by itself, be read as evidence of harm, inefficiency, or poor self-management [15].
1.3. Self-Efficacy: Understanding is Not the Same as Acting
Chronic-disease self-efficacy refers to confidence in carrying out the actions required to manage illness. It includes confidence in symptom control, activity, emotional coping, obtaining support, and communication with clinicians [16,17]. Health literacy and self-efficacy are related, but they are not interchangeable. A person may understand a plan and still feel unable to follow it because of pain, fatigue, fear, cost, competing treatment demands, or lack of help at home [18]. Evidence on the broader construct of patient activation, which combines knowledge, skills, and confidence, suggests an inverse association with hospitalisation and ED use in chronic-disease populations [19]. At the same time, older adults receiving acute or inpatient care tend to report lower general self-efficacy than those receiving care in less intensive settings [20]. Both pathways are plausible: low confidence may make early self-management harder, while serious illness, functional loss, and recent hospital care may erode confidence. Treatment burden sharpens this distinction. Even a well-informed patient may struggle when appointments, medicines, monitoring, travel, and lifestyle recommendations compete for limited time and energy [21]. Self-efficacy may therefore be especially relevant before the threshold into urgent care, when people are deciding whether they can respond to a change, seek advice, or continue managing at home.
1.4. What Healthcare Utilisation Does-and Does Not-Represent
Healthcare utilisation is often treated as a single outcome, but contacts with different services do not carry the same meaning. A planned GP visit may support prevention or medication review. An ED visit may represent necessary escalation, delayed access to primary care, uncertainty about symptoms, or a preference shaped by previous experience. Hospital admission may be appropriate and unavoidable. Counts alone cannot distinguish these possibilities [22].
Recent intervention evidence illustrates the problem. A 2025 systematic review of multimorbidity interventions found limited and inconsistent effects on utilisation overall. Self-management support was associated with fewer hospitalisations but slightly more ED visits, while care coordination combined with self-management support was linked to fewer hospitalisations and ED visits but more outpatient and GP contacts [23]. These patterns are better understood as possible redistribution of care across settings than as a simple reduction in use. The content of support also matters. Reviews of disadvantaged older adults favour accessible, culturally responsive, multicomponent approaches rather than information alone [24]. Qualitative evidence shows why: older people with multimorbidity describe reduced physical capacity, anxiety, financial pressure, disrupted daily routines, weak coordination, and reliance on family and professionals [25]. Such constraints can shape both confidence and the ability to obtain timely care. Evidence from emergency care is similarly cautious. Systematic reviews have found that many ED-based interventions do not consistently reduce revisits or admissions. The more promising approaches combine early geriatric assessment, care coordination, referral, and follow-up, while acknowledging that some recurrent use reflects frailty and disease trajectory rather than a remediable failure of patient behaviour [26,27]. Utilisation should therefore be interpreted alongside outcomes that matter to older adults. Independence, physical function, quality of life, mental wellbeing, and the experience of coordinated care may be more important than reducing every contact [28]. Nurse-led and multidisciplinary models can strengthen self-management, adherence, function, and continuity, with some evidence of lower readmission or healthcare burden, but effects depend on context and implementation [29].
1.5. Albanian Primary Care and the Research Programme
The Albanian setting may influence how health literacy and confidence translate into realised care. National research has linked primary-care use with geographical proximity, financial circumstances, perceived quality, professional attitudes, chronic illness, and diagnostic resources [30]. Primary-care staff in Vlora have described gaps in infrastructure, protocols, referral pathways, and coordination for people with multimorbidity [31]. Similar constraints are reported across resource-limited settings, where distance, workforce shortages, fragmented services, and weak person-centred care can shift demand towards emergency or hospital services [32]. This is the third manuscript from the same participant cohort. The first paper reported the association between health literacy and chronic-disease self-efficacy [1]. A separate measurement paper examines the structure and group comparability of the HLS-EU-Q16. The current analysis addresses a distinct outcome question: whether health literacy and self-efficacy are independently associated with the occurrence and intensity of healthcare use.
1.6. Study Aim and Hypotheses
The aim was to estimate the independent associations of health literacy and chronic-disease self-efficacy with six-month GP, ED, and hospital utilisation among adults aged 65 years or older with multimorbidity receiving primary care in Vlora Municipality. The analysis separated the occurrence of ED and hospital use from frequency or duration among users because the factors that lead to service entry may differ from those that shape care after entry. Higher self-efficacy was expected to be associated with lower utilisation, particularly a lower probability of urgent or hospital care. No directional hypothesis was imposed for health literacy because both reduced avoidable use and improved access to appropriate care were plausible. Interaction analyses were exploratory ( Box 1).

Box 1.
Study objectives, research questions, and analytical approach.
| Objective | Research question | Primary analysis | Purpose |
|---|---|---|---|
| Describe utilisation | RQ1. How common and how variable were GP, ED, admission, and hospital-night counts? | Descriptive statistics | Establish the distribution, skewness, and proportion of zero use. |
| Assess GP frequency | RQ2. Are health literacy and self-efficacy independently associated with the number of GP visits? | Negative-binomial regression | Model an overdispersed count outcome with relatively few zeros. |
| Assess occurrence | RQ3. Are the two exposures associated with whether any ED or hospital use occurred? | Logistic regression | Estimate the odds of crossing the threshold into each service. |
| Assess intensity | RQ4. Among users, are the exposures associated with frequency or duration? | Zero-truncated Poisson or negative-binomial regression | Model positive counts when zero is impossible by design. |
| Test robustness | RQ5. Do the findings persist under alternative count specifications and after excluding discordant hospital records? | Sensitivity analyses | Evaluate dependence on model form and data consistency. |
| Clarify coefficient changes | RQ6. Does adding self-efficacy change the estimated health-literacy association? | Sequential models | Describe statistical suppression or negative confounding; not mediation. |
| Explore effect modification | RQ7. Does the health-literacy association differ across levels of self-efficacy? | Centred interaction models | Generate hypotheses about whether information and confidence operate jointly. |
2. Materials and Methods
2.1. Study Design, Reporting Framework, and Cohort Overlap
This article reports a secondary analysis of a cross-sectional study of community-dwelling older adults with multimorbidity receiving primary healthcare in Vlora Municipality, Albania. No additional participants were recruited and no new variables were collected for this paper. The cohort, health-literacy measure, self-efficacy measure, and selected descriptive characteristics were reported in the first publication [1]. The present hypotheses, healthcare-utilisation outcomes, two-part count models, sensitivity analyses, sequential models, and interaction analyses are distinct. Reporting was organised with reference to the STROBE recommendations for cross-sectional studies [33]. Health literacy and self-efficacy were measured at the study assessment, while utilisation referred to the preceding six months. This design does not establish temporal ordering. All regression results are therefore interpreted as adjusted associations, not as causal effects, mediation effects, or predictions of future utilisation.
2.2. Study Setting
The study was conducted in five public primary healthcare centres in Vlora Municipality, southern Albania. The centres served urban and surrounding administrative areas, including Novoselë and Orikum. Centre indicators were included in every adjusted model because differences in staffing, access, referral practices, diagnostic resources, and service organisation could influence utilisation independently of patient characteristics [30,31]. Participants were recruited from February to July 2025. The analytical residence variable included urban, peri-urban, and rural categories..
2.3. Participants and Eligibility
Eligible participants were aged 65 years or older, lived in the community, had at least two physician-diagnosed chronic conditions, were registered with and receiving care from a participating centre, and provided written informed consent. People with documented cognitive impairment that prevented informed consent or reliable questionnaire completion, including diagnosed dementia, were excluded, as were those who declined participation.
2.4. Sampling and Recruitment
Primary healthcare centres were selected using the procedure described in the parent study [x]. Sampling was stratified by place of residence. Within each participating centre, eligible individuals were selected from family-physician registers using a randomised list and approached sequentially until the required allocation was reached. If a selected person was ineligible or declined, the next eligible person was invited. Recruitment continued until 464 participants had been enrolled.
2.5. Sample-Size Basis
The parent study estimated a minimum sample of 384 using a single-proportion formula with 95% confidence, an expected proportion of 0.50, and a margin of error of 0.05 [1]. The target was increased by approximately 20% to accommodate ineligibility and non-response, producing a recruitment goal of 464. This was a survey sample-size calculation, not an outcome-specific power analysis for the current regressions. All eligible observations were retained, and uncertainty is presented through 95% confidence intervals.
2.6. Data Collection and Questionnaire Administration
The questionnaire covered sociodemographic and clinical characteristics, health literacy, chronic-disease self-efficacy, and healthcare utilisation. The questionnaires were administered by the main researcher and the PhD student, while healthcare utilisation counts were self-reported by study participants. Recorded characteristics included age, gender, education, self-rated health, number of chronic diseases, primary healthcare centre, and residence. Weight and height were used to calculate body mass index (BMI). The database contained responses to all 16 health-literacy items and all 33 self-efficacy items.
2.7. Healthcare-Utilisation Outcomes
Four non-negative count outcomes over the preceding six months were assessed: GP visits, ED visits, hospital admissions, and hospital nights. For ED visits, admissions, and hospital nights, two-part outcomes distinguished any use (zero vs. ≥1) from positive frequency or duration among users [31,32]. GP visits, with few zeros, were analysed as a single full-sample count.
2.8. Health Literacy
Health literacy was assessed using the 16-item HLS-EU-Q16, based on the HLS-EU framework [7,8,9]. Items cover access, understanding, appraisal, and application of health information. Responses were coded 1 for fairly/very easy and 0 for fairly/very difficult, yielding a complete 0–16 score, with higher values indicating greater perceived health literacy. The continuous score was used in all regressions; inadequate (0–8), problematic (9–12), and adequate (13–16) levels were used descriptively [9]. The measure reflects perceived health literacy rather than direct reading or numeracy performance.
2.9. Chronic-Disease Self-Efficacy
Chronic-disease self-efficacy was assessed using a 33-item instrument derived from Stanford chronic-disease self-management measures [16]. Items were rated from 1 (not at all confident) to 10 (totally confident) across nine domains. Domain scores were calculated as item means, and the overall score as the unweighted mean of the nine domains, ensuring equal domain contribution. Scores ranged from 1–10, with higher values indicating greater confidence. The continuous overall score was used in all models.
2.10. Covariates and Coding
Covariates were prespecified based on their potential associations with healthcare need, access, health literacy, self-management, and service organisation. The same adjustment set was used in all models: age, gender, education, BMI, self-rated health, chronic-disease count, health centre, and residence. No automated covariate selection was applied. Self-rated health was grouped as excellent/very good, good, and fair/poor; chronic-disease count as two versus three conditions; health centre as a five-level fixed effect; and residence as urban, peri-urban, or rural. Reference categories were male, primary education, excellent/very good health, two conditions, Centre 1, and urban residence. Fixed centre effects were used because only five centres were available.
2.11. Data Management and Quality Assurance
Data preparation was independently reproduced in Stata and R, including checks of identifiers, duplicates, variable types, ranges, outcome validity, BMI, HLS-EU-Q16, self-efficacy scores, and missingness. Reconstructed values matched the stored variables. All 464 participants had complete data for primary analyses; therefore, no imputation was performed. A prespecified consistency flag identified 12 participants (2.6%) reporting admissions without hospital nights or vice versa. They were retained in the primary analysis because the discrepancy could not be resolved retrospectively. Admission and hospital-night models were repeated after their exclusion.
2.12. Reliability of the Exposure Measures
Internal consistency was assessed using Cronbach’s alpha [32]. Alpha was 0.924 for HLS-EU-Q16 and 0.974 for overall self-efficacy, with domain values of 0.840–0.958. These findings support the reliability of the exposure scores in this sample. Reliability was considered a prerequisite check, not evidence of unidimensionality or cultural invariance, nor the primary research objective.
2.13. Statistical Analysis and Rationale
The analytical strategy was estimand-driven, with models selected according to the clinical question and outcome distribution. GP use was common, whereas ED and hospital outcomes had many zeros. Poisson, negative-binomial, hurdle, and zero-inflated models address dispersion and zero values differently [33,34,35]. A prespecified sequence of distribution checks, model selection, convergence and support assessment, common covariate adjustment, and sensitivity, interaction, sequential, and cross-software analyses was followed to minimize data- and p-value–driven model selection.
2.13.1. Descriptive Analysis and Preliminary Data Checks
Continuous characteristics were summarised using means and standard deviations, and categorical variables using frequencies and percentages. Healthcare counts were additionally described by medians, interquartile ranges, ranges, and zero/positive-use proportions to account for skewness. Data checks confirmed identifier uniqueness, valid outcome ranges and codes, and reconstruction of BMI, HLS-EU-Q16, self-efficacy domains, and overall self-efficacy. All 464 participants had complete data for primary models; therefore, no imputation was required. These checks ensured data integrity and model eligibility.
2.13.2. Assessment of Over Dispersion and Poisson Adequacy
Poisson regression assumes equidispersion, whereas negative-binomial regression allows variance to exceed the mean through an estimated dispersion parameter [34,35]. All outcomes showed significant overdispersion: chibar²=142.81 for GP visits, 157.64 for ED visits, 76.74 for admissions, and 1221.19 for hospital nights (all p<0.001). Negative-binomial regression was therefore used for full-sample counts, reducing the risk of underestimated standard errors and overstated precision.
2.13.3. Negative-Binomial Model for GP Visits
GP visits were analysed using a full-sample negative-binomial model because 86.6% of participants reported at least one visit and RQ2 focused on overall consultation frequency. A two-part model would have shifted the estimand to separate use and frequency processes. The log-link model yielded incidence-rate ratios (IRR=exp(β)), representing multiplicative changes in expected GP-visit rates per one-point increase in health literacy or self-efficacy, adjusted for covariates. Model checks confirmed convergence, finite estimates, N=464, robust covariance estimation, and reproduction of estimates in R [33,34,35,36].
2.13.4. Two-Part Strategy for ED and Hospital Outcomes
ED visits had 42.2% zero values, while admissions and hospital nights each had 69.4%. A hurdle approach was therefore used to distinguish initiation of care from subsequent frequency or duration [33,34,35]. Logistic regression estimated the probability of any use, while zero-truncated count models estimated use frequency or duration among users. The two effects were interpreted separately. Zero-inflated models were not used because zeros represented observed non-use during the six-month period rather than a structurally “always-zero” subgroup.
2.13.5. Choice of Positive-Count Distribution
Positive counts were modelled separately because truncation changes the outcome support and likelihood. ED visits (n=268) and hospital nights (n=142) remained overdispersed and were analysed using zero-truncated negative-binomial models. Admissions (n=142) showed negligible dispersion, so a more parsimonious zero-truncated Poisson model was used. All models met checks for positive outcomes, expected sample size, convergence, finite estimates and confidence intervals, robust covariance estimation, and reproducibility in R. Findings from the smaller admission and hospital-night samples were interpreted cautiously given the relatively large covariate set.
2.13.6. Covariate Strategy, Centre Adjustment, and Effect Measures
Health literacy and self-efficacy were entered simultaneously because they were positively related but potentially had distinct associations with healthcare use. Joint modelling provided coefficients conditional on the other construct and reduced potential omitted-variable distortion. Covariates were prespecified based on demographic characteristics, information resources, health need, geographical access, and service organisation, and the same set was retained across all primary models without stepwise selection [33,35]. Centre was modelled using fixed effects because only five centres were available. Huber–White standard errors were used, but these were not cluster-robust [36,37]. Logistic and count effects are reported as ORs and IRRs, respectively, with 95% CIs, representing conditional associations per one-point exposure increase.
2.13.7. Sensitivity and record-Consistency Checks
Sensitivity analysis was used to test model dependence rather than to search for a preferred result. First, ED visits, admissions, and hospital nights were re-analysed as single full-sample negative-binomial counts. These models intentionally collapsed occurrence and intensity and therefore tested whether the main directional conclusions survived a different estimand. Second, admission and hospital-night models were repeated after excluding the 12 participants with discordant admission and night reports. Third, outcome definitions, exposure coding, reference categories, and covariates were held constant across specifications. Robustness was judged from the consistency of direction, magnitude, confidence intervals, and substantive interpretation, not solely from whether p values remained below 0.05.
2.13.8. Sequential Models and Assessment of Statistical Suppression
Sequential logistic models assessed any ED use and hospital admission. Model 1 included health literacy, Model 2 added self-efficacy, and Model 3 added all covariates. This was not a mediation analysis, as temporal and causal requirements were unmet. Instead, the analysis assessed whether adjusting for the positively correlated self-efficacy measure altered the health-literacy association, consistent with statistical suppression or negative confounding [38]. The sequential models helped explain changes in health-literacy effects across specifications.
2.13.9. Exploratory Interaction Analysis and Multiplicity Control
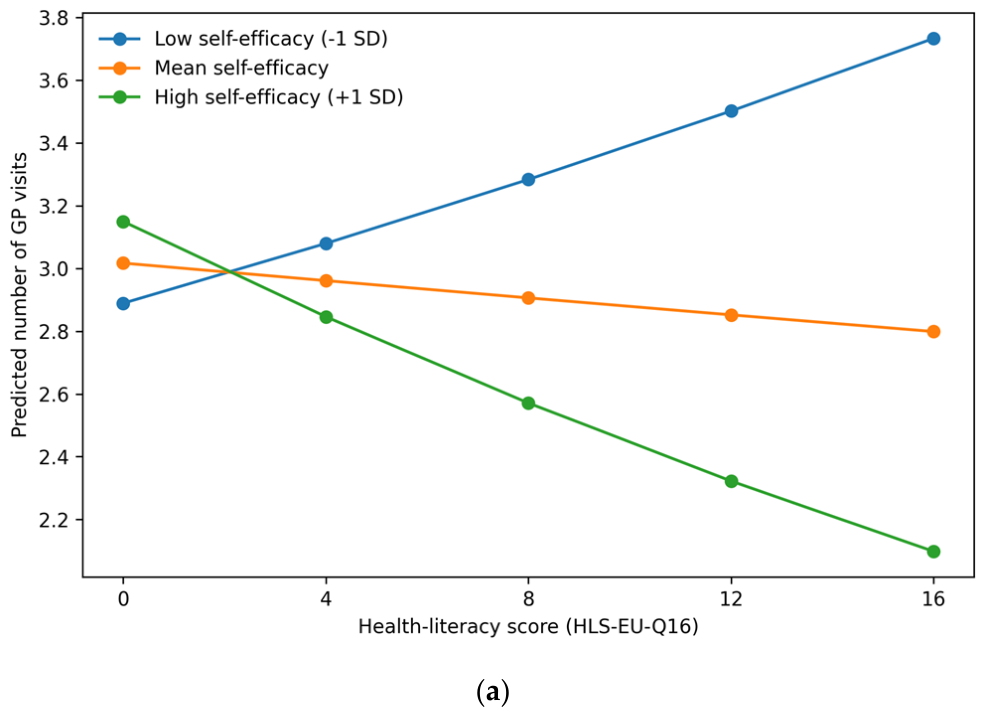
Health literacy and self-efficacy were mean-centred before interaction testing. Interactions were assessed for GP visits, ED use, admissions, and hospital nights, using a Bonferroni threshold of 0.0125 for the four exploratory tests [39]. For GP visits, adjusted predictions and conditional health-literacy slopes were examined at self-efficacy levels of −1 SD, mean, and +1 SD. Interaction findings were interpreted based on consistency across product-term tests, conditional slopes, multiplicity adjustment, and software replication.
2.13.10. Convergence, Reproducibility, and Scope of the Reported Checks
Primary analyses were conducted in Stata 13.1 [40,41] and independently replicated in R 4.3.3 [42], including full-count, two-part, sensitivity, sequential, and interaction analyses. Reproducibility was assessed by comparing sample sizes, estimates, confidence intervals, and conclusions. Results were consistent across programs, with minor differences in robust CIs and p-values that did not affect main-effect conclusions. Only available diagnostics are reported; unavailable residual, influence, collinearity, link, and calibration diagnostics were not assessed.
2.13.11. Statistical Decision Rules and Interpretation Boundaries
All primary tests were two-sided, with p<0.05 and 95% CIs excluding 1.00 indicating prespecified main exposure associations. The Bonferroni threshold applied only to the four exploratory interaction tests; no correction was applied to secondary covariate coefficients. Effect sizes and CIs were prioritised over significance labels. Given the cross-sectional design and retrospective six-month utilisation data, results represent adjusted associations rather than causal effects, future risks, preventable use, or mediation pathways. Reporting followed STROBE principles [43].
2.14. Ethical Considerations
The parent study was conducted in accordance with the Declaration of Helsinki and applicable European research-ethics standards. Participation was voluntary and written informed consent was obtained. Personal data were handled in accordance with Albanian Law No. 9887 of 10 March 2008, as amended by Law No. 48/2012. The study was reviewed by the Operator of Health Care Services, the Regional Directorate of Vlora, and the Directorate of Public Health and Health Education. Ethical approval was granted on 3 June 2024 (No. 1084/1).
3. Results
3.1. Analytical Sample and Data-Quality Checks
All 464 enrolled participants contributed to every full-sample primary model. There were no duplicate identifiers, no missing values in the model variables, and no out-of-range exposure values. Reconstructed BMI, HLS-EU-Q16, self-efficacy domain, and total self-efficacy values agreed with the stored analytical variables. The positive-count samples comprised 268 ED users and 142 participants with admissions or hospital nights. Twelve records (2.6%) were discordant between admission and night reports; retaining them in the primary analysis preserved the original data, while exclusion analyses tested whether they drove the hospital findings.
3.2. Participant Characteristics
The mean age was 69.93 years (SD 4.72; range 65-84), and 252 participants (54.3%) were women. Primary education was the highest completed level for 52.4%, and 89.7% reported two chronic diseases. Urban and rural residents each represented approximately 45% of the sample, while 10.8% were classified as peri-urban. Mean health literacy was 10.69 (SD 4.79): 31.7% had inadequate, 25.4% problematic, and 42.9% adequate health literacy. Mean chronic-disease self-efficacy was 5.56 (SD 1.78) on the 1-10 scale.
Table 1.
Participant characteristics (N=464).
| Characteristic | Category or statistic | n (%) or mean ± SD | Range |
|---|---|---|---|
| Age, years | Mean ± SD | 69.93 ± 4.72 | 65–84 |
| Body mass index, kg/m² | Mean ± SD | 26.48 ± 4.58 | 17.58–57.21 |
| Health-literacy score | Mean ± SD | 10.69 ± 4.79 | 0–16 |
| Health-literacy category | Inadequate (0–8) | 147 (31.7) | — |
| Problematic (9–12) | 118 (25.4) | — | |
| Adequate (13–16) | 199 (42.9) | — | |
| Chronic-disease self-efficacy | Mean ± SD | 5.56 ± 1.78 | 1–10 |
| Gender | Male | 212 (45.7) | — |
| Female | 252 (54.3) | — | |
| Education | Primary | 243 (52.4) | — |
| Secondary | 169 (36.4) | — | |
| Tertiary | 52 (11.2) | — | |
| Self-rated health | Excellent/very good | 83 (17.9) | — |
| Good | 320 (69.0) | — | |
| Fair/poor | 61 (13.1) | — | |
| Number of chronic diseases | Two | 416 (89.7) | — |
| Three | 48 (10.3) | — | |
| Health centre | Centre 1 | 234 (50.4) | — |
| Centre 2 | 94 (20.3) | — | |
| Centre 3 | 64 (13.8) | — | |
| Centre 4 | 33 (7.1) | — | |
| Centre 5 | 39 (8.4) | — | |
| Residence | Urban | 208 (44.8) | — |
| Peri-urban | 50 (10.8) | — | |
| Rural | 206 (44.4) | — |
Note. Percentages may not total 100 because of rounding. Health-literacy categories were used descriptively; continuous scores were used in regression models.
3.3. RQ1: Distribution of Healthcare Utilisation
GP contact was common: 402 participants (86.6%) reported at least one visit and the mean was 2.86 visits over six months. ED use was reported by 268 participants (57.8%). Hospital use was less frequent: 142 participants (30.6%) reported at least one admission and the same number reported at least one hospital night. All outcomes were right-skewed, with maxima of 20 GP visits, 30 ED visits, 10 admissions, and 35 hospital nights. The variances derived from the reported standard deviations were approximately 8.29 for GP visits, 4.54 for ED visits, 1.37 for admissions, and 16.73 for hospital nights, each exceeding its corresponding mean. Together with the zero proportions and the formal dispersion tests, this pattern supported negative-binomial full-count models and separate occurrence/intensity models for ED and hospital outcomes.
Table 2.
Six-month healthcare utilisation (N=464).
| Outcome | Mean ± SD | Median (IQR) | Range | Any use, n (%) | Zero use, n (%) |
|---|---|---|---|---|---|
| General-practitioner visits | 2.86 ± 2.88 | 2.0 (1.0–3.5) | 0–20 | 402 (86.6) | 62 (13.4) |
| Emergency-department visits | 1.32 ± 2.13 | 1.0 (0–2) | 0–30 | 268 (57.8) | 196 (42.2) |
| Hospital admissions | 0.55 ± 1.17 | 0 (0–1) | 0–10 | 142 (30.6) | 322 (69.4) |
| Hospital nights | 1.63 ± 4.09 | 0 (0–2) | 0–35 | 142 (30.6) | 322 (69.4) |
Note. IQR = interquartile range. Any use denotes a count greater than zero.
3.4. RQ2: Associations with GP-Visit Frequency
In the fully adjusted negative-binomial model, health literacy was not associated with GP-visit frequency (IRR 1.002, 95% CI 0.982-1.023; p=0.820). The confidence interval was compatible with effects ranging from about 1.8% fewer to 2.3% more visits per health-literacy point, providing no evidence of a monotonic association of practical size across the scale. Each one-point increase in self-efficacy was associated with a 9.1% lower expected GP-visit rate (IRR 0.909, 95% CI 0.857-0.964; p=0.002). Under the fitted log-linear model, an illustrative two-point difference in self-efficacy corresponds to an expected rate ratio of approximately 0.83, or 17.4% fewer visits, with all other variables held constant. This remains an adjusted association rather than evidence that increasing confidence would cause consultation rates to fall. Among secondary covariates, secondary and tertiary education, higher BMI, and peri-urban residence were associated with lower GP rates, while fair/poor self-rated health and attendance at Centre 5 were associated with higher rates. The centre indicators were jointly associated with GP visits (p<0.0001), indicating that between-centre differences remained after adjustment for measured patient characteristics. Residence did not reach joint significance (p=0.068). These covariate estimates were not multiplicity-adjusted and should be read as contextual information rather than separate confirmatory findings.
3.5. RQ3: Associations with the Occurrence of Emergency and Hospital Use
Health literacy and self-efficacy showed opposite associations with whether acute or hospital use occurred. Each one-point increase in health literacy was associated with higher odds of any ED use (OR 1.112, 95% CI 1.055-1.172; p<0.001), any hospital admission (OR 1.097, 95% CI 1.034-1.164; p=0.002), and any hospital night (OR 1.092, 95% CI 1.031-1.157; p=0.003). These correspond to 11.2%, 9.7%, and 9.2% higher odds per point. Assuming the fitted linear log-odds relation, an illustrative four-point health-literacy difference corresponds to ORs of approximately 1.53, 1.45, and 1.42, respectively. These are odds ratios rather than absolute probability differences; the change in predicted probability depends on baseline risk and the other covariates. Higher self-efficacy was associated with lower odds of each outcome. The OR was 0.731 for any ED use (95% CI 0.632-0.846), 0.636 for any admission (95% CI 0.538-0.752), and 0.647 for any hospital night (95% CI 0.548-0.764); all p<0.001. These estimates correspond to 26.9%, 36.4%, and 35.3% lower odds per point. For an illustrative two-point difference, the fitted ORs are approximately 0.53, 0.40, and 0.42. The consistency of direction across three related outcomes supports a coherent occurrence pattern, but the estimates may still reflect reverse causation or unmeasured illness severity. Tertiary education was associated with lower odds of any ED use. Women had lower odds of any admission and any hospital nights. Centre 2 was associated with higher odds of ED use, and Centre 5 with higher odds of admission and hospital nights. Centre indicators were jointly significant for any ED use (p=0.004), admission (p=0.014), and hospital nights (p=0.040). Because the centre coefficients may reflect access, referral practice, capacity, or case mix, they should not be interpreted as rankings of centre quality.
3.6. RQ4: Associations with utilisation Intensity Among Users
Among the 268 ED users, neither health literacy (IRR 1.007, 95% CI 0.960-1.056; p=0.785) nor self-efficacy (IRR 0.922, 95% CI 0.814-1.046; p=0.207) was associated with visit frequency. The health-literacy interval excluded large rate changes per point, while the self-efficacy interval remained compatible with a modest inverse or near-null association. The contrast with the binary component indicates that the principal exposure pattern concerned whether ED use occurred, not the number of visits after entry. Among the 142 admitted participants, health literacy was associated with admission frequency (IRR 1.085, 95% CI 1.014-1.160; p=0.018), equivalent to an 8.5% higher rate per point. Self-efficacy was not associated with admission frequency (IRR 0.997, 95% CI 0.823-1.206; p=0.972). Older age was associated with a slightly lower rate, while women had a higher rate among admitted participants. This component is conditional on having been admitted and therefore concerns a selected subgroup. It cannot be interpreted as the population-wide effect of health literacy on admissions, and the smaller sample and multiple covariates increase uncertainty. Among the 142 participants with positive hospital-night counts, neither health literacy (IRR 0.991, 95% CI 0.951-1.033; p=0.665) nor self-efficacy (IRR 0.913, 95% CI 0.818-1.018; p=0.102) was associated with length of stay. The self-efficacy estimate was directionally inverse but its interval included the null, so the data did not distinguish a modest association from no association. Secondary education and peri-urban residence were associated with fewer nights, while fair/poor self-rated health was associated with more nights; these secondary estimates require cautious interpretation.
Table 3.
Adjusted associations of health literacy and chronic-disease self-efficacy with healthcare utilisation.
Table 3.
Adjusted associations of health literacy and chronic-disease self-efficacy with healthcare utilisation.
| Outcome and component | Model | N | Health literacy OR/IRR (95% CI) | p value | Self-efficacy OR/IRR (95% CI) | p value |
|---|---|---|---|---|---|---|
| GP visits | Negative binomial | 464 | 1.002 (0.982–1.023) | 0.820 | 0.909 (0.857–0.964) | 0.002 |
| Any ED use | Logistic | 464 | 1.112 (1.055–1.172) | <0.001 | 0.731 (0.632–0.846) | <0.001 |
| ED visits among users | Zero-truncated negative binomial | 268 | 1.007 (0.960–1.056) | 0.785 | 0.922 (0.814–1.046) | 0.207 |
| Any hospital admission | Logistic | 464 | 1.097 (1.034–1.164) | 0.002 | 0.636 (0.538–0.752) | <0.001 |
| Admissions among admitted participants | Zero-truncated Poisson | 142 | 1.085 (1.014–1.160) | 0.018 | 0.997 (0.823–1.206) | 0.972 |
| Any hospital nights | Logistic | 464 | 1.092 (1.031–1.157) | 0.003 | 0.647 (0.548–0.764) | <0.001 |
| Hospital nights among users | Zero-truncated negative binomial | 142 | 0.991 (0.951–1.033) | 0.665 | 0.913 (0.818–1.018) | 0.102 |
Note. All models included health literacy, self-efficacy, age, gender, education, BMI, self-rated health, number of chronic diseases, health centre, and residence. Logistic models are reported as ORs; count models as IRRs. Robust standard errors were used. Reference categories were male, primary education, excellent/very good self-rated health, two chronic diseases, Centre 1, and urban residence.
3.7. RQ5: Robustness of the Main Associations
Full-sample negative-binomial sensitivity models supported the main directional pattern. Health literacy was associated with the total number of ED visits (IRR 1.049; p=0.002) and admissions (IRR 1.082; p=0.003), but not hospital nights (IRR 1.040; p=0.126). Self-efficacy remained inversely associated with all three full counts (all p<0.001). Because these models combine non-use and positive intensity, their agreement with the occurrence components indicates that the main signal was sufficiently strong to remain visible even when the two processes were collapsed. After excluding the 12 discordant hospital records, health literacy remained associated with admissions (IRR 1.080; p=0.004) and remained unassociated with hospital nights (IRR 1.041; p=0.127). Self-efficacy remained inversely associated with both outcomes. The close similarity of estimates before and after exclusion indicates that these records were not responsible for the substantive conclusions, although the underlying reason for the discordance still requires documentation.
Table 4.
Sensitivity analyses.
| Sensitivity analysis | Model | N | Health literacy IRR (95% CI) | p value | Self-efficacy IRR (95% CI) | p value |
|---|---|---|---|---|---|---|
| ED visits, full sample | Negative binomial | 464 | 1.049 (1.017–1.081) | 0.002 | 0.840 (0.774–0.913) | <0.001 |
| Hospital admissions, full sample | Negative binomial | 464 | 1.082 (1.028–1.139) | 0.003 | 0.744 (0.643–0.860) | <0.001 |
| Hospital nights, full sample | Negative binomial | 464 | 1.040 (0.989–1.094) | 0.126 | 0.666 (0.575–0.772) | <0.001 |
| Admissions, excluding discordance | Negative binomial | 452 | 1.080 (1.025–1.138) | 0.004 | 0.741 (0.640–0.859) | <0.001 |
| Hospital nights, excluding discordance | Negative binomial | 452 | 1.041 (0.989–1.096) | 0.127 | 0.659 (0.566–0.769) | <0.001 |
Note. Full-sample models include zero and positive counts in one negative-binomial model. Discordance analyses excluded 12 participants whose admission and hospital-night reports were inconsistent.
3.8. RQ6: Sequential Models and Statistical Suppression
The health-literacy coefficient became more positive when self-efficacy was introduced. For any ED use, the OR increased from 1.052 in the health-literacy-only model to 1.110 after adding self-efficacy and remained 1.112 after full adjustment. For admission, health literacy was not statistically associated when entered alone (OR 1.033; p=0.128), but increased to 1.112 after self-efficacy was added and remained 1.097 after full adjustment (p=0.002). Most of the coefficient change therefore occurred when self-efficacy entered the model, whereas the remaining covariates produced comparatively little additional change. Because health literacy and self-efficacy were positively correlated in the cohort but had utilisation coefficients in opposite directions, the inverse self-efficacy association partially offset the positive health-literacy coefficient in simpler models. The sequential pattern is consistent with statistical suppression or negative confounding [38]. It does not identify a mediator, prove a causal structure, or imply that self-efficacy should be statistically “controlled away” in every substantive analysis; rather, it demonstrates that the estimated health-literacy association depends on whether confidence to manage illness is represented.
3.9. RQ7: Exploratory Interaction Between Health Literacy and Self-Efficacy
For GP visits, the health-literacy by self-efficacy interaction was IRR 0.988 (95% CI 0.979-0.998; p=0.018 in Stata) [37,38]. The coefficient below 1 indicates that the health-literacy slope became less positive as self-efficacy increased. Model-based predictions rose across health-literacy scores at low self-efficacy, were nearly flat at mean self-efficacy, and declined at high self-efficacy. However, none of the three conditional slopes was individually distinguishable from zero, so the crossing lines in Figure 1 should not be interpreted as three confirmed subgroup effects. The interaction did not meet the Bonferroni reference threshold of p<0.0125 in the primary Stata analysis, although the identical point estimate produced p=0.011 with the R robust-covariance implementation. No interaction evidence was observed for any ED use, admission, or hospital nights. Taken together, multiplicity adjustment, software sensitivity, and non-significant conditional slopes prevent a confirmatory interpretation. Figure 1 is retained because it communicates the direction of the hypothesis for future testing, not because it establishes effect modification.
Figure 2.
Exploratory adjusted predictions of general-practitioner visits across health-literacy scores at low, mean, and high chronic-disease self-efficacy. (a) Note. Predictions are from the fully adjusted GP negative-binomial interaction model. Low and high self-efficacy represent one standard deviation below and above the mean. The interaction was exploratory and estimator-sensitive: p=0.018 in the primary Stata analysis and p=0.011 in the R robust-covariance replication. It did not meet the Bonferroni reference threshold of p<0.0125 in the primary analysis, and none of the conditional health-literacy slopes was individually significant.
3.10. Cross-Software Reproducibility
Stata and R produced effectively identical primary point estimates and the same model-specific sample sizes. The main exposure conclusions were unchanged despite small differences in robust confidence intervals and p values. This agreement strengthens confidence that the findings were not caused by a single software implementation or coding pathway. The only practically relevant discrepancy concerned whether the exploratory GP interaction crossed the multiplicity-adjusted threshold, reinforcing the decision to treat that result as provisional.
3.11. Integrated Answers to the Research Questions
Across the seven research questions, the evidence supported a coherent distinction between service entry and subsequent intensity. Table 5 summarises the direct answer to each question and the principal qualification that should accompany interpretation.
4. Discussion
4.1. Main Findings
Health literacy and chronic-disease self-efficacy were positively related in the parent study [1], yet they showed different associations with healthcare use when entered in the same models. Self-efficacy was consistently associated with a lower likelihood of ED and hospital use and with fewer GP visits. Health literacy was unrelated to GP frequency but was positively associated with whether ED or hospital care occurred. Among people who had already entered care, neither construct was associated with ED frequency or hospital-night duration; health literacy alone was associated with the number of admissions among admitted participants. The distinction between service entry and subsequent intensity is the central finding. The results do not support a general claim that health literacy increases utilisation or that self-efficacy reduces every form of care. Instead, the strongest associations were concentrated at the threshold between no acute or hospital use and at least one episode.
4.2. Self-Efficacy and the Threshold Into Urgent Care
The inverse self-efficacy pattern is consistent with the idea that confidence matters before a crisis reaches the healthcare system. People who feel able to monitor symptoms, use an action plan, communicate with clinicians, and solve practical problems may seek routine advice earlier or manage some fluctuations without escalation. Patient-activation evidence points in the same direction, with higher activation associated with lower risks of hospital and ED use [19]. This interpretation should not be reduced to personal responsibility. Confidence is shaped by symptoms, function, social support, previous success, and the feasibility of the care plan. Treatment burden may exceed a patient's available capacity even when motivation is high [21]. In that situation, a low self-efficacy score may identify people whose management plan is difficult to carry out, not people who are unwilling to engage. Reverse causation remains a serious alternative. An admission, a difficult recovery, or repeated episodes of instability can reduce confidence. The meta-analysis showing lower self-efficacy among older adults receiving acute and inpatient care is relevant here [20]. Because utilisation preceded the study assessment, the current data cannot establish whether lower confidence came before greater use or followed it.
4.3. Why was Higher Health Literacy Associated with Acute and Hospital Use?
At first sight, the positive health-literacy associations appear to conflict with literature linking limited literacy to adverse outcomes and emergency care [10,11,12,13]. The apparent contradiction is smaller once the outcome is considered. The models measured whether care occurred, not whether the visit was preventable, delayed, clinically appropriate, or beneficial. Several mechanisms could produce a positive association. People with stronger health literacy may recognise warning signs earlier, describe a change more precisely, and navigate referral pathways more effectively. They may be more willing to question an initial plan or return when symptoms persist. In a system where access to specialist or diagnostic services often depends on successful navigation, these skills can increase appropriate contact rather than unnecessary use [44]. Healthcare contact may also contribute to health literacy. Repeated consultations expose patients to explanations, written material, terminology, and opportunities to learn the system. Greater illness complexity could therefore increase both service use and familiarity with health information. Residual confounding by severity, frailty, function, treatment burden, or access is also possible because these dimensions were not measured in detail [45]. The sequential models clarify why the association became stronger after self-efficacy was entered. Health literacy and self-efficacy were positively correlated, while their outcome coefficients pointed in opposite directions. In simpler models, the inverse self-efficacy pathway partially masked the positive health-literacy coefficient. This is compatible with statistical suppression or negative confounding [39], not with mediation.
4.4. Healthcare Utilisation is a Layered System Outcome
Healthcare use is often discussed as though less were always better. That assumption is unsafe in older adults with multimorbidity. A lower ED rate may reflect effective self-management and timely primary care, but it can also reflect transport barriers, cost, low trust, or delayed help-seeking. More GP contact may signal poor control, yet it may also represent continuity, planned monitoring, and substitution away from hospital care [46].
The intervention literature reinforces this point. Multimorbidity programmes have not produced a uniform reduction across services. Some reduce hospitalisation while increasing planned outpatient or GP contact [23]. This can be a desirable shift if patients receive earlier assessment and coordinated follow-up. Conversely, an unchanged utilisation count does not mean that an intervention failed if function, confidence, quality of life, or care experience improved [28]. The study's four outcomes therefore occupy different positions in the care pathway. GP visits reflect routine access and ongoing management. ED use reflects urgent assessment but may be shaped by primary-care availability. Admission depends on patient presentation, referral and clinician judgement. Hospital nights are influenced by severity, complications, discharge support, and institutional practice. The same exposure need not operate in the same way at each stage. [47].
4.5. Occurrence and Intensity After Entry Into Care
The two-part analysis showed that the exposure pattern was strongest for occurrence. Once a person reached the ED, the number of visits was not associated with either health literacy or self-efficacy. Once admitted, length of stay was also unrelated to the two patient-level capabilities. These null results are clinically plausible: after entry, severity, diagnostic findings, treatment response, bed availability, and discharge arrangements may outweigh the patient's information skills or confidence [48].
The positive health-literacy association with admission frequency among the 142 admitted participants requires restraint. It was estimated in a selected subgroup, with fewer observations and a substantial adjustment set. It may indicate repeated appropriate access among patients able to navigate care, or residual differences in illness complexity. It should not be interpreted as a population-wide causal effect. This separation also explains why the full-count sensitivity models and the hurdle-type models can both be informative. [49].The full counts confirmed the broad directional pattern, while the two-part models located that pattern mainly in service entry. Collapsing the components would have hidden that distinction.
4.6. Primary-Care Organisation and Centre Variation
Health-centre indicators remained associated with GP visits and the occurrence of ED and hospital use after adjustment, suggesting that utilisation was influenced not only by patient characteristics but also by local service organisation. Differences may reflect staffing, diagnostic capacity, appointment availability, continuity, referral practices, or hospital linkages [50]. Centre effects should not be interpreted as quality rankings, as they capture average differences without identifying mechanisms. With only five centres, the findings nonetheless align with Albanian evidence of variation in access and service organisation [30,31] and highlight that health literacy and self-efficacy operate within the healthcare system.
4.7. Implications for Clinical Practice and Service Design
Primary care should assess health literacy and self-efficacy separately, as patients may understand instructions but lack confidence to act, or feel confident while misunderstanding when to seek care. Brief questions on symptom management, medication use, exercise, communication, and access to support may identify needs missed by total scores. Support should combine health-literacy-responsive communication and teach-back with rehearsal, graded goals, problem-solving, caregiver involvement, and timely advice [51,52]. Tailored, multicomponent and nurse-led or multidisciplinary approaches may further strengthen self-management and continuity [24,29]. The goal should not be to reduce healthcare use overall, but to prevent avoidable crisis care while maintaining timely access and strengthening planned primary and community care [26,27].
4.8. Methodological Contribution and Strengths
A major strength is the separation of occurrence from intensity. The count distributions were highly skewed and overdispersed, and ED and hospital outcomes contained many zeros. Matching each clinical question to an appropriate model avoided forcing service entry and subsequent frequency into one coefficient [33,34,35]. Other strengths include complete data for the primary models, simultaneous estimation of the two main exposures, a common prespecified adjustment set, robust standard errors, sensitivity analyses, and independent reconstruction in Stata and R. The admission and hospital-night findings were also stable after the discordant records were excluded.
4.9. Limitations
The main limitation is the cross-sectional design, which prevents establishing temporal direction or causality. Six-month utilisation was self-reported and may be subject to recall or telescoping bias, while record-based data may miss care received outside the participating system. Residual confounding from severity, frailty, function, cognition, polypharmacy, treatment burden, socioeconomic factors, and access cannot be excluded. Disease count did not capture combinations or severity, and hospital positive-count models included only 142 participants, limiting precision. Centre fixed effects did not account for within-centre correlation. Both exposures were self-reported; HLS-EU-Q16 measures perceived rather than performance-based literacy, and further documentation of Albanian translation and cultural adaptation is needed. Reliability does not establish validity or measurement invariance. Secondary covariate and interaction analyses were exploratory.
4.10. Future Research
Future research should use prospective, record-linked designs across care settings, distinguishing planned from unplanned and potentially avoidable use. Larger multicentre studies should account for patient and organisational factors, while qualitative research should explore healthcare decision-making. Interventions should integrate health-literacy-responsive communication, self-efficacy support, and care coordination, with outcomes including function, quality of life, safety, and patient experience alongside healthcare utilisation [28].
5. Conclusions
Health literacy and chronic-disease self-efficacy were associated with healthcare use in different ways. Higher self-efficacy was linked to fewer GP visits and a lower likelihood of ED and hospital use. Higher health literacy was unrelated to GP-visit frequency but was associated with crossing the threshold into acute and hospital care. The two-part analysis showed that these associations were concentrated mainly on whether care occurred. Among users, neither construct explained ED frequency or hospital-night duration. This suggests that patient capabilities may matter most before service entry, while clinical and organisational factors may become more influential after entry. The findings do not support judging higher or lower utilisation in isolation. Greater health literacy may facilitate timely recognition and navigation, while low self-efficacy may reflect both limited capacity to manage illness and the consequences of recent illness. Care should therefore combine understandable communication with practical support, action planning, continuity, and access to advice. Prospective, record-linked, multicentre studies are needed before these associations are used to redesign services. Future research should assess appropriateness, preventability, function, frailty, and patient-valued outcomes and test whether integrated support can reduce avoidable crisis care without restricting necessary access.
Author Contributions
Conceptualization, V.P. and F.K.; Methodology, V.P. and F.K.; Investigation, V.P., A.S., A.M., L.S., and F.K.; Data Curation, V.P.; Writing-Original Draft Preparation, V.P.; Writing-Review and Editing, A.S., A.M., L.S., and F.K.; Validation, A.M., A.S., L.S., and F.K.; Formal Analysis, L.S. and F.K.; Supervision, F.K. All authors have read and agreed to the published version of the manuscript.
Funding
This research received no external funding.
Institutional Review Board Statement
The study was conducted in accordance with the Declaration of Helsinki and was reviewed and approved by the Institutional Review Board of the Operator of Health Care Services, the Regional Directorate of Vlora, and the Directorate of Public Health and Health Education. Ethical approval was granted on 3 June 2024 (No. 1084/1).
Informed Consent Statement
Informed consent was obtained from all subjects involved in the study.
Data Availability Statement
The de-identified data are available from the corresponding author on reasonable request, sub-ject to ethical, legal, and privacy restrictions.
Acknowledgments
During manuscript preparation, the authors used ChatGPT (OpenAI; accessed September 2026) for language editing, grammar correction, and manuscript restructuring. The authors have reviewed and edited the output and take full responsibility for the content of this publication.”.
Conflicts of Interest
The authors declare no conflicts of interest.
Abbreviations
The following abbreviations are used in this manuscript:
| BMI | Body mass index |
| CDSE | Chronic-disease self-efficacy |
| CI | Confidence interval |
| ED | Emergency department |
| GP | General practitioner |
| HL | Health literacy |
| HLS-EU-Q16 | European Health Literacy Survey Questionnaire, 16-item short form |
| IRR | Incidence-rate ratio |
| OR | Odds ratio |
| PHC | Primary healthcare |
| SD | Standard deviation |
| STROBE | Strengthening the Reporting of Observational Studies in Epidemiology |
References
- Pulomemoj, V.; Subashi, A.; Proko, R.; Serjanaj, L.; Kamberi, F. Health Literacy and Chronic Disease Self-Efficacy Among Older Adults with Multimorbidity: Evidence from Low-Resource Context. Healthcare 2026, 14, 2294. [CrossRef]
- Fabbri, E.; Zoli, M.; Gonzalez-Freire, M.; Salive, M.E.; Studenski, S.A.; Ferrucci, L. Aging and Multimorbidity: New Tasks, Priorities, and Frontiers for Integrated Gerontological and Clinical Research. J. Am. Med. Dir. Assoc. 2015, 16, 640–647. [CrossRef]
- Marengoni, A.; Angleman, S.; Melis, R.; et al. Aging with Multimorbidity: A Systematic Review of the Literature. Ageing Res. Rev. 2011, 10, 430–439. [CrossRef]
- Rodrigues, L.P.; Rezende, A.T.O.; Delpino, F.M.; et al. Association between Multimorbidity and Hospitalization in Older Adults: Systematic Review and Meta-Analysis. Age Ageing 2022, 51, afac155. [CrossRef]
- Wu, J.; Zhang, H.; Shao, J.; et al. Healthcare for Older Adults with Multimorbidity: A Scoping Review of Reviews. Clin. Interv. Aging 2023, 18, 1723–1735. [CrossRef]
- Palmer, K.; Marengoni, A.; Forjaz, M.J.; et al. Multimorbidity Care Model: Recommendations from the Consensus Meeting of the Joint Action on Chronic Diseases and Promoting Healthy Ageing across the Life Cycle (JA-CHRODIS). Health Policy 2018, 122, 4–11. [CrossRef]
- Sørensen, K.; Van den Broucke, S.; Fullam, J.; et al. Health Literacy and Public Health: A Systematic Review and Integration of Definitions and Models. BMC Public Health 2012, 12, 80. [CrossRef]
- Sørensen, K.; Van den Broucke, S.; Pelikan, J.M.; et al. Measuring Health Literacy in Populations: Illuminating the Design and Development Process of the European Health Literacy Survey Questionnaire (HLS-EU-Q). BMC Public Health 2013, 13, 948. [CrossRef]
- Lorini, C.; Lastrucci, V.; Mantwill, S.; Vettori, V.; Bonaccorsi, G.; Florence Health Literacy Research Group. Measuring Health Literacy in Italy: A Validation Study of the HLS-EU-Q16 and HLS-EU-Q6. Ann. Ist. Super. Sanità 2019, 55, 10–18. [CrossRef]
- Berkman, N.D.; Sheridan, S.L.; Donahue, K.E.; Halpern, D.J.; Crotty, K. Low Health Literacy and Health Outcomes: An Updated Systematic Review. Ann. Intern. Med. 2011, 155, 97–107. [CrossRef]
- Herndon, J.B.; Chaney, M.; Carden, D. Health Literacy and Emergency Department Outcomes: A Systematic Review. Ann. Emerg. Med. 2011, 57, 334–345. [CrossRef]
- Neter, E.; Brainin, E. Association between Health Literacy, eHealth Literacy, and Health Outcomes among Patients with Long-Term Conditions: A Systematic Review. Eur. Psychol. 2019, 24, 68–81. [CrossRef]
- Baker, D.W.; Parker, R.M.; Williams, M.V.; Clark, W.S. Health Literacy and the Risk of Hospital Admission. J. Gen. Intern. Med. 1998, 13, 791–798. [CrossRef]
- Balakrishnan, M.P.; Herndon, J.B.; Zhang, J.; Payton, T.; Shuster, J.; Carden, D.L. The Association of Health Literacy with Preventable Emergency Department Visits: A Cross-Sectional Study. Acad. Emerg. Med. 2017, 24, 1042–1050. [CrossRef]
- Sudore, R.L.; Schillinger, D. Interventions to Improve Care for Patients with Limited Health Literacy. J. Clin. Outcomes Manag. 2009, 16, 20–29.
- Lorig, K.; Stewart, A.; Ritter, P.; Gonzalez, V.; Laurent, D.; Lynch, J. Outcome Measures for Health Education and Other Health Care Interventions; Sage: Thousand Oaks, CA, USA, 1996.
- Ritter, P.L.; Lorig, K. The English and Spanish Self-Efficacy to Manage Chronic Disease Scale Measures Were Validated Using Multiple Studies. J. Clin. Epidemiol. 2014, 67, 1265–1273. [CrossRef]
- Gao, Y.; Zheng, Y.; He, Y.; Lin, J.; Liu, F.; Fu, J.; Lin, R. The Relationship between Self-Efficacy, Health Literacy, and Quality of Life in Patients with Chronic Diseases: A Cross-Sectional Study in China. Front. Public Health 2024, 12, 1430202. [CrossRef]
- Anderson, G.; Rega, M.L.; Casasanta, D.; Graffigna, G.; Damiani, G.; Barello, S. The Association between Patient Activation and Healthcare Resources Utilization: A Systematic Review and Meta-Analysis. Public Health 2022, 210, 134–141. [CrossRef]
- Whitehall, L.; Rush, R.; Gorska, S.; Forsyth, K. The General Self-Efficacy of Older Adults Receiving Care: A Systematic Review and Meta-Analysis. Gerontologist 2021, 61, e302–e317. [CrossRef]
- Morris, J.E.; Roderick, P.J.; Harris, S.; et al. Treatment Burden for Patients with Multimorbidity: Cross-Sectional Study with Exploration of a Single-Item Measure. Br. J. Gen. Pract. 2021, 71, e381–e390. [CrossRef]
- Morgan, S.R.; Chang, A.M.; Alqatari, M.; Pines, J.M. Non-emergency department interventions to reduce ED utilization: A systematic review. Acad. Emerg. Med. 2013, 20, 969–985. [CrossRef]
- Lim, Y.W.; Al-Busaidi, I.S.; Caya, R.; et al. Effectiveness of Interventions for the Management of Multimorbidity in Primary Care and Community Settings: Systematic Review and Meta-Analysis. Fam. Pract. 2025, 42, cmaf085. [CrossRef]
- Lawless, M.T.; Oster, C.; Block, H.; et al. Self-Management Support Interventions for Socioeconomically Disadvantaged Older Adults with Chronic Conditions: A Systematic Review. Patient Educ. Couns. 2025, 141, 109305. [CrossRef]
- Tian, J.; Wang, H.Y.; Peng, S.H.; Tao, Y.M.; Cao, J.; Zhang, X.G. Experiences of Older People with Multimorbidity Regarding Self-Management of Diseases: A Systematic Review and Qualitative Meta-Synthesis. Int. J. Nurs. Pract. 2024, 30, e13289. [CrossRef]
- Memedovich, A.; Asante, B.; Khan, M.; et al. Strategies for Improving ED-Related Outcomes of Older Adults Who Seek Care in Emergency Departments: A Systematic Review. Int. J. Emerg. Med. 2024, 17, 16. [CrossRef]
- Testa, L.; Richardson, L.; Cheek, C.; et al. Strategies to Improve Care for Older Adults Who Present to the Emergency Department: A Systematic Review. BMC Health Serv. Res. 2024, 24, 178. [CrossRef]
- Fedecostante, M.; Balietti, P.; Beccacece, A.; et al. Outcome Measures for Health Interventions Targeting Multimorbid Older Adults: A Systematic Review. Ageing Res. Rev. 2026, 113, 102940. [CrossRef]
- Ruksakulpiwat, S.; Pongsuwun, K.; Junphongsri, P.; Preeprem, C.; Nguantad, S.; Samart, B. Nurse-Led Interventions to Improve Health, Adherence, and Functional Outcomes in Adults and Older Adults with Multimorbidity: A Systematic Review of Randomized and Quasi-Experimental Studies. J. Nurs. Manag. 2025, 2025, 6252049. [CrossRef]
- Gabrani, J.; Schindler, C.; Wyss, K. Factors Associated with the Utilisation of Primary Care Services: A Cross-Sectional Study in Public and Private Facilities in Albania. BMJ Open 2020, 10, e040398. [CrossRef]
- Mechili, E.A.; Saliaj, A.; Xhindoli, J.; et al. Primary Healthcare Personnel Challenges and Barriers on the Management of Patients with Multimorbidity in Albania. Health Soc. Care Community 2022, 30, 380–388. [CrossRef]
- Kwaitana, D.; Chisoni, F.; van Breevoort, D.; et al. Primary Healthcare Service Delivery for Older People with Progressive Multimorbidity in Low- and Middle-Income Countries: A Systematic Review. Trans. R. Soc. Trop. Med. Hyg. 2024, 118, 137–147. [CrossRef]
- Mullahy, J. Specification and Testing of Some Modified Count Data Models. J. Econom. 1986, 33, 341–365. [CrossRef]
- Zeileis, A.; Kleiber, C.; Jackman, S. Regression Models for Count Data in R. J. Stat. Softw. 2008, 27, 1–25. [CrossRef]
- Cronbach, L.J. Coefficient Alpha and the Internal Structure of Tests. Psychometrika 1951, 16, 297–334. [CrossRef]
- Cameron, A.C.; Trivedi, P.K. Regression Analysis of Count Data, 2nd ed.; Cambridge University Press: Cambridge, UK, 2013. [CrossRef]
- White, H. A Heteroskedasticity-Consistent Covariance Matrix Estimator and a Direct Test for Heteroskedasticity. Econometrica 1980, 48, 817–838. [CrossRef]
- Zeileis, A. Econometric Computing with HC and HAC Covariance Matrix Estimators. J. Stat. Softw. 2004, 11, 1–17. [CrossRef]
- MacKinnon, D.P.; Krull, J.L.; Lockwood, C.M. Equivalence of the Mediation, Confounding and Suppression Effect. Prev. Sci. 2000, 1, 173–181. [CrossRef]
- Aiken, L.S.; West, S.G. Multiple Regression: Testing and Interpreting Interactions; Sage: Newbury Park, CA, USA, 1991.
- StataCorp. Stata Statistical Software: Release 13; StataCorp LP: College Station, TX, USA, 2013.
- R Core Team. R: A Language and Environment for Statistical Computing. Vienna: R Foundation for Statistical Computing; 2024.
- von Elm, E.; Altman, D.G.; Egger, M.; Pocock, S.J.; Gøtzsche, P.C.; Vandenbroucke, J.P.; STROBE Initiative. The Strengthening the Reporting of Observational Studies in Epidemiology (STROBE) Statement. PLoS Med. 2007, 4, e296. [CrossRef]
- Kern, L.M.; Reshetnyak, E.; Colantonio, L.D.; Muntner, P.M.; Rhodes, J.D.; Casalino, L.P.; Rajan, M.; Pesko, M.; Pinheiro, L.C.; Safford, M.M. Association Between Patients' Self-Reported Gaps in Care Coordination and Preventable Adverse Outcomes: A Cross-Sectional Survey. J. Gen. Intern. Med. 2020, 35, 3517–3524. [CrossRef]
- EIshikawa, H.; Yano, E. Patient Health Literacy and Participation in the Health-Care Process. Health Expect. 2008, 11, 113–122. [CrossRef]
- Lee, P.S.S.; Chew, E.A.L.; Koh, H.L.; Quak, S.X.E.; Ding, Y.Y.; Subramaniam, M.; Vaingankar, J.A.; Lee, E.S. How Do Older Adults with Multimorbidity Navigate Healthcare? A Qualitative Study in Singapore. BMC Prim. Care 2023, 24, 239. [CrossRef]
- Emiral, G.O.; Gok, P.G.; Unsal, A.; Arslantas, D.; Ozakin, E.; Acar, N. Evaluation of Health Literacy Levels in Patients in the Emergency Department of a University Hospital: A Cross-Sectional Study. Healthcare 2026, 14, 1665. [CrossRef]
- Marshall N, Butler M, Lambert V, Timon CM, Joyce D, Warters A. Health literacy interventions and health literacy-related outcomes for older adults: a systematic review. BMC Health Serv Res. 2025;25:319. [CrossRef]
- Morgan, S.R.; Chang, A.M.; Alqatari, M.; Pines, J.M. Non-Emergency Department Interventions to Reduce ED Utilization: A Systematic Review. Acad. Emerg. Med. 2013, 20, 969–985. [CrossRef]
- Doshmangir, L.; Khabiri, R.; Jabbari, H.; Arab-Zozani, M.; Kakemam, E.; Gordeev, V.S. Strategies for Utilisation Management of Hospital Services: A Systematic Review of Interventions. Global. Health 2022, 18, 53. [CrossRef]
- Cabezas, M.F.; Nazar, G.; Ranchor, A.V.; Annema, C. The Effect of Health Literacy Interventions on Self-Management in Chronic Diseases: A Systematic Review. Ann. Behav. Med. 2025, 59, kaaf073. [CrossRef]
- Huang, Y.; Li, S.; Lu, X.; Chen, W.; Zhang, Y. The Effect of Self-Management on Patients with Chronic Diseases: A Systematic Review and Meta-Analysis. Healthcare 2024, 12, 2151. [CrossRef]
Table 5.
Integrated answers to the seven research questions.
| Research question | Main result | Direct answer | Interpretive qualification |
|---|---|---|---|
| RQ1 | Counts were right-skewed and over dispersed; ED and hospital outcomes had many zeros. | Different outcome components required different models. | Distributional checks guide model choice but do not establish substantive associations. |
| RQ2 | HL: IRR 1.002, p=0.820; CDSE: IRR 0.909, p=0.002. | Self-efficacy, but not health literacy, was associated with GP frequency. | Fewer visits are not necessarily better and causality cannot be inferred. |
| RQ3 | HL ORs 1.092-1.112; CDSE ORs 0.636-0.731 for acute/hospital occurrence. | The two exposures had opposite adjusted associations with service entry. | ORs are not absolute probabilities; residual need and reverse causation remain plausible. |
| RQ4 | No exposure association with ED frequency or hospital nights; HL associated with admissions among admitted users. | Most exposure associations did not extend to intensity after entry. | Positive-count results apply only to users; admission analysis had N=142. |
| RQ5 | Full-count and discordance-exclusion analyses preserved the main directions. | Principal conclusions were not dependent on one specification or 12 discordant records. | Sensitivity agreement strengthens robustness but does not remove confounding. |
| RQ6 | HL coefficients increased after CDSE was added. | Self-efficacy statistically suppressed part of the HL association. | This is coefficient decomposition, not mediation. |
| RQ7 | GP interaction p=0.018 in Stata and p=0.011 in R; conditional slopes non-significant. | No confirmatory evidence of effect modification. | Figure 1 is hypothesis-generating and requires external confirmation. |
Note. HL = health literacy; CDSE = chronic-disease self-efficacy; OR = odds ratio; IRR = incidence-rate ratio. All model results are adjusted associations.
Disclaimer/Publisher’s Note: The statements, opinions and data contained in all publications are solely those of the individual author(s) and contributor(s) and not of MDPI and/or the editor(s). MDPI and/or the editor(s) disclaim responsibility for any injury to people or property resulting from any ideas, methods, instructions or products referred to in the content. |
© 2026 by the authors. Licensee MDPI, Basel, Switzerland. This article is an open access article distributed under the terms and conditions of the Creative Commons Attribution (CC BY) license (http://creativecommons.org/licenses/by/4.0/).
Copyright: This open access article is published under a Creative Commons CC BY 4.0 license, which permit the free download, distribution, and reuse, provided that the author and preprint are cited in any reuse.