

Submitted:
03 October 2026
Posted:
07 October 2026
You are already at the latest version
Abstract
When a proof system finds several correct proofs, which one should it keep? A short proof may be fragile, while a robust proof may be slower or depend on more of the library. Pareto selection is meant for such tradeoffs, but it can only help when the available proofs actually disagree on the objectives. We study this question in Lean using 649 natural maintenance units with 1,649 valid candidates. Only 160 units (24.7%) have more than one nondominated candidate, and 75 (11.6%) show high objective conflict. Among 312 units with later-version results, ParetoProof improves survival over equal-weight scalarization by 3.5 percentage points (78.5% versus 75.0%, p=0.0207), but its 1.3-point advantage over adaptive scalarization is not statistically detectable (p=0.424). A post-hoc analysis suggests that Pareto selection becomes more useful as objective conflict grows, although this pattern requires prospective confirmation. A separate LLM-assisted generation study over 16 theorem families explains why the average benefit is small: even after 32 generations, each theorem has 9.5 distinct verified proofs but only 3.31 nondominated choices on average. Our practical conclusion is simple. When the likely maintenance failure is known, optimize the matching proxy. When objectives mostly agree, adaptive scalarization captures nearly all observed benefit. Conflict-rich pools are the setting in which Pareto selection should be tested prospectively.
Keywords:
formal verification
; lean
; proof maintenance
; Pareto optimization
; multi-objective optimization
; automated theorem proving
1. Introduction
Generating a valid proof is only the first step. A repository must also live with that proof as libraries, tactics, and dependencies change. If several proofs are correct, the best one today may not be the best one to maintain.
This creates a natural multi-objective problem. We may prefer fewer tokens, faster checking, fewer dependencies, less fragile automation, and no warnings. Pareto selection keeps proofs that are not worse on all of these dimensions. The idea is appealing, but it has an easily overlooked requirement: there must be several valid proofs with genuinely different strengths. If one proof dominates the rest, or every objective ranks the proofs similarly, a Pareto method has little to do.
We ask when this requirement holds and whether it matters for later proof survival. Our main evaluation gives several selection policies exactly the same valid candidate pools, then checks the selected proofs on later versions. This separates the choice of proof from the model that generated it. A second study tests Pareto retention during LLM-assisted generation at matched call budgets.
The answer is conditional. Pareto selection improves on fixed equal weights, while a well-adapted scalar score remains statistically unresolved within a few percentage points. The clearest potential opportunity for Pareto selection appears in the relatively small set of candidate pools where objectives strongly disagree. When the expected failure mode is already known, directly optimizing the matching proxy works just as well.
Contributions.
- We evaluate proof selection independently of proof generation using 649 maintenance units and 1,649 valid candidates.
- We show that the opportunity for Pareto selection is uncommon: 24.7% of units have more than one nondominated candidate, and only 11.6% have high conflict.
- We turn the results into a practical decision heuristic among direct proxy optimization, adaptive scalarization, and prospective Pareto retention.
2. Related Work
Learning-based theorem provers combine language models with retrieval, native checking, search, and repair. LeanDojo exposes repository-scale Lean interaction [3]; Baldur studies whole-proof generation and repair [5]; and generative proof search and informal guidance have been studied across theorem-proving settings [7,9]. Benchmarks such as miniF2F and ProofNet evaluate formal mathematical reasoning [11,13], while ITPEval provides a controlled cross-prover evaluation surface [1]. These works mainly evaluate whether a proof is produced. We study which verified proof should be retained for later maintenance.
Pareto methods such as NSGA-II preserve nondominated populations instead of fixing one tradeoff [15]. Search-based software engineering similarly treats quality as multi-dimensional [17]. Our focus is diagnostic: whether the candidate pools and downstream outcomes in proof maintenance satisfy the conditions that make Pareto retention useful.
3. Methods
3.1. Verified Candidate Pools
For maintenance unit i, let be a fixed candidate set and let contain the candidates accepted by Lean. We only allow changes to the proof body. The theorem statement, imports, declarations, and surrounding source remain unchanged.
Each valid candidate receives five within-unit normalized utilities, oriented so that higher is better:
They measure token efficiency, elaboration efficiency, dependency minimality, fragility resistance, and warning cleanliness. We call an objective a maintenance proxy only when it is associated with a mechanically independent future outcome. The same fixed within-unit normalization is used by every selector, and no comparison depends on utilities from different maintenance units sharing an absolute scale.
3.2. Selection Policies
Candidate c dominates when it is no worse on all five objectives and better on at least one. The nondominated set is
ParetoProof selects the candidate in closest to the normalized ideal point:
The strongest comparator is an adaptive scalarizer, , whose normalized weights respond to objective variation within the candidate pool. The primary fixed baseline uses for all objectives. A sensitivity analysis uses weights for tokens, elaboration, dependencies, fragility, and warnings. We also evaluate a fixed lexicographic ordering and uniform random-valid selection. All policies operate on the same frozen candidates.
3.3. Geometry and Conflict
Pareto selection has a distinct choice only when and . We also measure continuous conflict
where is the rank correlation between objectives a and b over the candidates in unit i. Larger means stronger ranking disagreement. Descriptively, any conflict requires at least two objective disagreements above the 20% rule in the frozen analysis; high conflict requires at least three above the 30% rule. Only the continuous score enters the moderator model.
3.4. Evaluation Design
3.4.1. Natural Maintenance Study
The main study contains 649 maintenance units and 1,649 valid candidates from four Lean source collections. One unit is a theorem with its maintained proof and a fixed set of alternatives. Later-version results are available for 312 units, covering 776 unit-version checks. The candidate pools are frozen before the future outcomes are evaluated, and this study uses no LLM inference. Table 1 summarizes the data.
We treat these as source collections rather than four independent repositories. Exact snapshot identifiers and future-version boundaries are not included in this release, which limits independent reproduction.
Primary endpoint and tests.
A selected proof succeeds only if it survives every available later version for its unit, yielding one paired binary outcome per unit. Exact McNemar tests compare ParetoProof with adaptive and fixed-equal scalarization. These two comparisons form the primary family, so we use . Failure to reject is not treated as evidence of equivalence.
Coverage sensitivity.
Future coverage differs across the four sources. We therefore report a repository-standardized analysis alongside the observed results. This checks whether the main ordering is driven by sources with better future-version coverage. Full weighting and bootstrap details appear in Appendix B.
Moderator and proxy analyses.
After seeing the average selector results, we test whether objective conflict explains where Pareto selection helps. A repeated-measures logistic model includes selector, continuous conflict, their interaction, source, and version index. This analysis is exploratory. Separately, we compare the objective scores with future survival and use an 89-unit upstream-change set to compare ParetoProof with direct fragility optimization.
3.4.2. Controlled Generation Study
The controlled study compares one-shot generation, iterative repair, scalarized search, and ParetoProof on 16 ITPEval Lean families. Three model configurations, three seeds, four methods, and a three-call budget produce 576 episodes and 1,728 model calls. Lean 4.18 checks each candidate, and Lean 4.33 provides a later-version transfer test. We average model and seed results within each theorem family before statistical testing. Additional budgets of 8, 16, and 32 calls test whether the small frontiers are simply caused by too little generation.
The primary three-call campaign uses Claude Opus 5, Claude Sonnet 5, and Qwen3-Coder 480B-A35B. The powered 8- and 16-call campaigns use Opus 5, Sonnet 5, and GPT-5.6 Terra. The 32-call saturation curve is a single-model Sonnet 5 sweep; a separate public-pool check includes Sonnet 5, DeepSeek 3.2, Qwen3-Coder, and GPT-5.6 Terra. A three-task directional check uses GPT-5.6 sol. All models are accessed through hosted inference services without training or fine-tuning.
3.5. Generative AI Use
Generative AI tools were used to assist with language editing, LaTeX preparation, and analysis-code development. The author reviewed and verified the manuscript, reported results, references, and supporting files and takes responsibility for the final content.
4. Results
4.1. The Opportunity for Pareto Selection Is Uncommon
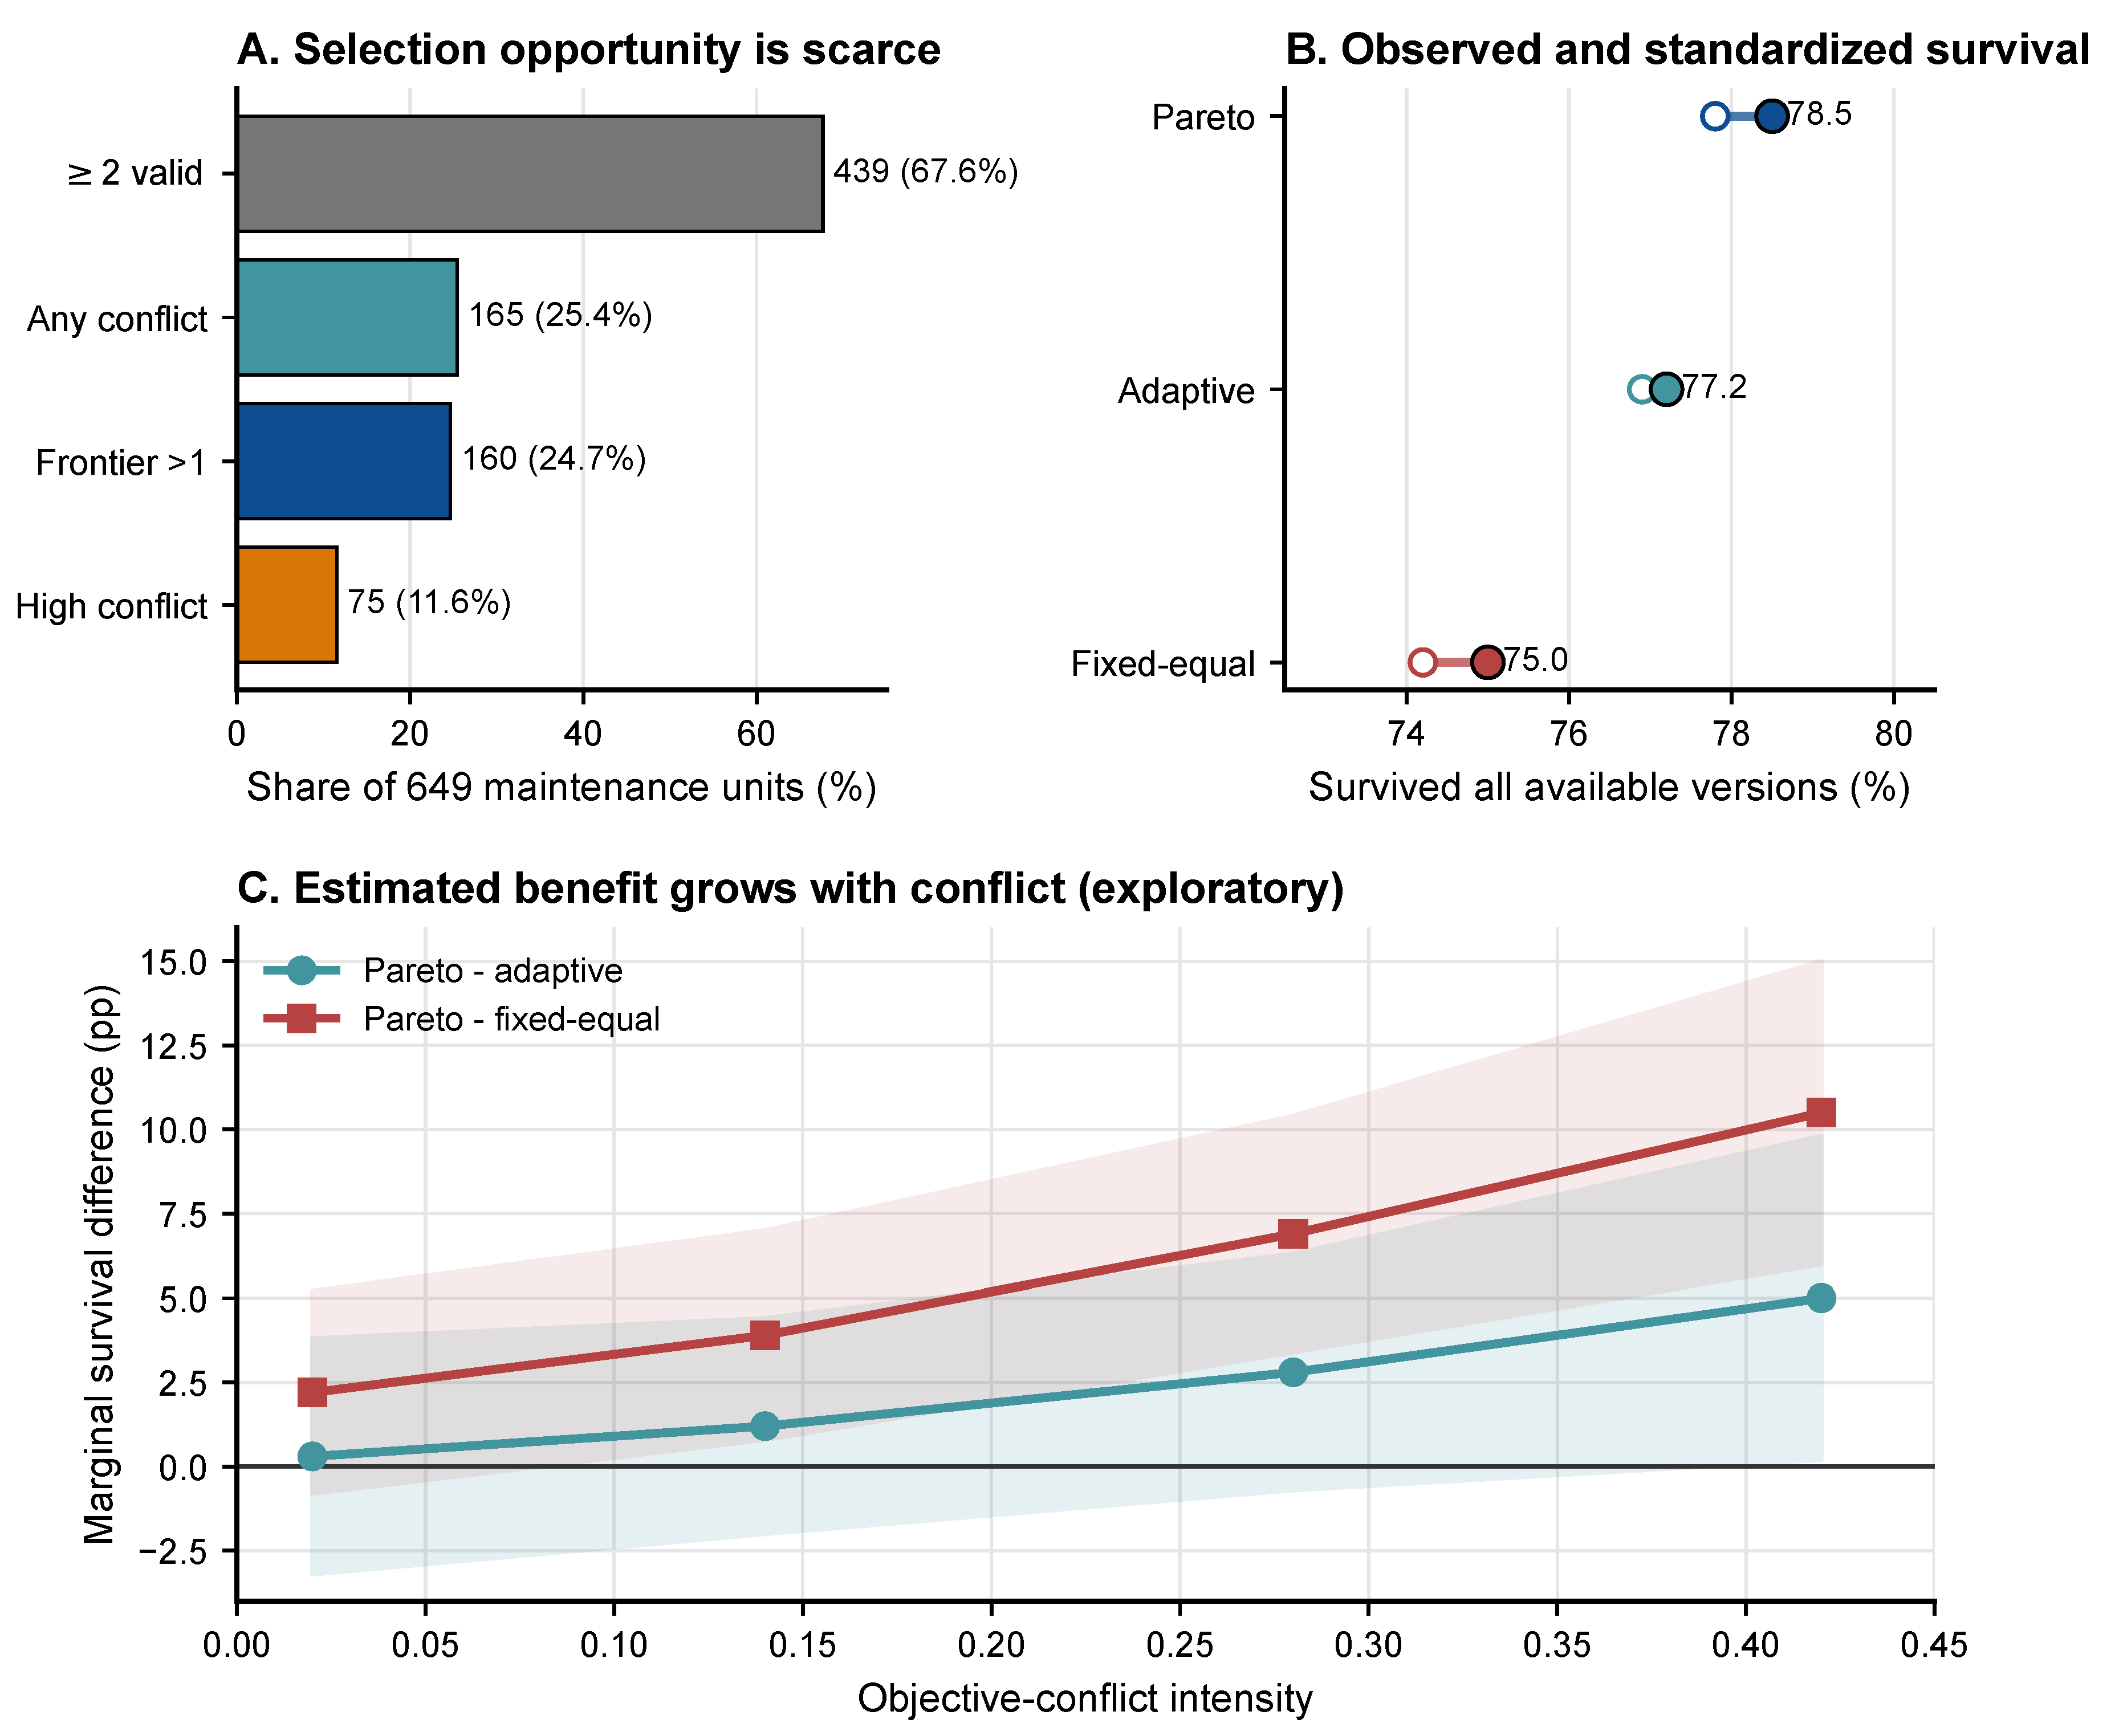
The mean pool contains 2.54 valid candidates, but 210 of 649 units contain only one. Although 439 units have at least two valid candidates, only 160 (24.7%) have a frontier larger than one, 165 (25.4%) exhibit any conflict, and 75 (11.6%) meet the high-conflict criterion. Of the 160 nontrivial-frontier units, 147 also exhibit conflict (). Candidate multiplicity is therefore not equivalent to meaningful multi-objective choice.
Figure 1.
Geometry and future-version outcomes. A: The funnel from multiple valid candidates to conflict-rich frontiers. B: Observed all-version survival for 312 units is shown with filled points; open points are repository-standardized estimates. C: Follow-up estimates across continuous conflict. Bands are pointwise 95% intervals; this pattern needs confirmation on new data.
4.2. Pareto Improves on Fixed Weights; Adaptive Remains Unresolved
ParetoProof survives all available versions on 245 of 312 units (78.5%). Fixed-equal scalarization survives on 234 (75.0%). The paired difference is with , meeting the adjusted threshold for the two primary comparisons. Adaptive scalarization survives on 241 units (77.2%), leaving a difference from ParetoProof ().

Table 2.
Primary paired all-version endpoint. Differences are comparator minus ParetoProof; tests are exact McNemar comparisons.
Table 2.
Primary paired all-version endpoint. Differences are comparator minus ParetoProof; tests are exact McNemar comparisons.
| Selector | Survival | Difference | Paired p |
|---|---|---|---|
| ParetoProof | 245/312 (78.5%) | – | – |
| Adaptive scalar | 241/312 (77.2%) | 0.4240 | |
| Fixed-equal scalar | 234/312 (75.0%) | 0.0207 |
Repository-standardized rates are 77.8% for ParetoProof, 76.9% for adaptive, and 74.2% for fixed-equal. The weighted ParetoProof-minus-fixed difference is (95% bootstrap interval , ); the adaptive difference is (, ). An alternative fixed weighting gives 74.4% unweighted survival and a Pareto advantage (). The standardized fixed-equal estimate preserves the direction and magnitude of the primary result, although its p-value narrowly exceeds the adjusted threshold. The alternative-weight sensitivity supports the same ordering. The adaptive comparison remains unresolved within a few percentage points.
4.3. Conflict May Explain When Pareto Selection Helps
In the follow-up model, the interaction is negative for adaptive scalarization relative to Pareto (, robust SE , 95% CI , ) and larger for fixed-equal scalarization (, SE , 95% CI , ). The estimated Pareto advantage over adaptive scalarization is 0.3 pp at the 10th conflict percentile, at the median, and at the 90th percentile. Only the last pointwise interval excludes zero, .
The thresholded subgroup shows the same pattern but exposes the uncertainty. Among 46 high-conflict units with future data, survival is 84.8% for Pareto, 78.3% for adaptive, and 71.7% for fixed-equal. The paired p-values are 0.375 and 0.070 because only five and eight pairs are discordant. We therefore do not claim a validated conflict threshold. Instead, the result suggests a clear question for a future evaluation: does a conflict-based rule chosen in advance reproduce this advantage?
4.4. Known Threats Favor Direct Optimization
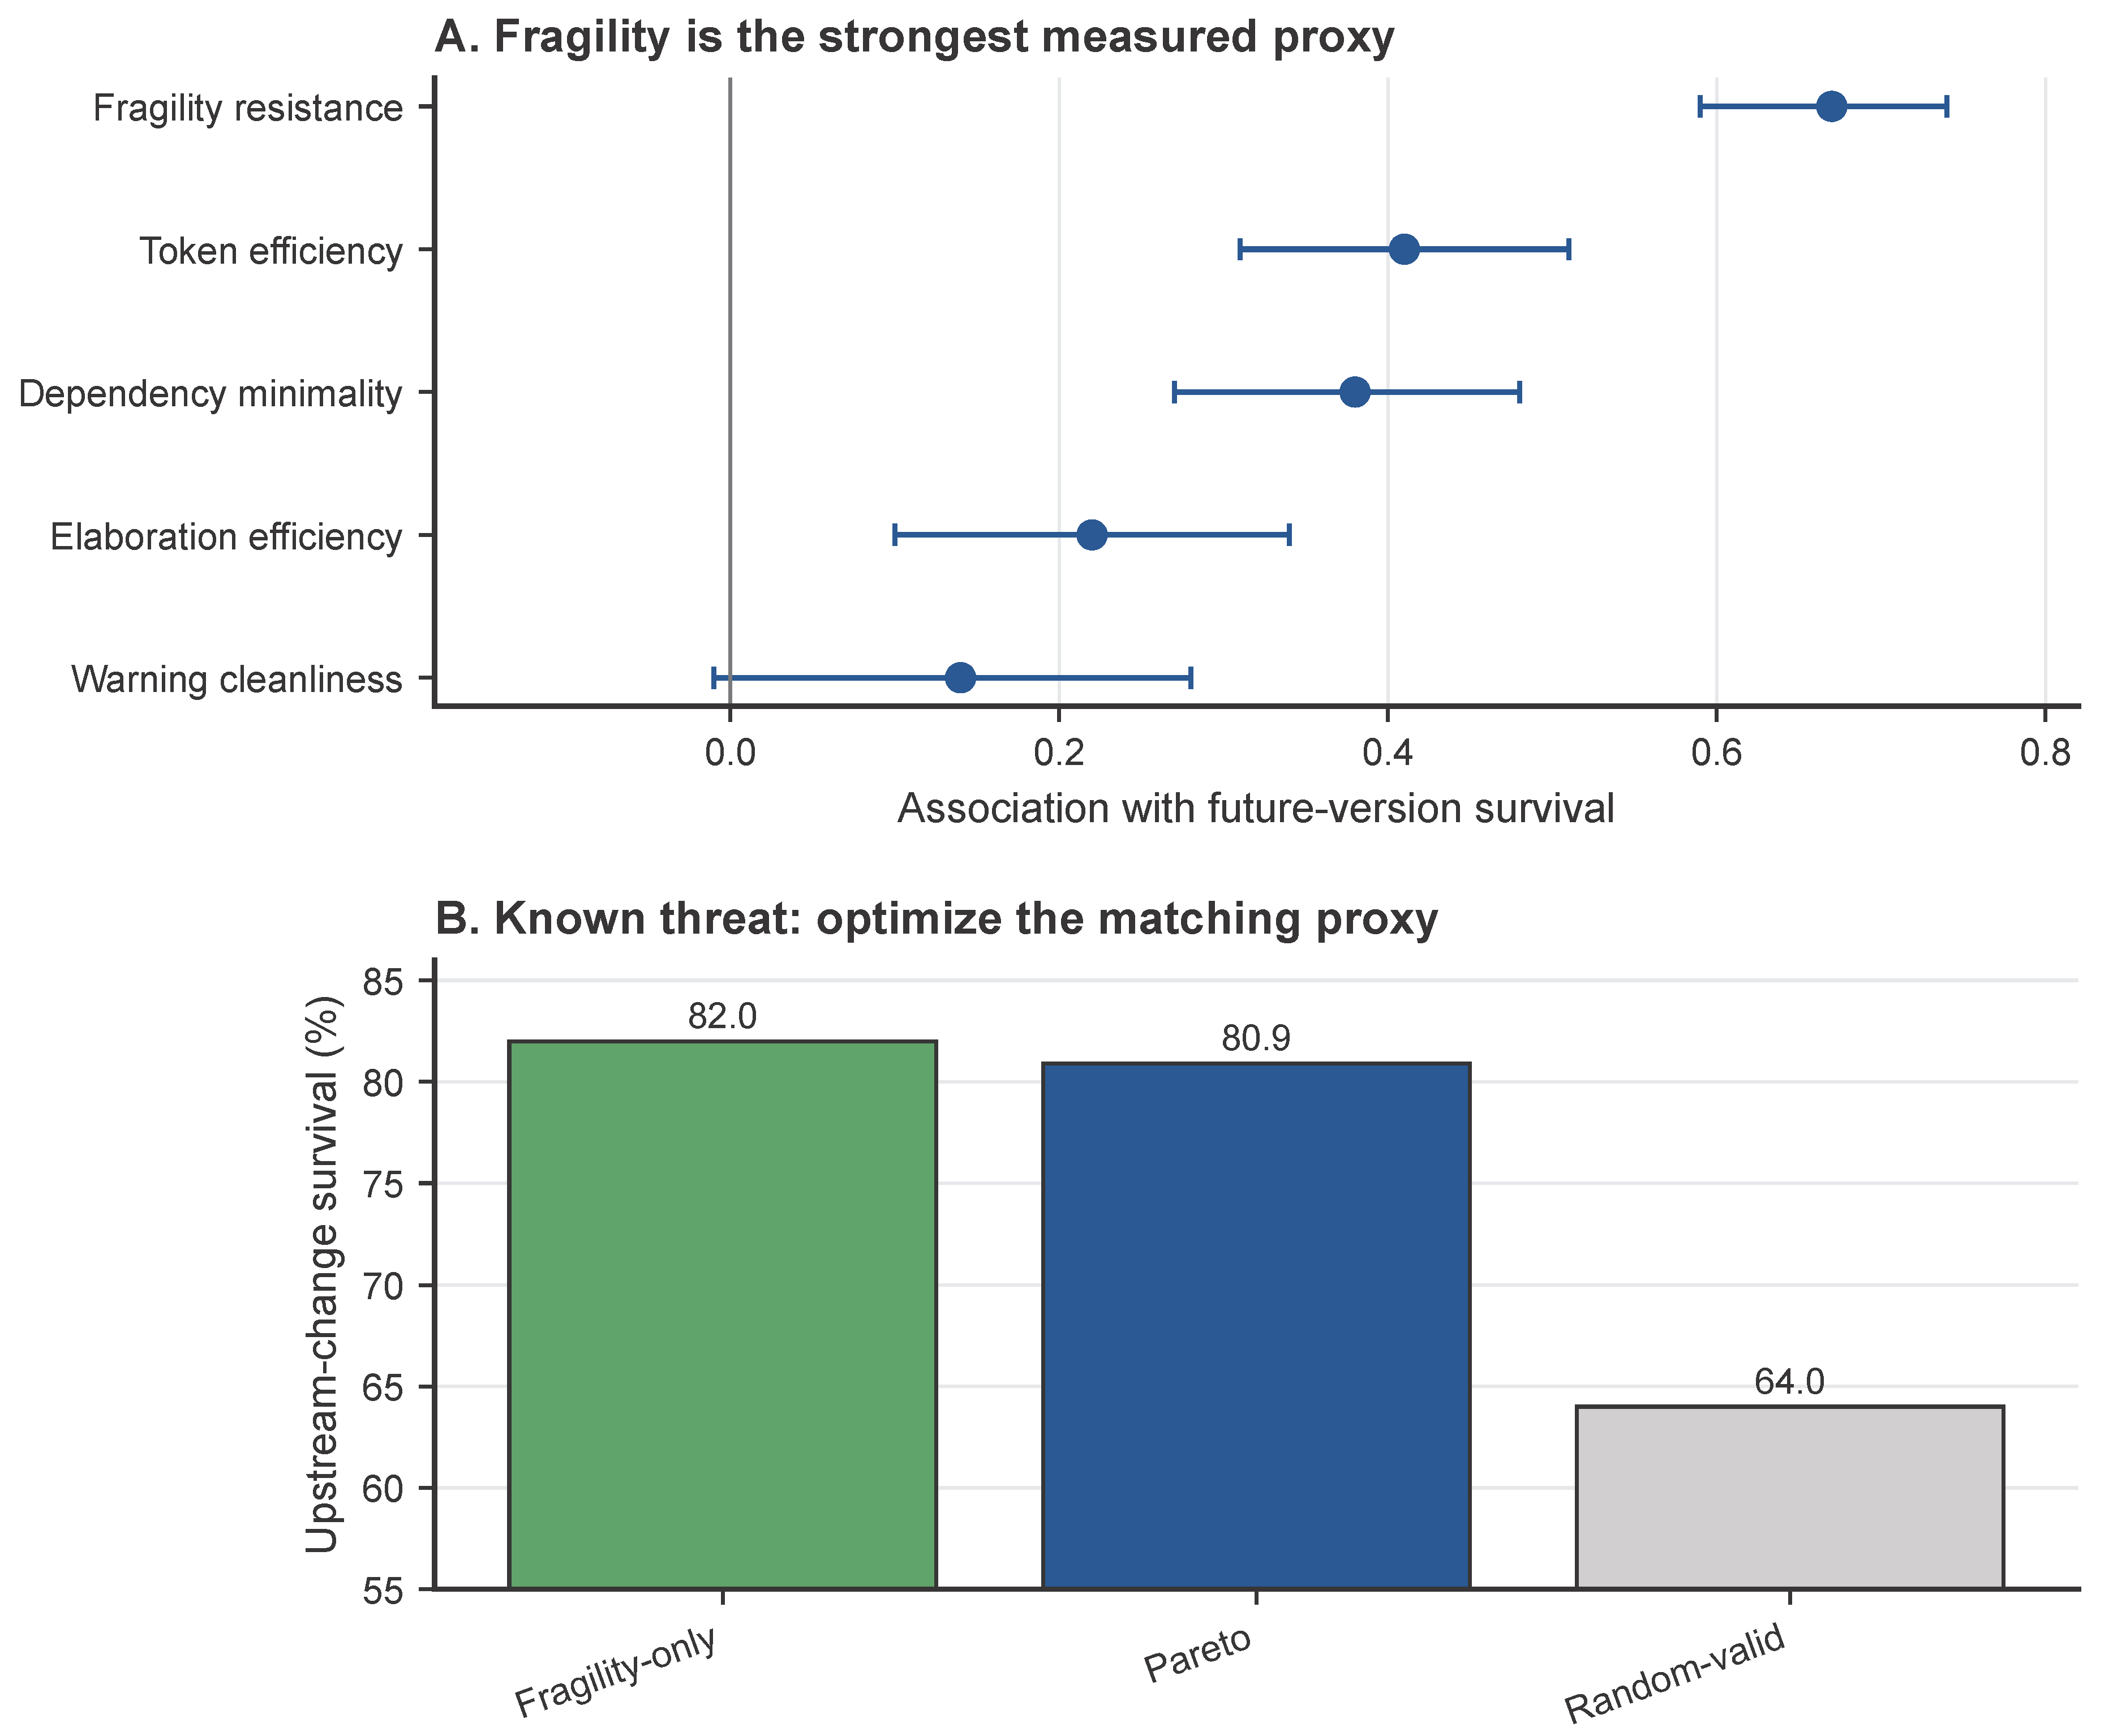
Fragility resistance has the strongest association with future survival (, 95% CI ). Token efficiency and dependency minimality are moderate ( and ), elaboration is weak (), and warning cleanliness does not validate as a proxy (, CI ). On 89 isolated upstream changes, direct fragility selection survives on 73 units (82.0%) and ParetoProof on 72 (80.9%); three pairs favor fragility, two favor Pareto, and . Random-valid selection reaches 64.0%. When the downstream threat matches one validated proxy, balancing unrelated objectives adds no measured value.
Figure 2.
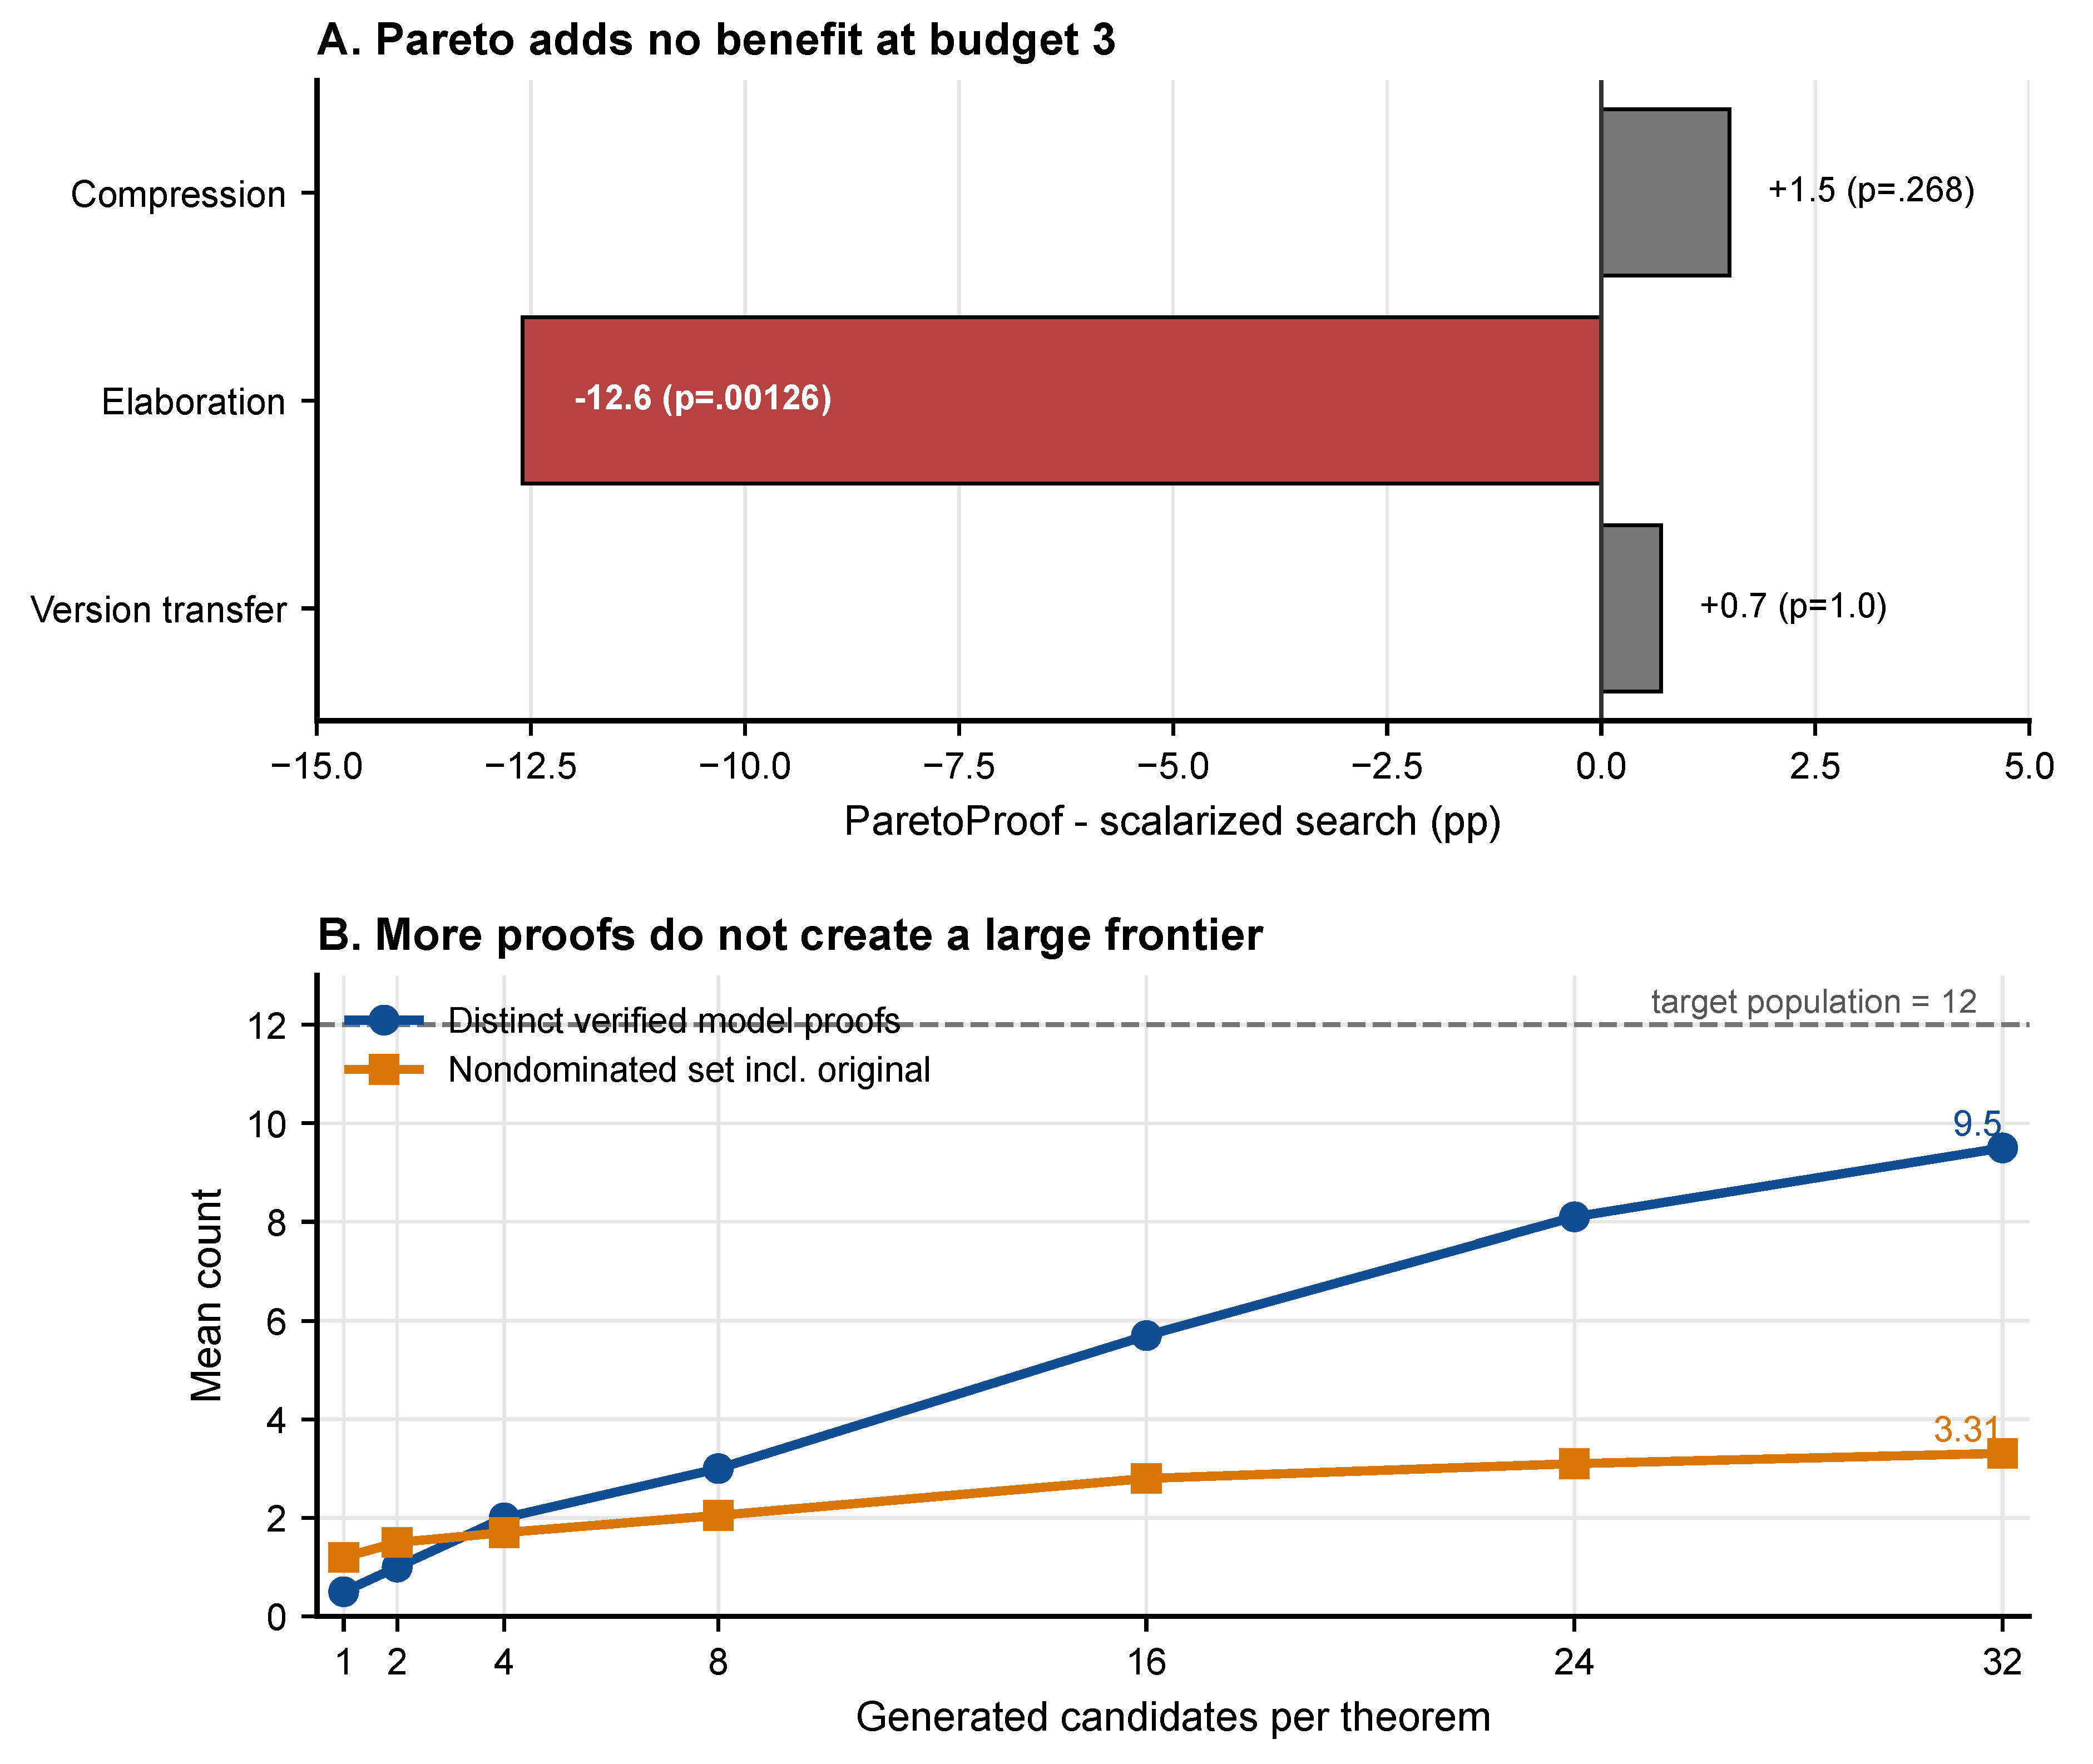
Controlled generation and saturation. A: At budget 3, ParetoProof does not improve compression or transfer over scalarized search and worsens elaboration reduction. B: More generations produce verified proofs faster than they produce nondominated alternatives.
Figure 2.
Controlled generation and saturation. A: At budget 3, ParetoProof does not improve compression or transfer over scalarized search and worsens elaboration reduction. B: More generations produce verified proofs faster than they produce nondominated alternatives.
4.5. Controlled Generation Reveals Frontier Scarcity
At budget 3, ParetoProof minus scalarized search is on compression (), on transfer (), and on elaboration reduction (). At budgets 8 and 16, the elaboration disadvantage remains same-signed across three model families and equals () and (). Removing population diversity changes no deployable outcome (all ).
The over-generation study distinguishes verified-candidate scarcity from frontier scarcity. At 32 generations, each theorem has 9.5 distinct verified model proofs on average, but the nondominated set, including the original proof, averages only 3.31. More sampling therefore creates correct alternatives without producing enough objective conflict for population retention to matter.
5. Discussion
Decision rule.
If the downstream threat is known and a validated proxy measures it, optimize that proxy. If the threat is uncertain but objective rankings mostly agree, use adaptive scalarization. If the threat is uncertain and the pool is conflict-rich, Pareto retention is a candidate for prospective evaluation, not yet an established default.
Limitations.
The natural study covers four Lean source collections, so transport to other proof assistants is unknown. Only 312 of 649 units have future evidence, and source-level weighting cannot correct within-source missingness. Twenty-five Mathlib units become untestable by the last boundary; counting all as failures lowers absolute survival but preserves the ordering. The conflict analysis was motivated after observing the primary result. Future survival does not capture readability, architectural fit, or review cost, and we do not claim that the measured proxies capture every aspect of maintainability. The study also focuses on Lean, so the result may not transfer directly to other proof assistants.
Broader impact.
Selecting proofs that survive repository evolution could reduce maintenance work and make formalized software and mathematics more dependable. The main risk is misplaced confidence: a selector may optimize an incomplete proxy and discard a proof that would better fit future needs. Every selected proof should still be checked by Lean, and the choice should be revisited when the expected maintenance threat changes.
6. Conclusion
Pareto selection is useful only after a candidate pool supplies a genuine multi-objective decision. Across 649 Lean maintenance units, that condition is uncommon. Pareto selection improves all-version survival over fixed equal weights, while its difference from a competent adaptive scalarizer is not statistically detectable. A post-hoc analysis suggests that conflict-rich pools may be the exception, while an isolated upstream-change study shows that direct proxy optimization is sufficient when the threat is known. The controlled generation campaign reaches the same mechanism from another direction: more verified proofs do not necessarily yield a large nondominated frontier. Multi-objective proof systems should report candidate-pool geometry before claiming a selector advantage.
Appendix A. Paired Outcome Tables
Table A1.
Exact paired counts for the primary all-version endpoint.
| Outcome over 312 units | Adaptive | Fixed-equal |
|---|---|---|
| Both survive | 236 | 229 |
| ParetoProof only | 9 | 16 |
| Comparator only | 5 | 5 |
| Neither survives | 62 | 62 |
Table A2.
Exploratory high-conflict counts. Exact paired p-values are 0.375 against adaptive and 0.070 against fixed-equal scalarization.
Table A2.
Exploratory high-conflict counts. Exact paired p-values are 0.375 against adaptive and 0.070 against fixed-equal scalarization.
| Outcome over 46 units | Adaptive | Fixed-equal |
|---|---|---|
| Both survive | 35 | 32 |
| ParetoProof only | 4 | 7 |
| Comparator only | 1 | 1 |
| Neither survives | 6 | 6 |
Appendix B. Geometry, Weighting, and Dropout Details
Table A3.
Conflict and frontier cross-tabulation. The association is , but neither definition is constructed from the other.
Table A3.
Conflict and frontier cross-tabulation. The association is , but neither definition is constructed from the other.
| Conflict | No conflict | Total | |
|---|---|---|---|
| Frontier | 147 | 13 | 160 |
| Frontier | 18 | 471 | 489 |
| Total | 165 | 484 | 649 |
The stabilized source weight is , with numerator . The resulting weights are 0.761 for Mathlib, 1.121 for Lean-Gym, 1.700 for miniF2F, and 2.479 for ProofNet. Their sum is approximately 312 and their Kish effective sample size is 266.
For the last Mathlib boundary, 25 of the original 201 units become untestable: five theorems are removed, seven are substantially refactored, seven lose the required dependency context, and six encounter validation-infrastructure failure. Treating all 25 as failures gives survival of 73.1% for ParetoProof, 70.6% for adaptive, and 65.2% for fixed-equal, preserving the pairwise ordering.
Appendix C. Mechanical Proxy Validation
Figure A1.
Mechanical validation of the objective proxies. A: Associations with future-version survival. B: On isolated upstream changes, direct fragility optimization matches ParetoProof and both exceed random-valid selection.
Figure A1.
Mechanical validation of the objective proxies. A: Associations with future-version survival. B: On isolated upstream changes, direct fragility optimization matches ParetoProof and both exceed random-valid selection.
Appendix D. Additional Experimental Details
The primary endpoint uses one binary outcome per unit and exact paired tests. The GEE is a separate follow-up model with 2,328 rows, 776 unit-version combinations, and 312 clusters. Its marginal-effect intervals are pointwise rather than simultaneous. Repository-standardized intervals resample units within source strata. A non-significant comparison is never described as equivalence.
Appendix D.1. Models and Generation
The controlled three-call campaign uses four methods, 16 theorem families, three seeds, and three models: Claude Opus 5, Claude Sonnet 5, and Qwen3-Coder 480B-A35B. The powered 8- and 16-call campaigns replace Qwen3-Coder with GPT-5.6 Terra. The single-model saturation sweep uses Sonnet 5 through 32 calls. A separate public-pool check uses Sonnet 5, DeepSeek 3.2, Qwen3-Coder, and Terra, and a small directional check uses GPT-5.6 sol. Inference was performed through hosted Runtime and Responses-style APIs in August 2026. Claude models use provider reasoning controls without a temperature parameter; GPT-5.6 models use reasoning-effort controls; open-weight model decoding is fixed per campaign. LLMs propose proof bodies, but Lean alone determines validity. Complete prompt templates and request configurations are not included in this release.
Appendix D.2. Reproducibility Materials
This release contains the manuscript and its figures, but does not include candidate-level objectives, selector choices, per-version outcomes, or the complete analysis pipeline. The reported aggregate results are therefore not independently reproducible from this release alone. Regenerating the controlled candidate pools would additionally require access to the listed hosted models.
Appendix D.3. Compute Resources
Lean verification and statistical analysis ran on an AWS EC2 c6i.2xlarge host with 8 vCPUs, 16 GB RAM, a 200 GB GP3 SSD, and Ubuntu 24.04; no local accelerator was used. The natural study required 1,649 Lean checks and 3.46 CPU-hours. Hosted inference for the controlled study used 1,728 model calls and approximately 2.43 hours of wall-clock time. Across the retained campaigns, total wall-clock time was approximately 5.89 hours. Provider-managed accelerator details were not exposed to the authors.
Appendix D.4. Existing Assets and Licenses
Table A4.
Versions and licenses of the existing assets used in the experiments.
| Asset | Version or snapshot | License |
|---|---|---|
| Mathlib | Frozen study snapshot | Apache-2.0 |
| Lean-Gym | Frozen repository snapshot | Apache-2.0 |
| miniF2F | Frozen benchmark snapshot | MIT |
| ProofNet | Frozen benchmark snapshot | MIT |
| ITPEval | Frozen Lean-family snapshot | MIT or CC-BY-4.0 (mirror-dependent) |
The cited source papers provide attribution. This release does not redistribute the original benchmark repositories. Mathlib and Lean-Gym are identified as Apache-2.0 assets, miniF2F and ProofNet as MIT assets, and ITPEval as carrying the license of the frozen mirror from which its Lean-family tasks were obtained. Exact snapshot identifiers and the specific ITPEval mirror are not included in this release. Hosted models were accessed through their managed service interfaces; no model weights are redistributed.
References
- Wu, J.; George, R. J.; Anandkumar, A. ITPEval: Benchmarking formal translation across interactive theorem provers. arXiv 2026, arXiv:2607.19407. [Google Scholar]
- Indukuri, S.; Agrawal, A. Grounded optimization: A layered engineering framework for reducing LLM hallucination in automated personal document rewriting. arXiv 2026, arXiv:2607.01457. [Google Scholar]
- Yang, K.; Swope, A. M.; Gu, A.; et al. LeanDojo: Theorem proving with retrieval-augmented language models. Advances in Neural Information Processing Systems, 2023. [Google Scholar]
- Amazon Artificial General Intelligence. Amazon Nova multimodal embeddings: Technical report and model card. Amazon Technical Reports. 2025. [Google Scholar] [CrossRef]
- First, E.; Rabe, M. N.; Ringer, T.; Brun, Y. Baldur: Whole-proof generation and repair with large language models. ESEC/FSE 2023. [Google Scholar] [CrossRef]
- Agrawal, A.; Babu, R. S. Incident memory: Training-free operational memory through sequential pattern mining and velocity-stratified retrieval. arXiv 2026, arXiv:2609.01616. [Google Scholar]
- Polu, S.; Sutskever, I. Generative language modeling for automated theorem proving. arXiv 2020, arXiv:2009.03393. [Google Scholar]
- Amazon Artificial General Intelligence. Amazon Nova Sonic: Technical report and model card. In Amazon Technical Reports; 2025. [Google Scholar]
- Jiang, A. Q.; Li, W.; Han, J. M.; Wu, Y. Draft, sketch, and prove: Guiding formal theorem provers with informal proofs. International Conference on Learning Representations, 2023. [Google Scholar]
- Agrawal, A.; Indukuri, S. Schema-first retrieval: Embedding catalogs for natural language analytics. arXiv 2026, arXiv:2606.28387. [Google Scholar]
- Zheng, K.; Han, J. M.; Polu, S. miniF2F: A cross-system benchmark for formal Olympiad-level mathematics. arXiv 2021, arXiv:2109.00110. [Google Scholar]
- Amazon Artificial General Intelligence. Amazon Nova Premier: Technical report and model card. <italic>Amazon Technical Reports</italic>, 2025.
- Azerbayev, Z.; Piotrowski, B.; Schoelkopf, H.; Ayers, E.; Radev, D.; Avigad, J. ProofNet: Autoformalizing and formally proving undergraduate-level mathematics. arXiv 2023, arXiv:2302.12433. [Google Scholar]
- Babu, R. S.; Agrawal, A. Self-healing agentic orchestrators for reliable tool-augmented large language model systems. arXiv 2026, arXiv:2606.01416. [Google Scholar]
- Deb, K.; Pratap, A.; Agarwal, S.; Meyarivan, T. A fast and elitist multiobjective genetic algorithm: NSGA-II. IEEE Trans. Evol. Comput. 2002, 6(2), 182–197. [Google Scholar] [CrossRef]
- Amazon Artificial General Intelligence. Amazon Nova 2: Multimodal reasoning and generation models. Amazon Technical Reports. 2025. [Google Scholar] [CrossRef]
- Petke, J.; Haraldsson, S. O.; Harman, M.; Langdon, W. B.; White, D. R.; Woodward, J. R. Genetic improvement of software: A comprehensive survey. IEEE Trans. Softw. Eng. 2018, 44(4), 415–432. [Google Scholar] [CrossRef]
- Feng, W.; Agrawal, A.; Ling, H.; Blasch, E.; Adiles-Cruz, E.; Schrader, P. T.; Wei, J. DDDAS probability learning for natural disaster change detection. International Conference on Dynamic Data Driven Applications Systems, 2024; pp. pages 90–99. [Google Scholar]
- Vidgen, B.; Agrawal, A.; Ahmed, A. M.; Akinwande, V.; Al-Nuaimi, N.; Alfaraj, N.; et al. Introducing v0.5 of the AI safety benchmark from MLCommons. arXiv 2024, arXiv:2404.12241. [Google Scholar]
- Amazon Artificial General Intelligence. The Amazon Nova family of models: Technical report and model card. In Amazon Technical Reports; 2024. [Google Scholar]
- Agrawal, A.; Li, J. Mitigating bias in AI using Debias-GAN. NVIDIA GTC Conference and WWT Research, 2022. [Google Scholar]
- Vidgen, B.; Agrawal, A.; Ahmed, A. M.; Akinwande, V.; Al-Nuaimi, N.; Alfaraj, N.; Others; et al. Introducing v0.5 of the AI safety benchmark from MLCommons. arXiv 2024, arXiv:2404.12241. [Google Scholar]
- Adarsh Agrawal, A. V.; Garg, N. Time series forecasting of producer price index, using ARIMA. Int. J. Sci. Res. 2018, 7(7), 1019–1024. [Google Scholar]
- Vidgen, B.; Agrawal, A.; Ahmed, A. M.; Akinwande, V.; Al-Nuaimi, N.; Alfaraj, N.; et al. How to construct AI safety benchmarks; Manuscript; n.d. [Google Scholar]
- Vidgen, B.; Agrawal, A.; Ahmed, A. M.; Akinwande, V.; Al-Nuaimi, N.; Alfaraj, N.; et al. Introducing v0.5 of the AI safety benchmark from MLCommons, 2024. 2024. Available online: https://arxiv.org/abs/2404.12241.
Table 1.
Frozen-pool composition. The primary endpoint has one paired all-version outcome per future-covered unit.
Table 1.
Frozen-pool composition. The primary endpoint has one paired all-version outcome per future-covered unit.
| Source | Units | Future units | Attempts |
|---|---|---|---|
| Mathlib | 318 | 201 | 566 |
| Lean-Gym snapshots | 156 | 67 | 134 |
| miniF2F | 113 | 32 | 64 |
| ProofNet | 62 | 12 | 12 |
| Total | 649 | 312 | 776 |
Disclaimer/Publisher’s Note: The statements, opinions and data contained in all publications are solely those of the individual author(s) and contributor(s) and not of MDPI and/or the editor(s). MDPI and/or the editor(s) disclaim responsibility for any injury to people or property resulting from any ideas, methods, instructions or products referred to in the content. |
© 2026 by the authors. Licensee MDPI, Basel, Switzerland. This article is an open access article distributed under the terms and conditions of the Creative Commons Attribution (CC BY) license (http://creativecommons.org/licenses/by/4.0/).
Copyright: This open access article is published under a Creative Commons CC BY 4.0 license, which permit the free download, distribution, and reuse, provided that the author and preprint are cited in any reuse.