

Submitted:
04 October 2026
Posted:
07 October 2026
You are already at the latest version
Abstract
Assessment of the ASCS compared to the global systems USDA and WRB, pedological studies were emphasized on North-West Sinai region (El- Tina plain) which have five physiographic units, i. e., sand beach, wet sabkha, dry sabkha, sand plain, and sand dunes. Total area is 2943.27 km² which includes urban, fish bonds, lakes, and water body. The current study concluded that Applied Soil Classification System (ASCS) covered most of the requirements of global systems as well as showing levels and its stratification of soil characteristics of importance in applied aspects and land management, and showing the agricultural determinants.
Keywords:
soil classification systems
; USDA
; WRB
; ASCS
; tina plain soils
1. Introduction
The proposed Applied Soil Classification System (ASCS) is considered the latest and easiest of classification systems. In addition, it is characterized by showing the applied aspects by monitoring the levels of soil properties.
ASCS consists of two levels: The first includes twelve Principal Soil Groups (PSGs), which reflect the soil genesis and nature of soil formation. While the second level encompasses the soil environment and properties that are readily observable and measurable, either in the field or within a laboratory setting. This level is classified into nine primary qualifications associated with PSG and tend to be stable and seven secondary qualifications are not typically associated with a PSG and to be subject to change.
To classifying soil using ASCS, name of PSG is recorded in the center of the line, while primary qualification names place before PSG and the secondary qualification on the left as shown in the text of research.
The newly Applied Soil Classification System (ASCS) is considered one of easiest of soil classification systems that can be applied to give a comprehensive view of the soil characteristics and its problems and how to manage it.
ASCS consists of two main levels. First, is divided into twelve Principal Soil Groups (PSGS), which reflect the soil genesis and mature of soil formation. White, the second level consists of two parts, the first of which are primary qualifications and include nine properties that tend to be stable, and the second part secondary qualifications, includes seven variable characteristics that are not related to PSG.
To classify soils using ASCS, we recorded PSG in center of the line and primary qualifications on the right while the secondary qualifications on the left as shown in the text of research.
The current study aims to highlighting the importance of applying the ASCS as compared with USDA and WRB systems through the pedological study of El- Tina plain Eastern Port Said City.
Tina plain is an important area within project 50000 feddans which irrigated by EL -Shiekh Gaber canal.
Elwan et al. (1983) appeared that, El-Tina plain area consists of two geomorphic units: (1) Northern coastal plain which consider a strep parallel to the Mediterranean shore line. (2) EL-Tina plain covers about 75 km in the northwest direction and up to 25 km width. This plain seems lower than its surroundings and have dots of low sandy dunes, sandy accumulation loess hummocks.
The study area belongs to Quaternary formation of Pleistocene and Holocene deposits ranged from loamy sand and silt to limestone, clay stone and sandstone (Said, 1990 and Ashmawy et al., 2000). Geomorphologically, according to Ashmawy et al. (2000) the study area belongs to the Mediterranean Coastal Plain Belt of roughly triangular shape (8000 km2). It slopes gradually northward and consist of coastal areas with a parallel coastal dune up to the height of 100 m above see level., in addition to offshore bars enclosing Sabkha El-Bardawil Lake. On the other hand, the lowlands are covered by sabkha deposits in EL-Tina plain.
The study area is located within the arid belt of North Africa, i.e., long hot rainless summer and mild winter. The monthly mean of maximum temperature differs from 20.1 to 29.22 C0, while minimum changes between 12.8 and 25.8C0. The average annual precipitation ranges between nil and 49.9 mm. The relative humidity varies between 68.7 and 80.3%. Wind speed ranges between 3.9 and 5.1 m/s. According to Walter methods (1950), which relates temperature (C°) as well as rainfall (mm) to the time of the year in one diagram. According to this method, the relevant figure for the area (Figure 1) shows that dryness prevails through most of the area. The soil temperature regime is thermic and soil moisture regime is Torric according to USDA (2022) and ASCS (Zayed, 2026). The climatological date was used by Science Nasa gov. (2025) as average of fifteen years from 2010 to 2024.
2. Materials and Methods
Physiographic units of the study area were extracted in accordance with the methodology of Dobos et al. (2002) supported by prior research and field observations. Using digital elevation models (DEMs) With a spatial resolution of 30 m, acquired by the NASA Shuttle Radar Topographic Mission (SRTM) (https://earthexplorer.usgs.gov accessed on 10 July 2024) along with high resolution (10 m) digital Sentinel-2 image (downloaded from http:www.esa.int/Applications/Observing_the_Earth/Copernicus/) in January 2025. The Sentinel application platform (SNAP) and ERDAS IMAGINE software (2022) were used to process the spectral subset, radiometric calibration, atmospheric, and geometric corrections of the image [El Behairy, 2021]. Remote sensing (RS) and geographic information system (GIS) are effective for identifying geomorphological units [Said et al., 2020].
Ten representative soil profiles are selected through fifty soil profiles and nine pits (augers) were dug and to represent the major geomorphic units on the studied area. These profiles were described according to FAO (2006) and Soil Science Division staff (2017). Location of the studied area is illustrated in map 1 while location of different physiographic units and representative soil profiles are illustrated in map 2. The field description is recorded in Table 1. Soil samples were air dried, crushed and sieved through 2mm sieve, and then stored for analysis.
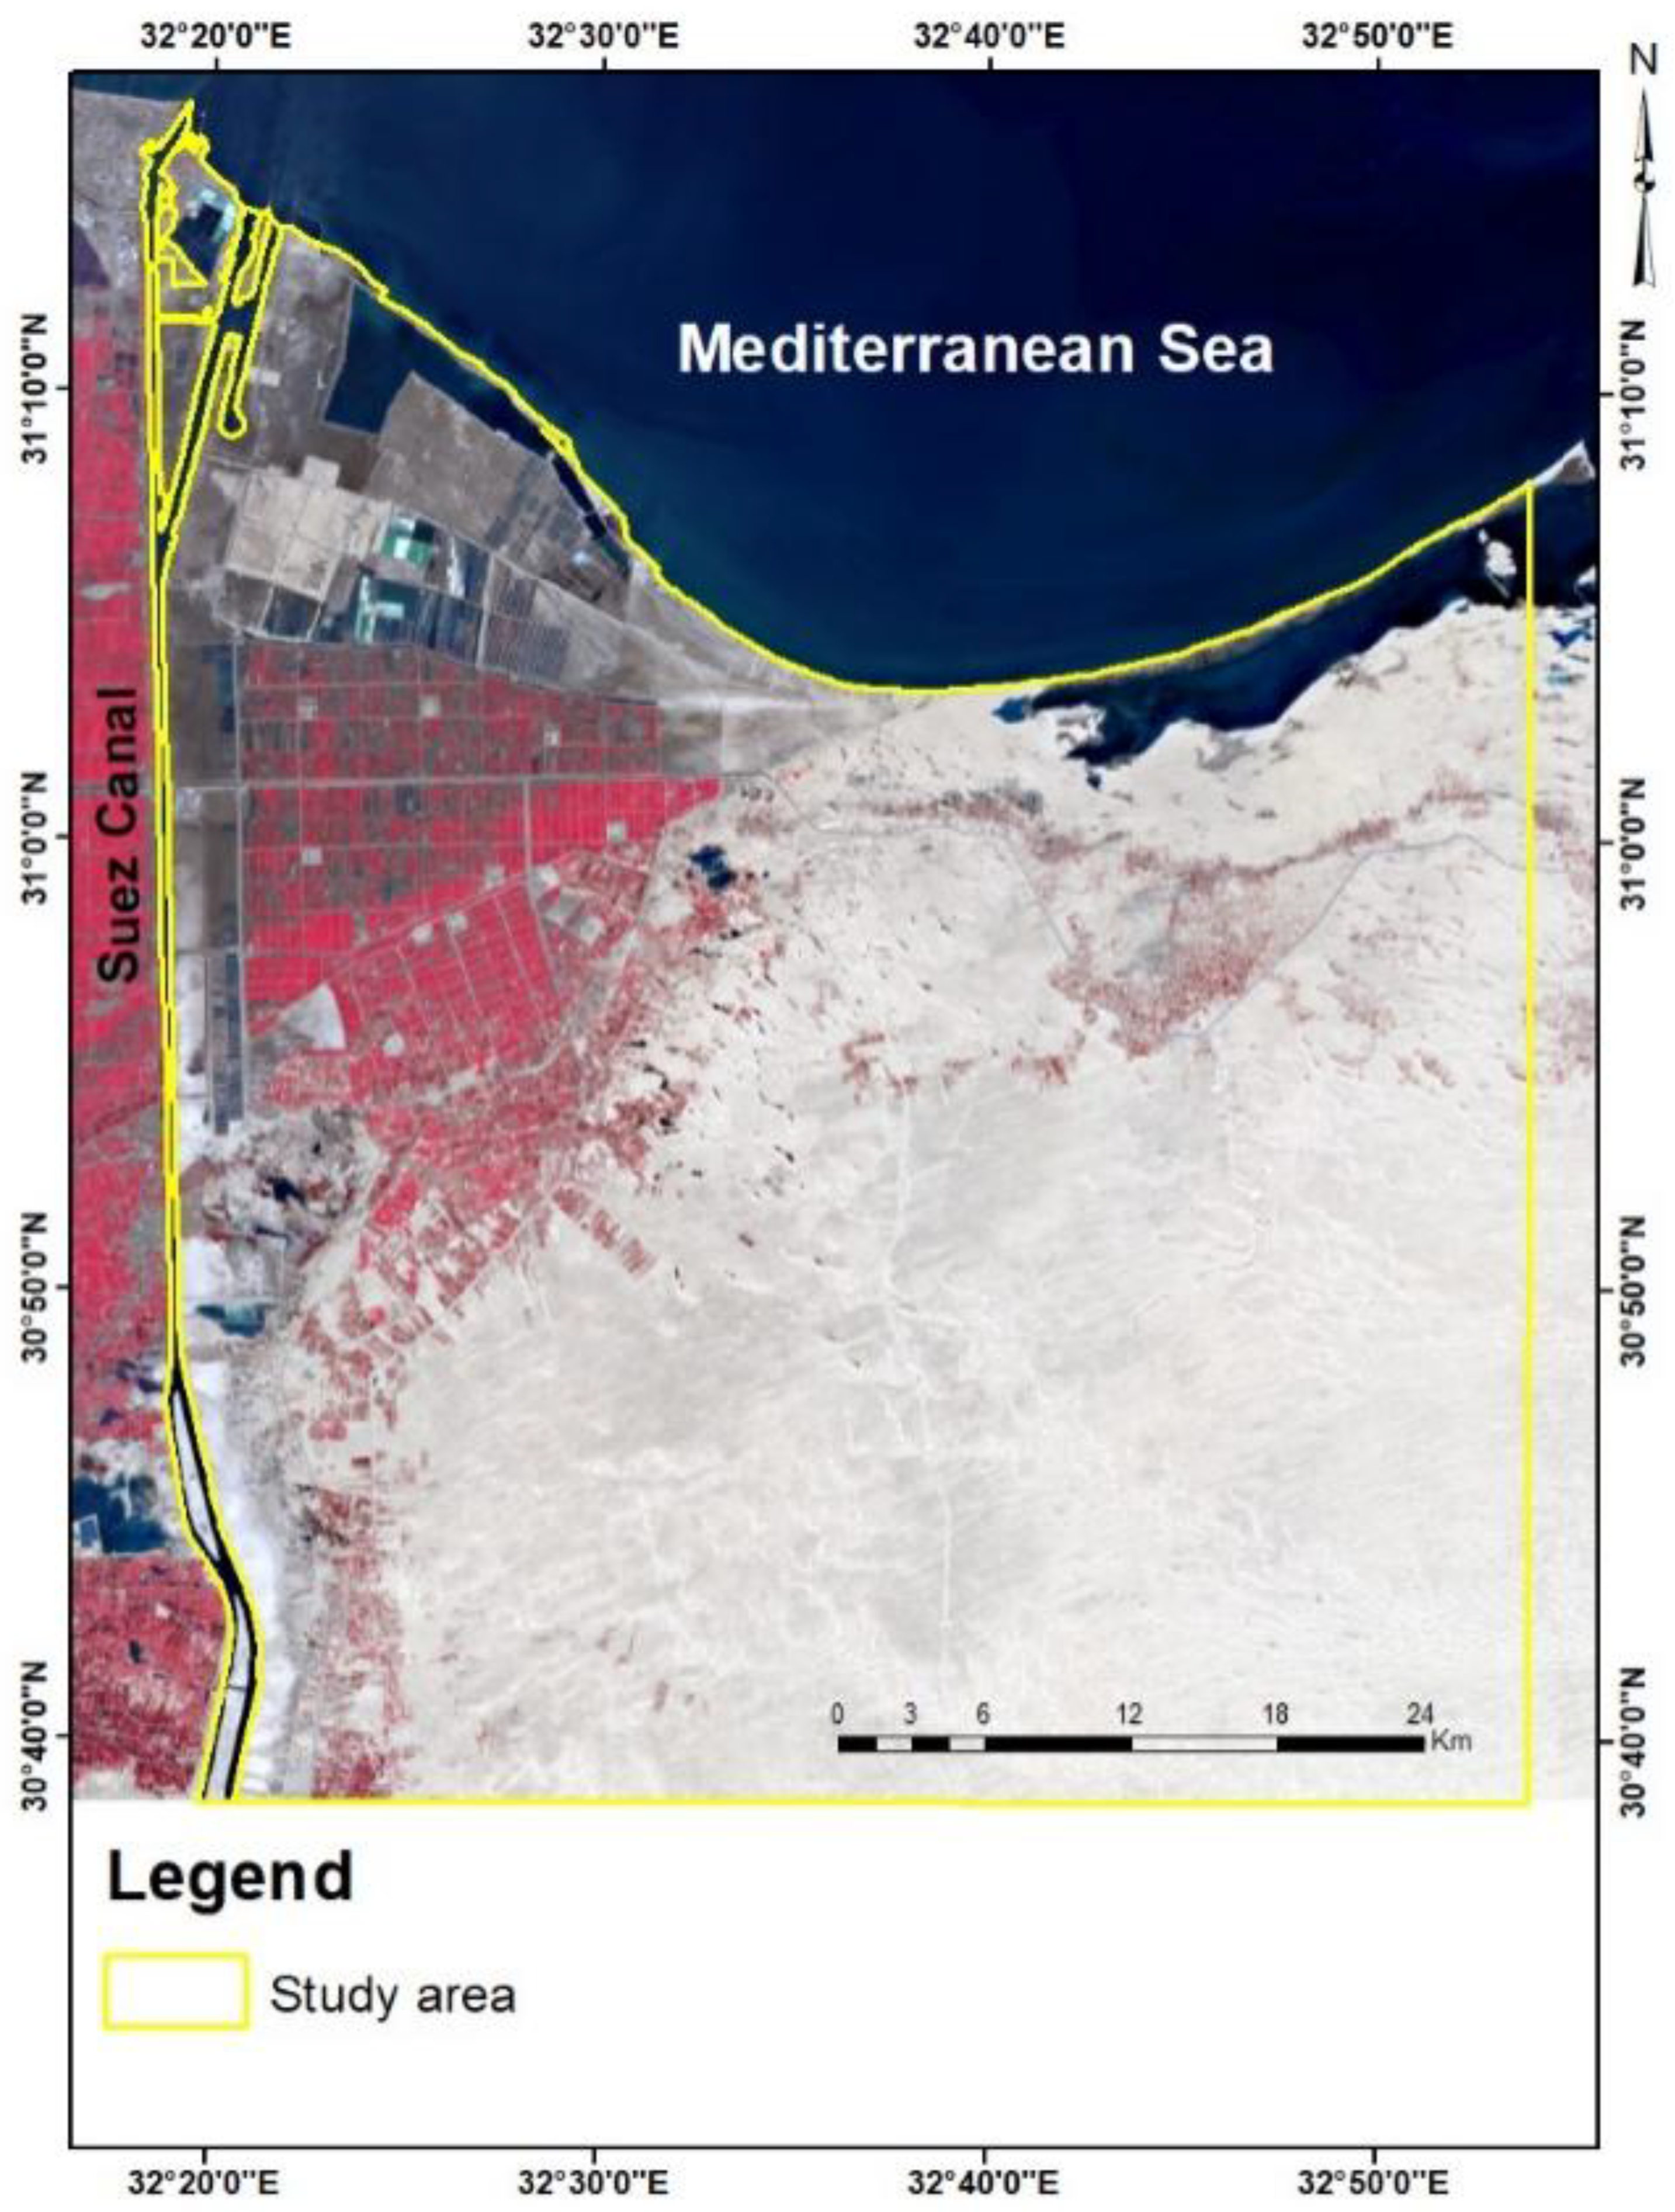 Map 1. Location of the studied area.
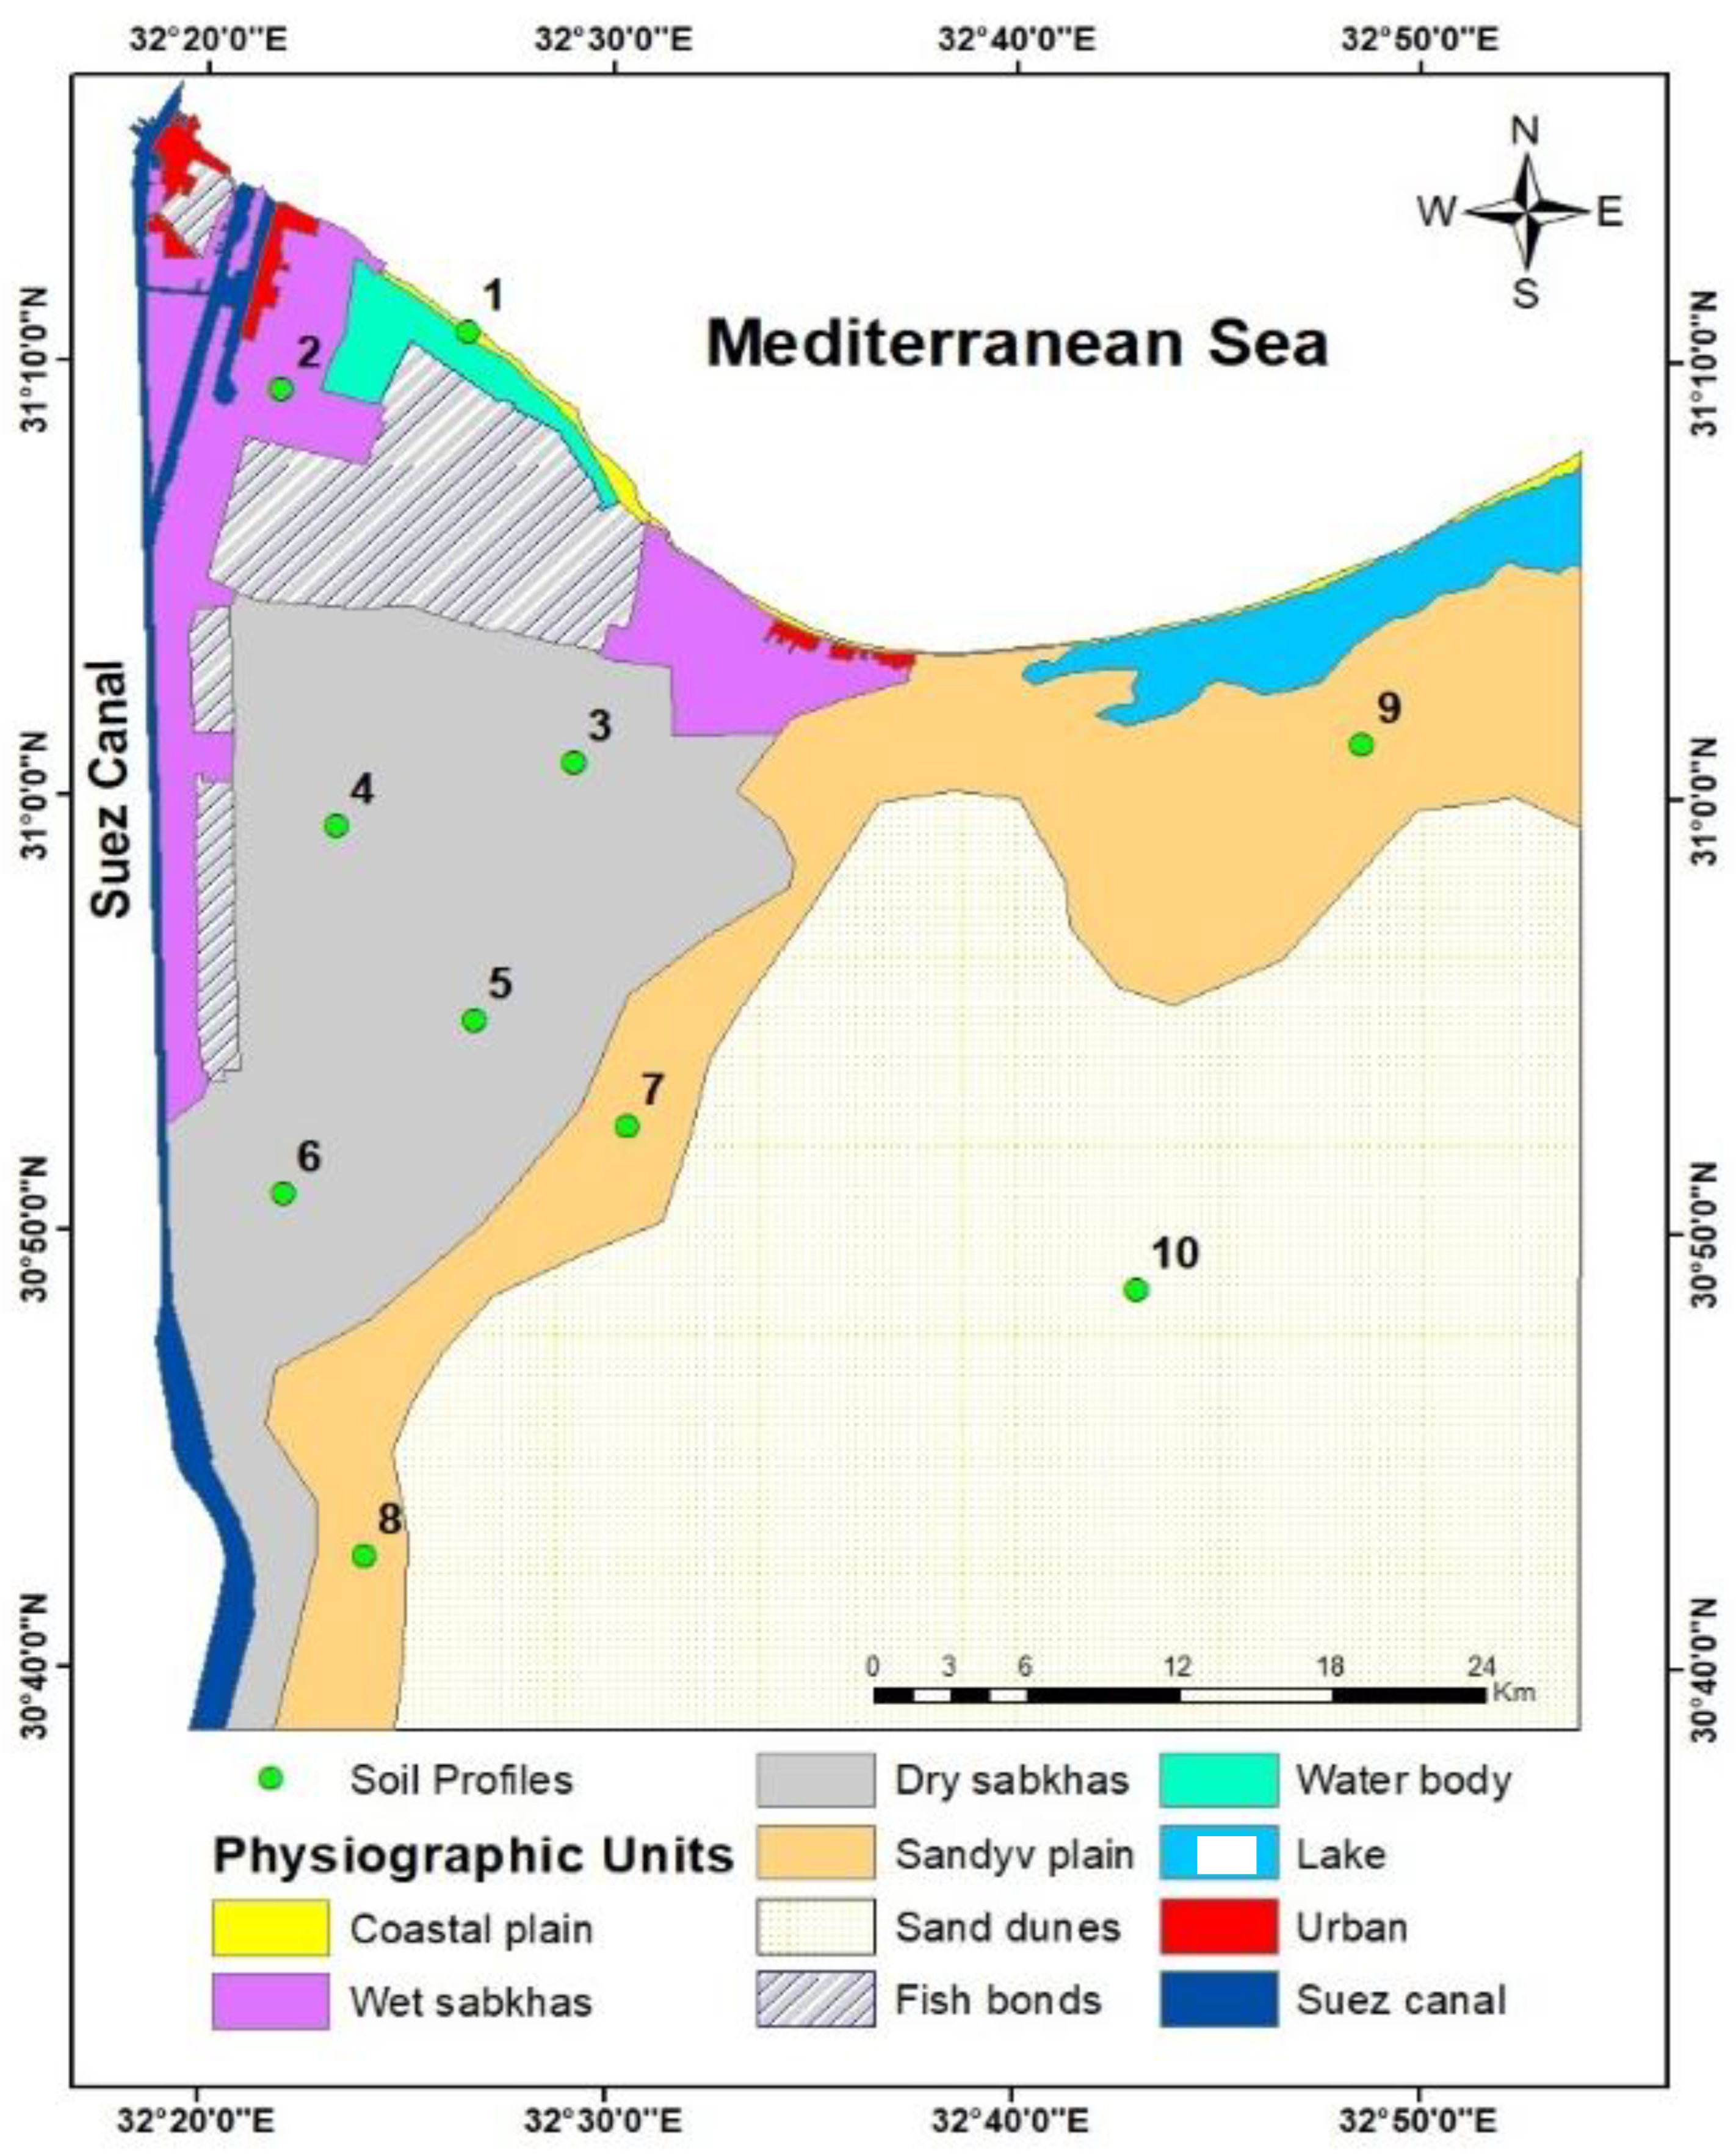 Map 2. Physiographic units and representative soil profiles.
Physical analysis (particle size distribution), and gypsum, lime and organic matter contents are recorded in Table 2. while, chemical analysis such as soil salinity, alkalinity and distribution of soluble cations and anions, (Table 3) were determined according to Richards (1954) and Burt (2004). The representative soil profiles are classified according to USDA (2022), WRB (2022) and the newly suggested Applied Soil Classification System - ASCS (Zayed, 2026).
3. Results and Discussion
The study area is located in the far Northeast of Sinai Peninsula adjacent to the Suez Canal and the Mediterranean Sea with a total area of about 2943.27 Km2. The study area showed five geomorphic units, i.e., sand beach, wet sabkhas, dry sabkhas, sand plain and sand dunes and included 163.51 Km fish bonds, 63.59 Km2 lakes, 59.47 Km2 Suez Canal, 14.66 Km2 urban and 25.96 km2 water body. This region is one of the most areas of the agricultural destination due to the availability of its necessities. Many researchers such as Abu El-Hag (2005), Salem (2011), etc, have already studied this area, but the current study focuses on agriculture investment, as well as the evaluation of global classification systems (USDA&WRB, 2022) against the newly classification Applied Soil Classification System ASCS (Zayed,2026).
Generally, soils appear variables and highly complex surface due to topographic relief and material composition, which shows acting of the bedrock and the unconsolidated materials. So, geomorphology reflects the relationship between landforms and the underlying rocks (Sparks, 1969). During visual interpretations of remote sensed data and field study which reveal the following geomorphic units, sand beach (coastal plain), wet sabkhas, dry sabkhas, sand plain and sand dunes (map 2).
1- Soils of sand beach (coastal plain):
Soils of coastal plain are represented by profile 1. These soils are originated by water and wind actions and show almost flat slope, naked soil of native vegetation, while shells are recorded.
Physical and chemical analysis are recorded in Table 2 and Table 3, respectively. Texture class is sand. Where surface has sand texture, while subsurface has loamy sand. Coarse sand appears as a predominant constituent (> 69%). Organic matter contents tend to be extremely low (0.03%) according to Charman and Roper (2007). Gypsum contents vary between 0.2 and 0.47% which related by slightly gypsum contents (FAO, 2006), Lime contents differ widely between 0.8 and 12.62%, subsurface horizon (30-80 Cm) appears strongly calcareous (FAO, 2006). Soil reaction show moderately alkaline class and non-saline class according to S.S.D. Staff (2017). Soluble cations content follow the arrangement: Na+> Ca2+> Mg2+> K+, on the other hand soluble anions follow CI- > SO42 -> HCO3- > CO3-. Exchangeable sodium percentage show non-sodic class except deepest layer appears marginally one (Northcote and Skene, 1972).
Based on, the previous observation and soil characteristics, soils of coastal plain classify as in Table 4.
2 – Soils of wet Sabkhas.
This unit was represented by profile 2 and occupy about 159.6 Km2. This unit appear flat topography, salt crust on the surface and mottles through subsurface layers. This unit consists of marine alluvial deposits. Data in Table 2 show clay texture class, low organic matter content which increase with depth, gypsum contents tend to be slightly class and so lime content. Chemical composition in Table 3 shows neutral reaction class, strongly saline, distribution of soluble cations Follows: Na+ > Ca2+ > Mg2+ > K+ except in surface layer Mg2+>Ca2+, while distribution of anions follows CI- > SO4-2 > HCO3- > CO3-2. On the other hand, soil sodicity appears strongly sodic class. Soils of wet sabkhas classify as in Table 5.
3 - Soils of dry Sabkhas.
Dry sabkhas soils occupy an area of about 532.46 Km2. Soils of dry sabkhas are represented by profiles 3,4,5 and 6, which have flat topography except soil of profile 5 appear almost flat one and cover. Soils of profiles 3 and 6 are characterized by mottles while, soils of profile 5 have feature of gypsum crystals. Particle size distributions tend to be clayey in the surface layer of profiles 3 and 6. As general trend, the courser decreased with depth except the deepest layer of profile 4. Organic matter contents differ from 0.1 to 1.2% and tend to decrease with depth. The lowest value of organic matter content recorded in profile 5 which has coarser texture. Gypsum contents differ from 0.7 to 8.1% and decrease with depth. Calcium carbonate contents ranged between 1.8 and 6.5% and increased with depth, except deep layers of profile 5. Soil reaction ranged from neutral to moderately alkaline. Soil salinity showed wide range between non-saline and strongly saline.
Soluble cations follow the arrangement: Na+ > Mg2+ > Ca2+ > K+ except in profile 5. Soluble anions show tow clusters CI- > SO42- > HCO3- > CO3-2 in profiles 4 and arrangement SO4-2 > CI- > HCO3- > CO3-2 in profiles 3, 5 and 6. Soil sodicity tends to be strongly sodic. According to previous review may be classify the representative profile as follows in Table 6.
4 - Soil of sand plain.
Soil of sand plain was represented by profiles 7,8 and 9 and include 453.36 Km2 area. These soils have slope class between almost flat and very gently sloping. Upper two layers of profile 9 have few veins gypsum crystals and thread (Table 1). Physical and chemical properties in Table 2 and Table 3 show that texture tends to be sandy class except in profile 9 have medium texture in upper three layers and tend to courser with depth. Organic matter content appears as extremely low. Gypsum contents differ from slightly to moderately gypsiric. Lime contents change widely from slightly to strongly calcareous. Soil reaction (pH) ranges between slightly acid and slightly alkaline. Soil salinity (EC) is affected by location of representative profiles and recorded values between non and strongly saline. Soils of profile 7 show cations distribution as: Na+ > Ca2+ > Mg2+ > K+, while, other layers and profiles haven’t specific trend. Anions distribution appear trend: CI- > SO42- > HCO3- > CO3-2. Exchangeable sodium percentage in soil profile 7 and 8 show strongly sodic class, while in profile 10 are between marginally and strongly sodic. Data of field description, physical and chemical reveal to soil classification as done in Table 7.
5 - Soils of sand dunes
Soils of sand dunes consider the largest unit in the study area and occupy about 1460.44 Km2 and represented by soil profile 10, which has gently undulating topography. This unit has sand texture class, single grain loose structure. Organic matter contents show extremely low. These soils have slightly gypsiric and calcareous (Table 2). Chemical composition in Table 3 appeared that soil pH recorded slightly alkaline class, soil EC showed non-saline class and marginally sodic class. According to these givens, the soil classified as in Table 8.
Finally, the comparison data of soil classification in tables 4 to 8), reveal to ASCS, Zayed (2026) cover all requirements of global soil classification systems such as USDA (2022) and WRB (2022) as well as soil genesis, development, etc. Otherwise, it was distinguished by determining the levels of characteristics and showing the contrast between them which related to soil management.
Practical application contributes to highlighting the positive aspects of the various classification systems used, in comparing them. The current study, on El- Tina plain East Port Said City, appeared the advantages of USDA such as mineralogical class. While, the advantages of WRB was predominant soil anion, surface crust and the extent of development. Undoubtedly the new soil classification system (ASCS) focuses on the soil characteristics associated with land management, its actual levels and its stratification, as well as soil genesis, development and all diagnostic horizons if observed or determined, soil environment and agriculture determinants, which shows the importance of applying the new system (ASCS, 2026).
4. Conclusion
Assessment of the ASCS compared to global systems USDA and WRB, a pedological study emphasized on North-West Sinai region (El- Tina plain) which have five physiographic units, i.e., sand beach, wet sabkha, dry sabkha, sand plain and sand dunes. Total area is 2943.27 km2 which includes urban, fish bonds, lakes, and water body. The current study concluded that Applied Soil Classification System (ASCS) covered most of the requirements of global systems as well as showing levels and its stratification of soil characteristics of importance in the applied aspects and land management and showing the agricultural determinants.
References
- Abu El-Hag, G.T. Pedological studies on coastal plain soils, Sinai. Ph. D. Thesis, Zagazig Univ., Banha, Egypt, 2005. [Google Scholar]
- ASCS; Zayed. Applied Soil Classification System. In Printing in Arab Republic of Egypt by the agricultural Printing Press; Zayed, A. Μ. A., Ed.; International Numbering, 2026; ISBN 978-977-95-6562-0. [Google Scholar]
- Ashmawy, M. H.; Sweden, A. H.; Fattah, Abdel. Flash flood Hazards of drainage basins of Sinai Peninsula, Egypt. Ann. Geol. Surv. Egypt 2000, V.XXIII, PP. 467–489. [Google Scholar]
- Burt, R. (Ed.) Soil Survey Laboratory Method’s Manual, Soil Survey investigation Report, 42, Ver. 4.0; USDA, NRCS: Washington, D.C., 2004. [Google Scholar]
- Charman, P. E. V.; Roper, M. M. Soil Organic matter. In Soil-Their Properties and management, 3 rd ed.; Charman, P. E. V., Murphy, B. W., Eds.; Oxford University Press: Melbourne, 2007; pp. 276–285. [Google Scholar]
- Dobos, E.; Norman, B.; Bruee, W.; Luca, M.; Chris, J.; Erika, M. The use of DEM and satellite images for regional scale soil database. In Proceedings of the 17th World Congress of Soil Science, Bangkok, Thailand, 14–21 August 2002; 2002. [Google Scholar]
- El Behairy, R. A. Using New Techniques for Studying Land Resources in Some Areas of Northwest Nile Delta, Egypt. Master’s Thesis, Faculty of Agriculture, Tanta University, Cairo, Egypt, 2021. [Google Scholar]
- Elwan, A. A.; A. A.; Harga, H.; El-Kadi, S.; El-Demerdashe. Preliminary Studies on the soils of north Sinai Peninsula based on aerial photo-interpretation Egypt. J. Soil Sci. 1983, 23, 37-42-. [Google Scholar]
- ERDAS “Earth Recourses Data Analysis System “, Inc. 2022, ERDAS Imagine version 2022. ERDAS, Inc.: Atlanta, Georgia, USA.
- FAO. Guidelines for soil description, 4th ed.; Room Food and Agriculture Organization of the United Nations, 2006. [Google Scholar]
- NASA. (2024). National Aeronautics and Space Administration. Shuttle Radar Topography Mission. Shuttle Radar Topography Mission. Retrieved 10 July 2024 from https://earthexplorer.usgs.gov https:// Science Nasa gov (2025).
- Northcote, K. H.; Skene, J. K. M. 1972. Australian Soils with Saline and Sodic Properties. CSIRO Australian, Soil Publication No. 27: Canberra. [Google Scholar]
- Richards, L. Diagnosis and improvement of Saline and Alkali Soils; USDA Handback: Washington, USA, 1954; Vol. 60 print. office. [Google Scholar]
- Said, R. (1990). The Geology of Egypt. Published for the Egyptian General Petroleum Corporation, Conoco Hurghada Inc. and Repsol Exploration, S.A by Balkema, A.A. Rotterdam Brookfield, The Netherlands.
- Said, M. E. S.; Ali, A. M.; Borin, M.; Abd-Elmabod, S. K.; Aldosari, A. A.; Khalil, M. M. N.; Abdel-Fattah, M. K. On the use of multivariate analysis and land evaluation for potential agricultural development of the Northwestern Coast of Egypt. Agronomy 2020, 10, 1318. [Google Scholar] [CrossRef]
- Salem, A. D. Pedological studies on North Sinai using Merging Data Technique with emphasis on the coastal Belt. Ph. D. Thesis, Fac. of Agric. Benha Univ., Egypt, 2011. [Google Scholar]
- Soil Science Division Staff (2017). Soil Survey Manual. C. Ditzler, K. Scheffe, and H.C. Monge (eds.). USDA Handbook 18. Government Printing Office, Washington. D.C.
- Sparks, B.W. Geomorphology, Ninth impression; Longmans, Green and CO LTD: London and Harlow, 1969. [Google Scholar]
- USDA. Keys to Soil Taxonomy, 13th ed.; Natural Resources. Conservation Service: Washington, D.C., USA, 2022. [Google Scholar]
- Walter, P. H. (1950). Die vegetation der erde in Okologischer Betrachung.veb Gustuv.Fisherverlagzena. (C.f. Climatology and Microclimatology. Dezerd zee Vesku, B. L. 1958).
- WRB. International Soil Classification System for naming soils and creating legend for Soil Map, 4th ed.; International Union of Soil Sciences (IVSS): Vienna, Austria, 2022. [Google Scholar]
Figure 1.
Xerothermic diagram of Port Said area (2010 – 2024).
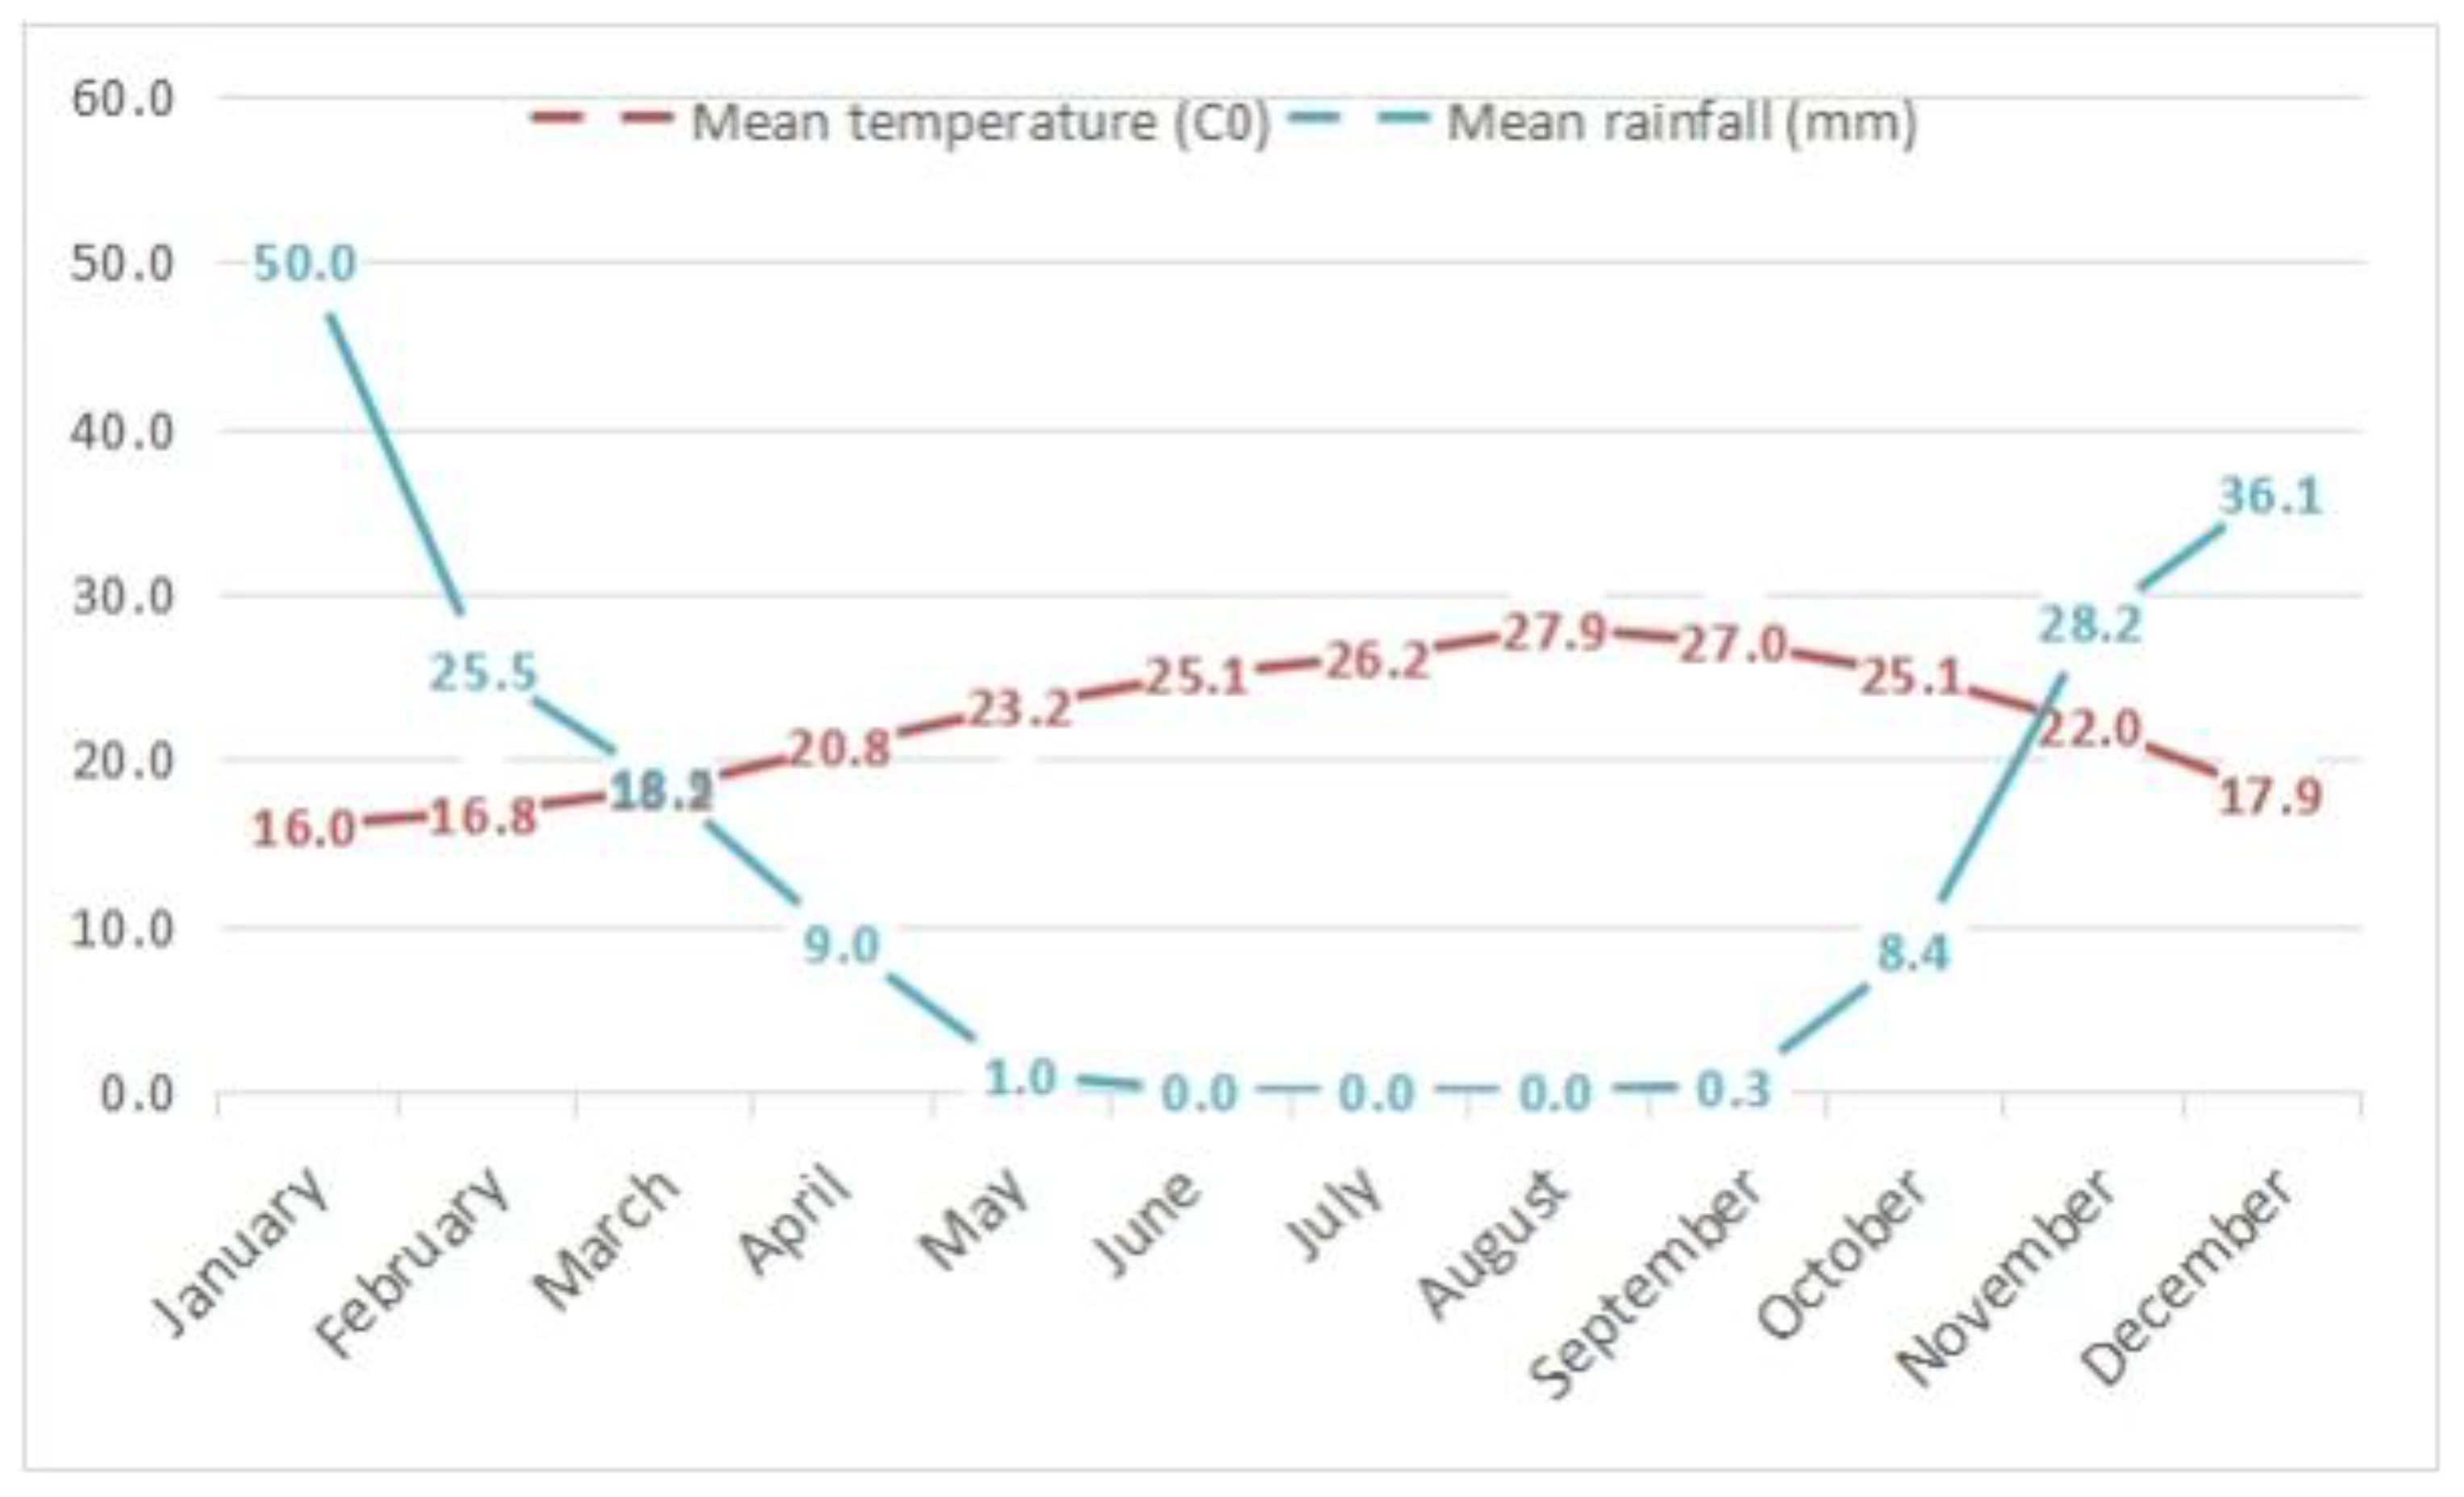

Table 1.
Field description of representative soil profiles.
| Physiographic unit |
Profile No. |
Location | Slope | Vegetation (Crop) |
Depth )Cm.( |
Color | Texture | Structure | Remarks | Boundary | |||||
| Coastal Plain (Sand Beach) (Shore line) |
1 | X: 446661.1 Y: 3449431.2 |
Almost Flat |
Bare soil | 0 - 30 | 10YR 7/6, dry 10YR 6/6, moist |
Sand |
Single grains, loose | Clear smooth | ||||||
| 30 - 80 | 10YR 5/4, dry 10YR 4/4, moist |
Loamy sand |
Massive | Few shells | Clear smooth | ||||||||||
| 80 - 150 | 10YR 5/4, dry 10YR 4/4, moist |
Loamy sand |
Massive | ||||||||||||
| Wet Sabkhas (Marine-alluvial deposits) |
2 | X: 439352.0 Y: 3446983.8 |
Flat | Bare soil | 0 - 20 | 10YR 4/1, dry 10YR 3/1, moist |
Clay | Weak medium subangular blocky |
Salt crusts | Clear smooth | |||||
| 20 - 50 | 10YR 4/1, dry 10YR 3/1, moist |
Clay | Weak medium angular blocky |
Mottles: 2.5 Y 4/0, dry : 2.5 Y 3/0, moist |
Clear smooth | ||||||||||
| 50 – 75 |
10YR 5/1, dry 10YR 4/1, moist |
Clay | Weak medium angular blocky |
Mottles: 2.5 Y 4/0, dry : 2.5 Y 3/0, moist |
|||||||||||
| 75 - | Water table | ||||||||||||||
| Dry Sabkhas | 3 | X: 450861.4 Y: 3431208.0 |
Flat | Bare soil | 0 – 25 | 10YR 5/2, dry 10YR 4/2 moist |
Clay | Weak fine angular blocky |
Mottles: 2.5 Y 4/0, dry : 2.5 Y 3/0, moist Few gypsum threads |
Clear smooth | |||||
| 25 – 90 | 10YR 6/3, dry 10YR 5/3, moist |
Sandy Clay loam | Weak coarse angular blocky |
Mottles: 2.5 Y 4/0, dry : 2.5 Y 3/0, moist |
Diffuse smooth | ||||||||||
| 90 - 125 | 10YR 8/4, dry 10YR 7/4, moist |
Loamy sand |
Single grains, loose | Mottles: 2.5 Y 4/0, dry : 2.5 Y 3/0, moist |
|||||||||||
| 4 |
X: 441468.6 Y: 3428502.6 |
Flat |
Few scattered desert shrubs | 0 - 25 | 10YR 6/2, dry 10YR 5/2, moist |
Sandy clay |
Weak fine angular blocky |
Few gypsum threads | Clear smooth | ||||||
| 25 – 85 | 10YR 6/3, dry 10YR 5/3, moist |
Sandy loam |
Massive | Clear smooth | |||||||||||
| 85 – 130 | 10YR 6/2, dry 10YR 5/2, moist |
Sandy clay loam |
Massive | ||||||||||||
| 5 | X: 446892.6 Y:3420234.4 |
Almost flat |
Few scattered desert shrubs | 0 – 20 | 10YR 8/2, dry 10YR 8/4, moist |
Sandy loam |
Massive | Common veins gypsum crystals and soft segregation | Abrupt irregular | ||||||
| 20 - 35 | 10YR 8/3, dry 10YR 7/6, moist |
loamy sand |
Single grains | Common veins gypsum crystals |
Abrupt irregular | ||||||||||
| 35 - 55 | 7.5YR 8/2, dry 7.5YR5/6, moist |
loamy sand |
Single grains | Few veins gypsum crystals | Abrupt irregular | ||||||||||
| 55 - 100 | 10YR 8/4, dry 10YR 6/8, moist |
loamy sand |
Single grains | Gradual wavy | |||||||||||
| 100 - 120 | 10YR 8/4, dry 10YR 6/8, moist |
Sand | Single grains | ||||||||||||
| Dry Sabkha | 6 | X: 439418.1 Y:3412892.2 |
Almost Flat |
Bare soil | 0 - 22 | 10YR 5/2, dry 10YR 4/2, moist |
Clay | Weak fine angular blocky |
Few gypsum threads | Clear smooth | |||||
| 22 - 80 | 10YR 6/3, dry 10YR 5/3, moist |
Sandy Clay loam |
Weak coarse Angular blocky |
Mottles: 2.5 Y 4/0, dry: 2.5 Y 3/0, moist | Diffuse smooth | ||||||||||
| 80 - 130 | 10YR 8/4, dry 10YR 7/4, moist |
Loamy sand |
Single grins | Mottles: 2.5 Y 4/0, dry: 2.5 Y 3/0, moist | |||||||||||
| Sand plain | 7 | X: 452911.9 Y: 3415736.4 |
Gently sloping |
Date palm | 0 - 30 | 10YR 8/4, dry 10YR 7/6, moist |
Sand | Massive | Gradual smooth | ||||||
| 30 - 80 | 10YR 8/3, dry 10YR 7/4, moist |
Loamy sand | Loose | Gradual smooth | |||||||||||
| 80 - 140 | 10YR 8/4, dry 10YR 7/6, moist |
Loamy sand | Loose | ||||||||||||
| 8 | X: 442593.1 Y: 3397552.9 |
Very gently sloping |
Few desert shrubs and grass | 0 – 15 | 10YR 7/4, dry 10YR 7/6 moist |
Sand | Loose | Diffuse smooth | |||||||
| 15 – 35 | 10YR 7/4, dry 10YR 5/6, moist |
Sand | Loose | Diffuse smooth | |||||||||||
| 35 - 120 | 10YR 8/4, dry 10YR 7/8, moist |
Sand | Loose | ||||||||||||
| 9 |
X: 481817.7 Y: 3431882.7 |
Almost flat |
Fallow land | 0 - 20 | 10YR 8/4, dry 10YR 7/6, moist |
Sandy clay loam | Massive | Few veins gypsum Crystals and threads |
Clear wavy | ||||||
| 20 – 40 | 10YR 5/2, dry 10YR 4/2, moist |
Sandy loam |
Massive | Few veins gypsum Crystals and threads |
Abrupt wavy | ||||||||||
| 40 – 80 | 7.5YR 5/8, dry 7.5YR 5/6, moist |
Sandy loam |
Massive | Abrupt wavy | |||||||||||
| 80 – 120 | 10YR 8/4, dry 10YR 5/6, moist |
Sand | Loose | ||||||||||||
| Sand Dunes | 10 | X: 472954.1 Y: 3408797.7 |
Gently undulating |
Few maturely vegetation | 0 - 35 | 10YR 8/4, dry 10YR 7/6, moist |
Sand | Loose | Diffuse smooth | ||||||
| 35 - 80 | 10YR 8/3, dry 10YR 7/4, moist |
Sand | Loose | Diffuse smooth | |||||||||||
| 80 - 150 | 10YR 8/4, dry 10YR 6/6, moist |
Sand | Loose | ||||||||||||
Table 2.
Physical properties, gypsum, CaCO3, OM contents of the studied area.
| Physiographic units |
Profile No. |
Depth Cm. |
Particle size distribution (%) | Texture | O.M | Gypsum | CaCO3 | |||
|---|---|---|---|---|---|---|---|---|---|---|
| Coarse sand |
Fine sand |
Silt |
Clay |
class | (%) | (%) | (%) | |||
|
Coastal Plain (Sand Beach) |
1 |
0 - 30 30 - 80 80 - 150 |
74.4 71.3 69.6 |
10.00 10.90 13.00 |
12.00 12.50 10.50 |
3.60 5.30 6.90 |
Sand Loamy sand Loamy sand |
0.01 0.03 0.02 |
0.47 0.24 0.20 |
3.55 12.62 0.80 |
| Wet Sabkha | 2 |
0 - 20 20 - 50 50 - 75 |
21.70 7.60 2.74 |
12.00 13.77 13.58 |
20.35 22.64 17.46 |
45.95 55.99 66.22 |
Clay Clay Clay |
0.82 0.97 1.00 |
5.15 3.50 3.82 |
0.77 1.22 0.60 |
|
Dry Sabkha |
3 | 0 –25 | 25.75 | 11.66 | 19.45 | 43.14 | Clay | 1.06 | 8.14 | 1.87 |
|
25 - 90 90 – 125 |
51.34 62.11 |
6.26 22.12 |
10.75 5.35 |
31.65 10.42 |
Sandy clay loam Loamy sand |
0.65 0.73 |
5.80 5.10 |
2.30 2.75 |
||
| 4 | 0-25 | 39.70 | 6.65 | 8.02 | 45.63 | Sandy clay | 1.15 | 7.80 | 2.20 | |
| 25-85 | 67.63 | 7.97 | 11.50 | 12.90 | Sandy loam | 0.60 | 5.20 | 2.60 | ||
| 85-130 | 54.37 | 6.43 | 10.25 | 28.95 | Sandy clay loam | 0.55 | 5.10 | 2.92 | ||
| 5 | 0 - 20 | 63.00 | 10.90 | 15.10 | 11.00 | Sandy loam | 0.20 | 5.12 | 6.33 | |
| 20 - 35 | 69.00 | 17.10 | 7.40 | 6.50 | Loamy sand | 0.20 | 6.41 | 6.58 | ||
| 35 - 55 | 69.00 | 16.10 | 9.20 | 5.70 | Loamy sand | 0.10 | 1.70 | 5.10 | ||
| 55 - 100 | 75.50 | 11.00 | 3.50 | 10.00 | Loamy sand | 0.10 | 0.81 | 5.40 | ||
| 100 - 120 | 77.00 | 16.70 | 2.70 | 3.60 | Sand | 0.08 | 0.78 | 5.36 | ||
| 6 |
0–22 22 - 80 |
26.95 50.89 |
14.00 6.21 |
16.03 12.85 |
43.02 30.05 |
Clay Sandy clay loam |
1.20 0.72 |
8.14 5.85 |
1.84 2.11 |
|
| 80 - 130 | 64.39 | 19.65 | 5.95 | 10.01 | Loamy sand | 0.65 | 5.10 | 2.80 | ||
|
Sand plain |
7 | 0 - 30 | 74.40 | 10.00 | 12.00 | 3.60 | Sand | 0.01 | 0.40 | 3.55 |
| 30 - 80 | 71.30 | 10.90 | 12.50 | 5.30 | Loamy sand | 0.03 | 0.22 | 12.65 | ||
| 80–140 | 69.60 | 13.00 | 10.50 | 6.90 | Loamy sand | 0.02 | 0.22 | 0.85 | ||
| 8 | 0 - 15 | 39.50 | 49.60 | 4.60 | 6.30 | Sand | 0.10 | 0.75 | 4.62 | |
|
15–35 35 – 120 |
50.20 41.80 |
44.30 51.40 |
2.50 3.30 |
3.00 3.50 |
Sand Sand |
0.10 0.10 |
0.52 1.40 |
2.00 1.78 |
||
| 9 | 0 –20 | 26.80 | 37.30 | 13.50 | 22.40 | Sandy clay loam | 0.35 | 6.21 | 2.55 | |
| 20 - 40 | 32.40 | 40.90 | 9.60 | 17.10 | Sandy loam | 0.43 | 5.93 | 1.60 | ||
| 40 - 80 | 46.30 | 17.60 | 17.60 | 18.50 | Sandy loam | 0.20 | 0.45 | 2.10 | ||
| 80–120 | 69.4 | 22.70 | 4.50 | 3.40 | Sand | 0.10 | 0.86 | 0.44 | ||
| Sand dunes | 10 |
0 – 35 35 - 80 80 - 150 |
65.70 48.00 41.30 |
31.6 45.9 52.2 |
1.80 3.70 2.90 |
0.90 2.40 3.60 |
Sand Sand Sand |
0.210.20 0.10 |
0.52 0.30 0.30 |
0.22 1.12 1.55 |
Table 3.
Chemical composition of the studied area in soil paste.
| Physiographic units |
Profile No. |
Depth (Cm.) |
pH | EC | Soluble cations ( meq./ l ) | Soluble anions ( meq./ l ) | ESP | ||||||
|---|---|---|---|---|---|---|---|---|---|---|---|---|---|
| dS.m-1 | Ca +2 | Mg +2 | Na + | K + | CO -2 | HCO3- | Cl – | SO4-2 | |||||
|
Coastal Plain (Sand Beach) |
1 |
0 - 30 30 - 80 80 - 150 |
7.7 8.0 8.2 |
0.43 0.28 0.29 |
1.20 1.00 1.00 |
1.40 0.50 0.20 |
1.60 1.20 1.70 |
0.30 0.20 0.10 |
0.0 0.0 0.0 |
0.4 0.7 0.9 |
2.60 1.60 1.10 |
1.50 0.60 1.00 |
4.20 5.30 8.10 |
| Wet Sabkha | 2 |
0 - 20 20 - 50 50 - 75 |
7.0 7.2 7.3 |
189.6 211.7 240.8 |
178.0 348.0 194.0 |
2305.0 1250.0 1005.0 |
3164.0 2175.0 3250.0 |
126.0 50.0 76.0 |
0.0 0.0 0.0 |
2.1 2.4 2.5 |
3450.0 2856.9 3530.9 |
2320.9 963.7 991.6 |
89.1 89.3 122.0 |
|
Dry Sabkha |
3 | 0 –25 | 7.2 | 156.8 | 169.0 | 1920.0 | 2180.0 | 45.0 | 0.0 | 2.0 | 2000.0 | 2312.0 | 63.3 |
|
25 - 90 90 – 125 |
7.7 7.5 |
127.5 115.6 |
190.0 168.0 |
2110.0 2150.0 |
3340.0 3360.0 |
67.0 76.0 |
0.0 0.0 |
3.1 3.2 |
2750.0 2500.0 |
2953.9 3250.8 |
96.5 92.7 |
||
| 4 | 0-25 | 7.4 | 142.4 | 255.0 | 1990.0 | 3630.0 | 64.0 | 0.0 | 1.5 | 4045.0 | 1892.5 | 102.9 | |
| 25-85 | 7.7 | 116.5 | 194.0 | 1965.0 | 3740.0 | 47.0 | 0.0 | 2.0 | 3980.0 | 1964.0 | 113.5 | ||
| 85-130 | 7.4 | 124.9 | 185.0 | 2060.0 | 3830.0 | 49.0 | 0.0 | 0.7 | 3900.0 | 2223.3 | 106.1 | ||
| 5 | 0 - 20 | 6.7 | 135.9 | 672.0 | 260.0 | 1275.0 | 70.9 | 0.0 | 2.2 | 2011.0 | 264.7 | 24.8 | |
| 20 - 35 | 6.6 | 157.5 | 819.0 | 103.0 | 1790.0 | 41.2 | 0.0 | 2.0 | 2113.0 | 638.2 | 17.1 | ||
| 35 - 55 | 7.7 | 17.14 | 134.0 | 75.10 | 10.60.0 | 3.20 | 0.0 | 2.7 | 113.4 | 106.8 | 12.9 | ||
| 55 - 100 | 8.0 | 5.00 | 16.50 | 12.50 | 10.20 | 1.70 | 0.0 | 1.1 | 36.0 | 19.10 | 21.8 | ||
| 100 - 120 | 8.1 | 2.81 | 9.50 | 8.40 | 7.60 | 0.80 | 0.0 | 0.5 | 25.2 | 0.60 | 22.7 | ||
| 6 |
0–22 22 - 80 |
7.2 7.6 |
132.6 93.5 |
165.4 180.0 |
1920.0 2000.0 |
2092.8 3110.0 |
35.1 30.0 |
0.0 0.0 |
2.2 3.0 |
1900.0 2600.0 |
2248.1 2717.0 |
24.8 33.9 |
|
| 80 - 130 | 7.6 | 88.5 | 160.6 | 2430.0 | 3300.0 | 25.1 | 0.0 | 3.3 | 3000.0 | 2912.4 | 30.6 | ||
|
Sand plain |
7 | 0 - 30 | 7.8 | 1.10 | 3.10 | 2.10 | 5.10 | 0.60 | 0.0 | 0.4 | 7.20 | 3.30 | 21.6 |
| 30 - 80 | 7.6 | 0.70 | 2.20 | 1.40 | 3.40 | 0.40 | 0.0 | 0.3 | 4.90 | 2.20 | 20.7 | ||
| 80–140 | 7.5 | 1.20 | 3.50 | 3.40 | 4.60 | 0.50 | 0.0 | 0.3 | 9.00 | 2.70 | 24.0 | ||
| 8 | 0 - 15 | 7.3 | 0.81 | 2.20 | 2.50 | 2.70 | 0.30 | 0.0 | 1.4 | 4.50 | 1.80 | 26.0 | |
|
15–35 35 – 120 |
7.2 7.3 |
1.72 1.21 |
4.40 3.30 |
6.00 2.50 |
5.80 5.90 |
0.30 0.10 |
0.0 0.0 |
1.5 0.9 |
11.30 8.20 |
3.70 2.70 |
30.4 20.6 |
||
| 9 | 0 –20 | 6.6 | 29.86 | 74.3 | 132.0 | 130.0 | 2.10 | 0.0 | 2.0 | 316.0 | 20.40 | 10.5 | |
| 20 - 40 | 6.7 | 15.82 | 71.0 | 66.5 | 34.90 | 1.60 | 0.0 | 2.1 | 165.2 | 6.70 | 15.2 | ||
| 40 - 80 | 6.8 | 12.33 | 41.2 | 58.0 | 31.50 | 1.20 | 0.0 | 0.5 | 125.5 | 5.90 | 11.6 | ||
| 80–120 | 6.5 | 3.92 | 14.1 | 11.3 | 10.60 | 0.60 | 0.0 | 1.3 | 31.9 | 3.40 | 13.0 | ||
| Sand dunes | 10 |
0 –35 35 - 80 80 - 150 |
7.5 7.7 7.5 |
0.46 0.76 1.19 |
1.80 2.30 3.80 |
2.10 1.30 3.30 |
1.40 3.30 4.80 |
0.90 0.51 0.52 |
0.0 0.0 0.0 |
0.5 0.3 0.2 |
3.00 4.90 9.50 |
2.70 2.21 2.72 |
4.10 6.40 7.20 |
Table 4.
Comparison between USDA, WRB and New Soil Classification System (ASCS) of sand beach.
| Profile No. | USDA (2022) |
WRB (2022) | ASCS (2026) | ||||
| 1 | Typic Torripsaments, siliceous, thermic |
Tidalic |
Arenosols | (Aridic) | Aridic, Thermic, Nearly level, Deep, No drainage, Sandy, Slightly gypsiric, Moderately/ strongly calcareous. | Psammsols | Slightly water erosion, Extremely low organic matter, slightly/ moderately alkaline, Non-saline, Non-sodic. |
| Advantages | Mineralogy class. | Tidal effect |
surface slope, root restricting depth, presence of drainage, gypsum and lime contents, water erosion effect, organic matter content, salinity and alkalinity levels. | ||||
Table 5.
Comparison between USDA, WRB and New Soil Classification System (ASCS) of wet sabkhas.
| Profile No. | USDA (2022) |
WRB (2022) | ASCS (2026) | ||||
| 2 | Typic Aquisalids, clayey, smectitic, thermic | sodic Gleyic | Solonchaks |
)Clayic, chloridic, Evapocrustic, Hypersalic, Ochric, aridic(. | Aridic, Thermic, Salic, Flat, Moderately deep, No, Drainage, Clayey Slightly gypsiric, Slightly calcareous. | Aquasols | Very low organic matter, Neutral, strongly saline, strongly sodic. |
| Advantages | Mineralogy class. | Dominant anion is soluble salts, presence of salt crusts on surface. | Surface slope, root restricting depth, presence drainage, gypsum and lime, levels and soil reaction. | ||||
Table 6.
Comparison between USDA, WRB and New Soil Classification System (ASCS) of dry sabkhas.
| Profile No. | USDA (2022) |
WRB (2022) | ASCS (2026) | ||||
| 3 | Gypsic Aquisalids loamy, mixed, thermic. |
Gleyic Sodic Gypsic Fluvic |
Solonchaks | (Clayic/ loamic, Sulfatic, Evapocrustic, Drainic, Ocric, Hypersalic Aridic, Vertic). |
Aridic, Thermic, Salic/Gypsic, Flat, Deep, Surface drainage, Clayey / loam, Moderately Gypsiric, Moderately calcareous. | Aquasols | Very low organic matter, slightly alkaline, Strongly saline, Strongly sodic. |
| 4 | Gypsic Haplosalids, coarse loamy, mixed, thermic. | Sodic Gypsic Fluvic | Solonchaks | (Clayic/loamic, Chloridic, Evapocrustic, Ochric, Hypersalic, Aridic). |
Aridic, Thermic, Gypsic, Flat, Deep, No-drainage Clayey/Loamy, Moderately gypsiric, Moderately calcareous. | Salsols | Very low organic matter, slightly alkaline, Strongly saline, Strongly salic. |
| 5 | Gypsic Haplosalids, sandy, mixed, thermic. | Sodic Gypsic Fluvic | Solonchaks | (Loamic/Arenic, Evapocrustic, Hypersalic, Aridic). |
Aridic, Thermic, Gypsic, Very gently sloping, No-drainage, Loamy/Sandy, Moderately /slightly gypsiric, Moderately calcareous. | Salsols | Extremely low organic matter, Neutral /Moderately alkaline, Strongly Saline, Strongly Sodic. |
| 6 | Gypsic, Aquisalids, Fine loamy over sandy, Mixed, Thermic. |
Gleyic Sodic Gypsic Fluvic | Solonchaks | (Clayic/loamic/Arenic, Sulfatic, Evapocrustic, Ochric, Hypersalic, Aridic). |
Aridic, Thermic, Salic/Gypsic, Very gently sloping, Deep, No-drainage, Clayey/loamy, Moderately gypsiric, Moderately Calcareous. | Aquasols | Very low organic matter, Slightly alkaline, Strongly Saline, Strongly Sodic. |
| Advantages | mineralogy class | Predominant soluble anion, salt crust on surface | Show the effect of mottles, Surface slope, profile depth, presence of drainage, Contents of gypsum, lime and organic matter, salinity and alkalinity levels, stratification of different characters. | ||||
Table 7.
Comparison between USDA, WRD and New Soil Classification System ( ASCS) of sand plain.
| Profile No. | USDA (2022) |
WRB (2022) | ASCS (2026) | ||||
| 7 | Typic Torripsamments, siliceous, thermic. | Protic | Arenosols | (Aridic). | Aridic, Thermic, Gently sloping, Deep, No-drainage, Sandy, Slightly gypsiric, Slightly calcareous. | Psammsols | Extremely low matter, Slightly alkaline, Non-saline, Non-Sodic. |
| 8 | Typic Torripsamments, Siliceous, thermic. | Protic | Arenosols | (Aridic). | Aridic, Thermic, Very gently sloping, Deep, No-drainage, Sandy, Slightly gypsiric, Slightly calcareous. | Psammsols | Extremely low organic matter, Neutral, Non-saline, Non-sodic. |
| 9 | Typic Haplogypsids coarse loamy over sand, mixed, thermic. | Gypsic | Solonchaks | (Loamic/Arenic, Chloridic, Aridic). |
Aridic, Thermic, Gypsic, Very gently sloping, Deep, No-drainage, Loamy/ sandy, Moderately/ slightly gypsiric, Slightly calcareous. | Salsols | Extremely low organic matter, Neutral, Strongly/ moderately saline, Marginally/ Non-sodic. |
| Advantages | Soil mineralogy class. | - The extent of development. -Predominant soluble anion. |
Surface slope, profile depth, presence of drainage, contents of gypsum, lime and organic matter, salinity and alkalinity levels, stratification of different characters. | ||||
Table 8.
Comparison between USDA, WRD and New Soil Classification System (ASCS) of sand dunes.
| Profile No. | USDA (2022) |
WRB (2022) | ASCS (2026) | ||||
| 10 | Typic Torripsamments, siliceous, thermic. |
Protic | Arenosols | (Aeolian, Aridic). |
Aridic, Thermic, Gently sloping, Deep, No drainage, Sandy, Slightly gypsiric, Slightly calcareous. | Psammsols | Extremely low organic matter, slightly alkaline, Non-Saline, Non-Sodic. |
| Advantages | Demonstrated the previous notes of Sand Plain. | ||||||
Disclaimer/Publisher’s Note: The statements, opinions and data contained in all publications are solely those of the individual author(s) and contributor(s) and not of MDPI and/or the editor(s). MDPI and/or the editor(s) disclaim responsibility for any injury to people or property resulting from any ideas, methods, instructions or products referred to in the content. |
© 2026 by the authors. Licensee MDPI, Basel, Switzerland. This article is an open access article distributed under the terms and conditions of the Creative Commons Attribution (CC BY) license (http://creativecommons.org/licenses/by/4.0/).
Copyright: This open access article is published under a Creative Commons CC BY 4.0 license, which permit the free download, distribution, and reuse, provided that the author and preprint are cited in any reuse.