

Submitted:
03 October 2026
Posted:
07 October 2026
You are already at the latest version
Abstract
Coal fly ash and bottom ash are by-products of lignite combustion in the thermal power plant REK Bitola in North Macedonia, representing a significant environmental challenge as well as a promising secondary resource. This study presents a comprehensive quantitative and qualitative analysis of these ashes, focusing on their physicochemical characteristics and potential for the recovery of critical and strategic raw materials, including rare earth elements. The chemical composition reveals that the ashes are silicate- rich (≈50 %) with lower alumina levels of about 19-20 %, and solid amounts of ferric oxide (12-15 %). Regarding qualitative and economic recovery potential, the biggest promise lies in gallium (30-35 mg kg−1), and side-streams of manganese (1100-5038 mg kg−1), cerium (147-153 mg kg−1) and an REE mixed concentrate. On the quantitative side, the in-place ash inventory at the REK Bitola landfill was estimated using a Digital Elevation Model-based screening workflow in Google Earth Engine. The geometric volume was estimated at 106.8 million m3 and should be considered a Tier-1 screening estimate. The resulting quantitative and qualitative properties are particularly relevant for key stakeholders, including the research community, industry actors, and potential investors, as they highlight the potential for sustainable recovery of valuable and rare metals from this secondary raw material.
Keywords:
coal FA
; bottom ash
; REEs
; critical materials
; strategic materials
1. Introduction
Coal combustion for electricity generation has historically been one of the main pillars of global energy systems. Despite the accelerating transition toward renewable energy technologies, coal-fired thermal power plants continue to supply a substantial share of electricity. A direct consequence of this process is the generation of coal combustion products (CCPs), with coal fly ash (FA) constituting the largest fraction [1]. FA is collected from flue gasses by electrostatic precipitators or bag filters and consists mainly of fine glassy aluminosilicate spheres containing SiO2, Al2O3, Fe2 O 3 and varying CaO contents, depending on the origin of the coal and the combustion conditions [2]. CCPs are a well explored waste stream in literature, as the ashes contain many of the metals on the CRM list, which is why it is sometimes even considered hazardous waste [3]. Metals contained in the coal mostly end up in the ashes due to the absence of volatile matter [4]. Additionally, many coal ashes contain naturally occurring radionuclides, which are radioactive materials and present an additional hazard [5,6]. Untreated ashes can be considered corrosive waste because they release leachate in highly acidic or highly basic environments, allowing elements with weaker bonds to enter soil, surface and ground water [7]. Moreover, their small particle size enables easy distribution throughout the ecosystem, when stored outdoors. [8]. For that reason coal use has begun to decline in parts of Europe and North America as well as their decarbonization policies and climate commitments under the Paris Agreement. However coal combustion remains dominant in several developing and rapidly industrializing regions, ensuring the presence of CCPs. Therefore, The European Union Waste Framework Directive and similar policies in other jurisdictions encourage valorization pathways that minimize landfill disposal and promote life-cycle optimization. At the same time, stricter environmental controls require systematic monitoring of trace elements such as As, Hg and Se. Furthermore, the European Union (EU) has identified Critical Raw Materials (CRMs) and Strategic Raw Materials (SRMs) (Table 1) [9], as essential non-energy, non-agricultural resources that face significant supply risks due to the global concentration of production in specific third countries. CRMs are materials with high economic importance for the EU and a high vulnerability in supply-chain distributions, while SRMs are a subset of these that are even more crucial because they are directly linked to key technologies driving the green and digital transitions set for 2030 and 2050, as well as defense and aerospace applications [10]. Rising global demand, competition, and environmental concerns associated with traditional extraction methods have increased the need for the EU set targets in discovering new reserves and resources for these materials. Naturally, countries within the continent aiming to be part of the EU, such as the Republic of North Macedonia (NMK), have also agreed to follow these targets and stand to gain from EU investment while increasing trade and boosting their economies with a high and rising value product. NMK remains structurally dependent on lignite-fired thermal power plants, while decades of lignite and coal combustion at the largest thermal power plant REK Bitola have resulted in significant FA deposition in engineered and semi-engineered landfills. Active production alongside large historical deposits offer a strategic window for integrated valorization planning. If so, having knowledge of the quantity of material is also necessary. Especially when working with CCPs where even if concentration indicates a smaller quantity of target metals, the total amount available might still make extraction viable. Currently for REK Bitola, the yearly production volume can be estimated, but due to the different activities of the thermal plant over the years, the quantities are not certain. Therefore, an indicator confirming such numbers is imperative, including fluctuations in production capacity due to maintenance cycles, usage of coal from different mines, overhauls and changing energy demands as well as quantities used in the cement industry over the years. Therefore, the aim of this study is to provide a comprehensive and reliable preliminary assessment of the accumulated FA deposit by estimating its internal volume and determining its current chemical composition, especially its metals and their economic potential for future stakeholders. This potential is supported by Šajn et al. (2024) [11], who identified North Macedonia as one of the most promising countries in Southeast Europe for recovering valuable elements from secondary deposits.
2. Materials and Methods
This investigation focuses on coal FA produced by the thermoelectric plant at REK Bitola, located on the periphery of the Pelagonian Basin, 12 km east of the city of Bitola and about 15 km north of the Greek border (Figure 1a). For the quantitative study, FA was used from the landfill at the REK Bitola (North Macedonia) thermal power plant, located immediately adjacent to the plant was used (Figure 1b).
For the qualitative study, to enable better comparison, three ash samples were collected: FA1, a fresh FA sample from the reactor; FA2, a historical sample; and BA, bottom ash. All samples were taken using the “quartering method”, air dried for 24 hours, and sieved through a laboratory sieve of 0,125 mm diameter.
2.1. Ash-Deposit Inventory Estimation from DEM (Tier-1 Screening in Google Earth Engine)
The volume of the ash deposit was estimated using a first-order, DEM-based workflow implemented in Google Earth Engine (GEE). This approach reconstructs an approximate pre-deposit ground surface beneath the deposit by fitting a planar baseline to nearby “background” terrain, derives a deposit thickness grid from DEM differencing, and integrates thickness over the mapped deposit footprint to obtain volume. The method is designed for rapid screening and transparent uncertainty reporting.
2.1.1. Elevation Data and Spatial Setup
Topography is represented by the Copernicus DEM GLO-30 product, analyzed at a fixed 30 m working resolution to ensure consistent areal weighting during integration [12]. A region of interest (ROI) is used for visual inspection and contextual DEM statistics, while all volume calculations are performed strictly within the deposit footprint polygon. Hillshade layers are generated only for quality control and interpretation.
2.1.2. Deposit Footprint and Baseline Definition
Two analyst-defined polygon inputs are required:
- the deposit footprint, delineating the planimetric extent of ash deposition (integration domain), and
- the baseline ground patches, digitized on adjacent, representative terrain outside the deposit.
Baseline patches are selected to reflect the pre-deposit ground level and slope, avoiding obvious breaklines, steep scarps, drainage channels, and areas likely affected by deposition or excavation.
2.1.3. Baseline Surface Model (Planar Regression)
A planar baseline surface is fitted by least squares linear regression using DEM elevations sampled across the baseline ground patches. Let z(x,y) be the DEM elevation at map coordinates (x,y). The baseline is modeled as:
where (xc,yc) is the centroid of the deposit footprint used to center coordinates for numerical stability, and a, b, and c are regression coefficients estimated from the baseline patches. This planar approximation captures the local regional slope and elevation trend surrounding the deposit and serves as an estimate of the pre-deposit ground surface beneath the footprint.
2.1.4. Thickness Grid from DEM Differencing
A raw thickness field is computed by terrain differencing
To represent deposit material only, the workflow enforces a non-negativity constraint and clips the result to the deposit footprint:
where denotes the deposit footprint. This prevents negative residuals (e.g., from local baseline overestimation or DEM noise) from contributing artificial negative volumes.
2.1.5. Volume Integration and Descriptive Thickness Metrics
Deposit volume is obtained by integrating thickness over the footprint:
where hi is the thickness value in pixel i and A is the pixel area. The footprint area A is computed from the polygon geometry, and mean thickness is reported as . To support screening interpretation and comparison between deposits, thickness distribution descriptors are extracted from h within , including maximum thickness and selected percentiles (median, 90th and 95th percentiles).
2.1.6. Baseline Fit Quality Control and Uncertainty
Baseline adequacy is evaluated on the baseline patches via residuals:
which are summarized by the root-mean-square error:
For Tier-1 screening uncertainty, the RMSE is treated as a characteristic thickness error and translated to an indicative volume uncertainty using:
where A is the deposit footprint area.
Where tonnage is required, volume is converted to mass using bulk density (from literature):
If an uncertainty on density is available, a screening-level combined uncertainty on mass can be reported using standard propagation:
The uncertainty estimated as Formula 7 represents only the influence of the baseline-fit residual error on the calculated volume. It does not include potential systematic uncertainty associated with the planar approximation of the pre-deposit ground surface, delineation of the deposit footprint, the 30 m DEM resolution, long-term settlement, spatial variations in compaction, or the moisture condition of the deposited ash. In particular, if the reconstructed baseline lies below the actual pre-deposit ground surface, the DEM-differencing workflow may overestimate ash thickness and, consequently, the total deposit volume. The DEM workflow estimates the external geometric volume of the deposit but does not independently determine the dry mass, in-situ bulk density or water content of the material. Therefore, conversion of the estimated volume into tonnage requires field measurements of ash thickness, moisture content and dry bulk density. Until such measurements are available, the estimated in-place quantity should be used only as a Tier-1 scale-defining input for preliminary recovery, processing, economic and logistical assessments.
2.2. Chemical Composition
The chemical composition of the investigated ash samples was performed by XRF (Benchtop XRF Analyzer manufactured by Oxford Instruments, specifically the X-MET8000 series handheld XRF analyzer with HERO™) and inductively coupled plasma mass spectrometry (ICP-MS). Loss of ignition (LOI) was determined on a dried sample heated for two hours at 900 °C.
The FA samples were analyzed by ultratrace ICP-MS in the accredited laboratory of Bureau Veritas Commodities Canada Ltd. (Vancouver, Canada) after total digestion using a four-acid (HNO3, HClO4, HF and HCl) digestion method (Multi Acid – ultratrace ICP-MS, Method MA250). Precision was assessed by calculating the relative differences between pairs of analytical determinations of the same samples. Trueness and precision of the two data sets were also evaluated by calculating precision and performing a t-test, using two certified reference materials of soil, OREAS 45H and OREAS 501D. It was concluded that there are no significant differences between the certified and obtained data. Further, the obtained values are compared to Clarke’s values (Cv). Cv for coal ashes describes the average content of a given chemical element in the coal ash [13], which will be used as initial indicators for the metal extraction potential.
2.3. Economic Potential Assessment
The results from the chemical composition, volume and mass assessment will be subjected to an evaluation of their economic potential taking into account economic cut off-grades as well as current metal prices as well as their demand and supply in the EU. Since most of the evaluated metals in this study are CRMs and aren’t produced in the EU, there is no official metal exchange market within the EU that governs their prices. Therefore, the benchmark market prices are taken from the official Shanghai Metal Exchange, unless stated otherwise, which govern prices of metals to be sold from China. Depending on availability and accessibility to prices, In-warehouse 1, Free-on-board (FOB) 2, Ex-works 3 and Cost-Insurance-Fright (CIF) Rotterdam port 4 prices will be presented. Additionally, for REEs, two preliminary coefficients developed by Seredin, V.V. [14] and Seredin, V.V., Dai, S. (2012) [15] will be used to determine composition (Outlook Coefficient ()) and grade, respectively, to determine the potential of the REE mixture.
3. Results and Discussion
3.1. Case-Study Application to the REK Bitola Ash Landfill (Tier-1 Inventory Outputs)
The Tier-1 DEM differencing workflow (Section 2.1) was applied to the REK Bitola ash landfill by:
- delineating the ash-deposit footprint to define the integration domain and
- selecting representative reference-terrain patches adjacent to, but outside, the deposit to characterize the pre-deposit ground trend.
A planar baseline surface was fitted to the reference terrain. The ash thickness field was computed as the positive elevation difference between the DEM and the fitted baseline within the footprint, and thickness was integrated over the footprint area to obtain the total in-place volume. Baseline fit quality was quantified using the root-mean-square error (RMSE) of residuals on the reference terrain (Section 2.1.6). The delineated landfill footprint () used for the Tier-1 volume integration is shown in Figure 2.
Table 2 summarizes the derived Tier-1 inventory metrics for REK Bitola. The mapped footprint covers 191.05 ha, yielding an estimated in-place volume of . Thickness statistics show a mean thickness of 55.91 m, a median of 59.76 m, and upper-tail thicknesses of 67.22 m (P90) and 72.25 m (P95), with a maximum thickness of 78.24 m. The baseline-fit RMSE is 2.66 m, which corresponds to a screening-level volume uncertainty of:
As an external order-of-magnitude comparison, rather than a validation, the DEM-derived landfill volume was compared with a mass estimate based on reported average fly-ash production at REK Bitola. Fidanchevski et al. [5] reported approximately 1.5 Mt yr−1 of FA production, of which about 0.12 Mt yr−1 was redirected to the cement industry, implying approximately 1.38 Mt yr−1 of net accumulation under comparable operating conditions. Assuming that these average values were representative of approximately 44 years of operation from 1982 to 2025, the calculated cumulative net mass would be approximately 60.7 Mt. Converting this mass using the literature bulk-density ranges adopted in this study gives illustrative volume ranges of approximately 70.6–112.4 million m3 for the lower-density scenario and 40.5–54.2 million m3 for the higher-density scenario. However, dividing the estimated cumulative mass of 60.7 Mt by the DEM-derived volume of 106.8 million m3 gives an implied average bulk density of approximately 0.57 t m−3. This value is close to the lower bound of the loose-density range and is unlikely to represent the entire landfill after approximately 44 years of progressive deposition, self-weight consolidation, exposure to precipitation and variable moisture conditions. Therefore, the apparent agreement between the DEM estimate and the lower-density scenario should not be interpreted as confirmations of the DEM-derived volume. Instead, the low implied density indicates a discrepancy between the production-based mass estimate and the DEM-based geometric estimate. One possible explanation is that the Tier-1 DEM workflow overestimates the actual field volume. Such overestimation may occur if the fitted planar baseline lies below the original pre-deposit ground surface, if the mapped footprint includes marginal areas containing little or no ash, or if the 30 m DEM resolution smooths the deposit boundaries and surrounding terrain. The production-based estimate is also uncertain because it assumes constant annual ash production and constant diversion to the cement industry throughout the entire operating period. In reality, electricity generation, coal consumption, ash production, plant outages, maintenance periods and ash utilization are likely to have varied over time. Consequently, neither the DEM-derived volume nor the production-based mass estimate can currently be considered field validated. Measurements of in-situ dry bulk density, moisture content and deposit thickness are required to determine the actual ash inventory and to assess whether the DEM model overestimates the field volume. The resulting density-based sensitivity ranges are summarized in Table 3.
It’s worth to mention that assessment field validation of deposit thickness, in-situ moisture content and dry bulk density were not considered, however the Tier-1 outputs provide sufficient information for a technology-screening assessment.
3.2. Chemical Composition of Ash
3.2.1. Main Chemical Composition
The results from the analysis of the chemical composition of the main elements (Si, Al, Fe, Mg, Ca, K, Ti, Mn, P and S) expressed as oxides and the LOI are presented in Figure 3.
The general chemical composition of the investigated ashes shows that all are rich in silicate, with concentrations approaching 50 %. This consistently high silica content suggests a strong contribution from silicate-derived mineral phases such as quartz, feldspars, and amorphous aluminosilicate glass. The behavior of Al2O3 distinguishes the FA samples (FA1 and FA2) from bottom ash (BA). Both FA samples have similar alumina levels (about 19–20 %), while BA contains slightly lower values (≈ 16–17 %). Aluminum and silicon are considered among the critical materials, and technologies [16,17] for extracting them from FA are already established. The proportions of SiO2 and Al2O3 play a critical role in determining the reactivity, microstructure, and performance of cementitious [18], ceramic or glass-ceramic [19], and alkali activated materials [20], evaluative for further use of the ash.
In contrast, Fe2O3 concentrations increase progressively from FA1 to BA. BA contains the highest iron oxide content (≈15 %), implying enrichment in iron-bearing minerals, possibly including magnetite, hematite, or unburned ferrous phases. This trend is consistent with the coarser and denser nature of bottom ash materials, which tend to retain heavier iron-rich particles during combustion. Because a significant portion of iron in coal combustion residues occur as magnetite and hematite, these particles can be efficiently concentrated using dry [21], or wet magnetic separation [22].
Mid-range oxides provide further insight into the chemical variability among the samples. MgO levels remain relatively uniform across all three materials, indicating that the magnesium-bearing minerals were present in comparable amounts in the parent material. Taheri and Larachi (2025) [23] describe pyrometallurgical, hydrometallurgical, and electrometallurgical processes for extracting magnesium from mineral based resources. Since magnesium is listed among the critical metals, one of these methods could be applied to extract magnesium from FA. CaO, however, shows a distinct elevation in FA2, reaching values near 8 %, compared to FA1 and BA. This elevated calcium content may be associated with a higher carbonate fraction in the coal used for FA2. CaO and K2O levels (≈7.3–2.5 %) exhibit limited variation among samples, suggesting consistent contributions from Ca and K-bearing silicates such as feldspars, which are also on the list of critical raw materials. The highest contents of LOI in the BA (14.78 %) is associated with the presence of unburnt coal in the ash.
3.3. Potentially Toxic and Other Elements
Potentially toxic and other elements can be described as easily leachable from FA [24], and the extraction process depends on the form in which they are found in the ash. They can be in the form of oxides, sulphides or chlorides, but alumosilicate substances can act as carriers in FA [25], making them suitable for leaching.
As shown in Table 4, several elements in the FA have values above Cv’s, warranting attention and focus on their potential extraction. The most promising elements are Mn, As, Th, Nb and Ga which are enriched in both FA1 and FA2, ensuring presence in the pond as well as continuous supply. Additionally, elements with values near and slightly above the Cv’s or only strong in the FA1 sample include Zn, Pb, Ta and Cr. Further, all metals identified with higher values in both FA1 and FA2 are classified as CRMs and SRM, other than Th. The rest of the metals have somewhat low values and are not CRMs or SMRs, so they will be excluded from the economic potential assessment. What’s more Nb is listed into EU’s CRM list but not in its SRM list, alluding to the conclusion that it’s importance is low to development at the moment and will also be excluded from economic potential assessment.
Manganese is the only element for which bottom ash shows significantly higher values than Cv’s value, as well as higher values than those found in FA1 and FA2, indicating a strong continuous presence of this element. This is consistent with other research demonstrating the rich manganese soil of the Balkans, with many historic mining sites of the metal [26,27,28,29]. The manganese-rich soil of the Balkans is related to the region’s volcanic activity, making it the second most manganese abundant area in the world, after the Kalahari Field in Africa [30]. This is significant because it implies that no matter where in the Balkans the coal is sourced from, manganese supply will likely be consistent in the FA, as the FA1, FA2 and BA values already prove. That being said, manganese isn’t a rare element in the Earth’s crust and it ranks 12th in abundance metrics. Its price per ton reflects that abundance, ranking among the lowest fetching prices between the metals shown in Table 5.
Further, the percentage of Mn in the sellable product affects the price. Mn is rarely sold pure because in nature it does not exist as a standalone metal [31]. When used in the steel industry, which amounts for 80-90% for global Mn-use, it only requires Mn content a bit above 30% [31]. This insinuates that a process such as flotation should be employed if manganese extraction is considered, where the price will amount to that of the Mn slags at 4.16 €/mtu, which is a very low price-per-mass among metals. Therefore, its extraction can only be beneficial if it’s a by-product of extracting a more valuable metal. However, the price significantly rises if it’s in the form of pure Mn, used in the battery industry. Currently, about 30 % of Mn-based research funding goes in this sector [32]. When looking at the market, a 92-fold increase in demand is expected from 2020 until 2040, which equates to 0.1 million tonnes of Mn, specifically due to solar powered devices [31]. Sokolova I. et al. (2025) [31] found that by 2030 the market will require 39.3 million tonnes suggesting that high purity Mn could be deficient on the market, hindering the Green Transition.
Co-extraction with other metals of value should seriously be considered in this case.
Arsenic volatiles on lower temperatures compared to other metals, and is almost always caught by the FA [33], which is also conclusive from Table 4. The metal was included in the CRM list in 2023, reflecting its increasing demand [9]. It was measured that in the period between 2016 and 2020 the EU had brought in 500 tons/year, mostly from China [34], to address the annual consumption valued at 1260 tons/year [35]. However, unlike other CRM entries, arsenic demand as well as price rises slightly each year [36] rather than substantially like gallium, even though they are both used to form GaAs semiconductors, deemed vital for EU’s Green Energy. Newer substitute technologies keep appearing but none are at the level to replace arsenic in its electronic role [36].
Taking that into account, the fact that As is present 4 times more than the average Cv value in the historic pond as seen from FA2, and its supply will continue with FA1 also having higher values (Table 4), is not good news, environmentally or economically. In fact, the EU has placed many restrictions on the use of toxic metalloids, governed by the European Chemical Agency (ECHA) and REACH (Registration, Evaluation, Authorization and Restriction of Chemicals) regulation, but especially on As since many studies confirmed solid, air and water pollution as well as carcinogenic after effects [33,37], pushing for As substitution. Moreover, these regulations require the As be stripped before FA disposal. This means that price surge or fail will not affect supply. So even if prices for As (Table 5) far exceed those of Mn, As is a much bigger extraction liability. Another thing to note, is that the supply chain for arsenic in the EU is better than for other metals since Belgium produces about 60 % of the demand, while the Netherlands is a substantial refiner as well as consumer [36]. A thing to consider is that for its previous uses an industrial grade arsenic oxide was utilized, but in the electronic and medical industry a very high purity As is required, which renders extraction from a secondary high-volume source like FA especially uneconomical.
That being said, As’s toxicity and sheer reserves found in the FA2 pond require either neutralization or stripping. The presence of As will hinder other metal extraction and it also gets in the way of ash reuse in the cement industry, by retarding the cement’s hydration process [38]. Evidence suggests As found in FA is in the form of As(V) sorbed to oxides [39]. About 92–97 % of total arsenic present as As(V) is usually hosted by the glassy phase, iron oxides or is bonded to calcium oxide [39,40]. Since REK Bitola’s FA is classified as an F type and has very low Ca, it can be concluded that As should mostly be associated with the iron oxide fraction. That also means that by extracting the iron oxide fraction most of As would also be removed from the FA. The removal of iron oxides, which takes up 13.48 wt % in FA2, would also lessen the amount of ash to be treated, and therefore enriching other valuable metals.
As seen from Table 4, gallium values are almost equivalent to Cv’s in all 3 samples, with the highest found in FA1, ensuring new supply. The fact that it can be found in all samples in similar concentrations proves that Ga is tightly bound to the matrix of the ashes. It is well known that and both function as hosts for Ga in the form of isomorphs [41]. Considering its lithophilic and refractory behavior as well as its chemical similarity to Al cations, Ga can substitute Al in the alumosilicate matrix, placing Ga mostly trapped in the alumosilicate glassy phase [42]. What’s more, at temperatures set at 100-1200 °C the amount of Ga going into the glassy mullite and quartz phases can be quantified to 95% Ga accumulation [42], making Ga expensive to separate. However, the price of Ga is a big indicator of Ga’s economic value.
According to Table 5, Ga is the material with the highest price per kilogram by far among the candidates to be extracted. Not only that but two studies, two years apart state a vastly different Ga cut-off grade – Rudnik E., (2024) [42] found a cut-off grade of 100 ppm for Ga extraction from CCP products, while a newer study by Zhang Q. (2026) [41] suggests that the industrial cut off already at 30 ppm. The reason is the EU’s near 100 % dependency on China’s exports of Ga [43], which has had tariffs and controls placed on them since 1st August 2023 [42], making any notable reserves outside China impossible. This also explains the high pricing making it on average 5 times more expensive to get Ga in the EU then for domestic buyers [44]. Currently the difference is at an all-time high reaching an 8 times (Table 7) larger pricing value. Pricing forecasts predict scenarios with a maximum of 3500 €/kg and a minimum of 1200 €/kg by 2030 [44].
Furthermore, Ga demand is continuing to rise, especially within the EU due to its use in strategic products such as semiconductors for photovoltaics, power amplifiers for communications, electro-optical and power systems in robotics and drones and integrated circuits in electronics [45]. It is estimated that demand will have risen by 200 % by 2025 in comparison to 2010, due to the electronics sector alone [46]. This makes crude Ga a promising economic candidate for REK Bitola’s FA.
3.3.1. Rare Earth Elements
In coal rare earth elements (REEs) can occur as accessory minerals, resistate minerals, clay minerals and authentic minerals [47]. It is usually helpful to classify REEs as either belonging to the light REEs group (LREEs), which includes Sc, Y, La, Ce, Pr and Nd, and the heavy REEs (HREEs) which includes Pm, Sm, Eu, Gd, Tb, Dy, Ho, Er, Tm, Yb and Lu, divided by their atomic number [47]. They can also be classified by host mineral, generally dividing among monazite, a phosphate mineral with a complex composition [(Ce, La, Nd, Th)PO4]; xenotime, often occurring as a byproduct of monazite; zircon (ZrSiO4), both of which are abundant in coal FA; allanite; apatite; and minerals of the alunite group. Rare compounds such as water bearing REY 5 phosphates, including those of the churchite and rhabdophane groups can also be found. Rarest of all are some REE bearing oxides, carbonates or fluorocarbonates. [48] The volatilization temperatures of these carrier minerals are much higher than the operating temperatures in a thermal plant, which is why they remain in the FA. The expected content of REEs is 200-1220 ppm in FA, but most are encapsulated in an alumosilicate glassy phase, resulting in hindered solubilization during acid leaching [49].
The contents of REEs in both FA and BA samples from REK Bitola are presented in Table 6 along with the corresponding Cv.
The results presented in Table 6 for the REE contents in both FA samples and BA show that they are generally lower than the Cv vales. The only exception is the higher content of Ce in the two FA samples, as well as La, making them extraction candidates. It should be emphasized that these two elements reflect the distribution of all REEs and that their increased content results from their higher concentration in the soils of the Pelagonia region, where the coal mines in REK Bitola are located [50,51]. Further, the contents of almost all REEs are higher in the FA samples than in BA, which is expected due to the additional treatment of the resulting ash in coal combustion boilers [52].
Cerium’s price reaches these heights due to its growing importance in catalysts, indispensable for EU’s Green Transition, whilst it also has a use in aerospace, information, communication and digital technologies in permanent magnet production [34]. In computed scenarios for 2030 its yearly demand for the EU is estimated between 8.62 and 12.24 tons per annum [53]. Of these the EU can currently produce none and is reliant 69% on China import. Therefore, this metal is worth looking into for extraction and depending on which it can be sold in different forms (Table 7). That being said, REEs are notoriously hard to separate, especially Ce and La which are very closely related [54]. This makes separation very costly. There is the option to remove them together as Ce-La or as an REE mix with the price shown in Table 7, but that downgrades revenue by a factor of .
If the thought of extracting La separately is entertained, similarly to Ce, it is also mostly used as a catalyst (petroleum refining facilities that require massive quantities for fluid catalytic cracking, manufacture ceramic capacitors and high-end optics [55]) and its mostly acquired from China (80%) [34]. As Table 7 suggests, although La metal prices are similar to those of Ce, its other forms are much cheaper than Ce’s. That coupled with Ce’s larger quantity makes Ce’s extraction take priority. Furthermore, although all REEs are both CRMs and SRMs, HREEs are much more valuable than LREEs [11]. By extracting the most prominent of the LREEs in the form and price shown in Table 7, the factor of enrichment for HREEs will increase making it plausible to sell off the REE mix left. Having said that, the LREE fraction is heavier that the HREE fraction, where only Eu and Er of the HREE’s fraction obtained values close to their Cv values. Further, there is an option of extracting the REEs from the ash and selling them as a mix with both LREEs and HREEs included, with pricing shown in Table 7. To ascertain which route to take, the preliminary coefficients can help determine if the current mix of REEs has economic value or some treatment (other than separation from the ash) needs to be done. Results are given in Table 8.

Table 7.
Indicative market prices of REE products by chemical form and point of sale.
| Group | Product / source | Purity [%] | Price [€/mtu] |
|---|---|---|---|
| Cerium | Ce metal, in-works China | 99.99 | 3344.56 |
| Ce2(CO3)3, ex-works China | 99.99 | 1620.63 | |
| CeO2, FOB China | 99.99 | 1731.38 | |
| CeO2, CIF Rotterdam | 99.99 | 2405.46 | |
| Lanthanum | La metal, FOB China | 99.99 | 2632.45 |
| LaCl3, ex-works China | 99.99 | 352.31 | |
| La2O3, FOB China | 99.99 | 908.84 | |
| La–Ce | La–Ce carbonates, ex-works | 99.99 | 243.76 |
| La–Ce chlorides, ex-works | 99.99 | 204.07 | |
| REE mix | REE carbonate mix, in-works | REO 42 | 6677.77 |
| Nd2O3 ≥15 | |||
| Eu2O3 ≥18 | |||
| Pr6O11 ≥5 | |||
| CeO2 ≥48 | |||
| REE chlorinated mix, in-works | REO ≥45 | 7199.29 |
Prices assessed on 28 August 2026, except cerium (26 August 2026).
Table 8.
REE mix metrics and its assessment of economic potential
| Metric (ash basis) | FA1 | FA2 | BA |
|---|---|---|---|
| Total REO | 468 ppm (0.047%) | 446 ppm (0.045%) | 354 ppm (0.035%) |
| REY (element) | 389 ppm | 370 ppm | 294 ppm |
| Outlook coeff. | 0.73 | 0.75 | 0.66 |
| Critical % of REY | 30% | 31% | 28% |
| Nd+Pr+Dy+Tb share | 83% | 81% | 84% |
| Seredin–Dai verdict | unpromising (grade) |
unpromising (grade) |
unpromising (grade and composition) |
Firstly, all three samples do not pass the suggested cut-off grade of 1000 ppm. However, the sheer amount of ash estimated at 60.7Mt can override this problem. Out of the two factors presented BA fails in both composition and grade aspect and therefore shouldn’t be treated as an REE source. On the other hand, both FA1 and FA2 have a marginally passable composition and distribution () however their grade is still considered unpromising. With critical REY corresponding to 31% and 30% for FA1 and FA2 respectively can still be considered favorable, suggesting that this mix would benefit from a pretreatment step for enrichment. Further, since HREE are main price drivers, the option of extracting Ce (constituting 40% of REE mass) separately can be entertained. Removing Ce would greatly enrich the REE mix in favor of HREEs. To determine the value of the leftover REEs the specifics further testing on the final REE mixture has to be done. It is noteworthy that REEs are co-hosted in the alumosilicate glassy phase alongside gallium [56] and can be extracted as a side stream from its production. This would be the most favorable extraction plan because it performs the enrichment step as a part for the process of extraction for a more valuable metal.
4. Conclusions
An assessment of the total available quantity of material generated by the REK Bitola thermal power plant was conducted. The DEM-based Tier-1 evaluation estimated a geometric ash-deposit volume of 106.8 ± 5.1 million m3, providing a useful preliminary indication of the overall scale of the material potentially available for recovery. Future field measurements of ash thickness, moisture content and in-situ dry bulk density would improve the precision of the estimate and support more detailed processing and recovery assessments.
Chemical characterization of fresh, historical and bottom ash shows a typical silicate-rich composition, with notable enrichment of Fe2O3, and elevated levels of CRMs such as Ga, Mn and As relative to Clarke’s values. These elements, with Ga at the forefront and the rest as side-streams, represent the most promising CRM targets for extraction, supported by economic data and EU supply targets. Although most REEs occur below their respective Cv values, with only Ce and La exceeding the global average, the substantial volume of the ash deposit may still provide meaningful cumulative recovery potential and warrants further investigation. It is worth stating that, although these are the current conclusions, with changing markets and supply chains other materials might also become extraction targets. Future work should focus on selecting suitable extraction technologies and developing a techno-economic and environmental assessments for integrated ash valorization in North Macedonia.
Author Contributions
Conceptualization, B.A.; Methodology, V.A., B.A., M.S.G.; Software, V.A.; Validation, V.A.; Investigation, G.N.; Resources, L.D.; Data curation, M.S.G.; Formal Analysis, B.A; Writing—original draft preparation, L.D., B.A.; Writing—review and editing, B.A., M.S.G. and T.S.; Visualization, V.A., L.D.; Supervision, T.S.; Funding acquisition, B.A.; Project Administration, B.A.; All authors have read and agreed to the published version of the manuscript.
Funding
This research was funded by the Ministry of Education and Science of the Republic of North Macedonia grant number 15-6171/34.
Acknowledgments
The authors are grateful for the financial support by the Ministry of Education and Science of Republic of North Macedonia
Conflicts of Interest
The authors declare no conflicts of interest.
References
- ECOBA. ECOBA Product Information. 2026. (accessed on 01 April 2026).
- Hower, J.; Henke, K.; Dai, S.; Ward, C.; French, D.; Liu, S.; Graham, U. Generation and nature of coal fly ash and bottom ash. In Coal combustion products (CCP’s); Elsevier, 2017; pp. 21–65. [Google Scholar] [CrossRef]
- Deng, B.; Meng, W.; Advincula, P.A.; Eddy, L.; Ucak-Astarlioglu, M.G.; Wyss, K.M.; Chen, W.; Carter, R.A.; Li, G.; Cheng, Y.; et al. Heavy metal removal from coal fly ash for low carbon footprint cement. Commun. Eng. 2023, 2, 13. [Google Scholar] [CrossRef]
- Dodbiba, G.; Fujita, T. Trends in extraction of rare earth elements from coal ashes: A review. Recycling 2023, 8, 17. [Google Scholar] [CrossRef]
- Fidanchevski, E.; Angjusheva, B.; Jovanov, V.; Murtanovski, P.; Vladiceska, L.; Aluloska, N.S.; Nikolic, J.K.; Ipavec, A.; Šter, K.; Mrak, M.; et al. Technical and radiological characterisation of fly ash and bottom ash from thermal power plant. J. Radioanal. Nucl. Chem. 2021, 330, 685–694. [Google Scholar] [CrossRef]
- Zlatanovska, I.; Stafilov, T.; Šajn, R.; Gonovska, B.D.; Dimovska, S.; Janusheski, J.; Memeti, S.; Barandovski, L. Assessment of radiological hazards of soils from the city of Bitola (Macedonia) and its environs. Assess. Radiol. Hazards 2024, 60, 453–470. [Google Scholar] [CrossRef] [PubMed]
- Tang, Q.; Liu, G.; Zhou, C.; Sun, R. Distribution of trace elements in feed coal and combustion residues from two coal-fired power plants at Huainan, Anhui, China. Fuel 2013, 107, 315–322. [Google Scholar] [CrossRef]
- Ruhl, L.; Vengosh, A.; Dwyer, G.S.; Hsu-Kim, H.; Deonarine, A. Environmental impacts of the coal ash spill in Kingston, Tennessee: an 18-month survey. Environ. Sci. Technol. 2010, 44, 9272–9278. [Google Scholar] [CrossRef] [PubMed]
- Grohol, M.; Veeh, C.; GROW, D.; Commission, E. Study on the Critical Raw Materials for the EU, 2023. [CrossRef]
- European Parliament and the Council of the European Union. Regulation (EU) 2024/1252 of the European Parliament and of the Council. 2024. (accessed on 10 December 2025).
- Šajn, R.; Alijagić, J.; Ristović, I. Secondary deposits as a potential REEs source in South-Eastern Europe. Minerals 2024, 14, 120. [Google Scholar] [CrossRef]
- (ESA). Copernicus Digital Elevation Model (DEM) Global 30 m, 2021. (accessed on 20 March 2026).
- Ketris, M.á.; Yudovich, Y.E. Estimations of Clarkes for Carbonaceous biolithes: World averages for trace element contents in black shales and coals. Int. J. Coal Geol. 2009, 78, 135–148. [Google Scholar] [CrossRef]
- Seredin, V. A new method for primary evaluation of the outlook for rare earth element ores. Geol. Ore Depos. 2010, 52, 428–433. [Google Scholar] [CrossRef]
- Seredin, V.V.; Dai, S. Coal deposits as potential alternative sources for lanthanides and yttrium. Int. J. Coal Geol. 2012, 94, 67–93. [Google Scholar] [CrossRef]
- Thamilselvi, J.; Balamurugan, P. Extraction of Alumina from Coal Fly Ash. Int. Res. J. Eng. Technol. 2018, 5, 2677–2681. [Google Scholar]
- Mandal, R.; Mohanta, M. Extraction of alumina from fly ash by pyro-hydro metallurgical routes: a review. Int. J. Sci. Res. Arch. 2024, 11, 740–749. [Google Scholar] [CrossRef]
- Kramar, S.; Žibret, L.; Fidanchevska, E.; Jovanov, V.; Angjusheva, B.; Ducman, V. Use of fly ash and phosphogypsum for the synthesis of belite-sulfoaluminate clinker. Mater. Construcc. 2019, 69, e176–e176. [Google Scholar] [CrossRef]
- Angjusheva, B.; Jovanov, V.; Fidanchevski, E. Conversion of coal fly ash glass into glass-ceramics by controlled thermal treatment. Maced. J. Chem. Chem. Eng. 2021, 40, 307–319. [Google Scholar] [CrossRef]
- Provis, J.L. Alkali-activated materials. Cem. Concr. Res. 2018, 114, 40–48. [Google Scholar] [CrossRef]
- Strzałkowska, E. Morphology, chemical and mineralogical composition of magnetic fraction of coal fly ash. Int. J. Coal Geol. 2021, 240, 103746. [Google Scholar] [CrossRef]
- Valeev, D.; Kunilova, I.; Alpatov, A.; Varnavskaya, A.; Ju, D. Magnetite and carbon extraction from coal fly ash using magnetic separation and flotation methods. Minerals 2019, 9, 320. [Google Scholar] [CrossRef]
- Taheri, B.; Larachi, F. Mineral-Based Magnesium Extraction Technologies: Current and Future Practices. Processes 2025, 13, 2945. [Google Scholar] [CrossRef]
- Okeme, I.C.; Crane, R.A.; Nash, W.M.; Ojonimi, T.I.; Scott, T.B. Characterisation of rare earth elements and toxic heavy metals in coal and coal fly ash. RSC Adv. 2022, 12, 19284–19296. [Google Scholar] [CrossRef] [PubMed]
- Smołka-Danielowska, D. Heavy metals in fly ash from a coal-fired power station in Poland. Pol. J. Environ. Stud. 2006, 15. [Google Scholar]
- Malinova, L.; Petrova, K.; Pavlov, P. Assessment of heavy metal concentrations in soils of Western Balkan Mountains. Bulg. J. Agric. Sci. 2022, 28, 129. [Google Scholar]
- Stuhlberger, C. (Ed.) Mining and Environment in the Western Balkans; UNEP / Environment and Security Initiative (ENVSEC): Vienna; Prepared by Zoï Environment Network on behalf of UNEP Vienna, 2009. [Google Scholar]
- Soulamidis, G.; Stouraiti, C.; Voudouris, P.; Tsikos, H. New Ag-Rich Mn-Zn±Pb Vein Mineralization at the Mavro Xylo Manganese Oxide Deposit, Drama, Greece. Minerals 2024, 14. [Google Scholar] [CrossRef]
- Melfos, V.; Voudouris, P.C. Geological, mineralogical and geochemical aspects for critical and rare metals in Greece. Minerals 2012, 2, 300–317. [Google Scholar] [CrossRef]
- Marchev, P.; Raicheva, R.; Ivanova, R.; Jicha, B.; Peytcheva, I. Age and genesis of the largest Phanerozoic Mn deposits in the Paratethys: Inferences from 40Ar/39Ar and U/Pb ages in NE Bulgaria and NW Turkey. J. Geochem. Explor. 2025, 274, 107764. [Google Scholar] [CrossRef]
- Sokolova, I.; Nwaila, G.T.; Ntunka, M.G.; Klochkov, S.; Michaux, S.; Moscardini, E.; Toro, L.; Ghorbani, Y. From abundant resource to critical commodity: Forecasting manganese supply and assessing its sustainability. Sustain. Mater. Technol. 2025, 44, e01349. [Google Scholar] [CrossRef]
- Market ReportsWorld. Manganese Oxide (MnO) Market - Global Outlook and Forecast 2024-2030. Technical report, Market Reports World, 2024. Accessed: 2024.
- da Silva, E.B.; Li, S.; de Oliveira, L.M.; Gress, J.; Dong, X.; Wilkie, A.C.; Townsend, T.; Ma, L.Q. Metal leachability from coal combustion residuals under different pHs and liquid/solid ratios. J. Hazard. Mater. 2018, 341, 66–74. [Google Scholar] [CrossRef]
- European Commission; Joint Research Centre. Raw Materials Profile. Raw Materials Information System (RMIS), 2026. Available online: https://rmis.jrc.ec.europa.eu/rmp/ (accessed on 30 August 2026).
- van Genuchten, C.M.; Etmannski, T.R.; Reid, M.C.; Breunig, H.M. Upcycling Metal (loid) Contaminants to Produce Critical Raw Materials: The Nexus of Water Treatment and Material Criticality. Environ. Sci. Technol. 2026, 60, 1621–1628. [Google Scholar] [CrossRef]
- SCRREEN Project. Arsenic: Raw Material Factsheet. 2024. SCRREEN2, EU Horizon 2020 (Grant Agreement No. 958211). Available online: https://scrreen.eu/wp-content/uploads/2024/01/SCRREEN2_factsheets_ARSENIC_update2.pdf (accessed on 28 August 2026).
- Fatoki, J.O.; Badmus, J.A. Arsenic as an environmental and human health antagonist: A review of its toxicity and disease initiation. J. Hazard. Mater. Adv. 2022, 5, 100052. [Google Scholar] [CrossRef]
- Chen, Y.; Yuan, Q.; Zhu, Z.; Xu, L.; Sun, Z.; Xue, L.; Wu, K. Immobilization of arsenic wastes and retardation effect on cement hydration: Experimental and molecular dynamic analysis. J. Am. Ceram. Soc. 2025, 108, e20240. [Google Scholar] [CrossRef]
- Garcia, E.; Liu, P.; Sanchez, J.; Lee, S.; Wang, Q.; Wen, Y.; Shivaprakash, S.; Burns, S.; Tang, Y. A survey study on arsenic speciation in coal fly ash and insights into the role of coal combustion conditions. Appl. Geochem. 2024, 170, 106095. [Google Scholar] [CrossRef]
- Dai, M.; Zhou, Y.; Xiao, Q.; Lv, J.; Huang, L.; Xie, X.; Hu, Y.; Tong, X.; Chun, T. Arsenic removal and iron recovery from arsenic-bearing iron ores by calcification-magnetic roasting and magnetic separation process. Materials 2023, 16, 6884. [Google Scholar] [CrossRef]
- Zhang, Q.; Zhu, D.; Li, S.; Pan, J.; Guo, Z.; Yang, C.; Gong, J. Ultrasonic Enhanced Leaching for the Synergistic Extraction of Ga and V from Fly Ash. J. Environ. Chem. Eng. 2026, 124463. [Google Scholar] [CrossRef]
- Rudnik, E. Review on gallium in coal and coal waste materials: Exploring strategies for hydrometallurgical metal recovery. Molecules 2024, 29, 5919. [Google Scholar] [CrossRef]
- European Court of Auditors. Critical Raw Materials for the Energy Transition—Not a Rock-Solid Policy; Special Report 04/2026; European Court of Auditors: Luxembourg, 2026. [Google Scholar]
- GalliumPrice.com. Gallium Market Data: Price Today, History, Forecast, Chart, and Index. 2026. Prices assessed as of March 2026. Available online: https://galliumprice.com/market-data/ (accessed on 25 August 2026).
- Bobba, S.; Carrara, S.; Huisman, J.; Mathieux, F.; Pavel, C.; et al. Critical Raw Materials for Strategic Technologies and Sectors in the EU: A Foresight Study. 2020. [Google Scholar] [CrossRef]
- Yadav, S.; Yadav, J.; Bruckard, W.; Haque, N.; Pramanik, B.K. Gallium and germanium: Comparing demand and supply with consideration of electronic waste as a secondary source. Sep. Purif. Technol. 2026, 138270. [Google Scholar] [CrossRef]
- Ramakrishna, C.; Thenepalli, T.; Nam, S.Y.; Kim, C.; Ahn, J.W. The brief review on coal origin and distribution of rare earth elements in various coal ash samples. Energy Eng. 2018, 27, 61–69. [Google Scholar] [CrossRef]
- Thomas, B.S.; Dimitriadis, P.; Kundu, C.; Vuppaladadiyam, S.S.V.; Raman, R.S.; Bhattacharya, S. Extraction and separation of rare earth elements from coal and coal fly ash: A review on fundamental understanding and on-going engineering advancements. J. Environ. Chem. Eng. 2024, 12, 112769. [Google Scholar] [CrossRef]
- Pan, J.; Hassas, B.V.; Rezaee, M.; Zhou, C.; Pisupati, S.V. Recovery of rare earth elements from coal fly ash through sequential chemical roasting, water leaching, and acid leaching processes. J. Clean. Prod. 2021, 284, 124725. [Google Scholar] [CrossRef]
- Stafilov, T.; Šajn, R. Geochemical Atlas of the Republic of Macedonia; Faculty of Natural Sciences and Mathematics, Ss. Cyril and Methodius University: Skopje, Republic of Macedonia, 2016. [Google Scholar] [CrossRef] [PubMed]
- Stafilov, T.; Šajn, R.; Ahmeti, L. Geochemical Characteristics of Soil of the City of Skopje, Republic of Macedonia. J. Environ. Sci. Health A 2019, 54, 972–987. [Google Scholar] [CrossRef]
- Sager, M.; Wiche, O. Rare earth elements (REE): Origins, dispersion, and environmental implications—A comprehensive review. Environments 2024, 11, 24. [Google Scholar] [CrossRef]
- Ayyildiz, M.Y.; Ölmez, J.A.; Hilgers, C. Probability Assessment of Strategic and Total Rare Earth Element Supply for the EU Under the EU Critical Raw Materials Act. Resources 2026, 15, 1–26. [Google Scholar] [CrossRef]
- Salehi, H.; Maroufi, S.; Khayyam Nekouei, R.; Sahajwalla, V. Solvent extraction systems for selective isolation of light rare earth elements with high selectivity for Sm and La. Rare Met. 2025, 44, 2071–2084. [Google Scholar] [CrossRef]
- Jadhav, S.B.; Malavekar, D.B.; Mohite, R.A.; Shaikh, S.B.; Kadam, K.V.; Pawaskar, P.N.; Kim, J.H.; Lee, N.E. A critical review of lanthanum and lanthanum-based materials: synthesis, applications, and challenges. Rare Met. 2025, 44, 5201–5232. [Google Scholar] [CrossRef]
- Kolker, A.; Scott, C.; Hower, J.C.; Vazquez, J.A.; Lopano, C.L.; Dai, S. Distribution of rare earth elements in coal combustion fly ash, determined by SHRIMP-RG ion microprobe. Int. J. Coal Geol. 2017, 184, 1–10. [Google Scholar] [CrossRef]
| 1 | Available for purchase and delivery within China |
| 2 | The price where the Chinese seller is required to deliver the goods to the shipping vessel at the departure port with costs covered up until that point |
| 3 | The price where the Chinese seller only packages the goods and the rest is covered by the buyer |
| 4 | The price for receiving the ordered goods to the buyers port of choice organized by the Chinese seller, assumed Rotterdam port |
| 5 | Rare Earth Elements including Yttrium |
Figure 1.
Study area and site location (a) Regional setting of the REK Bitola complex in North Macedonia; (b) Local view showing the REK Bitola power plant, the Suvodol open-pit mine, and the ash landfill (red outline), which defines the integration domain () used for the Tier-1 DEM-based inventory.
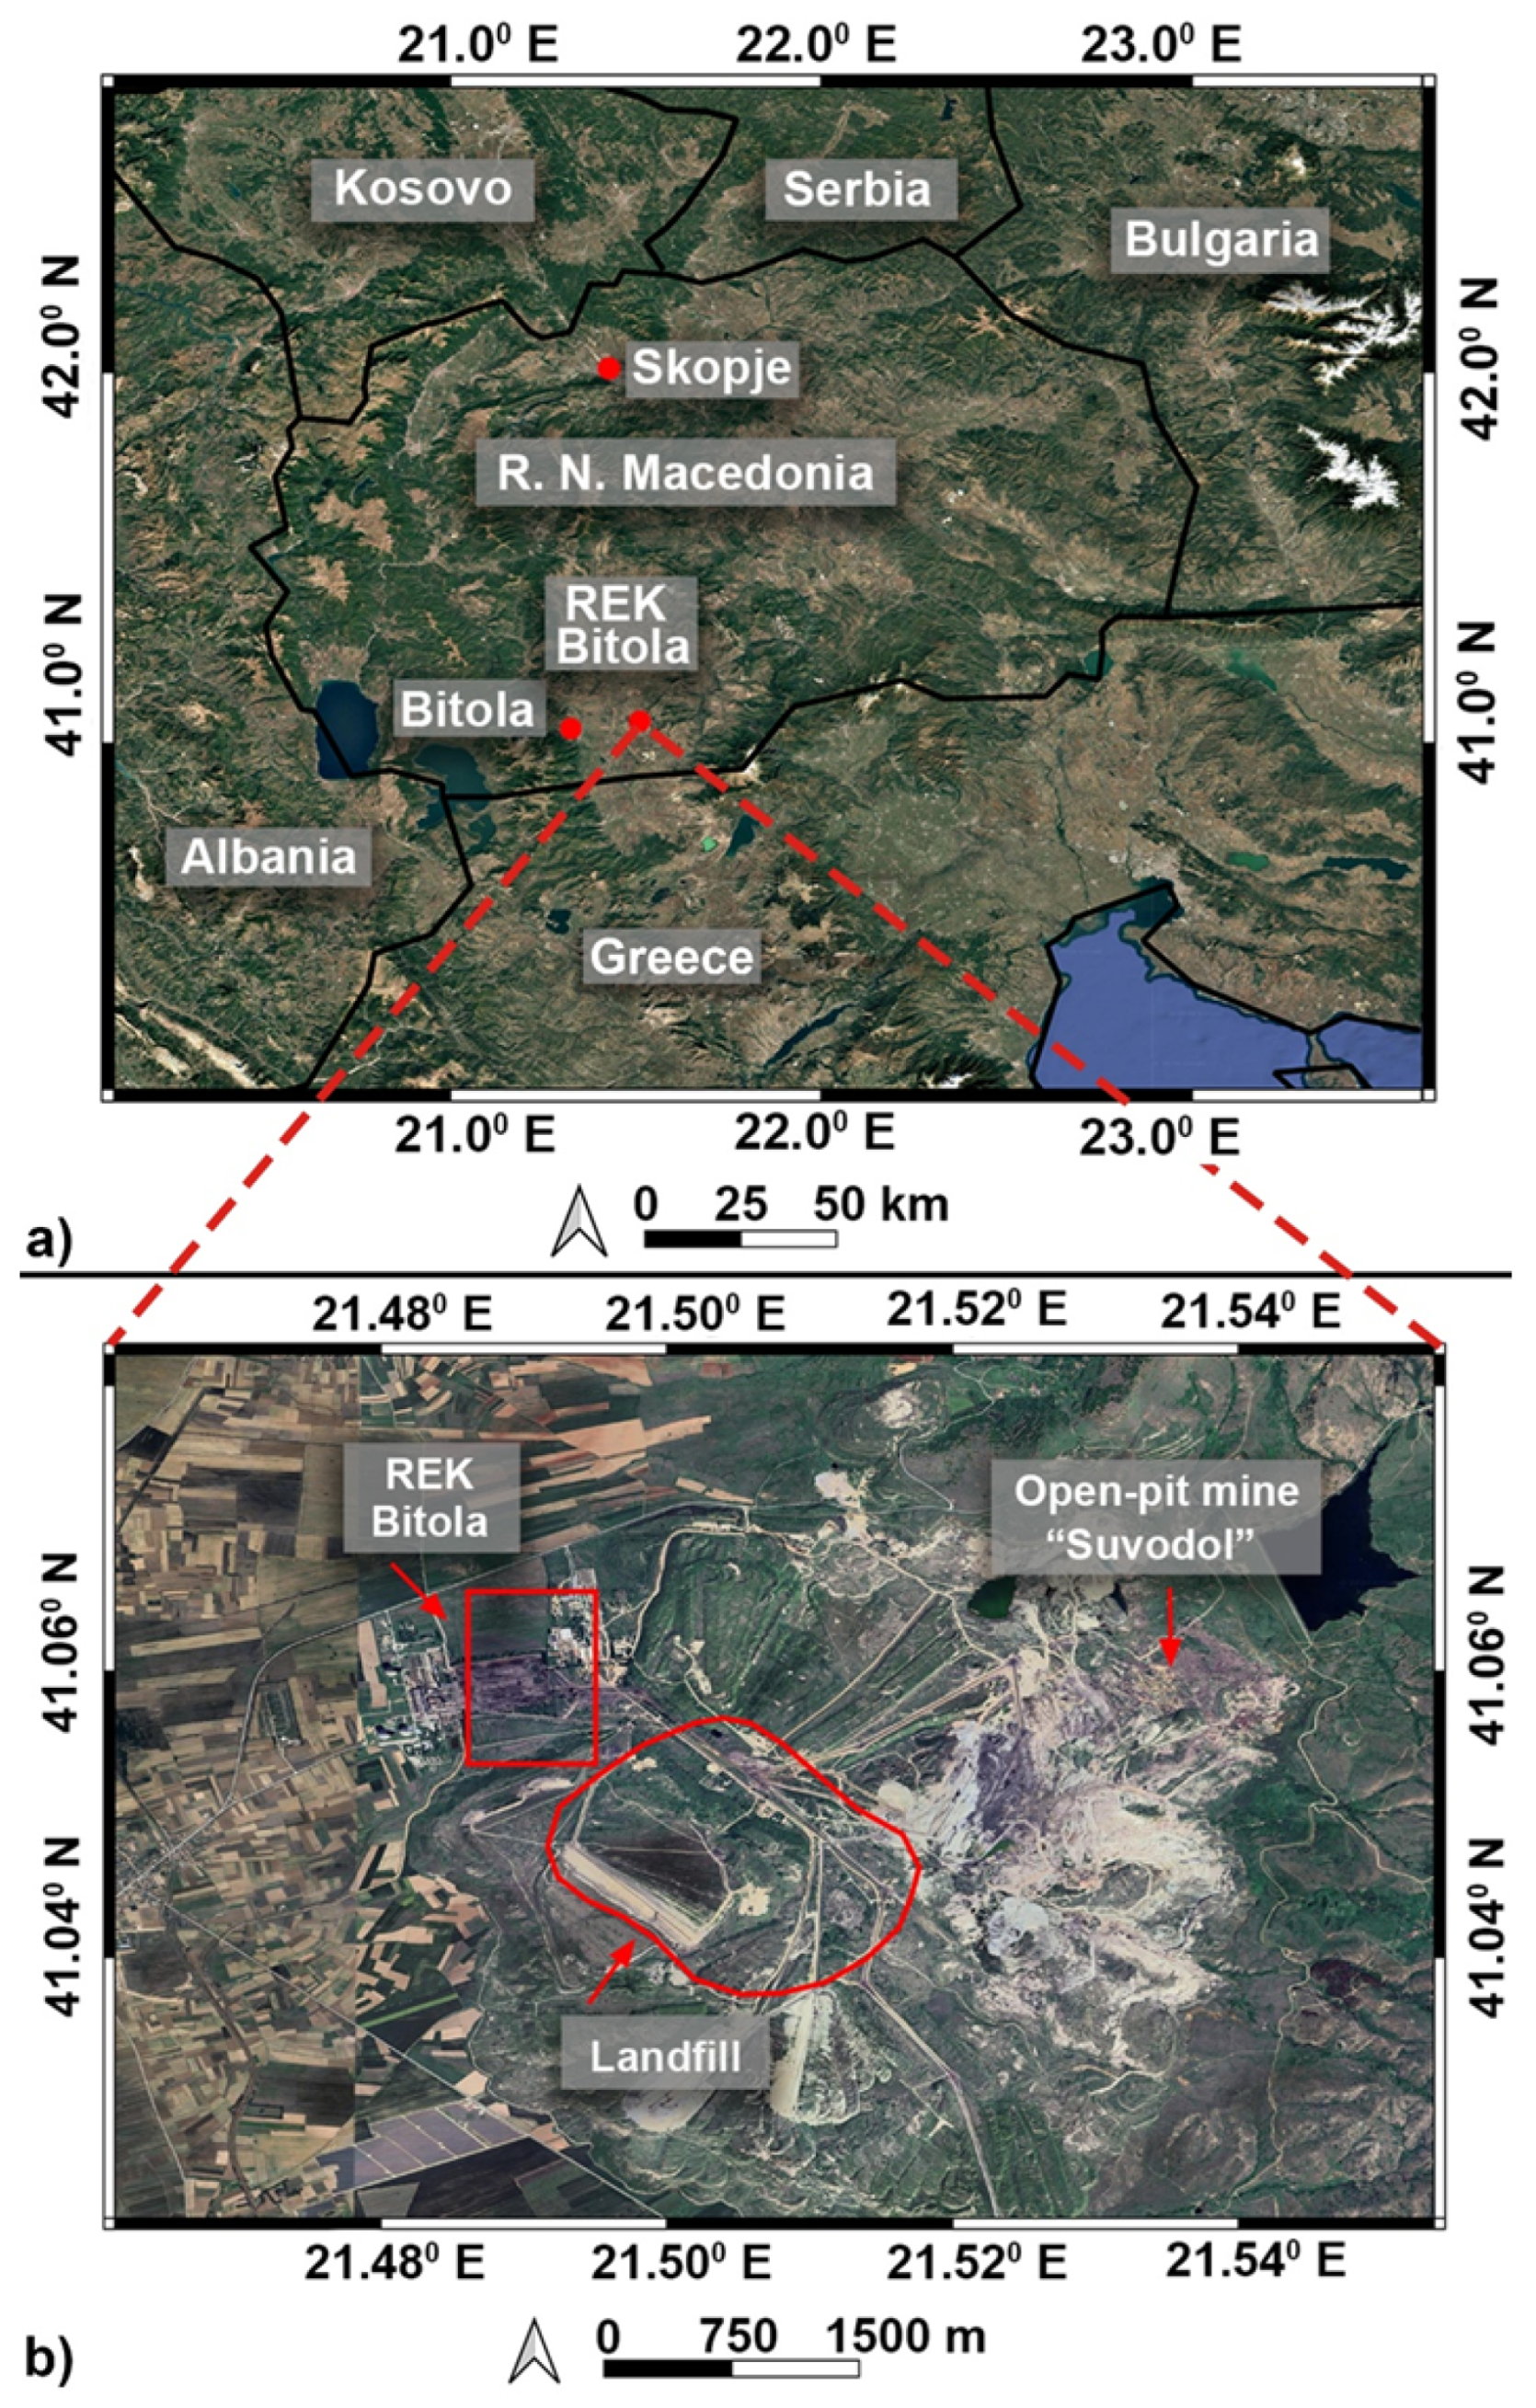
Figure 2.
Delineated REK Bitola ash-landfill footprint () shown on (a) satellite imagery and; (b) Copernicus DEM hillshade
Figure 2.
Delineated REK Bitola ash-landfill footprint () shown on (a) satellite imagery and; (b) Copernicus DEM hillshade
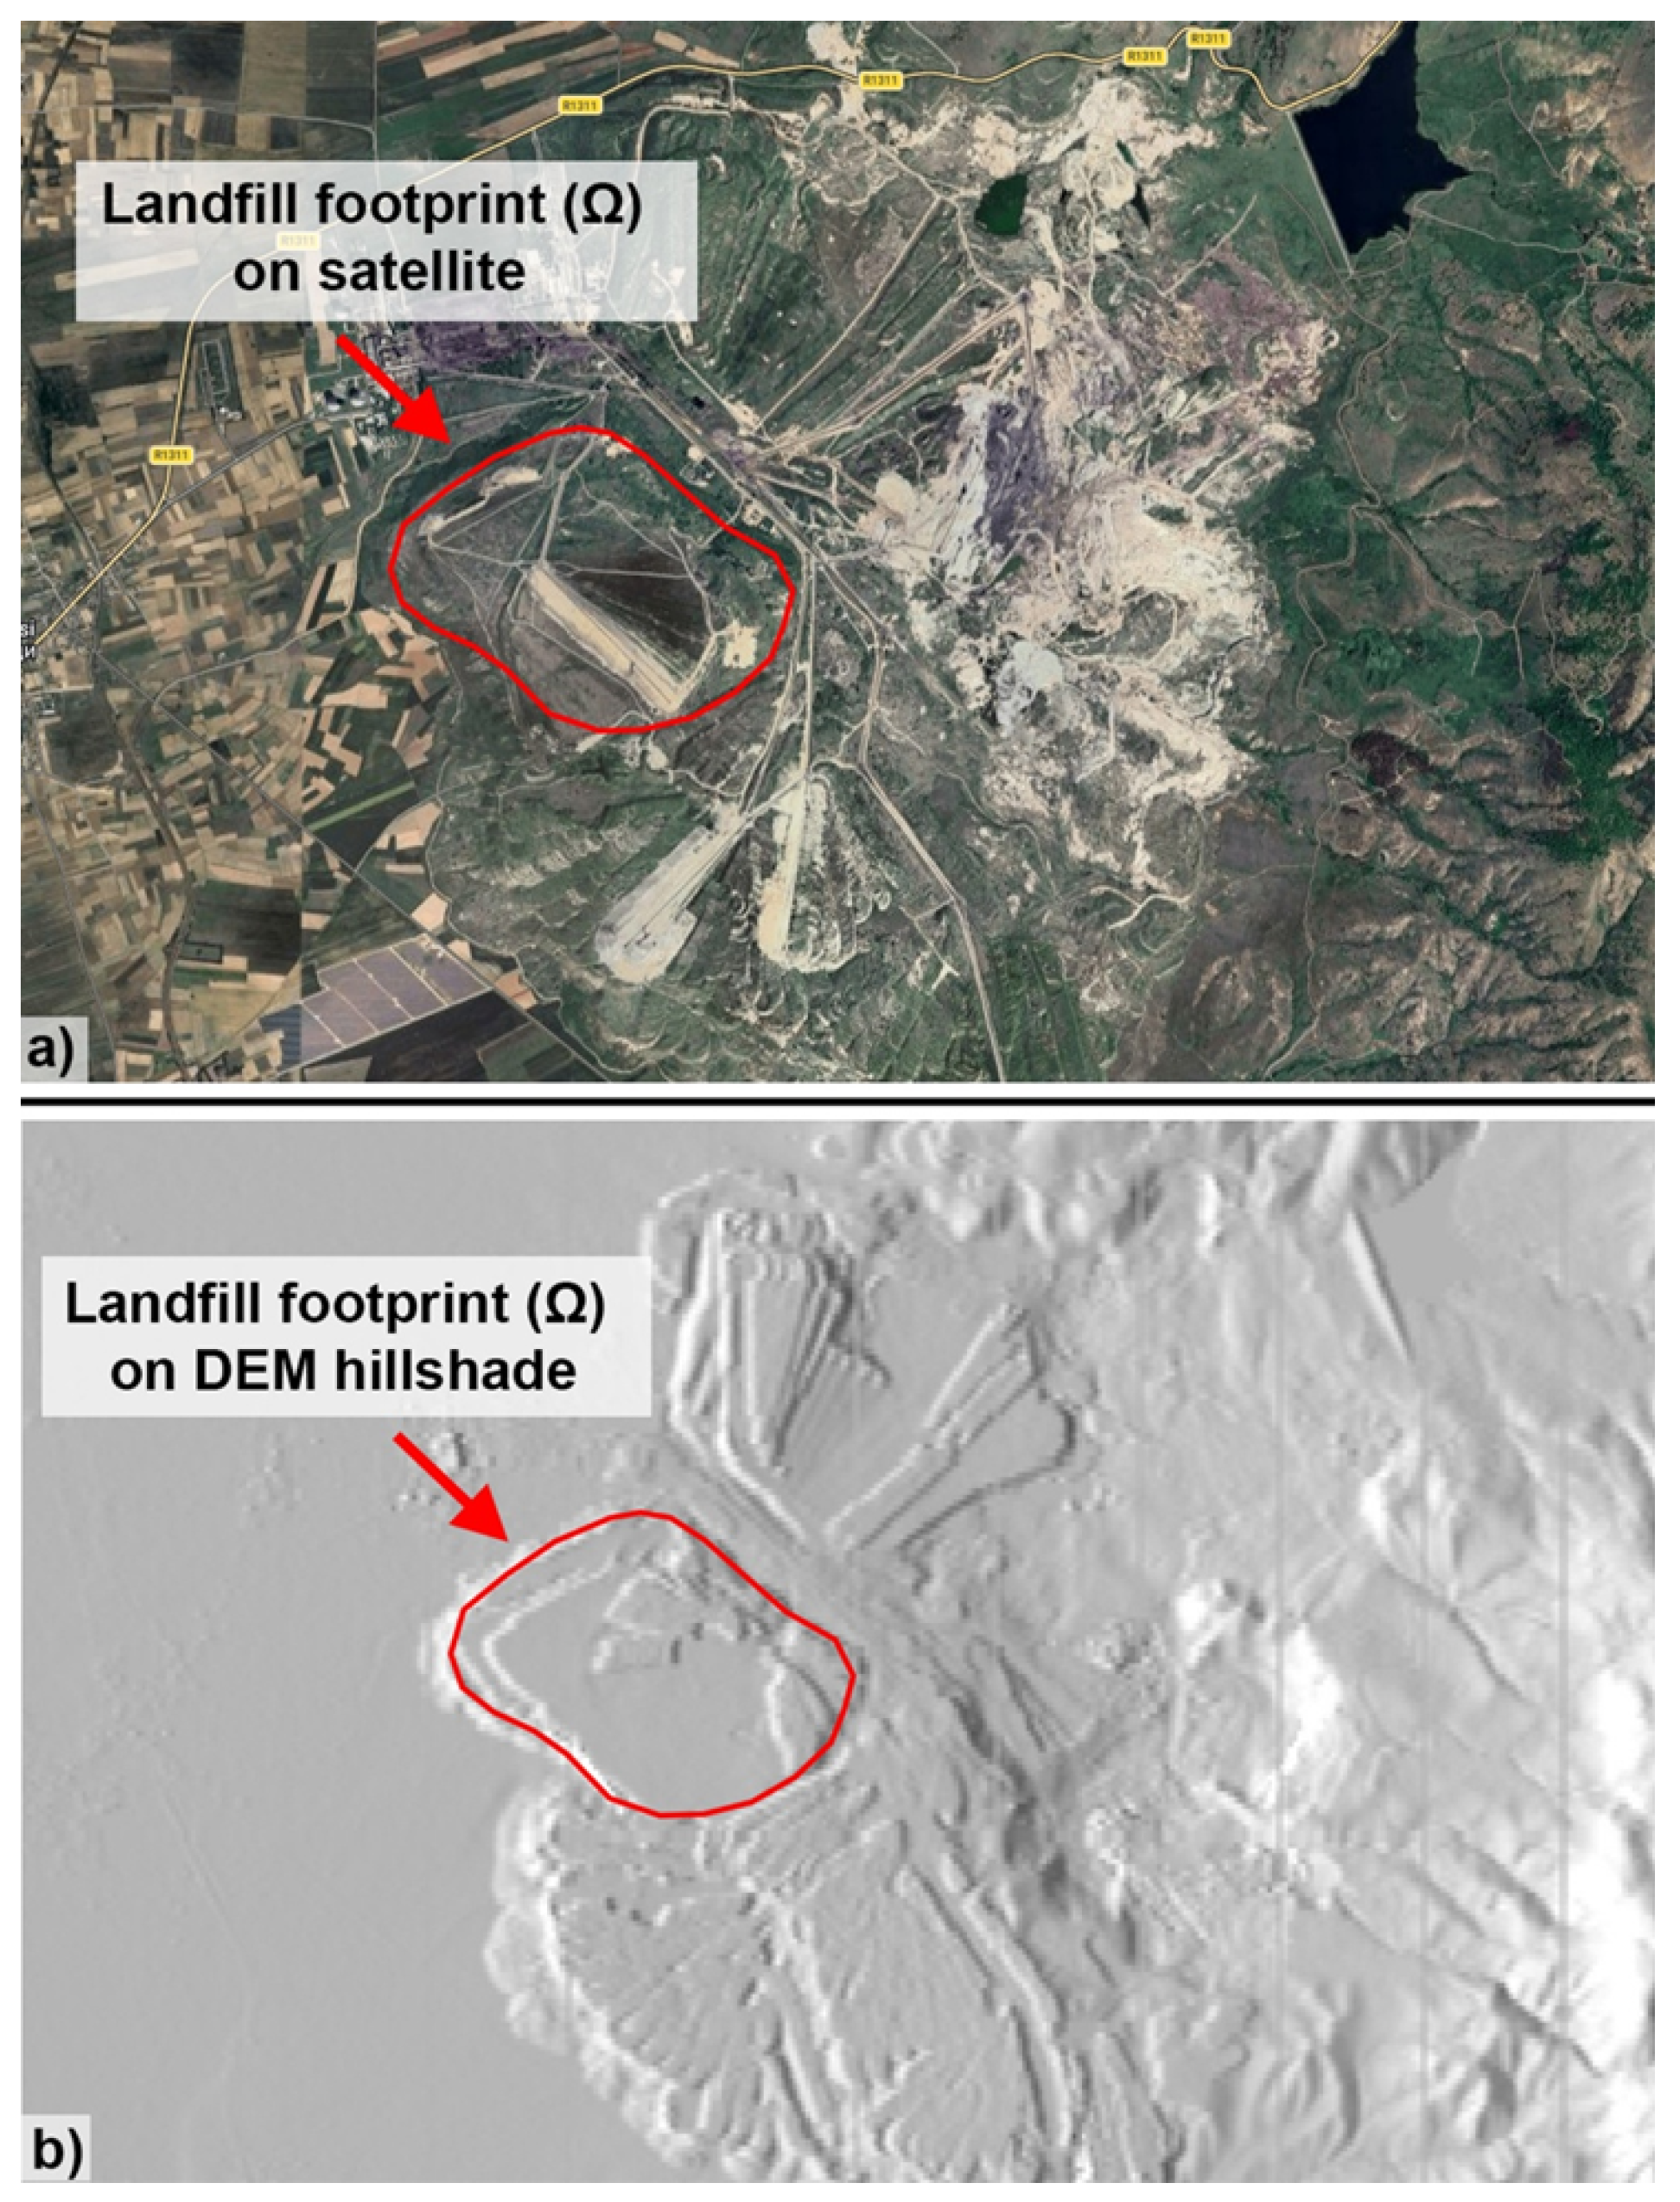
Figure 3.
Chemical composition of CCPs
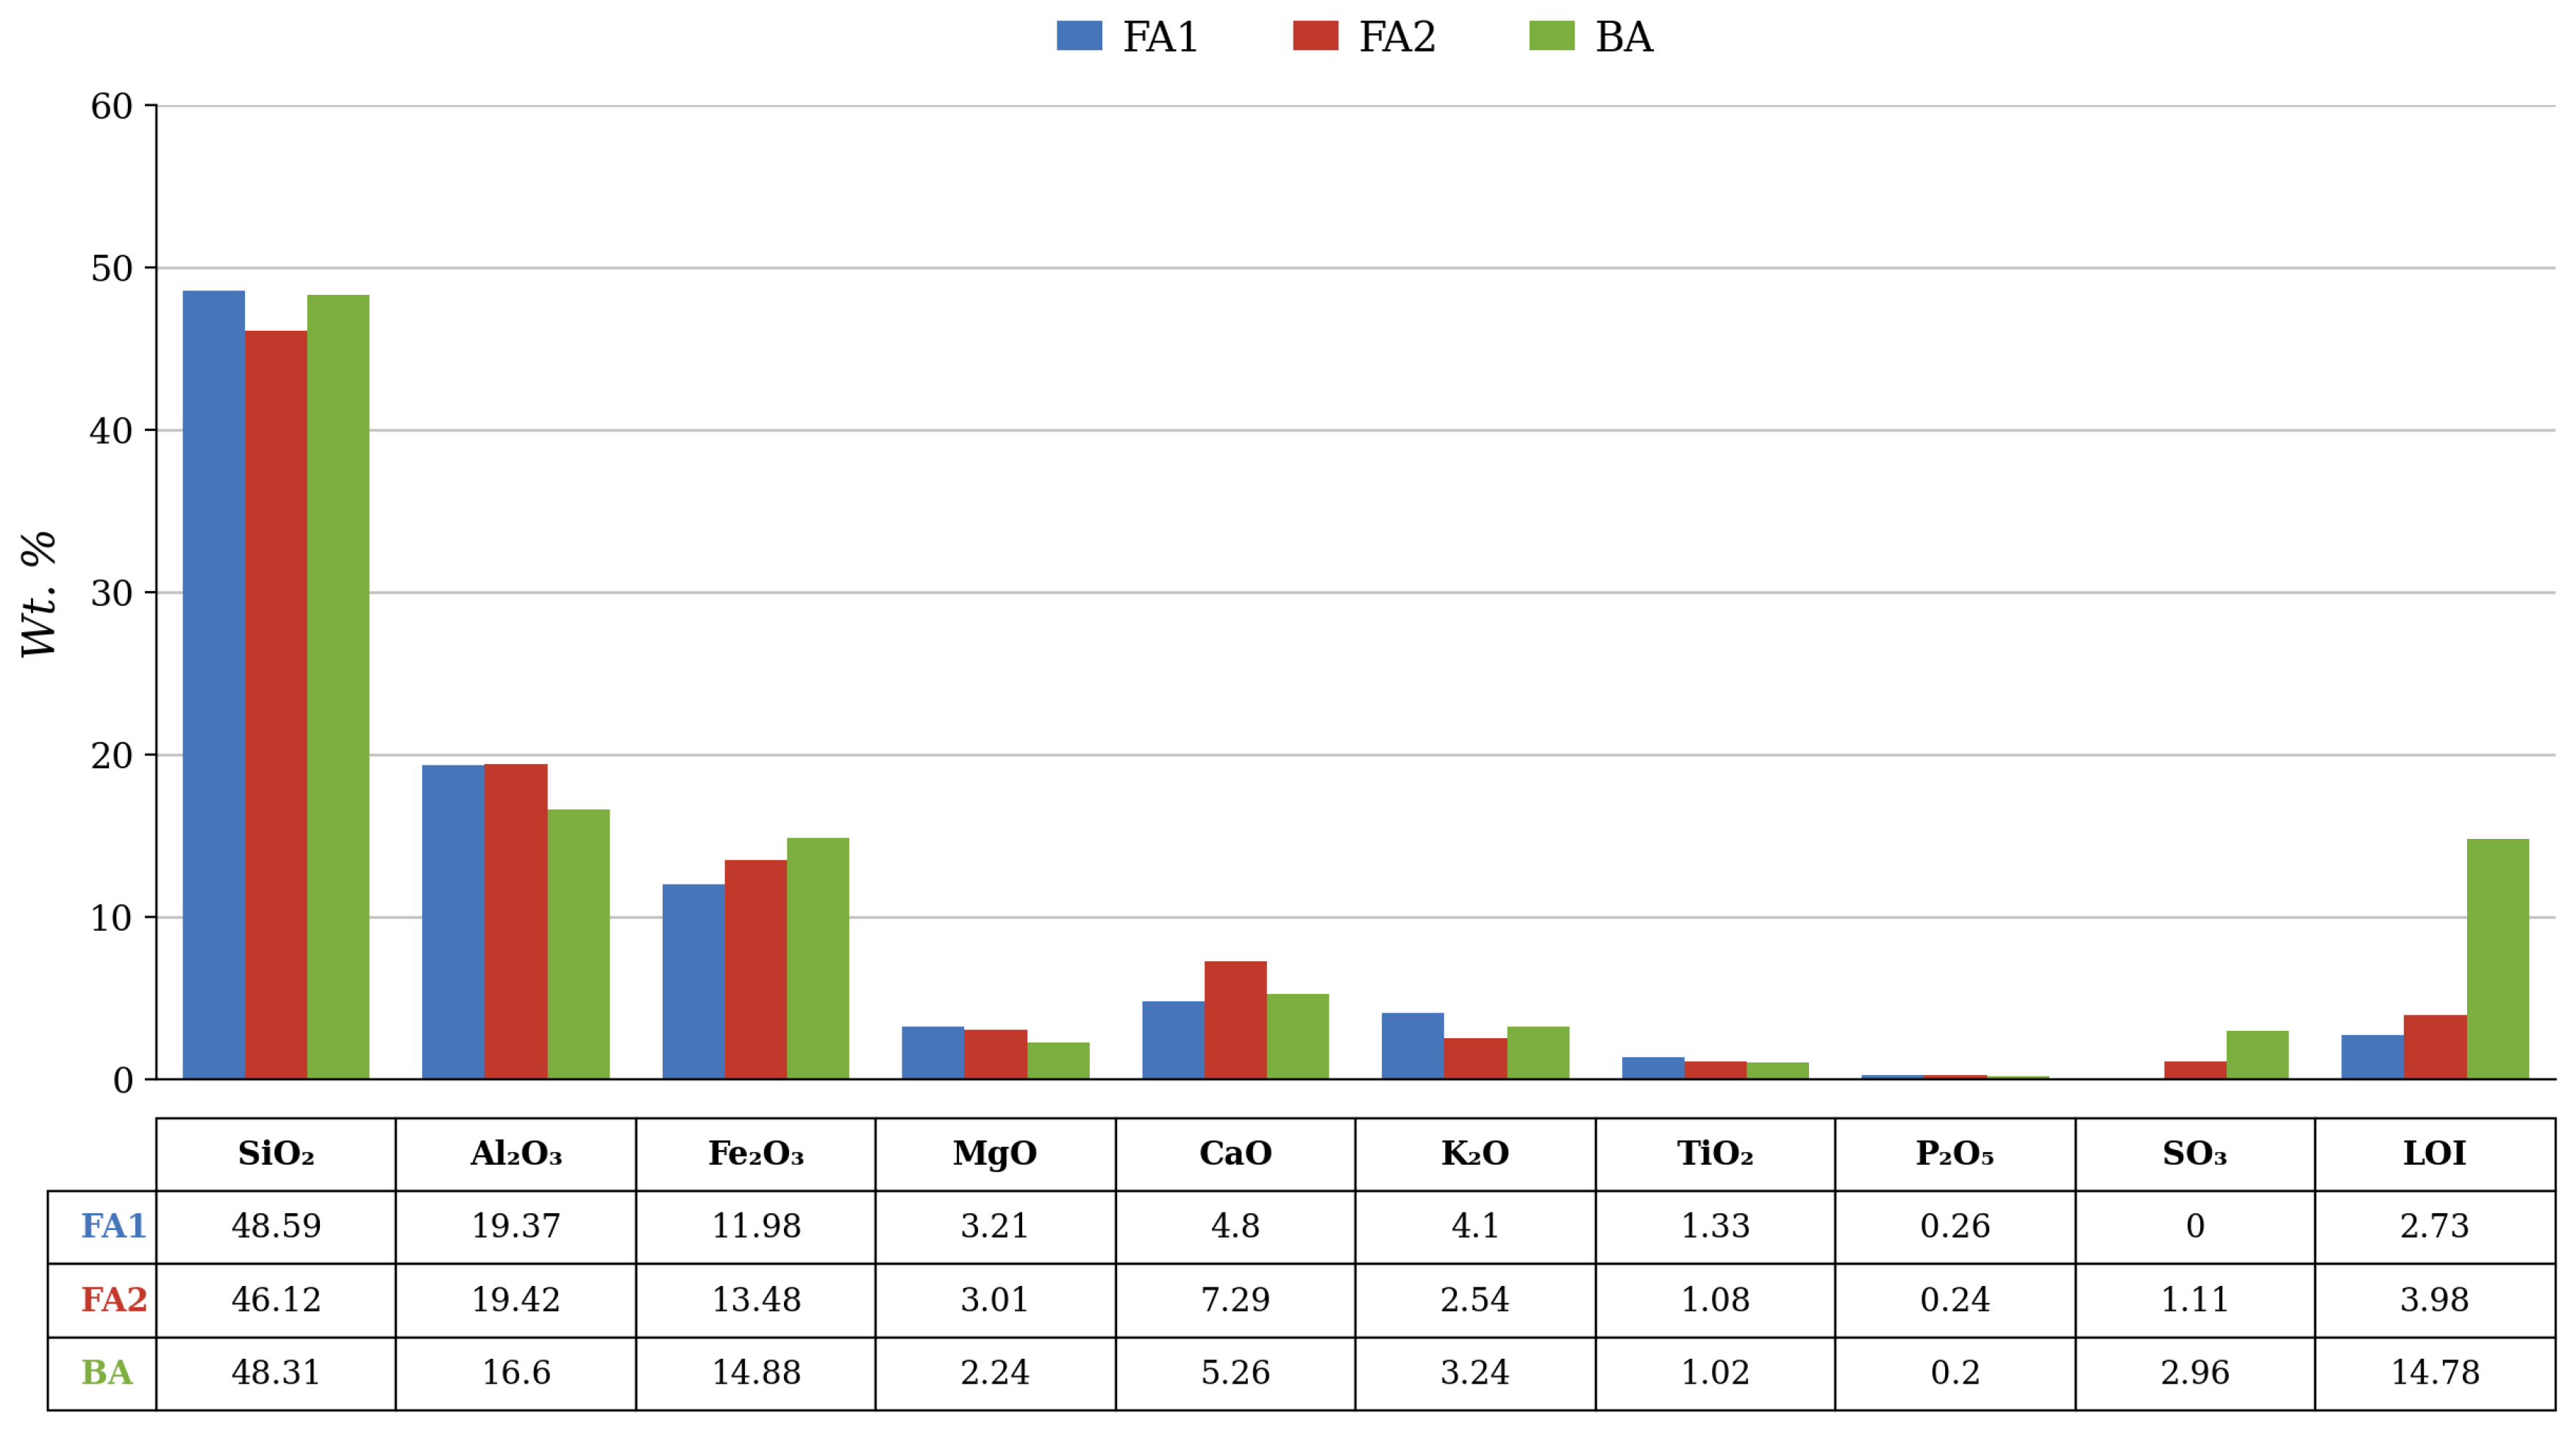
Table 1.
List of critical and strategic raw materials 2023 [9]
Table 1.
List of critical and strategic raw materials 2023 [9]
| 2023 Critical Raw Materials | |||
|---|---|---|---|
| Aluminium/bauxite | Coking coal | Lithium | Phosphorus |
| Antimony | Feldspar | LREEs ** | Scandium |
| Arsenic | Fluorspar | Magnesium | Silicon metal |
| Baryte | Gallium | Manganese | Strontium |
| Beryllium | Germanium | Natural graphite | Tantalum |
| Bismuth | Hafnium | Niobium | Titanium metal |
| Boron/borate | Helium | PGM *** | Tungsten |
| Cobalt | HREEs * | Phosphate rock | Vanadium |
| Copper | Nickel | ||
| 2023 Strategic Raw Materials | |||
| Aluminium/bauxite | Coking coal | Lithium | Phosphorus |
| Antimony | Feldspar | LREEs ** | Scandium |
| Arsenic | Fluorspar | Magnesium | Silicon metal |
| Baryte | Gallium | Manganese | Strontium |
| Beryllium | Germanium | Natural graphite | Tantalum |
| Bismuth | Hafnium | Niobium | Titanium metal |
| Boron/borate | Helium | PGM *** | Tungsten |
| Cobalt | HREEs * | Phosphate rock | Vanadium |
| Copper | Nickel | ||
* HREEs: Heavy Rare Earth Elements; ** LREEs: Light Rare Earth Elements; *** PGM: Platinum Group Metals; I: Newly added materials in 2023.
Table 2.
Tier-1 ash landfill inventory derived from DEM differencing (GEE).
| Area | Volume (V) | * | Mean | Median | P90 | P95 | Max | RMSE |
|---|---|---|---|---|---|---|---|---|
| (ha) | (m3) | (m3) | (m) | P50 (m) | (m) | (m) | (m) | (m) |
| 191.05 | 106,819,658 | 5,078,528 | 55.91 | 59.76 | 67.22 | 72.25 | 78.24 | 2.66 |
* Screening approximation: , where A is footprint area.
Table 3.
Production-Based Sensitivity Analysis Using Literature-Based Bulk-Density Scenarios (1982–2025)
Table 3.
Production-Based Sensitivity Analysis Using Literature-Based Bulk-Density Scenarios (1982–2025)
| Scenario | Assumed | Cumulative net | Expected volume | DEM Tier-1 |
|---|---|---|---|---|
| Mass | of production | volume | ||
| (t m−3) | (Mt) | (Mm3) | (Mm3) | |
| Lower-density literature scenario | 0.54–0.86 | 60.7 | 70.6–112.4 | |
| Higher-density literature scenario | 1.12–1.50 | 60.7 | 40.5–54.2 |
Table 4.
Concentration of potentially toxic and other elements (mg ) in coal ashes from REK Bitola and coal ash Cv values.
Table 4.
Concentration of potentially toxic and other elements (mg ) in coal ashes from REK Bitola and coal ash Cv values.
| Element | Coal ash Cv value * | FA1 | FA2 | BA |
|---|---|---|---|---|
| (mg ) | (mg ) | (mg ) | (mg ) | |
| Mo | 14 | |||
| Pb | 47 | |||
| As | 47 | |||
| Zn | 140 | |||
| Co | 32 | |||
| Cd | 1.2 | |||
| Cr | 100 | |||
| Ni | 76 | |||
| Sb | 6.3 | |||
| Mn | 490 | |||
| Cu | 92 | |||
| Ag | 0.61 | |||
| Ba | 940 | |||
| Sr | 740 | |||
| Ga | 33 | |||
| Nb | 20 | |||
| Ta | 1.7 | |||
| Th | 21 | |||
| U | 16 | |||
| V | 155 | |||
| Zr | 210 |
* Coal ash Cv values as given in [13].
Table 5.
Indicative market prices of the candidate potentially toxic / critical elements (manganese, arsenic, gallium) by chemical form, grade and point of sale.
Table 5.
Indicative market prices of the candidate potentially toxic / critical elements (manganese, arsenic, gallium) by chemical form, grade and point of sale.
| Element | Product form / source | Purity [%] | Price | Unit |
|---|---|---|---|---|
| Manganese | Mn-rich slag | 30–31 | 4.16 | €/mtu |
| Electronic-grade Mn | 99.7 | 2249.62 | €/mtu | |
| Feed-grade MnSO4 | 32 | 543.23 | €/mtu | |
| Arsenic | Arsenic trioxide | 99 | 152.11 | €/mtu |
| As–Cu alloy | 30 | 1932.24 | €/mtu | |
| High-purity As | 99.9999% - 99.99999% | 466.59 | €/mtu | |
| Gallium | Ga, ex-works China | 99.99 | 201.91 | €/kg |
| Ga, FOB China | 99.99 | 352.16 | €/kg | |
| Ga, in-warehouse Rotterdam | 99.99 | 1804.59 | €/kg |
Prices assessed on: Mn 18 Aug 2026; As 20 Aug 2026; Ga 25 Aug 2026. 1 mtu (metric ton unit) = 10 kg.
Table 6.
Concentration of REEs (mg ) in coal ashes from REK Bitola and coal ash Cv values.
| Element | Coal ash Cv value * | FA1 | FA2 | BA |
|---|---|---|---|---|
| (mg ) | (mg ) | (mg kg−1) | (mg kg−1) | |
| Sc | 23 | |||
| Y | 51 | |||
| La | 69 | |||
| Ce | 130 | |||
| Pr | 20 | |||
| Nd | 67 | |||
| Sm | 13 | |||
| Eu | 2.5 | |||
| Gd | 16 | |||
| Tb | 2.1 | |||
| Dy | 14 | |||
| Ho | 4.0 | |||
| Er | 5.5 | |||
| Tm | 2.0 | |||
| Yb | 6.2 |
Coal ash Cv values as given in [13].
Disclaimer/Publisher’s Note: The statements, opinions and data contained in all publications are solely those of the individual author(s) and contributor(s) and not of MDPI and/or the editor(s). MDPI and/or the editor(s) disclaim responsibility for any injury to people or property resulting from any ideas, methods, instructions or products referred to in the content. |
© 2026 by the authors. Licensee MDPI, Basel, Switzerland. This article is an open access article distributed under the terms and conditions of the Creative Commons Attribution (CC BY) license (http://creativecommons.org/licenses/by/4.0/).
Copyright: This open access article is published under a Creative Commons CC BY 4.0 license, which permit the free download, distribution, and reuse, provided that the author and preprint are cited in any reuse.