

Submitted:
03 October 2026
Posted:
07 October 2026
You are already at the latest version
Abstract
Substantial variability in organoid differentiation into well-defined target cell populations necessitates objective, nondestructive quality assessment early during differentiation to support successful organoid-based therapies. We propose a triplet-trained Vision Transformer (Triplet-ViT) to predict differentiation outcomes of hypothalamic–pituitary organoids using a publicly available dataset comprising 1,500 bright-field images and compares its performance with EfficientNetV2-S and their 50:50 ensemble. Triplet-ViT achieved 71.33% accuracy, which exceeds the previously reported ViT benchmark by 5.63 percentage points. EfficientNetV2-S achieved the highest overall accuracy (73.67%) and recall (88.00%) for Category C organoids, which represented poorly differentiated organoids that were considered candidates for early exclusion from further culture, whereas Triplet-ViT achieved the highest Category C precision (86.81%) and specificity (94.00%) among the evaluated models and their ensemble. To assess triplet learning, we compared Triplet-ViT with a CE-only ViT under matched conditions using a five-seed, five-fold cross-validation within a 1,200-image training set. The accuracy and macro-F1 remained similar, whereas triplet learning increased C recall and C F1 by 2.70 and 1.02 percentage points, respectively. Advanced image-based deep learning, including triplet learning, may enable a more accurate, nondestructive, and standardized prediction of organoid differentiation, although validation across diverse cell lines and organoid systems is required before broader clinical application.
Keywords:
regenerative medicine
; hypothalamic–pituitary organoids
; Vision Transformer
; bright-field image
; triplet loss
; deep metric learning
1. Introduction
Pluripotent stem cells have the capacity for indefinite self-renewal and can differentiate into virtually any cell type in the human body [1]. Organoids derived from such cells are 3D self-organizing tissue structures generated in vitro that recapitulate the key structural and functional features of their corresponding human organs [2]. In recent years, stem cells and organoids have been increasingly used in disease modeling, drug screening, toxicity testing, and development of regenerative and cell-based therapies [2,3]. Despite these advances, translating organoid-based therapies into clinical practice requires further progress in standardizing their production, ensuring safety, and establishing therapeutic efficacy [3].
Successful stem cell-based therapies require both a well-defined target cell population and consistent and efficient differentiation into the intended lineage [2]. However, differentiation outcomes can vary substantially across cell lines, culture batches, media compositions, and experimental conditions [4,5]. Controlling this variability is particularly critical in organoid culture, where organoids must not only develop the expected 3D architecture but also acquire and maintain organ-specific functional properties [2]. If inadequate or aberrant differentiation is detected only after prolonged culture, substantial amounts of media, reagents, labor, and time may have already been consumed [5,6]. Therefore, early and reliable assessment of differentiation quality is important for the quality control of stem cells and organoid production [2,7]. Visual assessment of organoid differentiation is associated with inter-observer variability, highlighting the need for more objective, standardized, and quantitative assessment methods [6,8].
Artificial intelligence (AI) has been applied across drug development from target identification to the prediction of therapeutic efficacy and safety [9]. In stem cell and organoid research, its applications include cell characterization, differentiation assessment, and drug-response analysis, with potential applications in the quality control of organoid production [4,10]. Image-based machine learning can support the nondestructive monitoring of temporal changes in cell and colony morphologies and cell density [5,11,12]. Several studies have demonstrated its potential for assessing stem cell differentiation and organoid development [4,6,8,13]. However, data quality, culture, imaging variability, and task-irrelevant correlations remain challenges [10]. Heterogeneity across cell lines, cell states, and organoid morphologies may further limit model generalizability and transferability across experimental systems [4,14].
Asano et al. developed a deep learning model to predict hypothalamic–pituitary organoid differentiation outcomes using bright-field images [6]. They identified Day-30 retina and anterior neural fold homeobox (RAX) expression as an early marker of differentiation quality, as aggregates with high RAX expression subsequently exhibited greater pituitary function suitable for transplantation on Day 100 [6]. Based on three categories defined by RAX-positive areas in RAX::VENUS reporter cells, the classification accuracies of EfficientNetV2-S, Vision Transformer, and their ensemble were found to be 67.3%, 65.7%, and 70.0%, respectively, compared with 46.7%–60.0% for experts [6]. For poorly differentiated aggregates (Category C), EfficientNetV2-S achieved 83.0% sensitivity and 89.0% specificity compared to 56.0%–73.0% and 84.0%–86.0% for experts, respectively [6]. The ensemble also predicted RAX expression in organoids derived from nonreporter cells, suggesting its potential application in clinical transplantation [6]. Further studies are required to improve the predictive accuracy and generalizability of such models for routine quality control of organoid batches.
From a biological and therapeutic perspective, accurate identification of Category C organoids is particularly important because low RAX expression at an early differentiation stage is associated with reduced subsequent adrenocorticotropic hormone (ACTH) secretory capacity [6]. Early identification of these poorly differentiated organoids could help guide decisions about continued culture. Such screening should identify organoids with limited differentiation potential while minimizing the unnecessary exclusion of potentially useful organoids, supporting the need for objective and standardized quality assessment [2].
In this study, we developed a triplet-trained Vision Transformer (Triplet-ViT) model for classifying hypothalamic–pituitary organoid differentiation quality using a publicly available dataset of Day-30 bright-field images with RAX-expression-based category labels. The model combines cross-entropy (CE) classification with semi-hard triplet learning to facilitate the separation of images from different categories in the learned feature space. A comparison with CE-only ViT under matched training and validation conditions was used to assess the contribution of triplet learning. EfficientNetV2-S and an equal-weight probability ensemble were evaluated to compare the classification performance and error profiles. For the evaluations, we considered both the overall performance and balance between missed Category C organoids and Category A or B organoids that were incorrectly classified as Category C.
2. Materials and Methods
2.1. Overview of the Framework
The analysis included Triplet-ViT, EfficientNetV2-S, and their equal-weight probability ensembles. Figure 1 presents an overview of the two independently trained models and their probability-level ensembles.
The framework uses organoid morphological features from bright-field images to predict fluorescence-derived category labels without requiring fluorescence images as model inputs. Within Triplet-ViT, a shared encoder supplies image representation to the two learning branches. The classification branch associates each representation with its reference category, whereas the metric learning branch imposes relative distance constraints between selected images. The gradients from the combined objective update the same encoder, rather than separating the anchor, positive, and negative networks. This design couples category prediction with representation learning while retaining a single-image classification pipeline for inference.
2.2. Triplet-Trained Vision Transformer
As illustrated in Figure 1a, Triplet-ViT uses a pretrained ViT-Small encoder [15] with 16 × 16-pixel patches and combines classification with semi-hard triplet learning [16]. For each image xi, the final classification (CLS)-based representation provides a 384-dimensional feature vector hi. A linear classification head maps this vector to three logits corresponding to Categories A, B, and C.
The patch tokens represent the image regions, whereas the final CLS representation provides a feature vector for each image after transformer processing. Accordingly, the triplet objective compares image-level representations rather than individual patches. The embedding columns in Figure 1 denote these vectors, and each point in the schematic embedding space represents a complete image vector rather than one of its individual feature dimension.
The classification objective is the mean CE loss, expressed as follows:
where N is the mini-batch size, yi is the reference category, and is the predicted probability. In the implementation, the logits are passed directly to the CE function, which incorporates the log-softmax operation.
2.3. Class-Balanced Sampling and Semi-Hard Triplet Learning
Class-balanced sampling was performed prior to feature extraction, whereas triplet mining was performed on the resulting embeddings. Class-balanced mini-batches provided same-category positive candidates and different-category negative candidates for within-batch triplet mining. Therefore, batch construction and triplet selection had different objectives. Class-balanced sampling made candidate pairs available without using their current embedding distances. The subsequent mining helped select negative examples from these candidates based on the representations produced during the current forward pass. The anchor role was not restricted to Category A, and triplets could be involved in any of the three categories.
The same feature vectors were used for metric learning without an additional projection head. The features were L2-normalized, and pairwise cosine distances were calculated as follows:
L2 normalization scales each feature vector to a unit length for cosine-distance computation without reducing its dimensionality. It does not convert the representation into 3D coordinates (as shown in Figure 1); these coordinates only illustrate relative relationships. The classification branch retains un-normalized features, allowing a distance-based constraint to be introduced without replacing the representation supplied to the classification head.
For each ordered pair of distinct images from the same category, one image served as the anchor and the other as the positive. Negative candidates were images from different categories within the same minibatch. Semi-hard mining [16] selected candidates that satisfy
d(a,p) < d(a,n) < d(a,p) + m. (3)
where m = 0.10. Among eligible candidates, the negative closest to the anchor was selected. The anchor-positive pairs without eligible negatives were excluded from the triplet terms. The same margin was applied to all category pairs.
A semi-hard negative was farther from the anchor than the positive but remained within the additional margin. Easy negatives beyond this margin already satisfied the separation constraint for that pair, whereas negatives no farther than the positive did not meet the selected semi-hard condition. Thus, class membership determined eligibility as negative, but the current distance determined whether it contributed to a selected triplet.
The triplet loss can be averaged over the selected triplets as follows:
where is the selected triplet set, and [u]+ = max(0, u). When no eligible triplets were available, Ltriplet was set to zero. The combined training objective is as follows:
Ltotal = LCE + λtripletLtriplet, λ = 0.0025. (5)
Both objectives were applied from the beginning of training. The classification branch used the original feature vectors, whereas the metric-learning branch used their L2-normalized counterparts.
The margin controls the required relative separation in the embedding space, whereas the triplet loss weight controls the contribution of the objective to the combined loss. These parameters did not represent differences in the RAX-positive areas. The CE was calculated for all batch images, including for those not used in a selected triplet. Consequently, when no eligible triplets were available, the classification learning continued through the CE term.
The triplet construction used categorical labels rather than individual continuous RAX measurements. Two images from the same category formed a positive pair regardless of the underlying fluorescence percentages. Different category pairs were subjected to the same margin without an ordinal penalty, distinguishing adjacent categories from nonadjacent ones. In particular, the objective did not assign a higher explicit penalty to C-to-A errors than to C-to-B errors.
2.4. EfficientNetV2-S Comparator
Figure 1b shows the EfficientNetV2-S comparator, which was trained using the CE loss without the triplet objective. ImageNet-pretrained [17] EfficientNetV2-S [18] was used as the convolutional comparator. Its encoder comprises stem convolution, Fused-MBConv and MBConv blocks, a convolutional head, and global average pooling. Global average pooling converts the spatial feature maps into a 1,280-dimensional feature vector.
The classification head comprises a linear layer mapping 1,280 features to 512, sigmoid linear unit (SiLU) activation [19], dropout [20] with a probability of 0.3, and a final linear layer producing three logits. The encoder and classification head were jointly fine-tuned using the CE loss. EfficientNetV2-S was trained independently of Triplet-ViT, and the two models did not share parameters.
In this comparator, global average pooling summarizes each feature map channel across spatial positions before classification. Unlike Triplet-ViT, its learning objective does not explicitly compare the distances between images. Therefore, it represents a separately trained convolutional comparator, whereas the matched CE-only ViT isolates the contribution of the triplet objective.
2.5. Probability Ensemble
As illustrated in Figure 1c, the ensemble prediction is calculated by equally weighting the two architecture-level probability vectors:
Pensemble = 0.5pTriplet-ViT + 0.5pEfficientNet (6)
The predicted category has the highest probability of occurrence. Triplet mining and loss computations were not performed during inference. The ensemble combines prediction probabilities rather than model parameters and requires no joint training.
Probability averaging retained the class scores from both architectures instead of combining only their predicted labels. Equal weights defined a fixed combination rule rather than learned fusion modules. During inference, neither reference category labels nor anchor–positive–negative assignments were required, and each model generated probabilities directly from a bright-field image.
2.6. Dataset and Implementation Details
2.6.1. Dataset and Study Design
All samples are Day-30 bright-field images. Category definitions follow the original study; the supplied labels are retained without relabeling. Counts represent images, not necessarily independent biological replicates. The 1,200-image training set is used for five-fold validation (960 training and 240 validation images per fold), while the 300-image test set is evaluated separately.
We conducted a secondary computational analysis of a public bright-field image dataset released by Asano et al. [6]. No additional organoid cultures, fluorescence imaging, or biological experiments were performed. The dataset contained 1,500 Day-30 bright-field images of hypothalamic–pituitary organoids derived from RAX::VENUS reporter human embryonic stem cells. Categories A, B, and C were defined by the RAX::VENUS-positive area in the original study. Table 1 summarizes the category definitions and image counts [6]. These category labels were used as references for training and evaluation; the fluorescence images and continuous RAX measurements were not model inputs.
The original public training and test sets were retained, comprising 1,200 and 300 images, respectively. Only the training set was used for model development and internal validation, whereas the test set was reserved for the final performance assessment. In addition to the proposed Triplet-ViT, we examined EfficientNetV2-S and 50:50 ensemble as comparative models. A CE-only ViT served as an internal control to assess the contribution of triplet learning, whereas a pixel-based multilayer perceptron (MLP) and small convolutional neural network (CNN) were included as simple baselines.
2.6.2. Image Preprocessing and Mini-Batch Construction
For Triplet-ViT, CE-only ViT, and EfficientNetV2-S, images were loaded in a three-channel RGB format and resized from 1,920 × 1,440 to 224 × 224 pixels using bilinear interpolation without cropping or aspect-ratio-preserving padding. Tensor conversion helped scale the pixel intensities from [0, 255] to [0, 1], and no additional channel-wise mean–standard deviation normalization was applied. For Triplet-ViT, the training augmentation comprised GridMask [21] and AugMix [22], each applied with a probability of 0.7. AugMix combined three randomly augmented branches and blended their weighted mixture with its input image (only the augmentation component was used; no Jensen–Shannon consistency loss was included) [22]. EfficientNetV2-S used GridMask with a probability of 0.3 and horizontal and vertical flips, each with a probability of 0.5. The validation and test images were resized and tensor converted without random augmentation.
Class-balanced mini-batches containing eight images from each category were used for Triplet-ViT, yielding a batch size of 24. Images were sampled within each category and shuffled within the batch. The same batch construction and augmentation protocol were used for CE-only ViT. EfficientNetV2-S used shuffled mini-batches of 35 images without enforcing equal class counts within each batch.
2.6.3. Simple Baseline Models
Two randomly initialized baselines were implemented. The pixel-based MLP used flattened 64 × 64 RGB images and fully connected layers with 256 and 64 hidden units, ReLU activations, a dropout of 0.3 after the first hidden layer, and a three-logit output layer. The small CNN used three convolutional blocks with 16, 32, and 64 channels, each comprising 3 × 3 convolution, batch normalization, ReLU, and 2 × 2 max pooling. Adaptive average pooling to 4 × 4 was followed by a 128-unit fully connected layer (ReLU), a dropout of 0.3, and a three-logit output layer.
Both baselines used RGB images resized to 224 × 224 pixels, random horizontal and vertical flips with a probability of 0.5, and fixed ImageNet channel normalization (mean: 0.485, 0.456, and 0.406; standard deviation: 0.229, 0.224, and 0.225). The MLP additionally downsampled the images to 64 × 64 pixels before flattening. None of the models used pretrained weights. The training used shuffled batches of 32, CE loss, and AdamW with a learning rate of 0.001 and a weight decay of 0.0001 for 50 epochs, with cosine decay set to 0.000001. The minimum validation CE checkpoint was retained for each fold.
The baselines reused the seed-42 five-fold assignments and the test set with test probabilities averaged across five fold-specific models. These additional comparisons were conducted after the main model results became available; the baseline settings were fixed before testing without a hyperparameter search. Because preprocessing, augmentation, pre-training, and optimization differed across model families, these comparisons provided a context for performance evaluation rather than a controlled test of architecture or triplet learning.
2.6.4. Optimization and Checkpoint Selection
Triplet-ViT was trained for 20 epochs using AdamW [23] with a backbone learning rate of 3 × 10⁻⁵, a classification-head learning rate of 3 × 10⁻⁴, and a weight decay of 0.01. A two-epoch linear warm-up was followed by cosine learning rate decay. For each fold, the checkpoint with the highest validation macro-F1 was retained, and ties were resolved using the lower validation total loss.
EfficientNetV2-S was trained for 50 epochs using AdamW with a learning rate of 1.5 × 10⁻⁴ and a weight decay of 0.01. A step scheduler multiplied the learning rate by 0.97 every three epochs. The checkpoint with the lowest validation CE loss was retained for each fold.
The CE-only ViT followed the same architecture, initialization, data splits, sampling, augmentation, optimization, and checkpoint-selection rules as the Triplet-ViT, with the triplet-loss weight set to zero. Thus, a paired ViT comparison isolated the addition of the triplet objective. EfficientNetV2-S retained its architecture-specific training protocol and served as a separate comparator.
2.6.5. Five-Fold Validation and Test Set Inference
Five-fold cross-validation with shuffled image-level splits was performed within the 1,200-image training set. Each fold used 960 images for training and 240 for validation. Separate models were trained for each fold by checkpoint selection based on the corresponding validation subset.
Out-of-fold (OOF) predictions were generated by assigning each image a prediction from the model trained without that image’s fold. The five held-out prediction sets were then combined to calculate the performance metrics for all 1,200 training-set images. OOF predictions were not obtained by averaging the predictions of the five models for each training image.
The controlled CE-only ViT and triplet-ViT comparisons were repeated across five random seeds. Within each seed, both conditions used the same initial weights, fold assignments, and batch sequences. Metrics were calculated from the complete OOF predictions for each seed and summarized as the mean and standard deviation across seeds. The paired differences were calculated as the triplet ViT value minus the CE-only ViT value for each seed.
The final test set evaluation used seed 42 and the same five-fold assignments within the training set across the compared architectures. The finalized training configurations and 50:50 ensemble weights were fixed before test set evaluation and were not adjusted using the test results.
For the test set inference, each image was processed using five retained fold models for each architecture. The logit of each model was into an A/B/C probability vector using Softmax. The vectors were averaged for each architecture.
The CE-only ViT was evaluated using the same five-fold probability-averaging procedure.
2.6.6. Performance Evaluation
The overall classification performance was assessed using accuracy and macro-F1. Macro-F1 was calculated as the arithmetic mean of the F1 scores for Categories A, B, and C. Category C recall, precision, specificity, and F1 were calculated using a binary formulation, with C as the positive class and A/B as the negative class [24].
Confusion matrices were used to distinguish Category C images incorrectly assigned to A or B from Category A or B images incorrectly assigned to C. The former represents missed Category-C images, whereas the latter represents false Category-C assignments, which may lead to unnecessary exclusions during screening. C→A and C→B errors were reported separately to characterize changes in the type of missed detections. Class-specific receiver operating characteristic (ROC) curves and areas under the curves were calculated using a one-versus-rest approach [25].
The OOF and test set results were reported separately. Comparisons with previously published benchmark results provided context for overall performance, whereas a matched CE-only ViT comparison was used to assess the contribution of triplet learning.
3. Results
3.1. Classification Performance on the Test Set
Table 2 summarizes the performance of the evaluated models on the test set, along with previously reported benchmark results. On the 300-image test set, Triplet-ViT achieved an accuracy of 71.33% and a macro-F1 of 71.51%. Its accuracy exceeded the previously reported ViT accuracy of 65.7% on the same benchmark by 5.63 percentage points [6]. This comparison describes the performance relative to the published benchmark, and the contribution of triplet learning is examined separately using the matched CE-only ViT control.
The MLP and small CNN achieved accuracies of 58.67% and 68.67% on the test set, respectively, with macro-F1 scores of 57.74% and 67.81%, respectively (Table 2). Triplet-ViT achieved a higher accuracy and macro-F1 than both baselines. However, the small CNN had a higher C-recall than Triplet-ViT (81.00% vs. 79.00%), whereas Triplet-ViT achieved higher C-precision and specificity.
Among Triplet-ViT, EfficientNetV2-S, and their 50:50 ensemble, EfficientNetV2-S achieved the highest accuracy of 73.67%, with a macro-F1 of 72.60%. The ensemble achieved 73.00% accuracy and the highest macro-F1 among the three models at 72.70%, exceeding EfficientNetV2-S by 0.10 percentage points. Thus, probability averaging produced a small numerical increase in macro-F1 but did not improve the accuracy over EfficientNetV2-S.
The models differed in their Category C performance. EfficientNetV2-S achieved the highest C recall and C F1, at 88.00% and 85.44%, respectively. Triplet-ViT achieved the highest C-precision and specificity of 86.81% and 94.00%, respectively, with a C-recall of 79.00%. The ensemble produced C recall, precision, and specificity values of 83.00%, 85.57%, and 93.00%, respectively. Its C F1 was 84.26%, compared with 82.72% for Triplet-ViT.
Performance metrics are expressed as percentages. Category C metrics are calculated by treating C as the positive class and A/B as the negative class. Previously reported results are from Asano et al. [6]. Results from the present study are obtained on the 300-image test set using probability averaging across five fold-specific models. The ensemble combines Triplet-ViT and EfficientNetV2-S probabilities with equal weights. NR indicates a metric not reported in the source study. The MLP and small CNN were trained from random initialization using the same datasets and fold assignments; training protocols differed across model families.
3.2. Category-Specific Classification Performance and Discrimination
Figure 2 summarizes the category-specific performance on the test set, presenting confusion matrices (Figure 2a) and one-versus-rest ROC curves (Figure 2b) for Triplet-ViT, EfficientNetV2-S, and their 50:50 ensembles.
The confusion matrices showed different balances between missed Category C images and false Category C assignments. Of the 100 category C test images, Triplet-ViT correctly classified 79, misclassifying five as A and 16 as B. EfficientNetV2-S correctly classified 88, with three C→A and nine C→B errors. The ensemble correctly classified 83, with four C→A and 13 C→B errors. Across all three models, C→B errors were more frequent than C→A errors.
Conversely, Triplet-ViT incorrectly assigned 12 Category A or B images to Category C, compared with 18 for EfficientNetV2-S and 14 for the ensemble. All false Category C assignments were made using Triplet-ViT, and the ensemble originated from Category B, whereas EfficientNetV2-S assigned one Category-A image and 17 Category-B images to C. These counts accounted for the higher C-specificity of Triplet-ViT and the higher C-recall of EfficientNetV2-S. Category B had the lowest recall across all three models, with
60, 48, and 55 of the 100 images correctly classified using Triplet-ViT, EfficientNetV2-S, and the ensemble, respectively.
The ROC analysis provided a complementary assessment of discrimination across thresholds. The ensemble achieved the highest numerical AUC for each category, with values of 0.9004, 0.7998, and 0.9576 for A, B, and C, respectively; corresponding values of 0.8945, 0.7909, and 0.9480 for Triplet-ViT; and 0.8929, 0.7703, and 0.9540 for EfficientNetV2-S. Category C had the highest AUC, and Category B had the lowest AUC across all three models. Although this ensemble achieved the highest AUC values, it did not achieve the highest accuracy or C-recall under the argmax classification rule.
3.3. Ablation Study of the Triplet Objective
3.3.1. Contribution of Triplet Learning in Cross-Validation Within the Training Set
Table 3 summarizes the cross-validation comparison within the 1,200-image training set between Triplet-ViT and CE-only ViT under matched conditions across five random seeds, with the results reported as mean ± standard deviation. The overall classification performances were numerically similar. The mean accuracy was 70.92 ± 1.17% for the CE-only ViT and 71.00 ± 1.35% for Triplet-ViT, while the macro-F1 values were 71.09 ± 1.17% and 71.06 ± 1.39%, respectively. The mean paired differences were +0.08 percentage points for accuracy and −0.03 percentage points for macro-F1.
Category C recall increased from 77.45 ± 2.46% to 80.15 ± 2.02%, corresponding to a mean paired increase of 2.70 percentage points. C F1 increased from 81.37 ± 1.17% to 82.39 ± 1.31%, a mean increase of 1.02 percentage points. Both the C recall and C F1 were higher with Triplet-ViT for all five seeds. These increases were accompanied by lower mean C precision and specificity. The C precision decreased from 85.78 ± 1.88% to 84.77 ± 0.93%, and specificity decreased from 93.55 ± 1.08% to 92.80 ± 0.48%. Therefore, the cross-validation results showed increased Category C detection alongside more false category C assignments, without a corresponding increase in the overall macro-F1.
The reduction in missed Category C images was mainly associated with fewer C→B errors. Across seeds, the mean number of C→B errors decreased from 73.0 ± 8.5 to 62.0 ± 9.2 per cross-validation run on the 1,200-image training set. C→A errors remained similar, at 17.2 ± 2.3 and 17.4 ± 1.8, respectively.
3.3.2. Matched ViT Comparison on the Test Set
Table 4 presents the matched comparison on the test set, which shows a different Category C error profile from the cross-validation within the training set across the five seeds. The CE-only ViT achieved 73.00% accuracy and 73.02% macro-F1 compared to 71.33% and 71.51% for triplet-ViT, respectively. The C recall was 82.00% for CE-only ViT and 79.00% for Triplet-ViT, whereas the C F1 was 83.25% and 82.72%, respectively.
Triplet ViT instead achieved higher C precision and specificity on the test set. The precision increased from 84.54% to 86.81%, and the specificity increased from 92.50% to 94.00%. The number of false Category-C assignments decreased from 15 to 12, whereas the number of missed Category-C images increased from 18 to 21. Specifically, C→A errors increased from four to five, and C→B errors increased from 14 to 16.
Accordingly, the increase in the C recall observed across the five cross-validation seeds was not reproduced in the test set evaluation. Relative to the CE-only control, triplet learning increased the C recall in the OOF evaluation but reduced false Category C assignments on the test set, with different effects on the balance between these errors.
4. Discussion
Results are obtained on the 300-image test set using models trained with seed 42. Predictions are generated by averaging probabilities across five fold-specific models within each condition. Differences are calculated from the displayed values as Triplet-ViT minus CE-only ViT. Performance differences are expressed in percentage points, whereas error-count differences are expressed in images. These results represent a single-seed evaluation rather than a multi-seed average.
This study investigated the potential of semi-hard triplet learning in improving image-based prediction of hypothalamic–pituitary organoid differentiation using a publicly available dataset of bright-field images. Compared to the corresponding previously reported models [6], Triplet-ViT, EfficientNetV2-S, and their ensemble achieved a higher overall classification accuracy, C recall, C specificity, and F1. All three models outperformed the MLP and small CNN baselines in terms of C precision and macro-F1. In a controlled multi-seed, five-fold comparison within the training set, Triplet-ViT achieved an overall classification performance comparable to that of a conventional CE-based ViT, while consistently improving the category C recall and F1 score across five seeds. These improvements were accompanied by reductions in mean Category C precision and specificity. Collectively, our results suggest the potential utility of triplet-based deep learning approaches for organoid quality assessment using bright-field imaging.
Triplet-ViT, EfficientNetV2-S, and their 50:50 ensemble achieved classification accuracies of 71.33%, 73.67%, and 73.00%, respectively, exceeding the corresponding results reported by Asano et al. (65.7%, 67.3%, and 70.0%) [6]. Triplet-ViT also outperformed the MLP and small CNN baselines, which achieved accuracies of 58.67% and 68.67%, respectively. Its macro-F1 was higher at 71.51% compared with 57.74% for the MLP and 67.81% for the small CNN, further supporting the effectiveness of the proposed model relative to simpler approaches. Improvements in Category C classification were particularly relevant because this category represented poorly differentiated organoids with RAX-positive areas below 40%. Compared to the results reported by Asano et al., EfficientNetV2-S achieved higher C-recall (88.0% vs. 83.0%), specificity (91.0% vs. 89.0%), and F1 scores (85.44% vs. 81.0%) [6]. Triplet-ViT achieved the highest C-precision (86.81%) and specificity (94.0%) among the three models, indicating fewer false Category C assignments, whereas the ensemble achieved the highest C-AUC of 0.9576. Triplet learning encourages an anchor image to be closer to a same-category positive image than a different-category negative image in the embedding space, thereby promoting representations that reflect category similarity. Schroff et al. demonstrated the effectiveness of triplet-based embeddings for face recognition [16], whereas Amato et al.[26] reported the separation between benign and malignant histopathological tissue images using triplet-based metric learning. These findings provide a rationale for applying triplet learning to organoid images, where morphological similarities between differentiation categories can complicate classification, and suggest that this mechanism may contribute to the category-specific performance of Triplet-ViT.
Although Triplet-ViT achieved a higher accuracy than the previously reported ViT model, its overall accuracy was comparable to that of the conventional ViT in cross-validation within the training set under matched training conditions, indicating that the improvement over the previous model cannot be attributed solely to triplet learning. Hyperparameter selection can substantially influence neural-network performance, and differences in data sampling, initialization, and training configurations can affect benchmark comparisons [27,28]. In cross-validation within the training set across five random seeds, the Category C recall for Triplet-ViT increased from 77.45% to 80.15% and the F1 score increased from 81.37% to 82.39%, while the mean number of Category C images misclassified as Category B reduced from 73.0 to 62.0 per cross-validation run on the 1,200-image training set. These gains were accompanied by modest reductions in the mean C precision and specificity, reflecting fewer missed Category C images at the cost of more false Category C assignments. Moreover, on the separate test set, Triplet-ViT showed a lower Category C recall than the matched conventional ViT (79.0% vs. 82.0%), but higher precision (86.81% vs. 84.54%) and specificity (94.0% vs. 92.5%). These contrasting results indicate that triplet learning may alter the balance between missed poorly differentiated organoids and erroneous exclusion of potentially useful organoids, rather than consistently improving all aspects of classification performance. Differences in sample composition, random seeds, and prediction aggregation may have contributed to these contrasting results; their individual effects have not been established.
Beyond the matched ViT comparison, the test-set error profiles of Triplet-ViT, EfficientNetV2-S, and their ensemble suggest different priorities for organoid screening. High recall is important for minimizing the retention of poorly differentiated organoids, whereas high specificity helps avoid the unnecessary exclusion of potentially functional organoids. Therefore, the observed tradeoffs may support different screening priorities rather than indicate a universally preferable model. If a screening workflow excludes the predicted Category C organoids, the higher C recall of EfficientNetV2-S could be advantageous when the priority is to avoid the continuous expenditure of culture resources on poorly differentiated organoids. Conversely, the higher C-specificity of Triplet-ViT could be advantageous when the priority is to retain potentially useful Category A or B organoids, while accepting that more Category C organoids may remain in the culture. The ensemble showed intermediate C recall and specificity and could be considered when neither error type clearly dominates, although it was not established as the optimal default. This interpretation is consistent with decision-analytic approaches, which assess model utility based on the relative consequences of false-positive and false-negative decisions, rather than on predictive accuracy alone [29]. These scenarios are hypotheses based on the observed classification results, not demonstrated reductions in cost or increase in the functional organoid yield. Any practical selection strategy requires prospective validation and downstream functional and safety assessments.
This study has several limitations. First, although Asano et al. demonstrated that their model could predict the differentiation outcomes in organoids derived from cells without RAX::VENUS [6], the corresponding non-reporter images were not available in the publicly accessible dataset used in our analysis. Therefore, we could not confirm whether the improved classification performance can be reproduced in organoids derived from non-reporter stem cells, which is an important step toward potential clinical applications. Second, we could not directly compare the performance of our models with those of human experts under the same experimental conditions. Although our models achieved a higher classification accuracy than previously reported expert assessments [6], a direct paired comparison using the same images and standardized evaluation protocols is required to establish their practical advantages over conventional operator-dependent assessments. Third, our analysis was limited to a relatively small public dataset of hypothalamic–pituitary organoids derived from a single reporter cell line [6]. Further validation using independent datasets from different cell lines, culture conditions, and organoid types can help establish the generalizability of our models. Fourth, comparisons with published benchmarks and simple baselines involved differences in training protocols and therefore did not isolate the effects of architecture, pretraining, or hyperparameter tuning. Although the matched ViT comparison controlled for these factors within each seed, the five-seed analysis was limited to cross-validation within the training set, whereas the test-set performance was assessed using a single seed. Therefore, the stability of the observed differences on the test set across repeated training runs remains unclear.
5. Conclusions
Advanced image-based deep learning approaches can improve the prediction of hypothalamic–pituitary organoid differentiation, with triplet learning showing the potential to enhance the identification of poorly differentiated organoids. These findings support the development of more accurate, nondestructive, and standardized quality assessment strategies for stem cell- and organoid-based therapeutics. Further validation across diverse cell lines and organoid systems is required to establish the generalizability and clinical applicability of these approaches.
Future studies will focus on validating Triplet-ViT using independent datasets from different cell lines, culture conditions, and imaging platforms, including organoids derived from non-reporter cells. Where continuous RAX measurements are available, ordinal or distance-aware learning objectives can be investigated to account for differentiation levels within and across categories. Further work will also examine triplet selection strategies and classification thresholds to balance missed poorly-differentiated organoids against the unnecessary exclusion of potentially functional organoids. Prospective studies linking image-based predictions to subsequent organoid functions are required to determine whether the proposed approach can support practical culture selection decisions.
Author Contributions
Conceptualization, S.-I.L. and S.-J.B.; methodology, J.L. and S.K.; software, J.L.; validation, J.L.; formal analysis, J.L.; investigation, J.L. and S.K.; data curation, J.L.; writing—original draft preparation, J.L.; writing—review and editing, J.L., S.-I.L. test set evaluand S.-J.B.; visualization, J.L.; supervision, S.-I.L. and S.-J.B. All authors have read and agreed to the published version of the manuscript.
Funding
This research was funded by grants from the Korean Ministry of Health and Welfare (RS-2018-KH049333) and the Global University 30 Project Fund of Gyeongsang National University in 2026.
Data Availability Statement
This study used the publicly available dataset released by Asano et al. [6]. The code used for the model training and evaluation is available at https://github.com/greglee3/Organoid-triplet-vit.
Acknowledgments
During the preparation of this manuscript and study, the authors used Codex (OpenAI; GPT-5.6 Sol and GPT-6 Astra) to assist with manuscript drafting and revision, literature searches, code development and debugging, computational analysis, interpretation of results, and preparation of plotting code for the confusion matrices and ROC curves. The model architecture diagram was prepared using Canva. The authors have reviewed and edited the outputs and take full responsibility for the content of this publication.
Conflicts of Interest
The authors declare no conflicts of interest. The funders had no role in the design of the study; in the collection, analyses, or interpretation of data; in the writing of the manuscript; or in the decision to publish the results.
Abbreviations
The following abbreviations are used in this manuscript:
| RAX | Retina and anterior neural fold homeobox |
| ViT | Vision Transformer |
| CE | Cross-entropy |
| SiLU | Sigmoid linear unit |
| MLP | Multilayer perceptron |
| CNN | Convolutional neural network |
| OOF | Out-of-fold |
| ROC | Receiver operating characteristic |
| AUV | Area under the curve |
References
- De Los Angeles, A.; Ferrari, F.; Xi, R.; Fujiwara, Y.; Benvenisty, N.; Deng, H.; Hochedlinger, K.; Jaenisch, R.; Lee, S.; Leitch, H.G.; et al. Hallmarks of pluripotency. Nature 2015, 525, 469–478. [Google Scholar] [CrossRef] [PubMed]
- Ahn, S.J.; Lee, S.; Kwon, D.; Oh, S.; Park, C.; Jeon, S.; Lee, J.H.; Kim, T.S.; Oh, I.U. Essential Guidelines for Manufacturing and Application of Organoids. Int. J. Stem Cells 2024, 17, 102–112. [Google Scholar] [CrossRef] [PubMed]
- Verstegen, M.M.A.; Coppes, R.P.; Beghin, A.; De Coppi, P.; Gerli, M.F.M.; de Graeff, N.; Pan, Q.; Saito, Y.; Shi, S.; Zadpoor, A.A.; et al. Clinical applications of human organoids. Nat. Med. 2025, 31, 409–421. [Google Scholar] [CrossRef] [PubMed]
- Yang, X.; Chen, D.; Sun, Q.; Wang, Y.; Xia, Y.; Yang, J.; Lin, C.; Dang, X.; Cen, Z.; Liang, D.; et al. A live-cell image-based machine learning strategy for reducing variability in PSC differentiation systems. Cell Discov. 2023, 9, 53. [Google Scholar] [CrossRef] [PubMed]
- Hojo, M.A.; Tsuzuki, T.; Ozawa, Y.; Araki, T.; Sakurai, H. Early and non-destructive prediction of the differentiation efficiency of human induced pluripotent stem cells using imaging and machine learning. Sci. Rep. 2025, 15, 26821. [Google Scholar] [CrossRef] [PubMed]
- Asano, T.; Suga, H.; Niioka, H.; Yukawa, H.; Sakakibara, M.; Taga, S.; Soen, M.; Miwata, T.; Sasaki, H.; Seki, T.; et al. A deep learning approach to predict differentiation outcomes in hypothalamic-pituitary organoids. Commun. Biol. 2024, 7, 1468. [Google Scholar] [CrossRef] [PubMed]
- Qian, T.; Heaster, T.M.; Houghtaling, A.R.; Sun, K.; Samimi, K.; Skala, M.C. Label-free imaging for quality control of cardiomyocyte differentiation. Nat. Commun. 2021, 12, 4580. [Google Scholar] [CrossRef] [PubMed]
- Park, K.; Lee, J.Y.; Lee, S.Y.; Jeong, I.; Park, S.Y.; Kim, J.W.; Nam, S.A.; Kim, H.W.; Kim, Y.K.; Lee, S. Deep learning predicts the differentiation of kidney organoids derived from human induced pluripotent stem cells. Kidney Res. Clin. Pract. 2023, 42, 75–85. [Google Scholar] [CrossRef] [PubMed]
- Paul, D.; Sanap, G.; Shenoy, S.; Kalyane, D.; Kalia, K.; Tekade, R.K. Artificial intelligence in drug discovery and development. Drug Discov. Today 2021, 26, 80–93. [Google Scholar] [CrossRef] [PubMed]
- Maramraju, S.; Kowalczewski, A.; Kaza, A.; Liu, X.; Singaraju, J.P.; Albert, M.V.; Ma, Z.; Yang, H. AI-organoid integrated systems for biomedical studies and applications. Bioeng. Transl. Med. 2024, 9, e10641. [Google Scholar] [CrossRef] [PubMed]
- Matsuoka, F.; Takeuchi, I.; Agata, H.; Kagami, H.; Shiono, H.; Kiyota, Y.; Honda, H.; Kato, R. Morphology-based prediction of osteogenic differentiation potential of human mesenchymal stem cells. PLoS ONE 2013, 8, e55082. [Google Scholar] [CrossRef] [PubMed]
- Waisman, A.; La Greca, A.; Möbbs, A.M.; Scarafía, M.A.; Santín Velazque, N.L.; Neiman, G.; Moro, L.N.; Luzzani, C.; Sevlever, G.E.; Guberman, A.S.; et al. Deep Learning Neural Networks Highly Predict Very Early Onset of Pluripotent Stem Cell Differentiation. Stem Cell Rep. 2019, 12, 845–859. [Google Scholar] [CrossRef] [PubMed]
- Lim, M.H.; Shin, S.; Park, K.; Park, J.; Kim, S.W.; Basurrah, M.A.; Lee, S.; Kim, D.H. Deep Learning Model for Predicting Airway Organoid Differentiation. Tissue Eng. Regen. Med. 2023, 20, 1109–1117. [Google Scholar] [CrossRef] [PubMed]
- Matthews, J.M.; Schuster, B.; Kashaf, S.S.; Liu, P.; Ben-Yishay, R.; Ishay-Ronen, D.; Izumchenko, E.; Shen, L.; Weber, C.R.; Bielski, M.; et al. OrganoID: A versatile deep learning platform for tracking and analysis of single-organoid dynamics. PLoS Comput Biol. 2022, 18, e1010584. [Google Scholar] [CrossRef] [PubMed]
- Dosovitskiy, A. An image is worth 16x16 words: Transformers for image recognition at scale. arXiv 2020, arXiv:2010.11929. [Google Scholar]
- Schroff, F.; Kalenichenko, D.; Philbin, J. Facenet: A unified embedding for face recognition and clustering. In Proceedings of the Proceedings of the IEEE conference on computer vision and pattern recognition, 2015; pp. 815–823. [Google Scholar]
- Deng, J.; Dong, W.; Socher, R.; Li, L.-J.; Li, K.; Fei-Fei, L. Imagenet: A large-scale hierarchical image database. In Proceedings of the 2009 IEEE conference on computer vision and pattern recognition, 2009; pp. 248–255. [Google Scholar]
- Tan, M.; Le, Q. Efficientnetv2: Smaller models and faster training. In Proceedings of the International conference on machine learning, 2021; pp. 10096–10106. [Google Scholar]
- Elfwing, S.; Uchibe, E.; Doya, K. Sigmoid-weighted linear units for neural network function approximation in reinforcement learning. Neural Netw. 2018, 107, 3–11. [Google Scholar] [CrossRef] [PubMed]
- Srivastava, N.; Hinton, G.; Krizhevsky, A.; Sutskever, I.; Salakhutdinov, R. Dropout: a simple way to prevent neural networks from overfitting. J. Mach. Learn. Res. 2014, 15, 1929–1958. [Google Scholar]
- Chen, P.; Liu, S.; Zhao, H.; Wang, X.; Jia, J. Gridmask data augmentation. arXiv 2020, arXiv:2001.04086. [Google Scholar]
- Hendrycks, D.; Mu, N.; Cubuk, E.D.; Zoph, B.; Gilmer, J.; Lakshminarayanan, B. Augmix: A simple data processing method to improve robustness and uncertainty. arXiv 2019, arXiv:1912.02781. [Google Scholar]
- Loshchilov, I.; Hutter, F. Decoupled Weight Decay Regularization. In Proceedings of the International Conference on Learning Representations, 2019. [Google Scholar]
- Sokolova, M.; Lapalme, G. A systematic analysis of performance measures for classification tasks. Inf. Process. Manag. 2009, 45, 427–437. [Google Scholar] [CrossRef]
- Fawcett, T. An introduction to ROC analysis. Pattern Recognit. Lett. 2006, 27, 861–874. [Google Scholar] [CrossRef]
- Amato, D.; Calderaro, S.; Lo Bosco, G.; Rizzo, R.; Vella, F. Metric learning in histopathological image classification: opening the black box. Sensors 2023, 23, 6003. [Google Scholar] [CrossRef] [PubMed]
- Bergstra, J.; Bengio, Y. Random search for hyper-parameter optimization. J. Mach. Learn. Res. 2012, 13. [Google Scholar]
- Bouthillier, X.; Delaunay, P.; Bronzi, M.; Trofimov, A.; Nichyporuk, B.; Szeto, J.; Mohammadi Sepahvand, N.; Raff, E.; Madan, K.; Voleti, V. Accounting for variance in machine learning benchmarks. Proc. Mach. Learn. Syst. 2021, 3, 747–769. [Google Scholar]
- Vickers, A.J.; Elkin, E.B. Decision curve analysis: a novel method for evaluating prediction models. Med. Decis. Mak. 2006, 26, 565–574. [Google Scholar] [CrossRef] [PubMed]
Figure 1.
Overview of Triplet-ViT and EfficientNetV2-S models and their probability-level ensemble. (a) Triplet-ViT processes class-balanced mini-batches using a shared ViT encoder. The final [CLS] representation is passed to a classification head for cross-entropy learning and L2-normalized for semi-hard triplet mining. Triplets are selected within each mini-batch using class labels and cosine distance. Training minimizes the combined cross-entropy and triplet losses, with a triplet weight of λ = 0.0025 and margin of m = 0.10. (b) EfficientNetV2-S processes randomly shuffled mini-batches and is trained using the cross-entropy loss. Global average pooling converts feature maps into vectors for classification. (c) At inference, prediction probabilities are averaged across five fold-specific models within each architecture and then combined with equal weights. The category with the highest ensemble probability is selected. The two architectures are trained independently; triplet mining and loss computation are used only during training. The embedding-space illustration and displayed probabilities are schematics, not experimental results.
Figure 1.
Overview of Triplet-ViT and EfficientNetV2-S models and their probability-level ensemble. (a) Triplet-ViT processes class-balanced mini-batches using a shared ViT encoder. The final [CLS] representation is passed to a classification head for cross-entropy learning and L2-normalized for semi-hard triplet mining. Triplets are selected within each mini-batch using class labels and cosine distance. Training minimizes the combined cross-entropy and triplet losses, with a triplet weight of λ = 0.0025 and margin of m = 0.10. (b) EfficientNetV2-S processes randomly shuffled mini-batches and is trained using the cross-entropy loss. Global average pooling converts feature maps into vectors for classification. (c) At inference, prediction probabilities are averaged across five fold-specific models within each architecture and then combined with equal weights. The category with the highest ensemble probability is selected. The two architectures are trained independently; triplet mining and loss computation are used only during training. The embedding-space illustration and displayed probabilities are schematics, not experimental results.
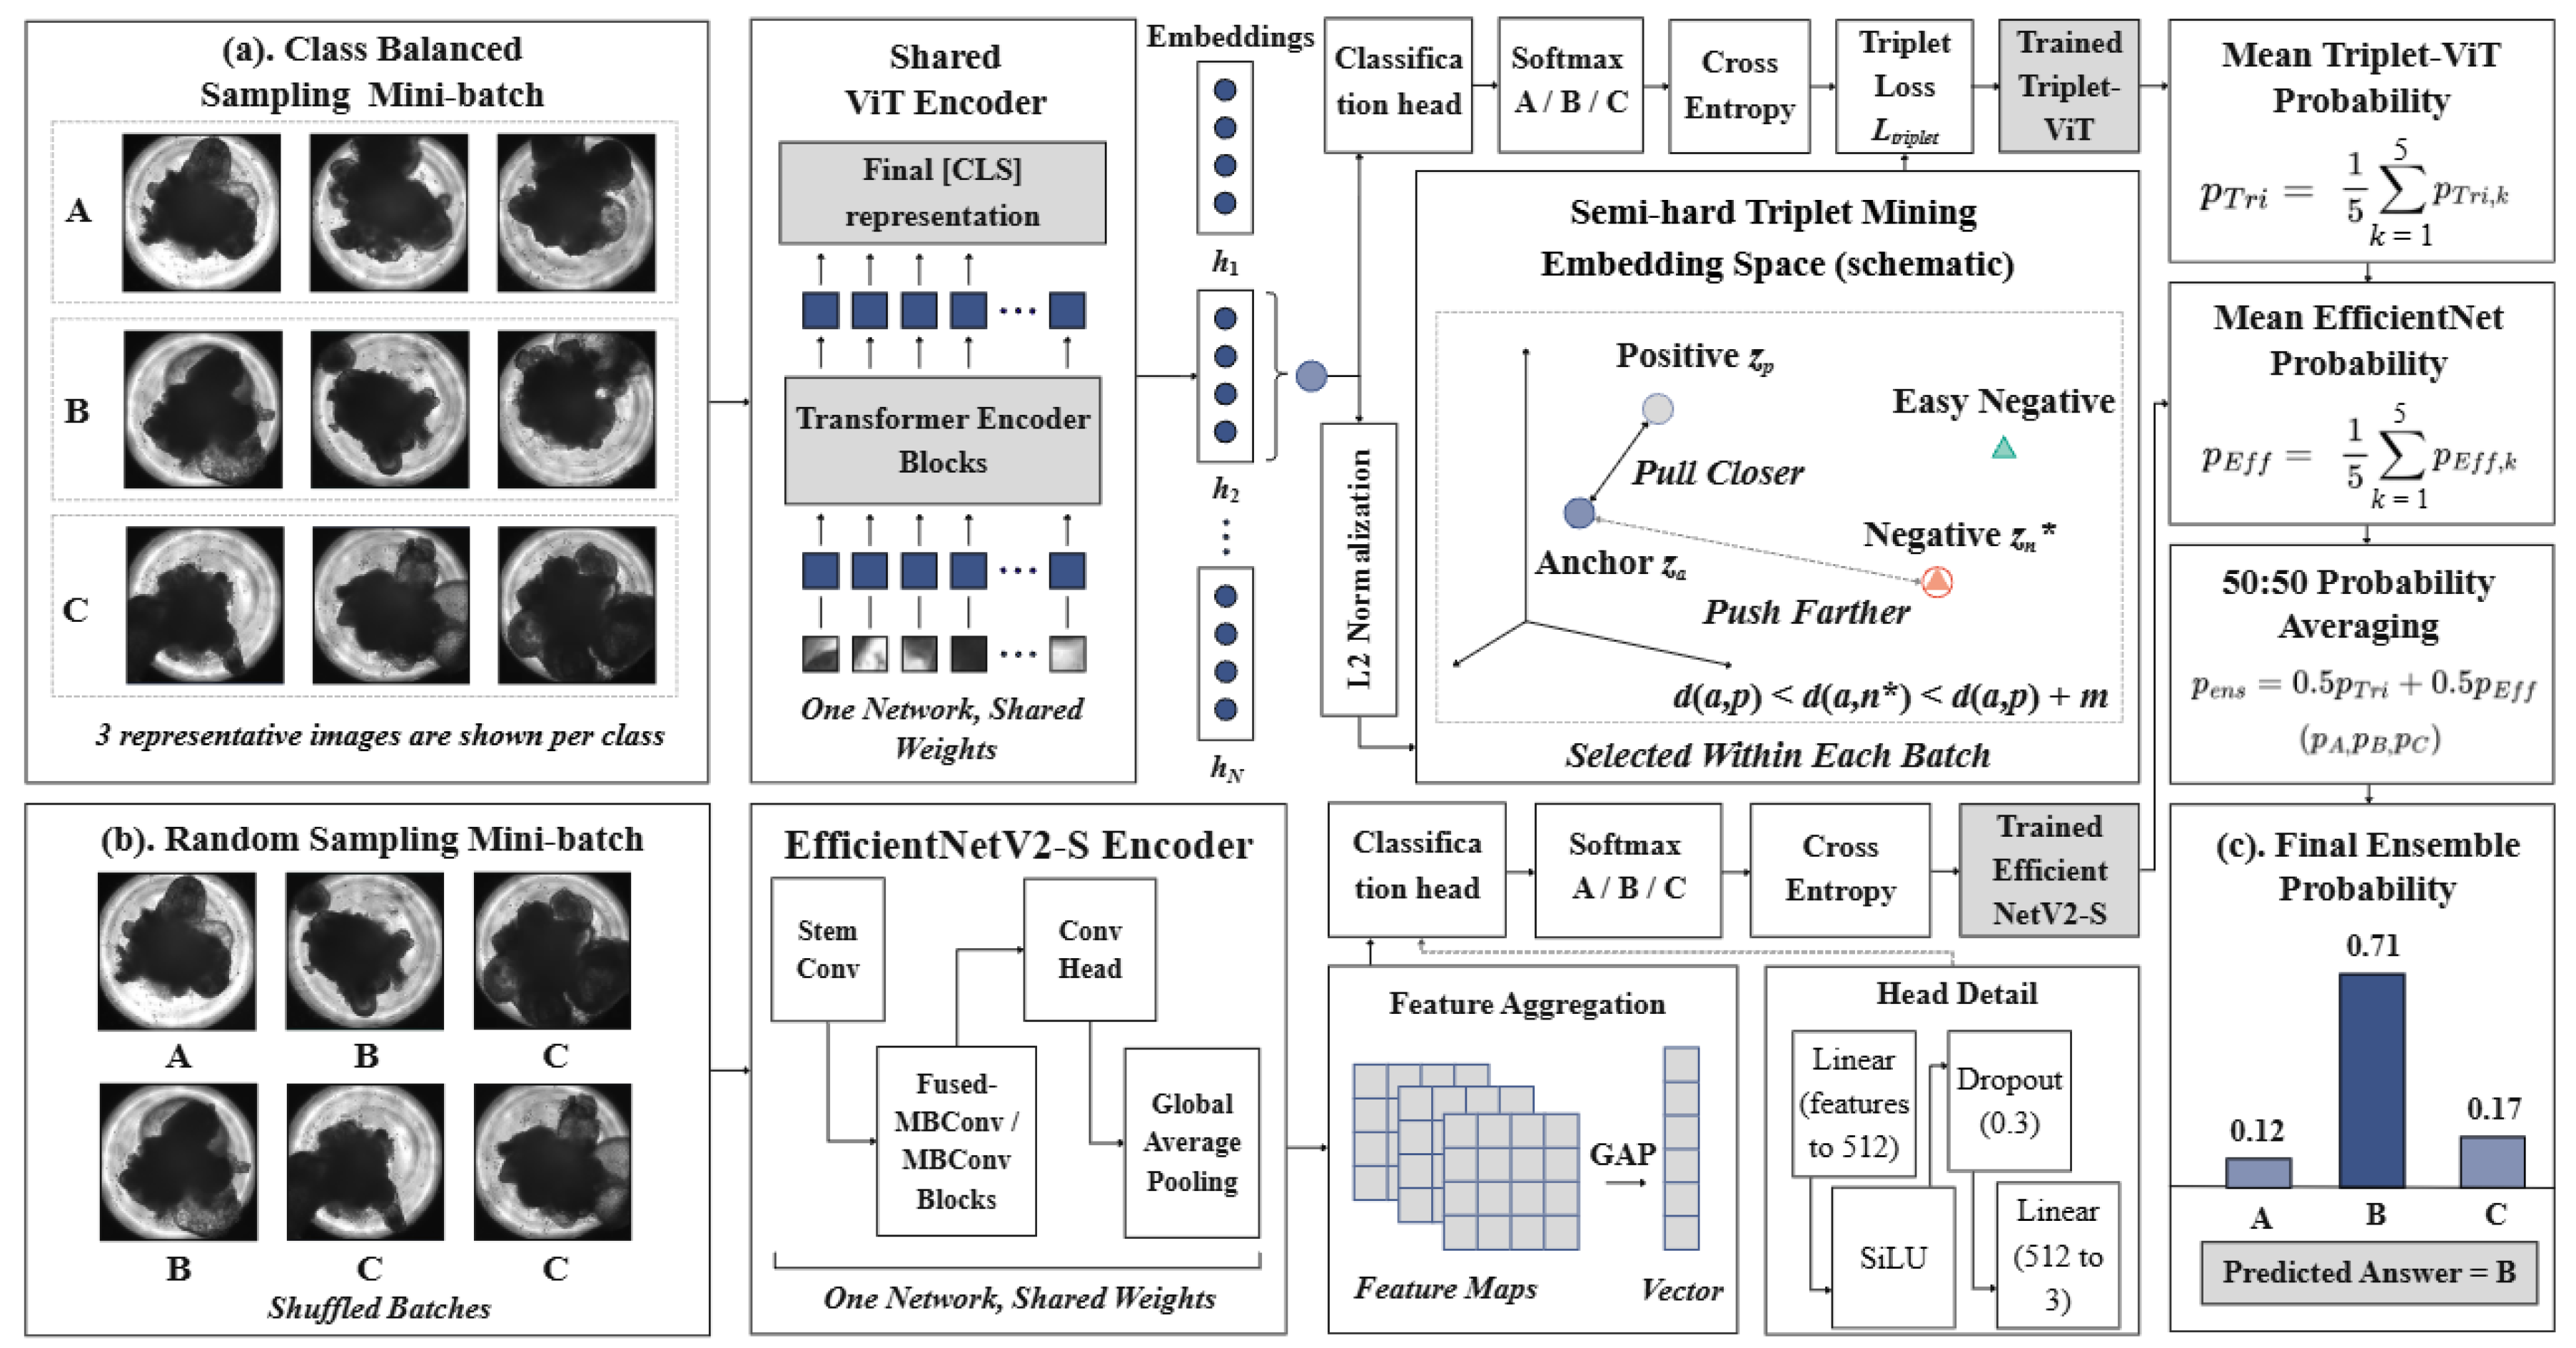
Figure 2.
Classification performance of Triplet-ViT, EfficientNetV2-S, and their 50:50 ensemble on the test set. (a) Confusion matrices for the three models. Rows indicate reference categories, columns indicate predicted categories, and cell values represent image counts. All matrices use the same color scale. (b) One-versus-rest receiver operating characteristic (ROC) curves for Categories A, B, and C, with area under the curve (AUC) values reported in the legends. Dashed diagonal lines indicate chance-level discrimination. For the evaluation, 300 test set images are used, with 100 images per category.
Figure 2.
Classification performance of Triplet-ViT, EfficientNetV2-S, and their 50:50 ensemble on the test set. (a) Confusion matrices for the three models. Rows indicate reference categories, columns indicate predicted categories, and cell values represent image counts. All matrices use the same color scale. (b) One-versus-rest receiver operating characteristic (ROC) curves for Categories A, B, and C, with area under the curve (AUC) values reported in the legends. Dashed diagonal lines indicate chance-level discrimination. For the evaluation, 300 test set images are used, with 100 images per category.
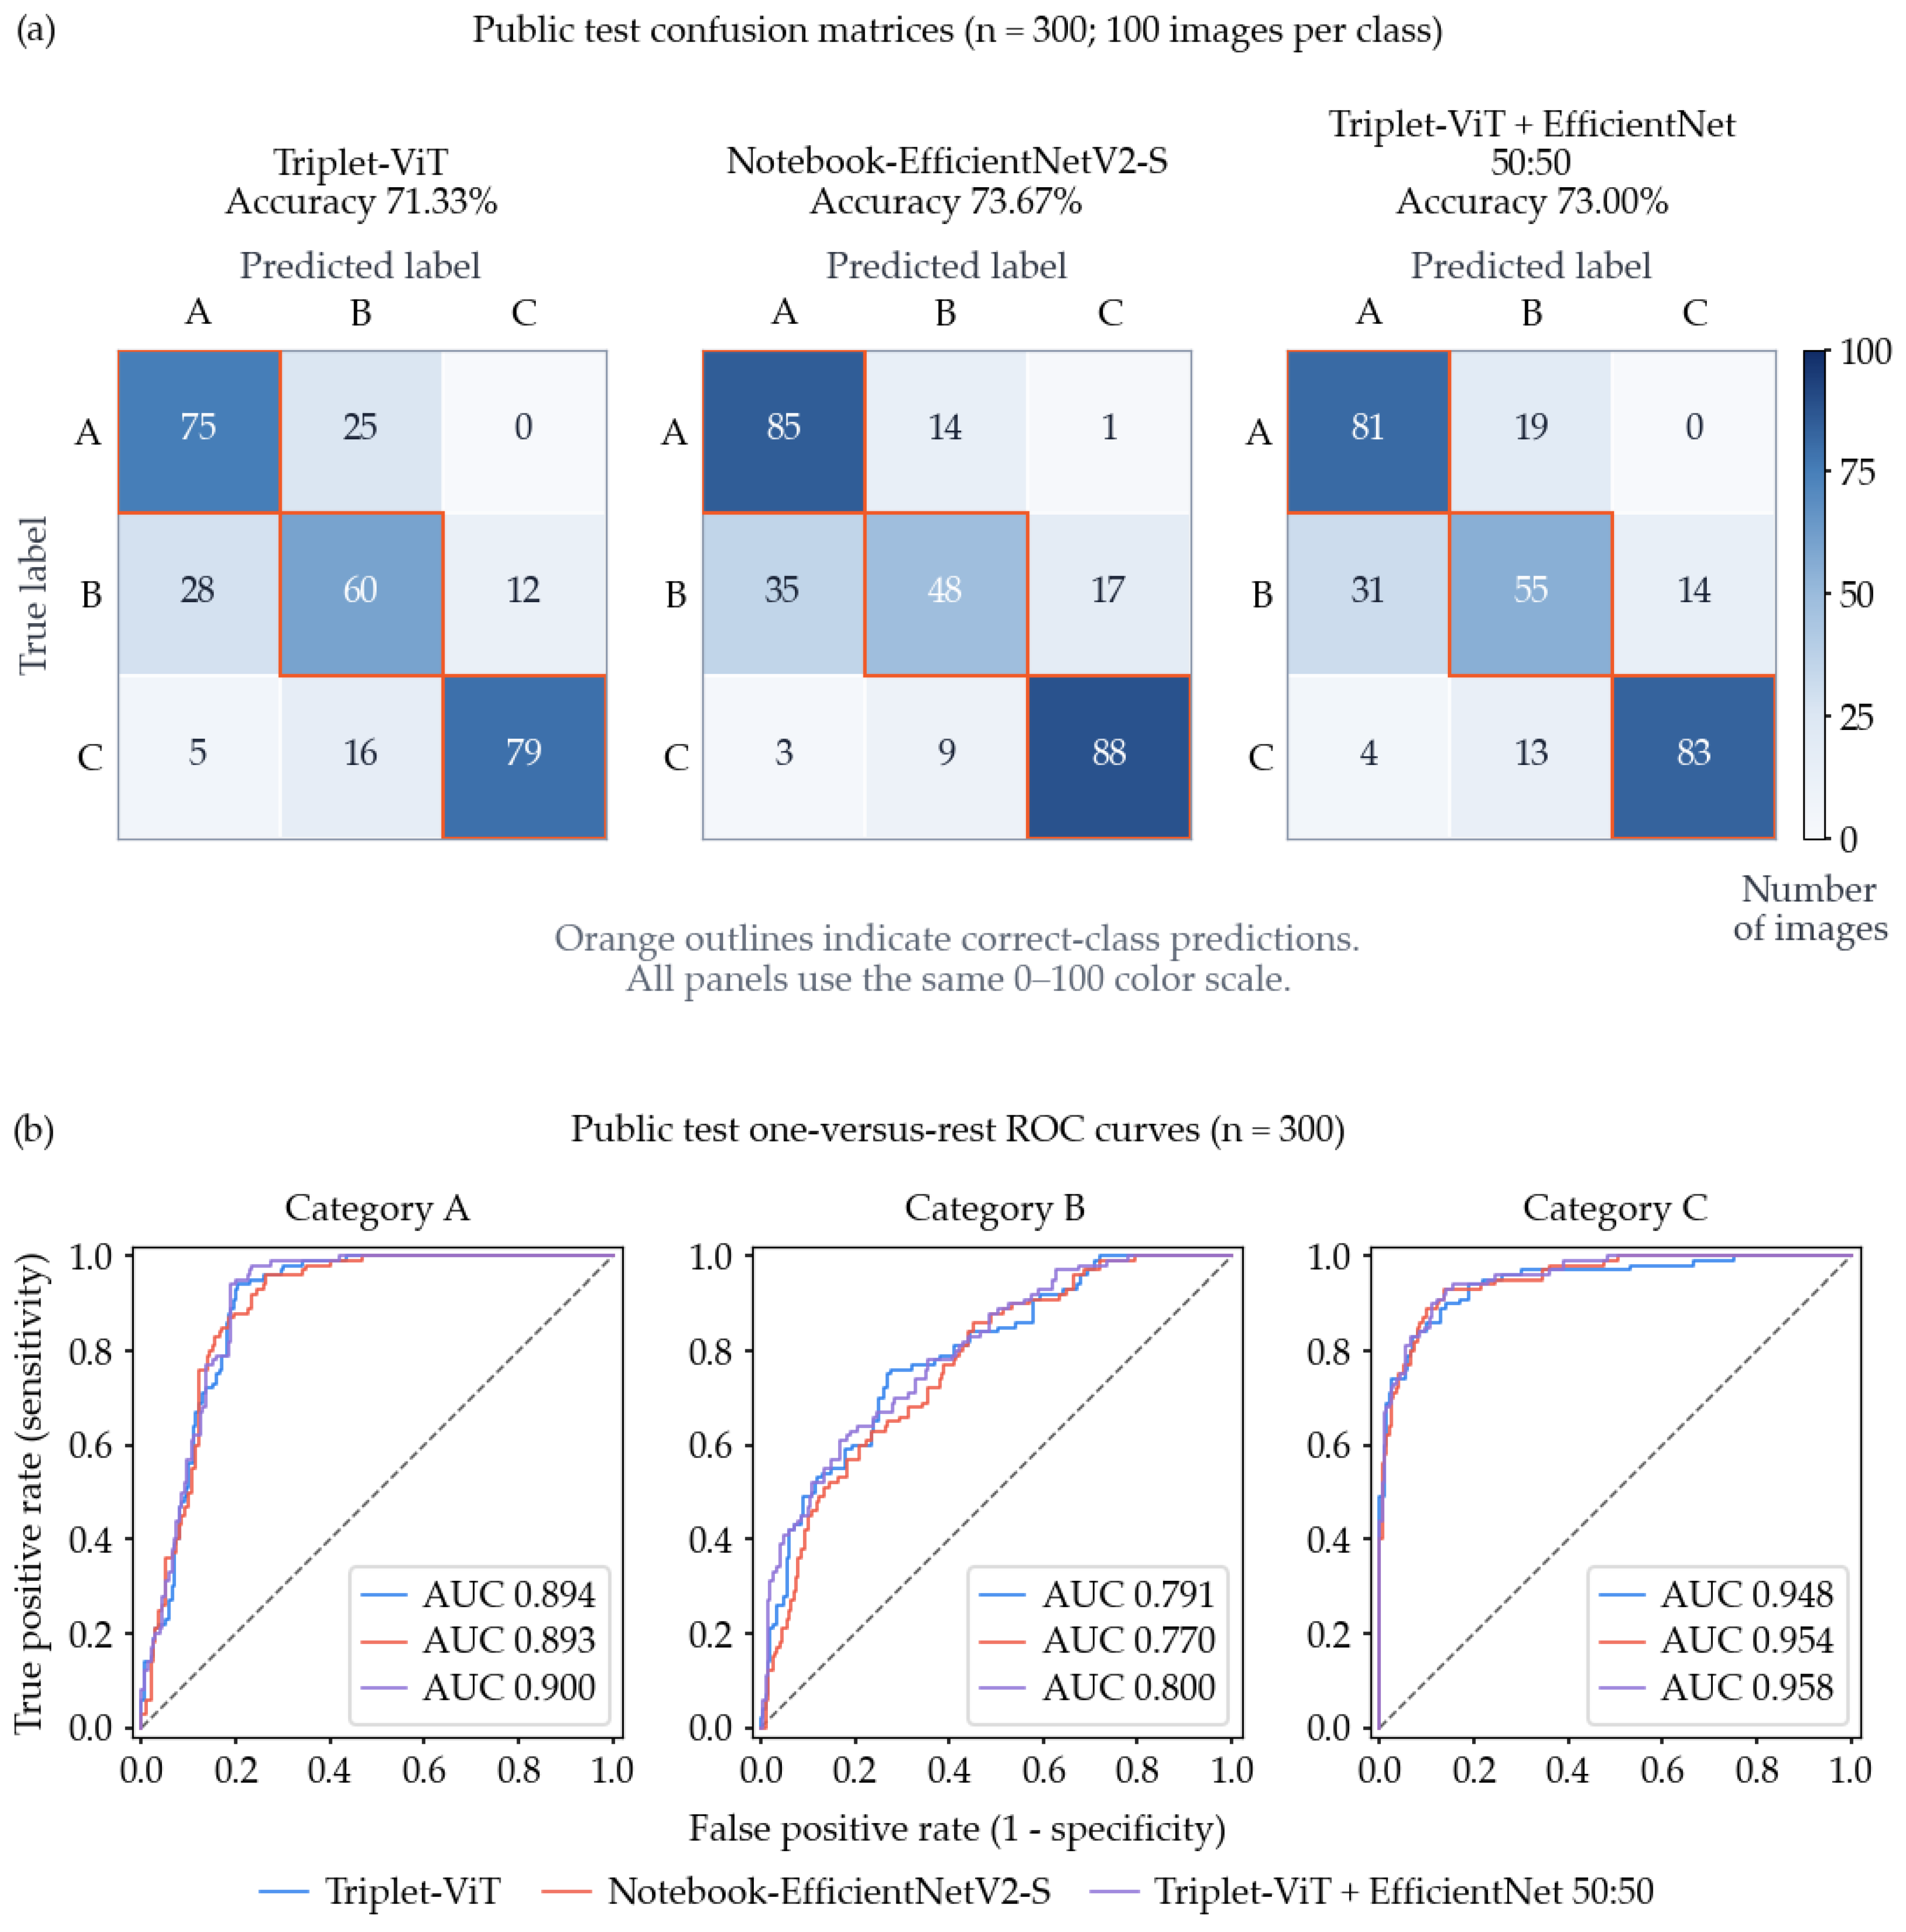

Table 1.
Composition and category definitions of the public Asano dataset used in this study.
| Category | RAX::VENUS-positive area (%) | Training set | Test set | Total (%) |
| A | >70 | 400 | 100 | 500 (33.3) |
| B | ≥40 and <70 | 400 | 100 | 500 (33.3) |
| C | <40 | 400 | 100 | 500 (33.3) |
| Total | — | 1,200 | 300 | 1,500 (100) |
Table 2.
Performance of the evaluated models and previously reported benchmark results.
| Study | Model or assessor | Accuracy (%) | Macro-F1 (%) | C recall (%) | C precision (%) | C specificity (%) | C F1 (%) |
| Baseline (this study) | MLP | 58.67 | 57.74 | 72.00 | 69.90 | 84.50 | 70.94 |
| Small CNN | 68.67 | 67.81 | 81.00 | 80.20 | 90.00 | 80.60 | |
| Asano et al. | ViT | 65.7 | NR | 77.0 | NR | 93.0 | 80.63 |
| EfficientNetV2-S | 67.3 | NR | 83.0 | NR | 89.0 | 80.98 | |
| 50:50 ensemble | 70.0 | NR | 82.0 | NR | 89.5 | 80.79 | |
| Expert assessment | 46.7–60.0 | NR | 56.0–73.0 | NR | 84.0–86.0 | NR | |
| Present study | Triplet-ViT | 71.33 | 71.51 | 79.00 | 86.81 | 94.00 | 82.72 |
| EfficientNetV2-S | 73.67 | 72.60 | 88.00 | 83.02 | 91.00 | 85.44 | |
| 50:50 ensemble | 73.00 | 72.70 | 83.00 | 85.57 | 93.00 | 84.26 |
Table 3.
Comparison between CE-only ViT and Triplet-ViT using cross-validation within the training set (n = 1,200).
Table 3.
Comparison between CE-only ViT and Triplet-ViT using cross-validation within the training set (n = 1,200).
| Metric | CE-only ViT | Triplet-ViT | Mean difference |
| Accuracy (%) | 70.92 ± 1.17 | 71.00 ± 1.35 | +0.08 pp |
| Macro-F1 (%) | 71.09 ± 1.17 | 71.06 ± 1.39 | −0.03 pp |
| C recall (%) | 77.45 ± 2.46 | 80.15 ± 2.02 | +2.70 pp |
| C precision (%) | 85.78 ± 1.88 | 84.77 ± 0.93 | −1.01 pp |
| C specificity (%) | 93.55 ± 1.08 | 92.80 ± 0.48 | −0.75 pp |
| C F1 (%) | 81.37 ± 1.17 | 82.39 ± 1.31 | +1.02 pp |
| C→A errors (images) | 17.2 ± 2.3 | 17.4 ± 1.8 | +0.2 |
| C→B errors (images) | 73.0 ± 8.5 | 62.0 ± 9.2 | −11.0 |
Values are mean ± standard deviation across five random seeds. For each seed, metrics are calculated from pooled out-of-fold (OOF) predictions for the 1,200-image training set. Both models use matched initial weights, fold assignments, and batch sequences. Paired differences are calculated as Triplet-ViT minus CE-only ViT and averaged across seeds. C→A and C→B indicate Category C images incorrectly classified as A and B, respectively. pp, percentage points. Each image is predicted by a model trained on the other four folds, and the separate 300-image test set is not used in this analysis.
Table 4.
Comparison between CE-only ViT and Triplet-ViT on the test set under matched training conditions.
Table 4.
Comparison between CE-only ViT and Triplet-ViT on the test set under matched training conditions.
| Metric | CE-only ViT | Triplet-ViT | Difference |
| Accuracy (%) | 73.00 | 71.33 | −1.67 pp |
| Macro-F1 (%) | 73.02 | 71.51 | −1.51 pp |
| C recall (%) | 82.00 | 79.00 | −3.00 pp |
| C precision (%) | 84.54 | 86.81 | +2.27 pp |
| C specificity (%) | 92.50 | 94.00 | +1.50 pp |
| C F1 (%) | 83.25 | 82.72 | −0.53 pp |
| C→A errors (images) | 4 | 5 | +1 |
| C→B errors (images) | 14 | 16 | +2 |
Disclaimer/Publisher’s Note: The statements, opinions and data contained in all publications are solely those of the individual author(s) and contributor(s) and not of MDPI and/or the editor(s). MDPI and/or the editor(s) disclaim responsibility for any injury to people or property resulting from any ideas, methods, instructions or products referred to in the content. |
© 2026 by the authors. Licensee MDPI, Basel, Switzerland. This article is an open access article distributed under the terms and conditions of the Creative Commons Attribution (CC BY) license (http://creativecommons.org/licenses/by/4.0/).
Copyright: This open access article is published under a Creative Commons CC BY 4.0 license, which permit the free download, distribution, and reuse, provided that the author and preprint are cited in any reuse.