

Submitted:
02 October 2026
Posted:
07 October 2026
You are already at the latest version
Abstract
Background: Although the corpus callosum is the principal commissure connecting the cerebral hemispheres, it remains unclear whether its macrostructure and microstructure are associated with greater structural symmetry between the hemispheres. Objective: To examine associations of callosal macrostructure and microstructure with left–right symmetry of cortical thickness in healthy developing children. Methods: In 8,131 children aged 9 to 10 from the Adolescent Brain Cognitive Development Study (ABCD), we related 16 callosal measures to per-child hemispheric similarity indices computed across 75 paired cortical regions. Degree-of-symmetry indices are based on the mean absolute left-minus-right difference, reversed so that higher values denote greater symmetry; pattern indices express the correlation between the two hemispheric profiles. Results: All 16 callosal measures were positively associated with cortical thickness symmetry and 15 reached significance, the strongest at r = −.096. The probability that 16 measures would share a direction by chance is 3.1 × 10⁻⁵. Across 128 tests of callosal structure against hemispheric similarity, 51 reached significance against 6.4 expected. The yield was concentrated in magnitude indices rather than pattern indices. Conclusions: A larger and more myelinated corpus callosum accompanies hemispheres whose cortical thickness is more symmetrical. The association concerns the degree of symmetry rather than its regional pattern.
Keywords:
corpus callosum
; hemispheric symmetry
; cortical thickness
; interhemispheric symmetry
; brain development
; ABCD Study
1. Introduction
The corpus callosum is the principal commissure connecting the cerebral hemispheres and contains approximately 200 million axons, whose caliber and myelination vary systematically along its anterior–posterior axis [1]. Its topography is established: anterior segments carry prefrontal projections, the midbody carries motor and somatosensory fibers, and the splenium carries parietal, temporal and occipital fibers [2,3].
Hemispheric asymmetry of brain is now well described at population scale. Cortical asymmetry has been mapped in more than 17,000 individuals [25] and subcortical asymmetry in nearly 16,000 [26], establishing that most regions depart only slightly from symmetry and that the departures are consistent in direction across cohorts. Asymmetry has been related to genetic and evolutionary accounts [28,29], altered in clinical populations including autism [27] and accelerated in ageing and Alzheimer's disease [30], and proposed to arise partly from intra-hemispheric white matter organization [31]. What this literature has rarely done is relate asymmetry to the commissure that connects the two sides, in the same children, across the full set of callosal measures.
Three theoretical traditions make that proposal, and they differ in what they predict. The excitatory transfer account holds that callosal fibers propagate activity between homotopic regions, so a larger or better organized commissure should produce hemispheres that are more symmetrical [4,6]. The developmental trophic account proposes that the commissure constrains structural divergence during growth irrespective of moment-to-moment signaling, because homotopic regions linked by dense projections undergo correlated activity-dependent refinement [5,8].
These traditions rest on a long descriptive literature. The callosum's fiber composition varies systematically along its anterior-posterior axis, with small-caliber fibers concentrated anteriorly and large-caliber fibers in the posterior midbody and splenium [1], a topography confirmed by diffusion tractography [2] and mapped onto motor cortex with somatotopic precision [21]. Its evolutionary history is placental-specific and long [23], and conduction delay across it has been proposed as the reason hemispheric specialization exists at all [22]. Reviews of interhemispheric transfer conclude that excitatory and inhibitory accounts are difficult to separate behaviorally [24,32], which is one reason a structural test is informative.
These accounts have been difficult to separate because hemispheric similarity is almost always reported as a regional mean difference across a sample, which cannot express how alike a given child's hemispheres are. We therefore compute similarity as a per-child quantity, and we compute it two ways: the degree of symmetry, indexed by the reversed mean absolute left-minus-right difference, and the pattern of correspondence, indexed by the correlation between the left and right regional profiles.
A second question concerns behavior. Callosal measures have been related to internalizing and externalizing symptoms in childhood, with inconsistent directions across studies [9,10]. One possible source of that inconsistency is developmental timing: if the association exists in one developmental period and not another, samples differing in pubertal composition would report different results. We therefore test whether pubertal status moderates the callosum-symptom association, and — as a control that has not previously been available — whether it moderates the symmetry-symptom association in the same children.
2. Materials and Methods
2.1. Sample
Data come from the baseline wave of the Adolescent Brain Cognitive Development (ABCD) Study, a cohort of 11,878 children recruited at ages 9 to 10 through probability sampling of school catchment areas within districts served by 21 sites [11,12]. Children passed a five-step imaging screen covering series completeness, manual quality rating, reconstruction quality, and motion and coverage criteria [13]. Analytic samples ranged from 8,131 to 8,386 depending on measurement family.
2.2. Callosal measures
The corpus callosum appears in the automated subcortical segmentation as five segments running anterior to posterior: anterior, mid-anterior, central, mid-posterior and posterior. For each we took volume in mm³ and the average normalized T1- and T2-weighted intensity within the segment, giving 15 measures, to which we added a whole-commissure volume computed as the sum across segments.
Volume and intensity were treated as distinct constructs rather than as interchangeable proxies, because in these data they dissociate. Table 1 reports their intercorrelations within segment. The reader should note in particular that T1 and T2 intensity correlate negatively throughout, so an analysis averaging them would cancel real variance, and that volume correlates with T1 and T2 in opposite directions.
2.3. Hemispheric similarity indices
For each measurement family we identified every region with a left and right counterpart, standardized each region across children, and computed per child the magnitude index (mean absolute difference between standardized left and right profiles) and the pattern index (their correlation). Each index was centered within scanner site.
2.4. Behavioral outcomes and pubertal status
Outcomes were the Child Behavior Checklist internalizing and externalizing broadband scales and their constituent syndrome scales [14], diagnosed depressive and anxiety disorders from the KSADS computerized interview, and positive and negative urgency from the UPPS-P short form for children. Pubertal status was the caregiver-reported Pubertal Development Scale, used as a binary onset indicator (n = 6,707; 73.0% past threshold).
2.5. Statistical analysis
Associations were estimated as partial correlations adjusting for age, sex, intracranial volume and mean framewise displacement. Moderation by pubertal status was tested by the interaction term in a linear model, with simple slopes estimated within pubertal strata. Because the callosal analysis comprises 128 tests, we report yield relative to chance alongside individual coefficients, and we report the sign configuration across measures with its exact binomial probability, since directional consistency across measures that are not themselves correlated is stronger evidence than any single coefficient.
3. Results
3.1. All sixteen callosal measures point the same way
Table 2 reports the association between each callosal measure and cortical thickness symmetry. Before reading the individual coefficients, note the column of signs: every one of the 16 is negative, meaning that a larger or more intense callosum accompanies more symmetrical hemispheres. Fifteen reach significance individually.
The strongest association was T1 intensity of the anterior segment at r = -0.096, p = 1.0 × 10⁻¹⁸, and the median was -0.059. The probability that 16 measures would share a direction by chance is 3.1 × 10⁻⁵. This matters more than any individual coefficient, because the measures are not simply repeated versions of one another: as Table 1 showed, T1 and T2 intensity correlate negatively within every segment. Measures that disagree with one another nonetheless agree on this.
Figure 1 displays the 16 estimates with their confidence intervals, colored by modality, so that the consistency across volume, T1 and T2 is visible.
3.2. The association concerns the degree of symmetry, not its pattern
Cortical thickness is one of eight similarity indices. Table 3 reports the yield across all of them, which establishes what the association is specific to.
Across all 128 tests, 51 reached significance against 6.4 expected, a yield of 8.0 times chance. The yield was concentrated in the magnitude indices. Figure 2 displays the same information graphically.
3.3. Callosal associations with symptoms confined to pre-pubertal children
Callosal measures related to caregiver-reported symptoms weakly at baseline. Table 4 reports the nine associations for which pubertal status significantly moderated the relationship, with the simple slope in each pubertal stratum. The column to read is the pair of slopes: in every case the pre-pubertal slope is the larger one and the post-pubertal slope is close to zero.
The gating was specific to caregiver-reported symptoms. Within the CBCL domain 9 of 80 tests reached significance, 2.25 times chance. Across the diagnosed disorder, urgency and socioeconomic domains, 0 of 144 tests reached significance. Aggregated across all 224 tests the yield was 0.80 times chance, so the CBCL result is a localized effect within an otherwise null survey and should be read with that in mind.
3.4. Puberty gates the callosum but not symmetry
The preceding result could reflect something general about brain-symptom associations in this developmental window rather than anything specific to the callosum. We therefore repeated the moderation analysis using the symmetry indices as the predictor, in the same children, with the same outcomes and the same adjustment. Table 5 compares the two.
Pubertal status moderated callosal associations with caregiver-reported symptoms at 2.25 times chance, and symmetry associations with the same symptoms at 0.42 times chance. Across all domains the callosum yielded 0.80 times chance and symmetry 0.68 times, so neither is impressive in aggregate; but the CBCL contrast is a five-fold difference in the same children, and it argues that the gating belongs to the commissure rather than to brain measures generally. Figure 3 displays both results.
4. Discussion
Children with larger or more intense corpus callosa have hemispheres that differ less in cortical thickness. All 16 callosal measures show the effect in the same direction and 15 reach significance, a configuration whose probability under the null is 3.1 × 10⁻⁵. Across 128 tests the yield is 8.0 times chance.
4.1. Directional consistency as the standard of evidence
The developmental literature provides the context for interpreting these associations. Callosal area increases through childhood and adolescence [9,20], with posterior regions maturing later than anterior ones [33], and the growth reflects both axonal and myelin change [10]. Sex differences in callosal size have been claimed repeatedly and largely attributed to scaling rather than to sexual dimorphism once brain size is accounted for [19,34], which is why our analyses treat callosal measures in relation to symmetry rather than in relation to sex alone.
Brain-wide association effects in population cohorts are small and frequently fail to replicate [15]. The largest coefficient reported here is r = −.096, which explains under one percent of variance. We therefore rest the claim on directional agreement rather than magnitude. Sixteen measures agreeing on a sign is not the same as sixteen correlated measures agreeing: T1 and T2 intensity correlate negatively within every segment (Table 1), and volume relates to them in opposite directions. Measures that disagree with one another about the tissue nonetheless agree about the hemispheres.
4.2. Which theoretical account the pattern favors
The three accounts introduced above make separable predictions, and the results distinguish them. The excitatory transfer and inhibitory accounts both concern function, predicting that callosal capacity should relate to how similarly or differently the hemispheres operate [4,6,7].
We note the limits of this inference. The design is cross-sectional, so it establishes covariation rather than constraint. And the available measures index callosal size and signal intensity, not fiber organization; diffusion within the tract, which the trophic account most directly implicates, is not distributed in this release. Distinguishing the accounts decisively will require microstructural measures that must be derived.
4.3. Degree of symmetry but not its pattern
The dissociation between the two similarity indices is informative. A child whose hemispheres differ less in amount at each region, without differing in which regions are relatively large or small, has hemispheres that are scaled more alike rather than organized more alike. That is what these results describe. The pattern indices yielded far less, and the strongest pattern association was r = −.068. A callosal influence on which regions depart from symmetry would have produced the reverse.
4.4. Puberty gates the callosum but not symmetry
Callosal associations with caregiver-reported symptoms were confined to children before pubertal onset, with pre-pubertal slopes near ±.05 falling to approximately zero afterward. The same moderation was absent when hemispheric symmetry replaced the callosum as predictor, in the same children with the same outcomes: 2.25 times chance against 0.42 times chance.
This dissociation is the reason we regard the gating as substantive rather than incidental. Had both predictors shown it, the result would plausibly reflect something general about brain-behavior associations across this transition — for instance that symptom reporting changes at puberty. That only the callosum shows it argues for something specific to the commissure. We state the caveat plainly: aggregated across all 224 tests the callosal moderation yield was 0.80 times chance, so the effect is localized to one outcome domain and requires within-person confirmation.
4.5. Macrostructure and microstructure should not be conflated
A practical implication follows from Table 1. Callosal volume and T2 intensity correlate positively, T1 and T2 correlate negatively between −.17 and −.42, and volume relates to T1 and T2 in opposite directions. A literature treating callosal size as a proxy for callosal integrity therefore rests on an assumption these data do not support. Studies combining such measures into a composite risk cancelling real variance, and studies using one as a stand-in for another may reach opposite conclusions from the same brains.
4.6. Limitations
The design is cross-sectional at ages 9 to 10; whether callosal-symmetry covariation reflects a constraint operating during growth cannot be established without longitudinal measurement, which the cohort's follow-up waves will supply. Callosal microstructure is unavailable, so the theoretical discrimination in section 4.2 remains partial. Similarity indices are computed from one parcellation per family. The pre-pubertal stratum (n = 1,811) is smaller than the post-pubertal (n = 4,896), so the stratified slopes differ in precision; we report the interaction test rather than comparing significance across strata. All effects are small: none exceeds |r| = .096.
5. Conclusions
A larger and more intense corpus callosum accompanies hemispheres that are built more alike, with a consistency across 16 measures that is unusual in brain-wide association work. The association concerns structural magnitude rather than regional pattern, and structure rather than function. Callosal associations with behavioral symptoms are confined to children before pubertal onset, and hemispheric symmetry shows no comparable gating. The commissure carries developmental information that a global asymmetry index does not.
Author Contributions
Conceptualization, S.A.; methodology, S.A.; formal analysis, S.A.; writing—original draft preparation, S.A.; writing—review and editing, B.N. and A.D. All authors have read and agreed to the published version of the manuscript.
Funding
Shervin Assari is supported by funds provided by The Regents of the University of California, Tobacco-Related Diseases Research Program, Grant Number T32IR5355. No funders had any role in the design of the study or in the analyses or interpretation of the data.
Data Availability Statement
The data analyzed in this study are available to qualified researchers from the ABCD Study through the NIMH Data Archive (https://nda.nih.gov/abcd).
Acknowledgments
Data used in the preparation of this article were obtained from the Adolescent Brain Cognitive Development (ABCD) Study, held in the NIMH Data Archive.
Conflicts of Interest
The author declares no conflicts of interest.
References
- Aboitiz, F.; Scheibel, A. B.; Fisher, R. S.; Zaidel, E. Fiber composition of the human corpus callosum. Brain Res. 1992, 598(1–2), 143–153. [Google Scholar] [CrossRef] [PubMed]
- Hofer, S.; Frahm, J. Topography of the human corpus callosum revisited. NeuroImage 2006, 32(3), 989–994. [Google Scholar] [CrossRef] [PubMed]
- Witelson, S. F. Hand and sex differences in the isthmus and genu of the human corpus callosum: A postmortem morphological study. Brain 1989, 112(3), 799–835. [Google Scholar] [CrossRef] [PubMed]
- Gazzaniga, M. S. Cerebral specialization and interhemispheric communication: Does the corpus callosum enable the human condition? Brain 2000, 123(7), 1293–1326. [Google Scholar] [CrossRef] [PubMed]
- Innocenti, G. M.; Price, D. J. Exuberance in the development of cortical networks. Nat. Rev. Neurosci. 2005, 6(12), 955–965. [Google Scholar] [CrossRef] [PubMed]
- Bloom, J. S.; Hynd, G. W. The role of the corpus callosum in interhemispheric transfer of information: Excitation or inhibition? Neuropsychol. Rev. 2005, 15(2), 59–71. [Google Scholar] [CrossRef] [PubMed]
- Cook, N. D. Homotopic callosal inhibition. Brain Lang. 1984, 23(1), 116–125. [Google Scholar] [CrossRef] [PubMed]
- Toga, A. W.; Thompson, P. M. Mapping brain asymmetry. Nat. Rev. Neurosci. 2003, 4(1), 37–48. [Google Scholar] [CrossRef] [PubMed]
- Luders, E.; Thompson, P. M.; Toga, A. W. The development of the corpus callosum in the healthy human brain. J. Neurosci. 2010, 30(33), 10985–10990. [Google Scholar] [CrossRef] [PubMed]
- Paus, T. Growth of white matter in the adolescent brain: Myelin or axon? Brain Cogn. 2010, 72(1), 26–35. [Google Scholar] [CrossRef] [PubMed]
- Casey, B. J.; Cannonier, T.; Conley, M. I.; Cohen, A. O.; Barch, D. M.; Heitzeg, M. M.; …; Dale, A. M. The Adolescent Brain Cognitive Development (ABCD) study: Imaging acquisition across 21 sites. Dev. Cogn. Neurosci. 2018, 32, 43–54. [Google Scholar] [CrossRef] [PubMed]
- Garavan, H.; Bartsch, H.; Conway, K.; Decastro, A.; Goldstein, R. Z.; Heeringa, S.; …; Zahs, D. Recruiting the ABCD sample: Design considerations and procedures. Dev. Cogn. Neurosci. 2018, 32, 16–22. [Google Scholar] [CrossRef] [PubMed]
- Hagler, D. J.; Hatton, S.; Cornejo, M. D.; Makowski, C.; Fair, D. A.; Dick, A. S.; …; Dale, A. M. Image processing and analysis methods for the Adolescent Brain Cognitive Development Study. NeuroImage 2019, 202, 116091. [Google Scholar] [CrossRef] [PubMed]
- Achenbach, T. M.; Rescorla, L. A. Manual for the ASEBA school-age forms and profiles; University of Vermont, Research Center for Children, Youth, and Families, 2001. [Google Scholar]
- Marek, S.; Tervo-Clemmens, B.; Calabro, F. J.; Montez, D. F.; Kay, B. P.; Hatoum, A. S.; …; Dosenbach, N. U. F. Reproducible brain-wide association studies require thousands of individuals. Nature 2022, 603(7902), 654–660. [Google Scholar] [CrossRef] [PubMed]
- Jones, D. K.; Knösche, T. R.; Turner, R. White matter integrity, fiber count, and other fallacies: The do’s and don’ts of diffusion MRI. NeuroImage 2013, 73, 239–254. [Google Scholar] [CrossRef] [PubMed]
- Glasser, M. F.; Van Essen, D. C. Mapping human cortical areas in vivo based on myelin content as revealed by T1- and T2-weighted MRI. J. Neurosci. 2011, 31(32), 11597–11616. [Google Scholar] [CrossRef] [PubMed]
- Herting, M. M.; Sowell, E. R. Puberty and structural brain development in humans. Front. Neuroendocrinol. 2017, 44, 122–137. [Google Scholar] [CrossRef] [PubMed]
- Bishop, K. M.; Wahlsten, D. Sex differences in the human corpus callosum: Myth or reality? Neurosci. Biobehav. Rev. 1997, 21(5), 581–601. [Google Scholar] [CrossRef] [PubMed]
- Giedd, J. N.; Rumsey, J. M.; Castellanos, F. X.; Rajapakse, J. C.; Kaysen, D.; Vaituzis, A. C.; …; Rapoport, J. L. A quantitative MRI study of the corpus callosum in children and adolescents. Dev. Brain Res. 1996, 91(2), 274–280. [Google Scholar] [CrossRef] [PubMed]
- Wahl, M.; Lauterbach-Soon, B.; Hattingen, E.; Jung, P.; Singer, O.; Volz, S.; …; Ziemann, U. Human motor corpus callosum: Topography, somatotopy, and link between microstructure and function. J. Neurosci. 2007, 27(45), 12132–12138. [Google Scholar] [CrossRef] [PubMed]
- Ringo, J. L.; Doty, R. W.; Demeter, S.; Simard, P. Y. Time is of the essence: A conjecture that hemispheric specialization arises from interhemispheric conduction delay. Cereb. Cortex 1994, 4(4), 331–343. [Google Scholar] [CrossRef] [PubMed]
- Aboitiz, F.; Montiel, J. One hundred million years of interhemispheric communication: The history of the corpus callosum. Braz. J. Med. Biol. Res. 2003, 36(4), 409–420. [Google Scholar] [CrossRef] [PubMed]
- van der Knaap, L. J.; van der Ham, I. J. M. How does the corpus callosum mediate interhemispheric transfer? A review. Behav. Brain Res. 2011, 223(1), 211–221. [Google Scholar] [CrossRef] [PubMed]
- Kong, X.-Z.; Mathias, S. R.; Guadalupe, T.; Glahn, D. C.; Franke, B.; Crivello, F.; …; Francks, C. Mapping cortical brain asymmetry in 17,141 healthy individuals worldwide via the ENIGMA Consortium. Proc. Natl. Acad. Sci. 2018, 115(22), E5154–E5163. [Google Scholar] [CrossRef] [PubMed]
- Guadalupe, T.; Mathias, S. R.; vanErp, T. G. M.; Whelan, C. D.; Zwiers, M. P.; Abe, Y.; …; Francks, C. Human subcortical brain asymmetries in 15,847 people worldwide reveal effects of age and sex. Brain Imaging Behav. 2017, 11(5), 1497–1514. [Google Scholar] [CrossRef] [PubMed]
- Postema, M. C.; van Rooij, D.; Anagnostou, E.; Arango, C.; Auzias, G.; Behrmann, M.; …; Francks, C. Altered structural brain asymmetry in autism spectrum disorder in a study of 54 datasets. Nat. Commun. 2019, 10, 4958. [Google Scholar] [CrossRef] [PubMed]
- Corballis, M. C. The evolution and genetics of cerebral asymmetry. Philos. Trans. R. Soc. B 2009, 364(1519), 867–879. [Google Scholar] [CrossRef] [PubMed]
- Geschwind, N.; Galaburda, A. M. Cerebral lateralization: Biological mechanisms, associations, and pathology. Arch. Neurol. 1985, 42(5), 428–459. [Google Scholar] [PubMed]
- Roe, J. M.; Vidal-Piñeiro, D.; Sneve, M. H.; Kompus, K.; Greve, D. N.; Walhovd, K. B.; …; Westerhausen, R. Asymmetric thinning of the cerebral cortex across the adult lifespan is accelerated in Alzheimer’s disease. Nat. Commun. 2021, 12, 721. [Google Scholar] [CrossRef] [PubMed]
- Ocklenburg, S.; Friedrich, P.; Güntürkün, O.; Genc, E. Intrahemispheric white matter asymmetries: The missing link between brain structure and functional lateralization? Rev. Neurosci. 2016, 27(5), 465–480. [Google Scholar] [CrossRef] [PubMed]
- Westerhausen, R.; Hugdahl, K. The corpus callosum in dichotic listening studies of hemispheric asymmetry: A review of clinical and experimental evidence. Neurosci. Biobehav. Rev. 2008, 32(5), 1044–1054. [Google Scholar] [CrossRef] [PubMed]
- Luders, E.; Narr, K. L.; Zaidel, E.; Thompson, P. M.; Toga, A. W. Gender effects on callosal thickness in scaled and unscaled space. NeuroReport 2006, 17(11), 1103–1106. [Google Scholar] [CrossRef] [PubMed]
- Tanaka-Arakawa, M. M.; Matsui, M.; Tanaka, C.; Uematsu, A.; Uda, S.; Miura, K.; …; Noguchi, K. Developmental changes in the corpus callosum from infancy to early adulthood. PLoS ONE 2015, 10(3), e0118760. [Google Scholar] [CrossRef] [PubMed]
Figure 1.
Association between each callosal measure and cortical thickness symmetry, with 95% confidence intervals. Color denotes modality. Asterisks denote * p < .05, ** p < .01, *** p < .001.
Figure 1.
Association between each callosal measure and cortical thickness symmetry, with 95% confidence intervals. Color denotes modality. Asterisks denote * p < .05, ** p < .01, *** p < .001.
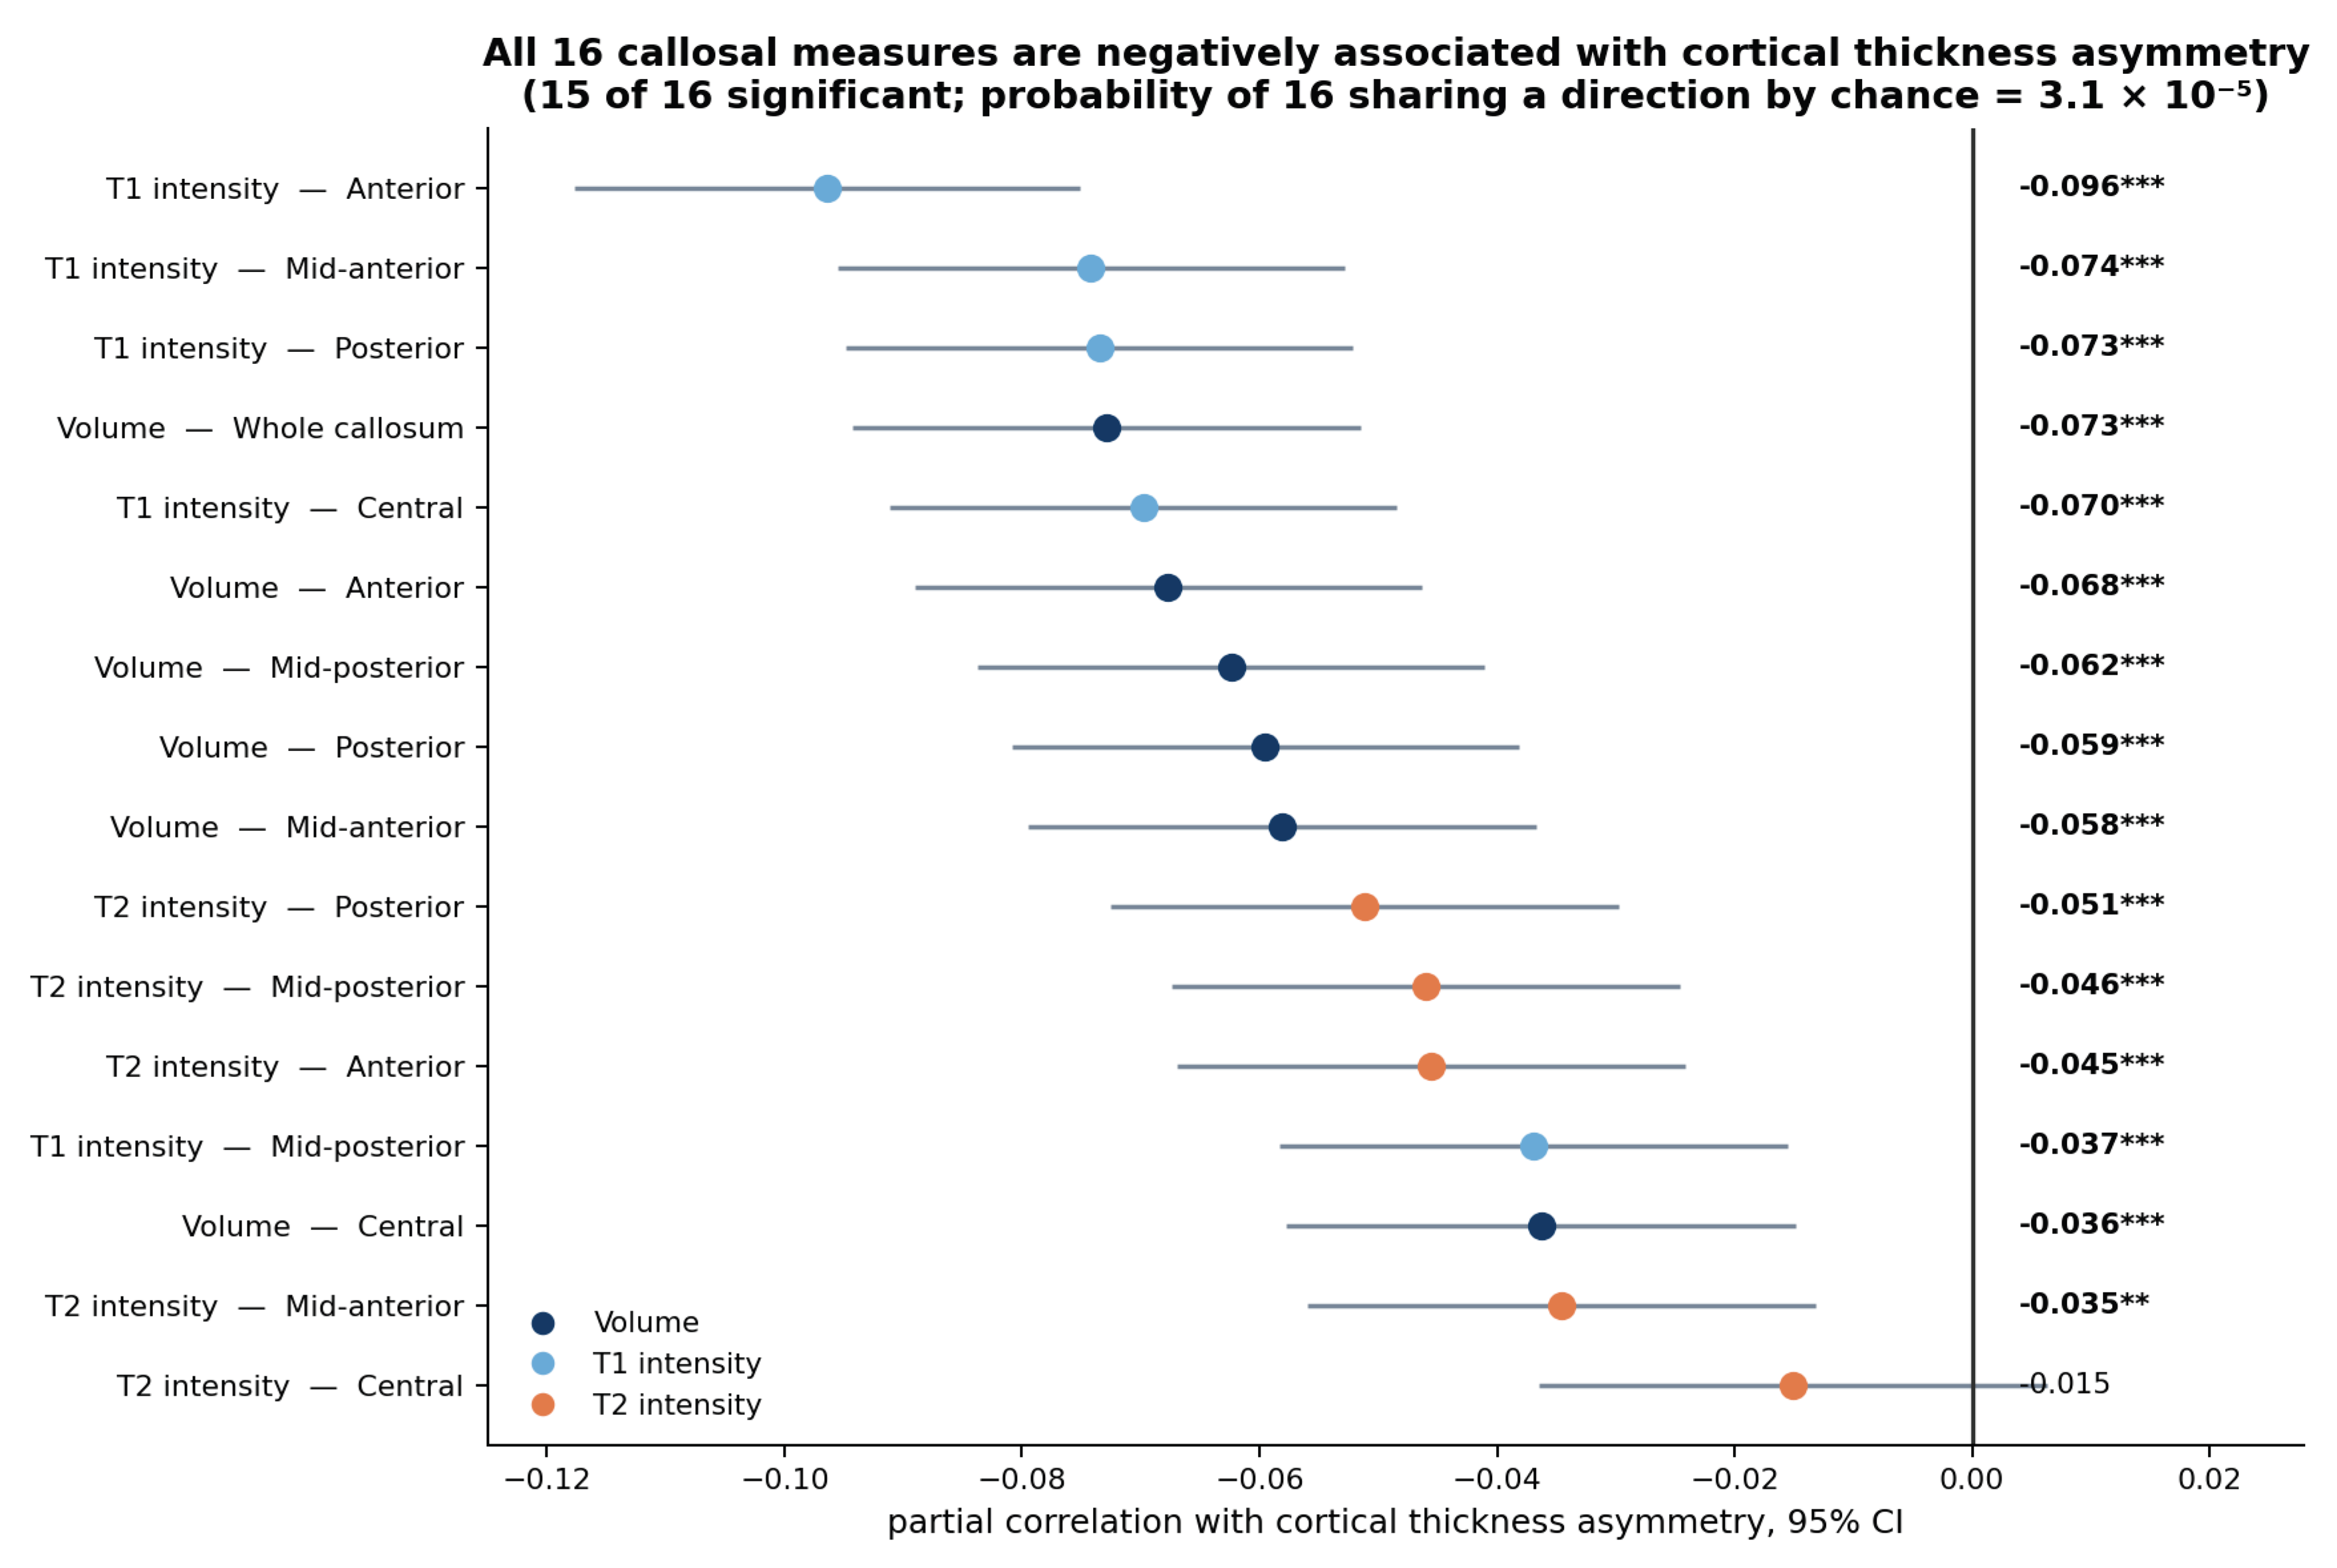
Figure 2.
Yield of significant callosal associations by similarity index, expressed as the ratio of observed to chance-expected significant tests. Navy bars denote magnitude indices, grey bars pattern indices. The dashed line marks the chance rate.
Figure 2.
Yield of significant callosal associations by similarity index, expressed as the ratio of observed to chance-expected significant tests. Navy bars denote magnitude indices, grey bars pattern indices. The dashed line marks the chance rate.
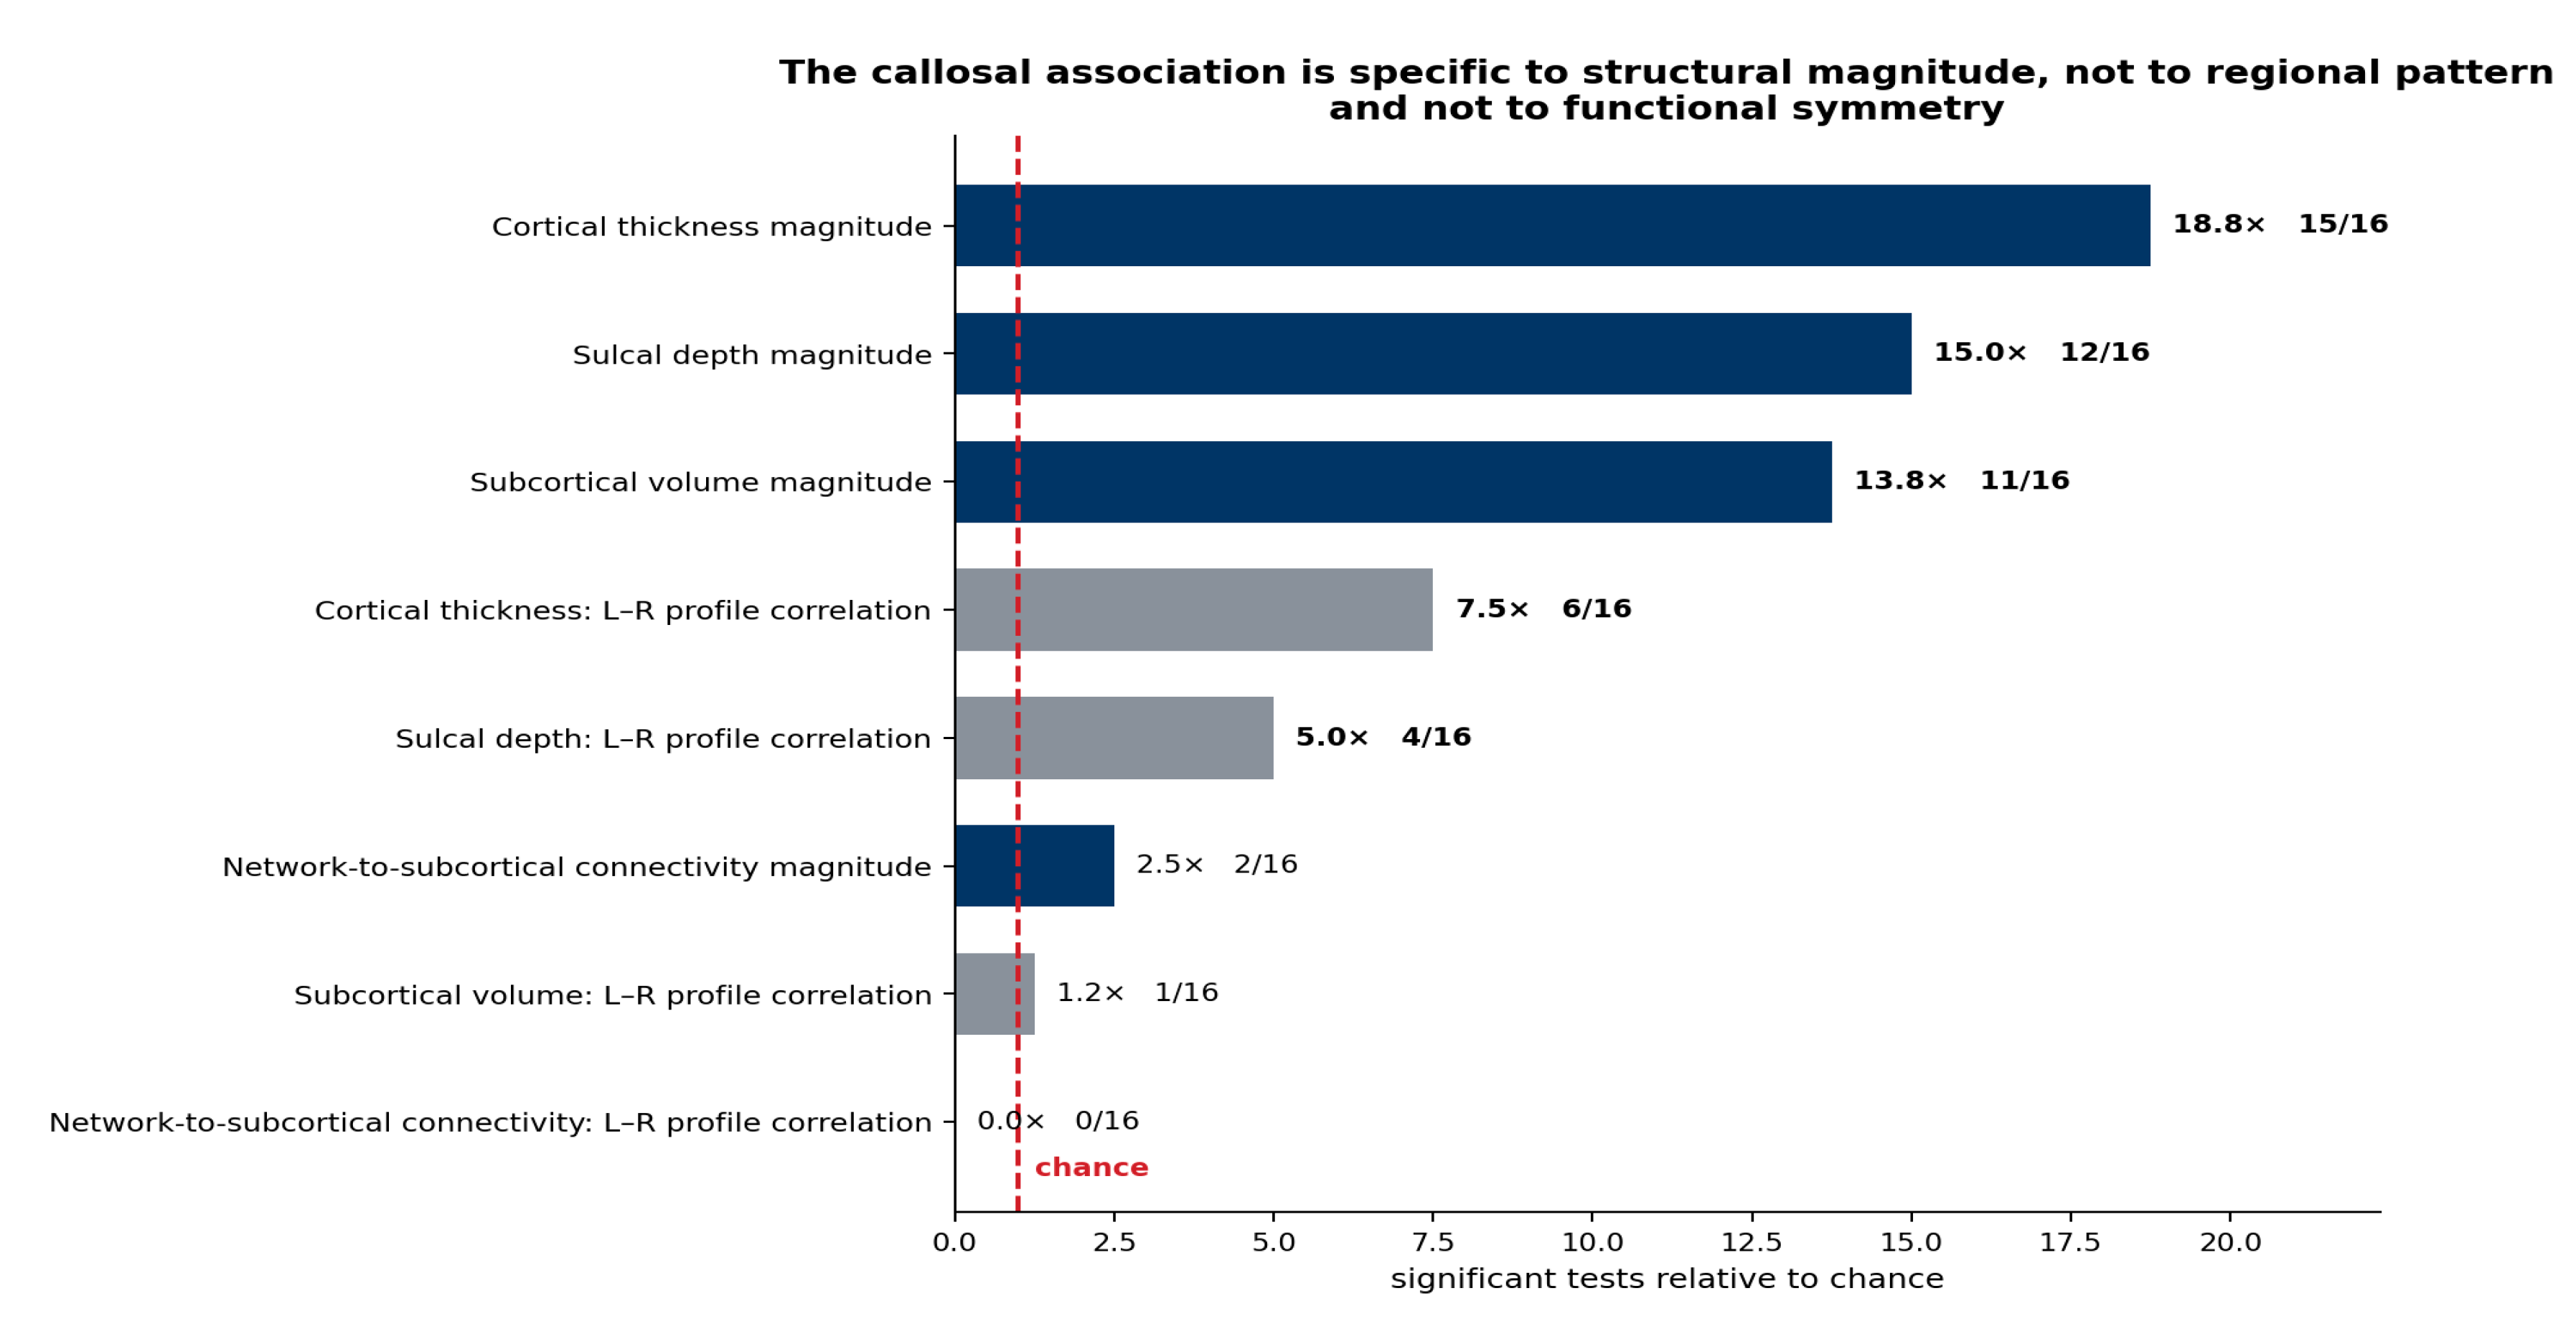
Figure 3.
(A) The nine callosal associations for which pubertal status was a significant moderator, showing simple slopes in each pubertal stratum. (B) Pubertal moderation by outcome domain, comparing the callosum with hemispheric symmetry as predictor. The dashed line marks the chance rate.
Figure 3.
(A) The nine callosal associations for which pubertal status was a significant moderator, showing simple slopes in each pubertal stratum. (B) Pubertal moderation by outcome domain, comparing the callosum with hemispheric symmetry as predictor. The dashed line marks the chance rate.
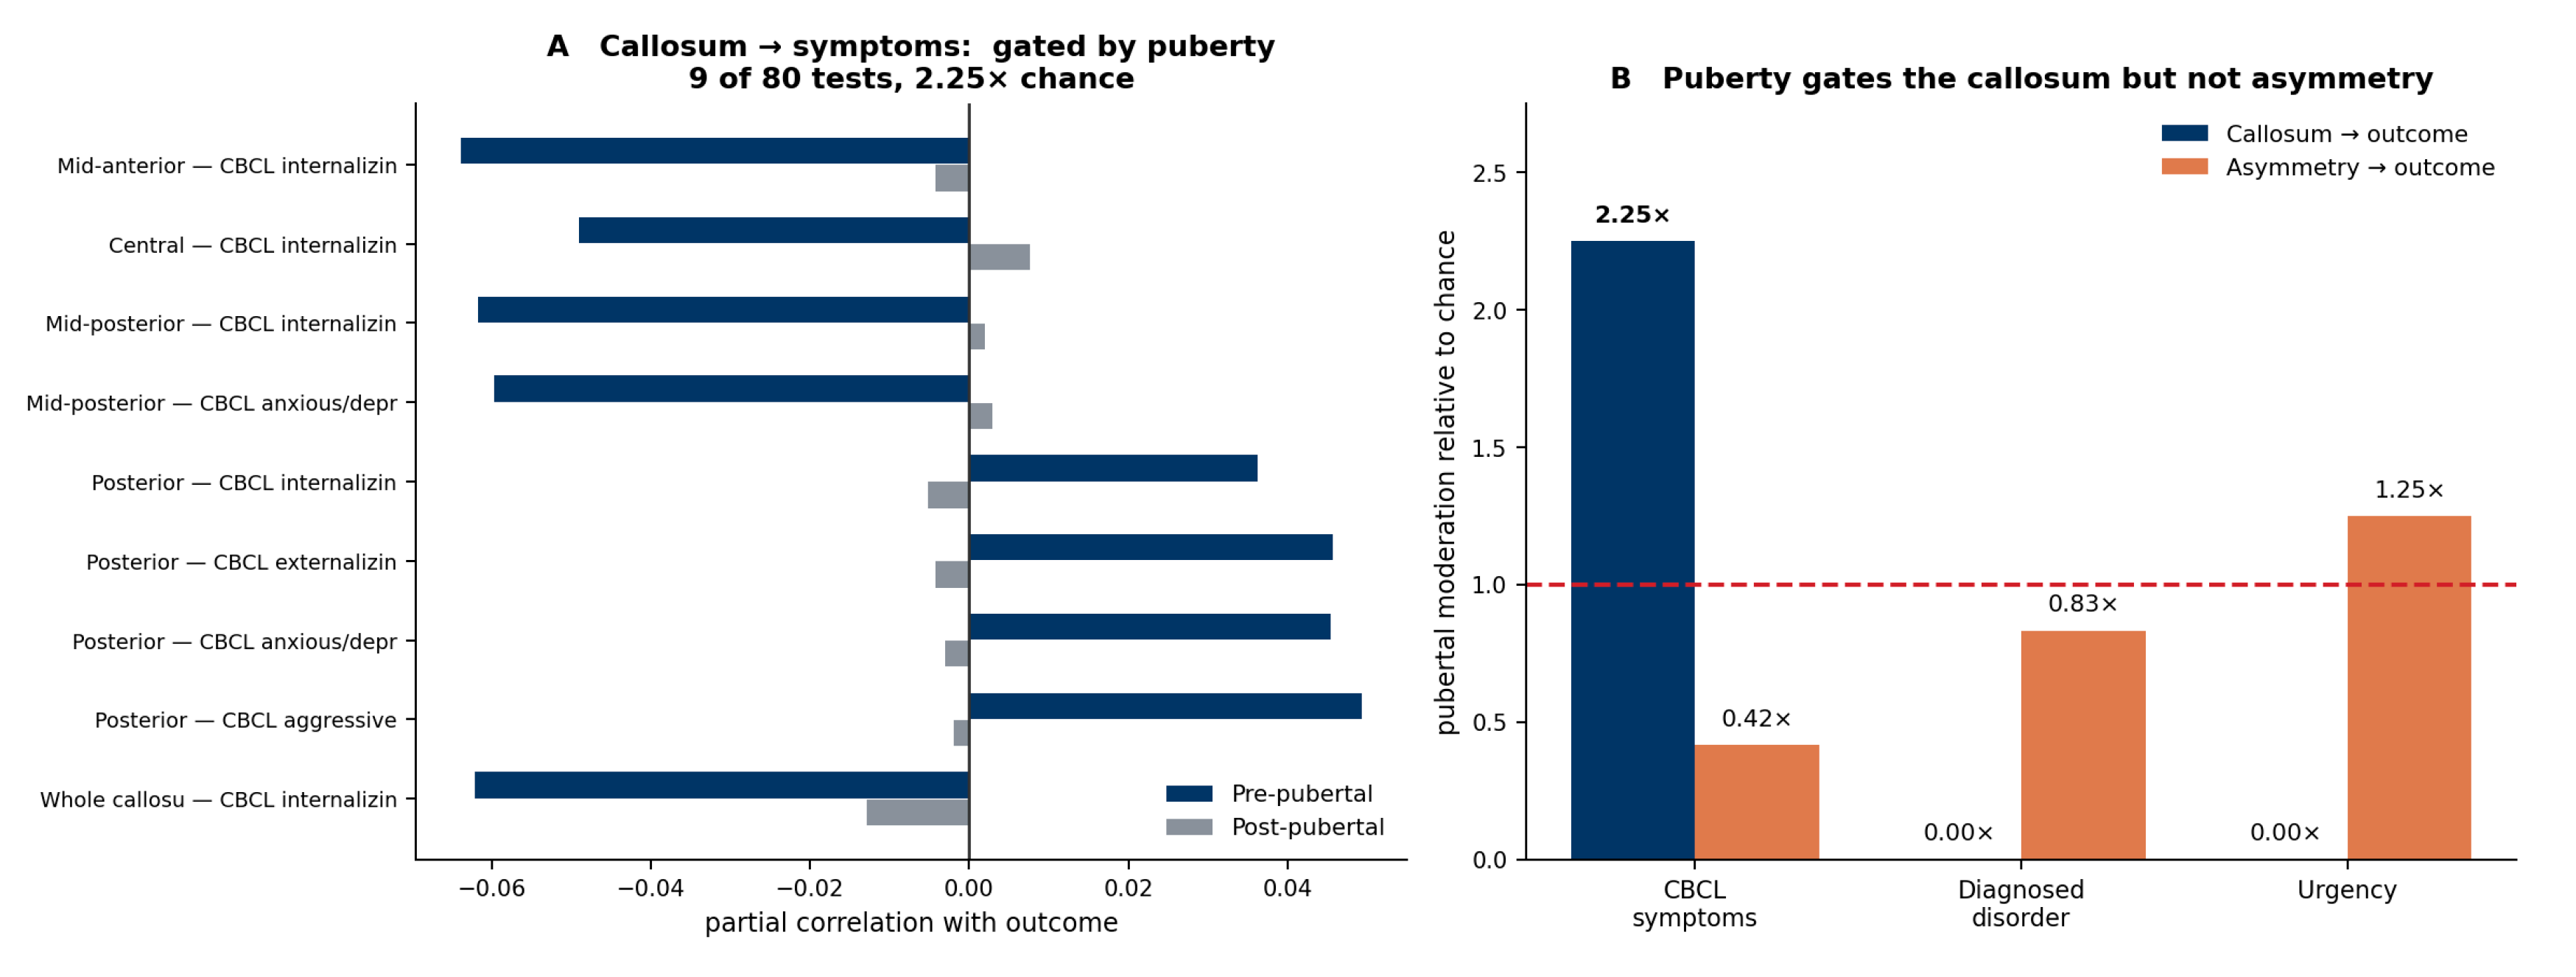

Table 1.
Intercorrelation of callosal measures within segment.
| Segment | Volume × T1 | Volume × T2 | T1 × T2 |
| Anterior | -0.063 | +0.182 | -0.169 |
| Mid-anterior | -0.318 | +0.480 | -0.418 |
| Central | -0.293 | +0.465 | -0.415 |
| Mid-posterior | +0.029 | +0.245 | -0.416 |
| Posterior | -0.049 | +0.218 | -0.202 |
Note. Pearson correlations, site-centered, n = 8,386. All three measures index different tissue properties, and the sign reversals indicate they cannot be combined into a single composite.
Table 2.
Callosal measures and cortical thickness symmetry.
| Modality | Segment | r | p | n |
| T1 intensity | Anterior | -0.0964*** | 1.0e-18 | 8,373 |
| T1 intensity | Mid-anterior | -0.0742*** | 1.1e-11 | 8,373 |
| T1 intensity | Posterior | -0.0735*** | 1.7e-11 | 8,373 |
| Volume | Whole callosum | -0.0729*** | 2.5e-11 | 8,374 |
| T1 intensity | Central | -0.0698*** | 1.6e-10 | 8,373 |
| Volume | Anterior | -0.0677*** | 5.5e-10 | 8,374 |
| Volume | Mid-posterior | -0.0624*** | 1.1e-08 | 8,374 |
| Volume | Posterior | -0.0595*** | 5.1e-08 | 8,374 |
| Volume | Mid-anterior | -0.0581*** | 1.0e-07 | 8,374 |
| T2 intensity | Posterior | -0.0511*** | 2.9e-06 | 8,373 |
| T2 intensity | Mid-posterior | -0.0460*** | 2.5e-05 | 8,373 |
| T2 intensity | Anterior | -0.0455*** | 3.1e-05 | 8,373 |
| T1 intensity | Mid-posterior | -0.0369*** | 7.4e-04 | 8,373 |
| Volume | Central | -0.0363*** | 9.0e-04 | 8,374 |
| T2 intensity | Mid-anterior | -0.0346** | 0.002 | 8,373 |
| T2 intensity | Central | -0.0151 | 0.166 | 8,373 |
Note. Partial correlations adjusted for age, sex, intracranial volume and head motion, site-centered. Negative values indicate that greater callosal volume or intensity accompanies greater hemispheric symmetry. * p < .05, ** p < .01, *** p < .001.
Table 3.
Yield of callosal associations across the eight similarity indices.
| Measurement family | Index | Significant | Ratio to chance | Largest |r| |
| Cortical thickness | Magnitude | 15/16 | 18.75× | -0.096 |
| Sulcal depth | Magnitude | 12/16 | 15.00× | -0.058 |
| Subcortical volume | Magnitude | 11/16 | 13.75× | -0.097 |
| Cortical thickness | Pattern | 6/16 | 7.50× | -0.068 |
| Sulcal depth | Pattern | 4/16 | 5.00× | -0.037 |
| Network-to-subcortical connectivity | Magnitude | 2/16 | 2.50× | -0.030 |
| Subcortical volume | Pattern | 1/16 | 1.25× | +0.023 |
| Network-to-subcortical connectivity | Pattern | 0/16 | 0.00× | +0.021 |
Note. Each index was tested against all 16 callosal measures. Ratio is observed significant tests divided by the number expected at p < .05.
Table 4.
Associations for which pubertal status moderated the callosum-symptom link.
| Callosal measure | Outcome | Pre-pubertal r | Post-pubertal r | p, interaction |
| Volume, Mid-anterior | CBCL internalizing | -0.064 | -0.004 | 0.007 |
| Volume, Central | CBCL internalizing | -0.049 | +0.008 | 0.017 |
| Volume, Mid-posterior | CBCL internalizing | -0.062 | +0.002 | 0.007 |
| Volume, Mid-posterior | CBCL anxious/depressed | -0.060 | +0.003 | 0.010 |
| T1 intensity, Posterior | CBCL internalizing | +0.036 | -0.005 | 0.035 |
| T1 intensity, Posterior | CBCL externalizing | +0.046 | -0.004 | 0.045 |
| T1 intensity, Posterior | CBCL anxious/depressed | +0.045 | -0.003 | 0.032 |
| T1 intensity, Posterior | CBCL aggressive | +0.049 | -0.002 | 0.047 |
| Volume, Whole callosum | CBCL internalizing | -0.062 | -0.013 | 0.013 |
Note. Simple slopes within pubertal strata, adjusted for age, sex, intracranial volume and head motion. Pre-pubertal n = 1,811; post-pubertal n = 4,896. Nine of 80 tests in the CBCL domain reached significance, 2.25 times chance.
Table 5.
Pubertal moderation: callosum compared with hemispheric symmetry.
| Outcome domain | Callosum: sig. | Ratio | Symmetry: sig. | Ratio |
| Caregiver-reported symptoms | 9/80 | 2.25× | 1/48 | 0.42× |
| Diagnosed disorder | — | — | 1/24 | 0.83× |
| Urgency | 0/32 | 0.00× | 1/16 | 1.25× |
| All domains combined | 9/224 | 0.80× | 3/88 | 0.68× |
Note. Identical models, children, outcomes and adjustment; only the brain predictor differs. Ratios are observed significant tests divided by chance expectation.
Disclaimer/Publisher’s Note: The statements, opinions and data contained in all publications are solely those of the individual author(s) and contributor(s) and not of MDPI and/or the editor(s). MDPI and/or the editor(s) disclaim responsibility for any injury to people or property resulting from any ideas, methods, instructions or products referred to in the content. |
© 2026 by the authors. Licensee MDPI, Basel, Switzerland. This article is an open access article distributed under the terms and conditions of the Creative Commons Attribution (CC BY) license (http://creativecommons.org/licenses/by/4.0/).
Copyright: This open access article is published under a Creative Commons CC BY 4.0 license, which permit the free download, distribution, and reuse, provided that the author and preprint are cited in any reuse.