

Submitted:
03 October 2026
Posted:
06 October 2026
You are already at the latest version
Abstract
Background:Liver diseases constitute one of the most prevalent global health problems that cause millions of deaths every year. Identification of potential patients even prior to their diagnosis could improve the efficacy of screening procedures and ensure timely interventions. Despite promising results yielded by Al and ML techniques in disease diagnostics, current models tend to be opaque and focus on binary disease prediction rather than pre-symptom detection. Methods: We propose a novel XAI-LiverSHAPNet framework to detect for liver disease stratification by employing ensemble machine learning. A publicly accessible synthetic dataset containing 1,700 patients records with 11 features was first prepared by removing outliers and imputing missing values and SMOTE oversampling was performed in order to balance classes in the data. LR, SVM, DT, RF, GB, KNN, CatBoost, XGBoost, and Extra Trees were tested individually and as stacking and voting ensembles. Latent relationships within the data set were discovered using t-distributed Stochastic Neighbor Embedding (t-SNE) and Uniform Manifold Approximation and Projection (UMAP). Unlike previous studies, the proposed model allows the identification of patients at high risk on the basis of the existing characteristics, facilitating risk stratification without necessarily needing data on symptoms. Additionally, conducted study further contributes methodological novelty through feature-level ablation analysis to evaluate the impact of key variables. The XAI-LiverSHAPNet framework follows a three-tiered analysis pipeline featuring data preprocessing and balancing, ensemble modeling, and interpretation through explainable AI. Results: XAI-LiverSHAPNet outperformed baseline and ensemble competitors, achieving a specificity of 97.19%, ROC-AUC of 96.61%, precision of 94.62%, recall of 94.24%, F1-score of 94.38%, and mean cross-validation accuracy of 93.12% (SD = 0.0151). The SHAP approach found that AlcoholConsumption, LiverFunctionTest, and Age had the greatest impact on the outcome, with the removal of all three parameters significantly decreasing model accuracy to around 70 percent. The statistical analysis revealed that the suggested model provided significantly better results than the Voting method for probabilistic calibration measures, namely Brier Score and Log Loss (p < 0.05). Conclusion: The presented XAI-LiverSHAPNet framework shows promise as a clinical decision support tool for liver disease risk stratification, where further validation is necessary on large-scale, multi-center data.
Keywords:
liver disease
; explainable artificial intelligence
; ensemble machine learning
; risk stratification
; SHAP analysis
; clinical decision support
; predictive modeling
; medical AI
1. Introduction
Liver diseases constitute one of the main public health problems globally, as they contribute to global morbidity and mortality, with MASLD alone affecting around 1.3 billion people and having a significant role in global liver disease epidemiology [1]. The disease impact is disproportionately higher in men, with chronic conditions such as cirrhosis often arising from viral hepatitis, alcohol misuse, or nonalcoholic fatty liver disease (NAFLD), while hepatocellular carcinoma contributes substantially to mortality [2]. Acute hepatitis and drug-induced liver injury add to the existing woes, making it more important than ever before that there be better and more efficient methods for diagnosing them [3]. Accurate and rapid diagnosis plays an important role in treatment planning for better clinical outcomes. Conventional diagnostic methods like liver function tests, imaging, and biopsy are limited by invasiveness, costs, sampling errors, and lower sensitivity in detecting the condition at an early stage [4]. This has raised the pressing need for developing novel non-invasive, cost-effective, and precise diagnostic techniques. This has raised the pressing need for developing novel non-invasive, cost-effective, and precise diagnostic techniques. However, several challenges, including data quality issues, model interpretability limitations, clinical integration barriers, insufficient validation, optimization constraints, and poor generalization across populations, continue to hinder the widespread adoption of AI-based liver disease prediction systems Figure 1.
The early identification of patients who are prone to developing diseases is difficult using existing statistical models since they do not adequately account for the nonlinearity in the data. In order to solve this problem, we adopt ML approaches in addition to visualizations like t-distributed Stochastic Neighbor Embedding (t-SNE) [5]. The approach helps project higher dimensional features of patients into a lower dimensional plane while identifying hidden patterns that exist between apparently healthy patients and those suffering from diseases. Artificial Intelligence (AI) and machine learning (ML) algorithms have shown tremendous promise in transcending the confines of traditional diagnostics by uncovering multifaceted relationships [6]. Combination algorithms that use imaging, biochemical data, and patient history will be able to detect diseases in a more timely manner, whereas ML algorithms applied to a structured dataset consisting of liver enzymes, demographics, and lifestyle choices will be able to predict the occurrence of the disease [7]. Transparency and interpretability of AI-based predictions are crucial for building trust and uptake of AI solutions in a clinical setting. Explainable AI (XAI) approaches, like SHAP, allow feature interpretation and make the transition from black-box AI models to clinically meaningful conclusions feasible [8].
Unlike prior studies that primarily focus on binary classification of liver conditions, this work proposes a three-tier framework for liver disease risk profiling, incorporating t-SNE and UMAP to capture latent and transitional patterns in the data.
- Comprehensive Machine Learning Benchmarking: A comprehensive suite of both classical and state-of-the-art (SOTA) machine learning algorithms, such as LR (Logistic Regression), SVM (Support Vector Machine), DT (Decision Tree), RF (Random Forest), GB (Gradient Boosting), KNN (K-Nearest Neighbors), CatBoost, XGBoost, and ET (Extra Trees), are evaluated for liver disease risk stratification.
-
Explainable Ensemble Learning Framework: These are the major contributions of this paper: (i) We have introduced XAI-LiverSHAPNet that is an ensemble model based on stacking that uses CatBoost, Gradient Boosting, and Logistic Regression as a meta-classifier for binary classification of liver disease; (ii) We have included explainability using SHAP for the generation of clear and understandable predictions in a Healthy vs Diseased scenario; (iii) We have performed feature analysis as well as ablation experiments to evaluate the impact of clinical, lifestyle, and genetic factors; and (iv) We have applied extensive preprocessing and class balancing along with various performance metrics.This study introduces XAI-LiverSHAPNet, a stacking ensemble of baseline CatBoost and Gradient Boosting models along with logistic regression as the meta-model. The framework integrates SHAP-centric interpretability and applied feature level ablation study on the influence of various features such as clinical and lifestyle factors.
- Exploratory Data Analysis: A through exploratory data analysis (EDA) was conducted using univariate and bivariate analysis and heatmaps for correlation to analyze distribution and relationships between features. In addition, t-SNE and UMAP were utilized to visualize high-dimensional data in lower dimensional space, allowing us to see distinct latent structures and clustering among patients.
- Performance Quantification: The proposed framework was assessed through a holistic and multi-metric approach that entailed Accuracy, F1-score, MCC, Cohen’s Kappa, Balanced Accuracy, Youden’s J, ROC AUC, PR AUC, Brier Score, and Log Loss in order to provide a thorough analysis of its discriminating power and model reliability.
- Statistical Evaluation: We apply stringent validation through an extensive statistical measures for ensuring a high level of reliability while assessing the results. In this regard, we employ both parametric and non-parametric methods for performing significance tests including, paired t-test, the one-way ANOVA test, and the Wilcoxon signed-rank test.
- Ablation-Based Feature Analysis: We conduct a comprehensive feature ablation analysis to comprehensively measure the effect of the individual features through step-by-step elimination of the features and observing their performance contribution (in terms of Accuracy, MCC, Precision, Recall, and F1-score) and conclude that Diabetes, Hypertension, and Physical Activity are the significant predictors liver disease.
The following sections of the paper are organized as follows: The Introduction section gives an overview of the background and motivation behind this study. The Literature Review section lays the theoretical framework and the background for this study through the discussion of existing literature, identifying the gaps and motivation for this method. Proposed Methodology covers the data preprocessing process, along with the use of classical and state-of-the-art classifiers. The The Results and Discussion section shows the results of experiments, including the analysis and interpretation of the results. Conclusion concludes this study and gives suggestions for future research directions.
2. Materials and Methods
The synthetic dataset utilized in this experiment was obtained from Kaggle [9] and consists of 1,700 medical records, comprising 11 attributes that include patient demographics, lifestyle characteristics, other diseases, lab test scores, and diagnosis status. Output attribute indicates whether the patient is healthy or diseased with binary values 0 and 1 for the Healthy and Diseased class, respectively. The data set consists of continuous and discrete attributes such as Age, Gender, Body Mass Index (BMI), Alcohol Intake, Smoking Status, Genes, Lifestyle, Diabetes, Hypertension, and Liver Function Test (LFT) Score, described further in Table 1.The feature space provided by the dataset makes it possible to analyze various clinical, life-style, and genetic attributes of liver diseases. The preprocessing steps involve filling missing values, detecting and eliminating outliers and duplicates to maintain high quality data. Encoding is performed on categorical features while feature standardization is performed on numerical features to ensure scaling. To tackle the issue of class imbalance, the Synthetic Minority Over-sampling Technique is used. The entire methodology workflow process, depicted in Figure 2, captures the entire process starting from data collection to model performance evaluation.
Descriptive Statistics Analysis
The statistics for the Liver Disease dataset, as shown in Table 2, suggest a wide variety of participants in terms of age (20-80 years old) and almost balanced in terms of gender. Moreover, there is large variability for variables related to the lifestyle of participants, including alcohol use and activity level, as well as important health parameters, including the prevalence of diabetes, blood pressure, and genetic predisposition. Additionally, results from liver function tests also display high variability among the patients. The class imbalance suggests that about 55% of people have liver disease.
Exploratory Data Analysis
An extensive exploratory data analysis (EDA) has been carried out to understand distribution patterns, correlation between features, and inherent structural patterns within the dataset. Skewness values have been obtained using univariate Kernel Density Estimation (KDE), which will help in understanding feature distribution and determining proper feature scaling techniques. Correlation analysis between two variables was conducted in order to detect the presence of any multicollinearity among the features. Additionally, t-distributed Stochastic Neighbor Embedding (t-SNE) and Uniform Manifold Approximation and Projection (UMAP) methodologies were also utilized to discover the underlying structures present in the data.
Univariate Distribution and Skewness Analysis
Kernel Density Estimation (KDE) charts were used in the study for assessing the shape and distribution of numeric variables, with the skewness measures to have a better understanding of the shape, asymmetry, and dispersion of data. As depicted in Figure 3 and Table 3, there is visible a certain degree of skewness in the shapes of several features, such as Age, Body Mass Index, and Liver Function Tests scores. This visualization increasing the level of transparency concerning the statistical characteristics of the selected data before implementing machine learning algorithms.
Bivariate Kernel Density Estimation (KDE) Analysis
For analysis of the correlations between the clinical predictors and the results of liver function tests, we utilized the bivariate kernel density estimation (KDE) method, as illustrated in Figure 4. Bivariate KDE offers a smooth curve of the joint probability distribution, allowing for the identification of fine changes in density distribution, which cannot be overlooked by relying only on the scatter plots and histograms. By applying KDE, we discovered differences in the density distribution of both Healthy and Diseased groups.
Low-Dimensional Embedding for Data Analysis Utilizing UMAP
To facilitate the analysis of high-dimensional data and to detect hidden non-linear relationships, feature embedding methods were integrated in the analysis pipeline. Specifically, Uniform Manifold Approximation and Projection (UMAP) was used to map the scaled features into a 2D projection. The resulting embeddings facilitated the visualization of the intrinsic data relationship and identified clear differences between patients from different categories. Notwithstanding, UMAP applied to the training dataset and showed comparable clustering characteristics. As seen in Figure 5, these embeddings are quite useful for visualizing the data distribution, making it easier to understand the separation and clustering trends between patients.
Correlation Heatmap
The heat map is an excellent way of determining the presence of highly correlated factors, both positively and negatively. The correlation heatmap, depicted in Figure 6, serves as an effective representation of the relationships between the numerical variables within the data set.
Data Preprocessing
Feature Encoding
For efficient integration of the categorical variables with the machine learning algorithms, several methods of encoding have been considered such as Label Encoding, Target Encoding, and One-Hot Encoding. This encoding process will make the models more flexible, ensure the data is accurately represented, and avoid any artificial creation of ordinal relations between categories.
Feature Scaling and Normalization
For numeric attributes, normalization methods such as Min-Max normalization and Z-score normalization were applied to transform the values between [0,1] and normalize the attributes with a mean of zero and a standard deviation of one, respectively. This way, the data is normalized to make learning easier for the algorithm and improve the stability of the training process.
Mitigating Class Imbalance
Figure 7 illustrates the class distribution of the liver disease dataset before and after using SMOTE. The training set of the original dataset had an apparent imbalance between the Healthy and Diseased classes, which could potentially cause biases in the learning process and impact the model’s generalization ability. In order to mitigate this problem, the dataset was firstly scaled using MinMaxScaler and then split into stratified training and test sets, with ratios of 80% and 20%, respectively. SMOTE was only performed on the training set for the purpose of balancing the dataset by generating additional minority class examples.
Model Design & Training
Hyperparameter Configuration
A complete suite of machine learning algorithms was deployed to study the effectiveness of these models in liver disease prediction. This includes both classical models like Logistic Regression (LR), Support Vector Machines (SVM), Decision Tree (DT), and k-Nearest Neighbors (KNN) along with the most advanced techniques such as Random Forest (RF), Gradient Boosting (GB), CatBoost, XGBoost, and Extra Trees [6,10,11,12,13,14]. In addition, various ensemble approaches like Voting and Stacking were utilized so that multiple base models could take advantage of their strengths. All the models were then fine-tuned using hyperparameters that proved suitable after empirical evaluation and literature review. The key hyperparameters used are summarized in Table 4.
Proposed XAI-LiverSHAPNet Model
The following section introduces the proposed framework termed XAI-LiverSHAPNet for pre-clinical screening of liver disease based on the combination of data preprocessing, ensemble machine learning, and explainable artificial intelligence methods. Data preprocessing will encompass imputing missing values, identifying and removing outliers, data normalization, univariate and bivariate statistical tests, and encoding categorical labels. The cleaned data set is then separated into training and test sets with a split ratio of 80/20, while hyperparameters tuning is only conducted on the training data set. For predictive modelling, incorporate stacking ensemble model which encompass XGBoost and CatBoost classifier as base learners, with Logistic Regression used as a meta-learner for better robustness and probabilities calculation. SHAP method is applied to identify the importance of features, and ablating one feature at a time is done to test the effect on the model’s prediction. Moreover, t-distributed Stochastic Neighbor Embedding (t-SNE) technique is used for exploring possible latent structures in the feature space and depicting transition areas between the healthy and the sick patients groups. These plots are used only for analysis purpose and are not included in the prediction process. Performance of the models is measured by the means of several discrimination, calibration, and agreement measures such as Accuracy, F1-measure, Cohen’s Kappa coefficient, Matthews correlation coefficient, Balanced Accuracy, Youden’s J statistic, ROC-AUC, Precision-Recall-AUC, Brier Score, and Log Loss. Additionally, statistical significance is determined using paired t-test, one-way ANOVA, and Wilcoxon Signed-Ranks test.
Technical Specifications for Experimental Framework
A description of the hardware and software resources used for conducting experiments is provided in Table 5. This configuration setup guaranteed high performance, as well as replicability, of the machine learning procedures.
3. Results
This section provides an overall evaluation of classical ML models involving Logistic Regression (LR), Support Vector Machines (SVM), Decision Tree (DT), K-Nearest Neighbors (KNN), Random Forest (RF), Gradient Boosting (GB), XGBoost, CatBoost, Extra Trees (ET), and custom hybrid ensemble methods (Voting & Stacking) used for liver disease diagnosis based on synthetic data. The baseline models are contrasted with the proposed XAI-LiverSHAPNet model in order to show their superiority in predictive performance.The models are evaluated using the metrics like accuracy, precision, recall, F1 score, specificity, MCC, and computation time, alongside XAI-LiverSHAPNet provides interpretability and actionable insights via SHAP and Hybrid Visualization.
Model Performance Without SMOTE
The comparison of ML and ensemble classifiers on the liver disease dataset without using the SMOTE oversampling can be seen in Table 6. which indicates that CatBoost algorithm and Stacking ensemble (combination of CatBoost and Gradient Boosting) provided the highest classification accuracy at 90.58%, where CatBoost also had the highest ROC AUC score at 0.9641 and the Stacking ensemble showed better specificity 0.9346. Other algorithms, namely, Random Forest, XGBoost, and Gradient Boosting, were found to have relatively high performances with accuracy above 88% and ROC AUC higher than 0.94. Traditional models like Logistic Regression, SVM, and Decision Tree also performed moderately well, obtaining an accuracy between 82.6% and 84.7%. Furthermore, KNN model exhibited the lowest accuracy score of 80.88% and MCC of 0.6135. Overall, ensemble techniques notably catBoost and stacking proved to be the most effective for liver disease detection in the absence of SMOTE.
Comparative Performance of Hyperparameter-Optimized ML Models
Performance of ten ML models was tested on the liver disease data set using baseline hyperparameters, followed by optimized hyperparameters. Table 7 showcase the performance measures such as training/testing accuracy, per class metric of precision, recall, F1 score, macro-averaged scores, MCC, and specificity. After optimizing hyperparameters, the tree-based ensemble model algorithms GB, CatBoost, and XGBoost showed higher testing accuracy and good performance in terms of MCC and specificity values. On the other hand, the other models showed lower performance, which indicated their sensitivity to their respective hyperparameters. Therefore, the hyperparameter-tuned ensemble models, particularly GB and CatBoost, proved to be the best performing models for liver disease classification and the basis for XAI-LiverSHAPNet.
Performance of Ensemble Models
The performance of ensemble models including Voting Classifier and Stacking Classifier were analyzed on both training and test set. Table 8 shows the metrics that are used to evaluate the performances of the two ensemble methods, encompassing accuracy, MCC, specificity, precision, recall, F1-score, macro-averaged performance, and computation time. Furthermore, Figure 8 provides a comparative line graph illustrating the train and validation accuracy, along with log loss, for the stacking classifier and the proposed XAI-LiverSHAPNet, highlighting the performance stability and generalization capability of the models.
Optimization and Robustness of the Stacking Ensemble
The stacking ensemble, unifying CatBoost and Gradient Boosting, was deliberately optimized for imbalanced and heterogeneous clinical data. Stratified sampling and over-sampling strategies were employed to address class imbalance by balancing out both healthy and at-risk liver disease classes. Heterogeneity among clinical features was managed by applying several preprocessing methods such as normalization and encoding of categorical values as well as feature selection. To minimize overfitting, hyperparameters optimization and early stopping were used alongside stratified k-fold cross-validation.
The suggested XAI-LiverSHAPNet ensemble stacking framework was specifically designed for tackling imbalanced and heterogenous clinical data. Imbalanced class problem was resolved by applying methods of stratification and oversampling in such a way that the classes of healthy and liver diseases patients were balanced when training the models. In order to deal with heterogeneity of features of the dataset, we utilized the methods of data preprocessing which included data normalization and encoding, as well as feature selection. In terms of overfitting problem, we utilized methods of hyperparameter tuning and early stopping, as well as stratified k-fold cross-validation in order to obtain robust results. To avoid data leakage, all these preprocessing steps were performed only on the training part of the data before validation and testing.
Although the base models in *XAI-LiverSHAPNet* have excellent individual predictability ability, their incorporation into the stacking architecture facilitates complementary learning of feature interaction and efficient error correction. Through exploiting the power of combining such models, the proposed ensemble framework improves class distinction, validation stability, and clinical heterogeneity robustness. Collectively, by implementing these strategies, XAI-LiverSHAPNet achieves high prediction power along with interpretability via SHAP analysis and visualization.
Evaluation Using ROC AUC Curve
The ROC-AUC analysis shown in Figure 9, although some baseline approaches perform slightly better in terms of AUC score in some instances, XAI-LiverSHAPNet shows notable discriminatory power in disease categorization, better prediction accuracy, and improved interpretability. Taken together, these findings highlight the efficacy of the proposed approach for detecting early liver diseases.
Confusion Matrix
The confusion matrix shown in Figure 10 shows the comparison between baseline model predictions and ensemble models for the classification of liver disease. However, ensemble classifier achieve improved predictive performance, characterized by higher true-class alignment and reduced misclassification rates. The proposed XAI-LiverSHAPNet system outperforms even the voting ensemble approach in terms of class-wise consistency and reduces prediction uncertainty in all classes. In light of the above results, there is a performance improvement trend from benchmark to ensembles, and XAI-LiverSHAPNet produces the most accurate and reliable predictions for early diagnosis of liver disease.
Cross Validation Analysis
Table 9 demonstrates that all hyperparameter-tuned machine learning algorithms performed well in classification tasks. In particular, the introduced XAI-LiverSHAPNet demonstrated the best accuracy score of (0.9312 ± 0.0151), highlighting exceptional predictive capability for binary liver disease detection and surpassed all other models, showcasing robust reliability and generalizability.
Statistical Analysis of the Proposed Model
Statistical evaluation provides a quantification of features and relationships in data to facilitate predictive modeling. The Stacking model had better probability calibration with notable improvements in Brier Score and Log Loss, but had great discrimination ability with ROC AUC and PR AUC results. Other performance scores, such as Accuracy, F1-Score, Kappa, MCC, Balanced Accuracy, Youden’s J, among others, revealed slight differences among ensembles and have been presented in Table 10. Overall, these findings provide evidence that XAI-LiverSHAPNet is a reliable model for classifying liver diseases categorizing.
Clinical Applicability and Screening Implications
For greater clinical relevance, the XAI-LiverSHAPNet architecture can be applied as a cognitive computing based diagnostic tool for screening of liver disease in primary care settings and other high risk patients (such as those with a high BMI, alcohol intake, or metabolic co-morbidities). Instead of substituting clinical diagnosis, the machine learning architecture serves as a risk stratification layer that will help to screen those that require further clinical investigation. ROC curve analysis can help set the screening threshold where Youden’s J statistic would allow choosing the best sensitivity-specificity trade-off. The threshold value can be set according to specific clinical needs (either for higher early diagnosis rate or lower false positive cases). The low Brier Score and Log Loss metrics show well-calibrated probability estimates in the stacking ensemble, indicating sound basis for decision making under probabilistic screening strategy. As opposed to the existing rule-based method based predominantly on LFT criteria, the proposed framework incorporates a larger number of heterogeneous clinical parameters which leads to a more detailed evaluation of risk factors. SHAP values also improve the interpretability by highlighting the most important features, such as Alcohol Consumption, Age, and LFT scores.
Latent Pattern Discovery Using T-SNE and UMAP
The t-SNE plot maps the highly dimensional dataset of patients into the 2D feature space and allows separation of data points depending on the health condition of the corresponding person. Here, a point depicts one specific patient; the green points are for healthy people, and red points show the disease states. The convex hulls are created for each category as showcases in Figure 11 where the distance between the green and red clusters demonstrates the extent of the differences among the two classes in terms of features. The degree of separation between green and red hulls represents the difference in the characteristics of each group in the feature space, whereas any overlap can highlight the transition area where some healthy patients have features close to the disease group. The transitional area is of great significance since individuals at risk of being sick patients might have similarities in features to the other group. Importantly, it should be emphasized here that neither t-SNE nor UMAP plots were used for diagnosis and the identification of sick patients only served the purpose of exploring feature-space patterns. However, it is critical to point out that t-SNE and UMAP visualizations are only meant for exploratory analysis of feature space patterns.
SHAP-Based Model Interpretability for Liver Disease Prediction
The SHAP summary plot in Figure 12 provides a detailed visualization of the impact various features have on the model’s output for liver disease screening. As evident from the plot, increased values of alcohol consumption increase the chances of developing liver disease. In the same way, another important feature identified through the SHAP values is ’Liver Function Test’ having an importance of 1.2575. Age and Gender are the two other features that affect the predictive model. However, some features, such as Hypertension and Diabetes, have minimal significance. Apart from the mentioned insights regarding global trends, patient-specific SHAP values were also investigated in order to explain how different features affect individual patients’ predictions. This way, particular patients with high levels of alcohol consumption and increased Liver Function Test values have very high outputs from the model that reflect their likelihood of having liver disease, whereas Age, Gender, and Body Mass Index contribute to risk individually. Overall, these insights are complementary to the SHAP summary and help identify potentially affected individuals even before any symptoms appear.
Feature Ablation Study
To assess the contribution of individual features to model performance, a feature ablation study was conducted a feature ablation study was performed, where we remove one feature at a time and measure the model performance. Table 11 illustrates the test performance measurements, which include Accuracy, MCC, Precision, and F1-Score. The exclusion of important attributes like AlcoholConsumption and LiverFunctionTest caused a significant drop in the performance of the model, underscoring the importance of these variables in improving prediction accuracy. On the other hand, the exclusion of variables like Gender, and Age did not have any effect on the performance of the model. Overall, the performance of the proposed XAI-LiverSHAPNet model model remains relatively stable when features are selectively removed.
4. Discussion
(i) Methodological Insights
The effectiveness of the proposed XAI-LiverSHAPNet framework proves the superiority of a methodological approach which combines ensemble learning and explainable artificial intelligence approaches. Unlike the stand-alone tree-based algorithms like Gradient Boosting, CatBoost and XGBoost, the proposed framework exploits the strengths of complementary learning techniques from various architecture types to achieve better generalizability and robustness. This synergy allows the model to capture both linear and non-linear relationships among clinical variables, thereby enhancing class separability. Additionally, the guided explanation technique through SHAP results not only in increased transparency but also ensures the stability of the models as evidenced by their reduced performances in ablation analysis. The conclusion from this study is that the predictions of the model are dependent on clinically meaningful features.
(ii) Clinical Interpretation and Use Cases
From a clinical perspective, the identification of three prominent features such as AlcoholConsumption, LiverFunctionTest, and Age, conforms well with the existing scientific knowledge regarding the risk factors for the emergence of liver diseases. The capability of the suggested approach to capture even slight shifts from normal to abnormal, can be inferred from its potential use in risk assessment. This feature will enable doctors to determine which patients are prone to developing the condition in the absence of any clear symptoms, hence ensuring early treatment and care. In practical terms, the use of this framework will facilitate the process of decision-making, including risk prediction, identification of high-risk patients, and prescription of suitable treatment methods. The core noveltyof using the proposed approach is its explainability, which ensures transparency in decision-making.
(iii) Role and Limits of XAI and Visualization
The use of SHAP, t-SNE, and UMAP together helps improve interpretability through complementary approaches at both the level of individual features and the feature space representations. SHAP adds to the interpretability of the models by calculating how individual clinical features contribute to specific predictions and thus identifying important clinical risk factors for disease development. At the same time, t-SNE and UMAP make it possible to visually explore the relationships in the feature space learned by a neural network, allowing researchers to understand clustering and separation of healthy from disease samples. These representation-level insights helps to understanding of feature separability and decision-making process of the model. Notably, t-SNE and UMAP cannot be considered as diagnostic techniques and these rely on feature representation and transformation and and should not be interpreted as definitive clinical evidence. Therefore, while XAI and visualization techniques improve interpretability and trustworthiness, their outputs must be interpreted cautiously and validated in appropriate clinical and experimental contexts.
(iV) Comparison with State-of-the-Art Studies
XAI-LiverSHAPNet is compared to other state-of-the-art liver disease prediction approaches in Table 12. While earlier research has predominantly been centered on classification using single models, XAI-LiverSHAPNet introduces ensemble techniques, SHAP explanation, and visualization using t-SNE/UMAP and demonstrates comparable results with 94.4% and 96.16% cross-validation accuracy.
(V) Limitations and Future Outlook
However, despite the encouraging results obtained, some drawbacks of the proposed XAI-LiverSHAPNet approach should be highlighted. First of all, it is important to note that the experiment involved the usage of synthetic dataset, which is relatively small, as well as the lack of real-life and longitudinal cohorts related to health conditions for presymptomatic liver disease detection, so multi-center and longitudinal datasets will be required in future research in order to validate the reliability of the algorithm’s predictions. There is also a limitation concerning the availability of certain patient-related features, which can contribute to the development of liver diseases including, genetics, lifestyle habits, and environmental factors. The interpretability of the model will depend on the dataset used for training. Model explanations are also subject to the training dataset and feature space, and their stability needs to be tested for different population groups and independent datasets. Notwithstanding, recent deep learning architectures, including attention-based and transformer-based models, have demonstrated strong performance on large tabular datasets but require larger datasets and greater computational resources. Additionally, recent advancements in artificial intelligence, including large language models (LLMs) and multimodal foundation models, offer innovative approaches toward integration of clinical narratives, electronic health records (EHR), medical imaging and many more different kinds of healthcare data into clinical reasoning and decision making and personalized healthcare applications. Future work aims at comparing these new architectures along with the current model framework to see any improvements in terms of performance. In addition, using multimodal data from other sources can provide more insight into liver disease. Future studies may involve deploying the models efficiently to allow for easy deployment within clinical settings. The incorporation of LLMs, multimodal foundation models, trusted AI, data amplification techniques, and precision healthcare applications is one significant future area for AI-powered health systems, as shown in Figure 13.
5. Conclusions
Proposed XAI-LiverSHAPNet framework offers an effective solution to binary liver disease screening for liver diseases by utilizing stacking ensembles along with SHapley Additive exPlanations (SHAP). The model secured strong predictive performance (specificity = 97.19% cross-validation accuracy = 93.12%, standard deviation = 0.0151, test accuracy = 94.41%, MCC = 0.8890, ROC AUC = 0.9661) while providing clinically meaningful insights through feature-level ablation studies. Among the 11 features, Alcohol Consumption (SHAP = 1.3024), Liver Function Test scores (SHAP = 1.2575), and Age (SHAP = 0.6284) were identified as the most influential predictors. Removing any of these features reduced accuracy from 94.41% to about 0.70, confirming their critical contribution to performance. The t-SNE visualization reduced high-dimensional patient data into two dimensions, separating individuals based on health status. Green points represented healthy cases, while red points indicated diseased patients. The convex hulls described the groups, with overlap areas indicating possible transition regions that could represent patients. Likewise, the UMAP projection provided a complementary view, preserving both local and global data structures. Broader clusters of healthy and diseased patients, alongside fine-grained transitional patterns, emphasized the importance of early-stage risk identification. UMAP on both full dataset and training set revealed the consistency of clustering, thus ensuring the stability of such embeddings. The visualization not only helped in understanding the underlying structure of the dataset but also contributed to interpretability analysis. Performance comparisons demonstrated that the ensemble models outperformed baseline learners, with the stacking classifier achieving a test accuracy of 94.41% and MCC of 0.889, while the proposed XAI-LiverSHAPNet surpassed both, attaining superior accuracy, ROC AUC, and interpretability. Although, XAI-LiverSHAPNet showed promising predictive performance, the study is restricted to a small synthetic dataset and needs further validation with large longitudinal real-world data sets before applying it clinically. These results highlight the methodological potential of the proposed framework.
Author Contributions
Conceptualization, A.G. data curation, A.G. formal analysis, A.G. methodology, A.G. visualization, A.G. validation, A.G. writing—original draft preparation, A.G.; writing—review and editing, A.G.; supervision, A.G.; project administration, A.G.
Funding
N/A
Data Availability Statement
All data and the associated preprocessing scripts required to reproduce the reported results are available from the corresponding author upon reasonable request.
Acknowledgments
For preparing this manuscript, the authors have only made use of generative artificial intelligence systems to enhance language proficiency, grammar, and readability.
Conflicts of Interest
The authors state that there are no known competing financial interests or personal relationships that might have seemed to affect their research in this paper.
References
- Kim, S.; et al. Global burden of metabolic dysfunction-associated steatotic liver disease. The Lancet Gastroenterology and Hepatology 2026, 11, 463–494. [CrossRef]
- Faruk, O.; Ahmed, K.U.; Ishrat, N.; Mrittika, S.A.; Alam, S.; Hasan, M.; Tanjum, F.A.; Mohammad, N.; Mahmud, A.; Amin, M.N. Liver cirrhosis: epidemiology, risk factors, potential complications, and possible treatment strategies. Gastroenterology & Endoscopy 2026, 4, 117–129. [CrossRef]
- Devarbhavi, H.; Asrani, S.K.; Arab, J.P.; Nartey, Y.A.; Pose, E.; Kamath, P.S. Global burden of liver disease: 2023 update. Journal of Hepatology 2023, 79, 516–537. [CrossRef]
- Alghzawi, H.M.; Sahu, S.; Rana, A.; Mwita, R.; Gundapaneni, S.; Dahiya, D. Integrated serum metabolomics and MRI biomarkers for MASLD: a practical framework for noninvasive staging and monitoring. Abdominal Radiology 2026, pp. 1–13. [CrossRef]
- Pansare, B.S.; Kulkarni, A.D.; Pawar, P.P. Explainable Cognitive Visualization of Hidden Patterns in Asthma Patients Using PCA and t-SNE Clustering. In Proceedings of the 2025 1st International Conference on Advancement in Futuristic Technologies (ICAFT). IEEE, 2025, pp. 1–6. [CrossRef]
- Zaidi, S.A.J.; Ghafoor, A.; Kim, J.; Abbas, Z.; Lee, S.W. HeartEnsembleNet: An innovative hybrid ensemble learning approach for cardiovascular risk prediction. In Proceedings of the Healthcare. MDPI, 2025, Vol. 13, p. 507. [CrossRef]
- Faisal, S.; Ullah, I.; Kambey, P.A.; Malik, A.; Shakeel, M. Revolutionizing hepatic fibrosis staging: A machine learning approach combining clinical, biochemical, and microbiome insights. Computers in Biology and Medicine 2026, 206, 111584. [CrossRef]
- Shiddik, M.A.B. Explainable Artificial Intelligence in Healthcare: Current Landscape, Challenges, and Future Directions. Health Science Reports 2026, 9, e72172. [CrossRef]
- Elkharoua, R. Predict Liver Disease - 1700 Records Dataset, 2023. Accessed: 2025-02-07.
- Ganie, S.M.; Pramanik, P.K.D. A comparative analysis of boosting algorithms for chronic liver disease prediction. Healthcare Analytics 2024, 5, 100313. [CrossRef]
- Carnazzo, V.; Pignalosa, S.; Tagliaferro, M.; Gragnani, L.; Zignego, A.L.; Racco, C.; Di Biase, L.; Basile, V.; Rapaccini, G.L.; Di Santo, R.; et al. Exploratory study of extracellular matrix biomarkers for non-invasive liver fibrosis staging: A machine learning approach with XGBoost and explainable AI. Clinical Biochemistry 2025, 135, 110861. [CrossRef]
- Mahmoud, A.; Takaoka, E. An enhanced machine learning approach with stacking ensemble learner for accurate liver cancer diagnosis using feature selection and gene expression data. In Proceedings of the Healthcare Analytics. Elsevier, 2025, Vol. 7, p. 100373. [CrossRef]
- Ghazal, T.M.; Rehman, A.U.; Saleem, M.; Ahmad, M.; Ahmad, S.; Mehmood, F. Intelligent model to predict early liver disease using machine learning technique. In Proceedings of the 2022 International Conference on Business Analytics for Technology and Security (ICBATS). IEEE, 2022, pp. 1–5. [CrossRef]
- Singh, V.; Gourisaria, M.K.; Das, H. Performance analysis of machine learning algorithms for prediction of liver disease. In Proceedings of the 2021 IEEE 4th International Conference on Computing, Power and Communication Technologies (GUCON). IEEE, 2021, pp. 1–7. [CrossRef]
- Agarwal, S.; Bansal, H.; Mani, V. Early Liver Disease Detection Through Visual Interface and Machine Learning. In Proceedings of the International Conference on Machine Learning Algorithms (ICMLA 2024), Communications in Computer and Information Science. Springer, 2024, pp. 25–33. [CrossRef]
- Khan, N.A.; Bin Hafiz, M.F.; Pramanik, M.A.; Hossain, S.; Barman, S.; Hossain, N. Machine Learning and Explainable AI for Liver Disease Prediction: An Integrated Interpretability Framework. Biomedical Materials & Devices 2025, pp. 1–14. [CrossRef]
- Zhu, G.; Yang, N.; Yi, Q.; Xu, R.; Zheng, L.; Zhu, Y.; Li, J.; Che, J.; Chen, C.; Lu, Z.; et al. Explainable machine learning model for predicting the risk of significant liver fibrosis in patients with diabetic retinopathy. BMC Medical Informatics and Decision Making 2024, 24, 332. [CrossRef]
- Yu, Y.; Yang, Y.; Li, Q.; Yuan, J.; Zha, Y. Predicting metabolic dysfunction associated steatotic liver disease using explainable machine learning methods. Scientific Reports 2025, 15, 12382. [CrossRef]
Figure 1.
Major challenges hindering the use of AI techniques for predicting liver diseases and clinical deployment, including data-related issues, model interpretability constraints, clinical integration barriers, validation limitations, optimization challenges and generalization concerns.
Figure 1.
Major challenges hindering the use of AI techniques for predicting liver diseases and clinical deployment, including data-related issues, model interpretability constraints, clinical integration barriers, validation limitations, optimization challenges and generalization concerns.
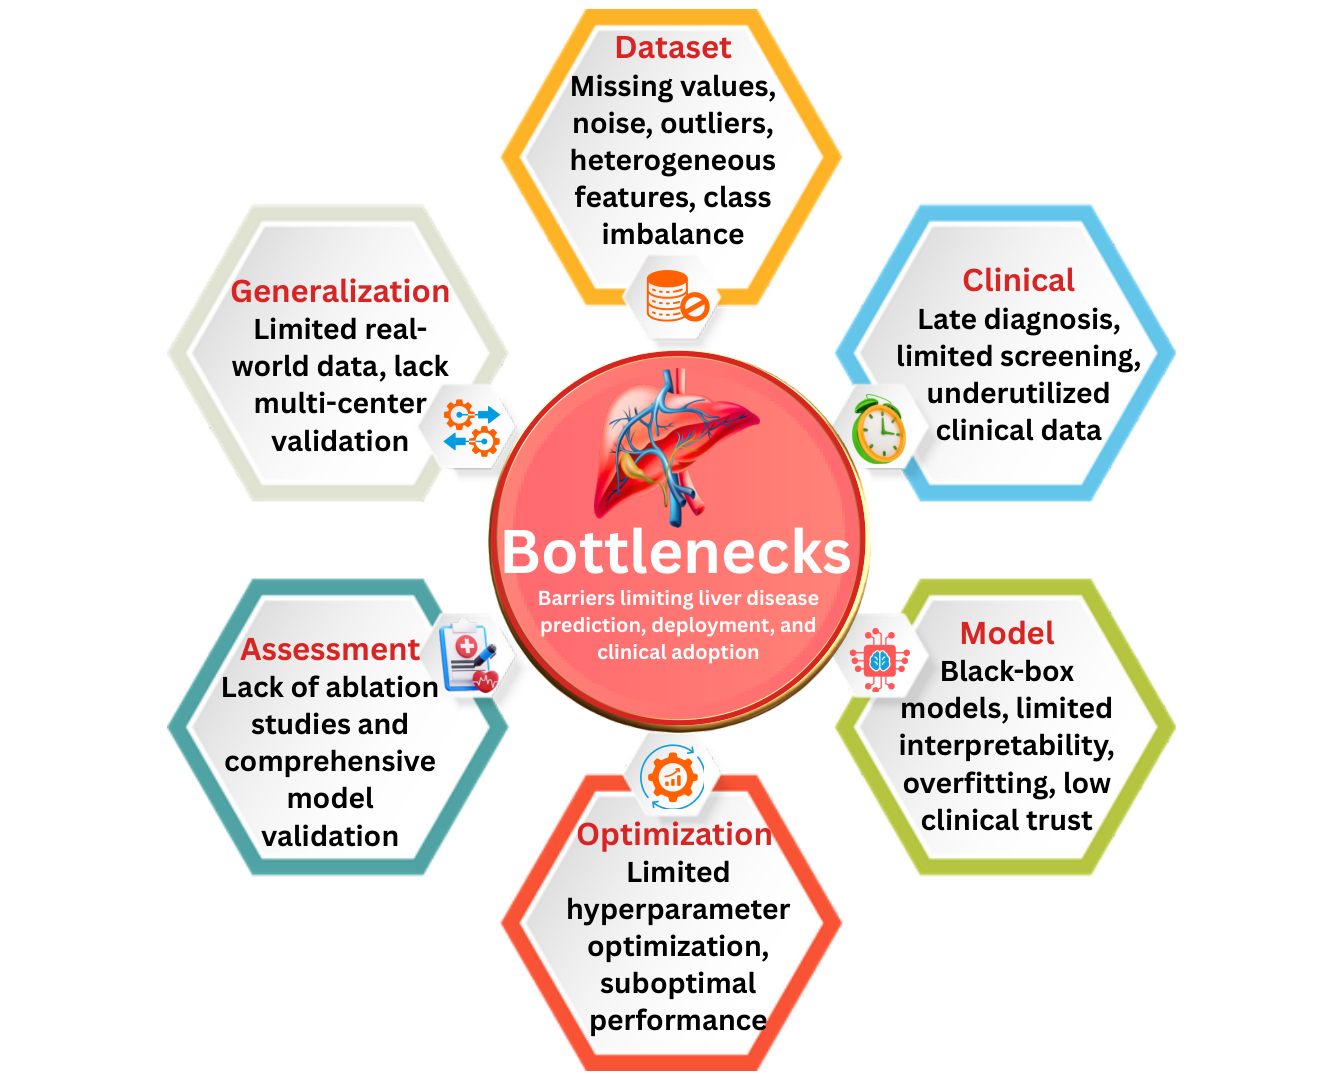
Figure 2.
The framework highlights the the systematic workflow encompassing data cleaning, scaling, and class balancing using SMOTE followed by the training of an ensemble machine learning model. SHAP framework is used in this context as the post-hoc explanation technique that helps interpret the influence of demographics, biochemistry, and comorbidities for predicting liver disease.
Figure 2.
The framework highlights the the systematic workflow encompassing data cleaning, scaling, and class balancing using SMOTE followed by the training of an ensemble machine learning model. SHAP framework is used in this context as the post-hoc explanation technique that helps interpret the influence of demographics, biochemistry, and comorbidities for predicting liver disease.
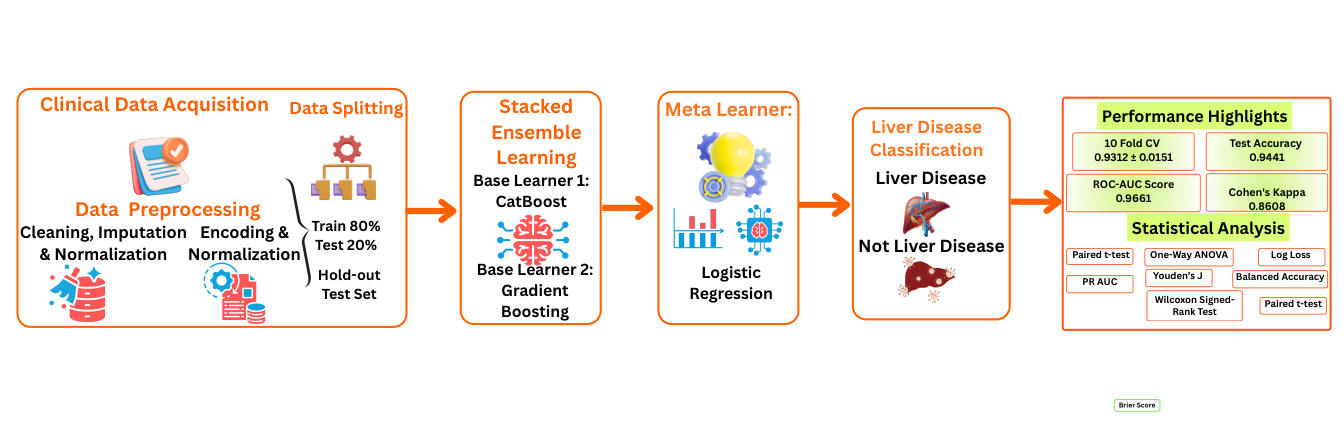
Figure 3.
Univariate Kernel density estimation (KDE) plots with annotated skewness values for numerical features. The curves represent the distribution shape and asymmetry of the variables, including deviation from normality and their significant impact on model performance.
Figure 3.
Univariate Kernel density estimation (KDE) plots with annotated skewness values for numerical features. The curves represent the distribution shape and asymmetry of the variables, including deviation from normality and their significant impact on model performance.
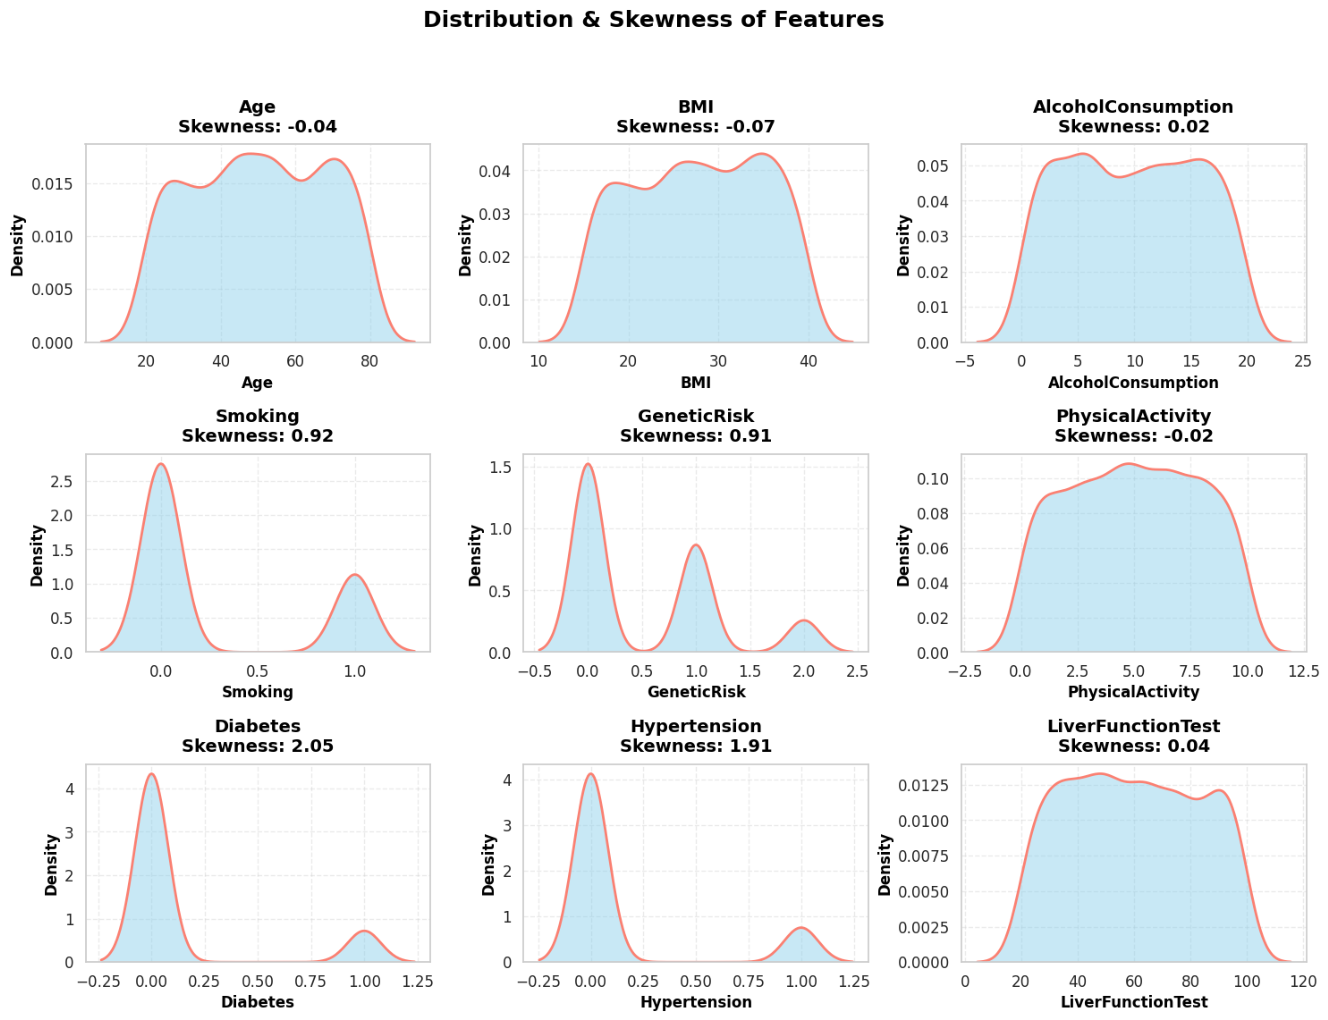
Figure 4.
Bivariate KDE plots showing the association of the aforementioned clinical characteristics (Age, Body Mass Index, Alcohol Intake, Cigarette Smoking, Genetics, Exercise, Diabetes, and Hypertension) and their relation to the Liver Function Tests. These graphs show how the distributions of the Healthy (green) and Diseased (red) patients differ and overlap with one another.
Figure 4.
Bivariate KDE plots showing the association of the aforementioned clinical characteristics (Age, Body Mass Index, Alcohol Intake, Cigarette Smoking, Genetics, Exercise, Diabetes, and Hypertension) and their relation to the Liver Function Tests. These graphs show how the distributions of the Healthy (green) and Diseased (red) patients differ and overlap with one another.
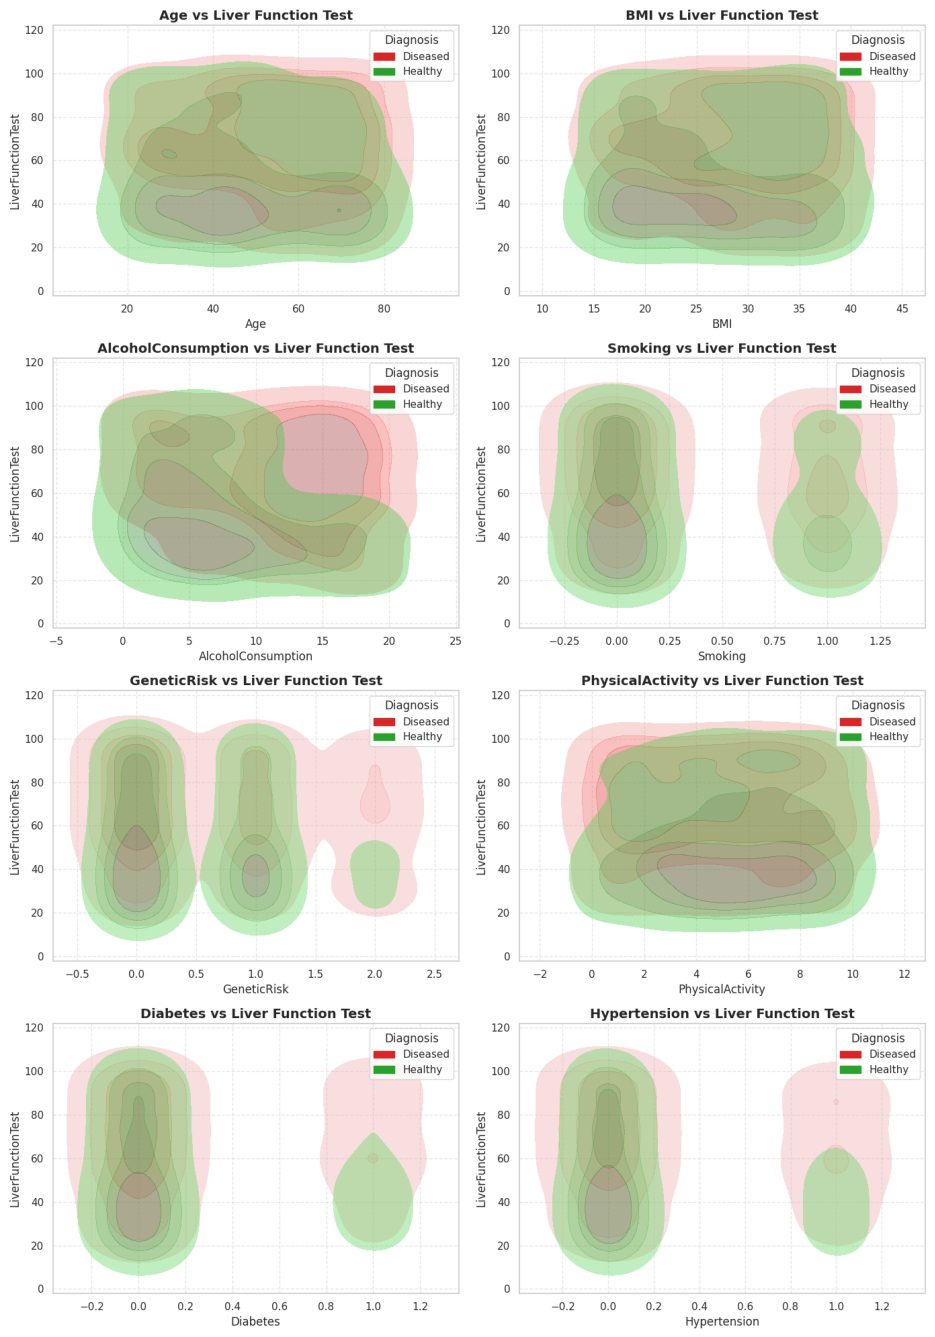
Figure 5.
Comparison of UMAP embeddings: (a) complete dataset and (b) training dataset. Both serve an exploratory view of the embedded data structure in Healthy and Diseased cases
Figure 5.
Comparison of UMAP embeddings: (a) complete dataset and (b) training dataset. Both serve an exploratory view of the embedded data structure in Healthy and Diseased cases
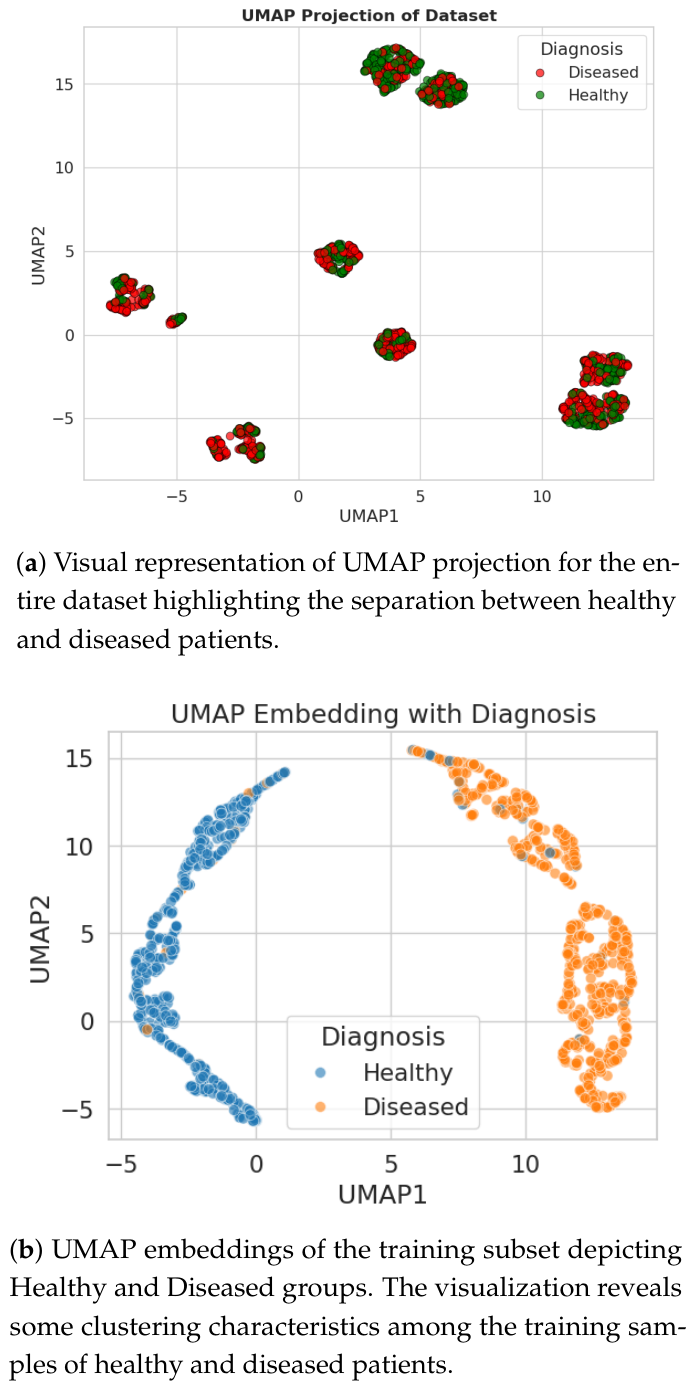
Figure 6.
Correlation heatmap of key numerical variables related to Liver Dataset
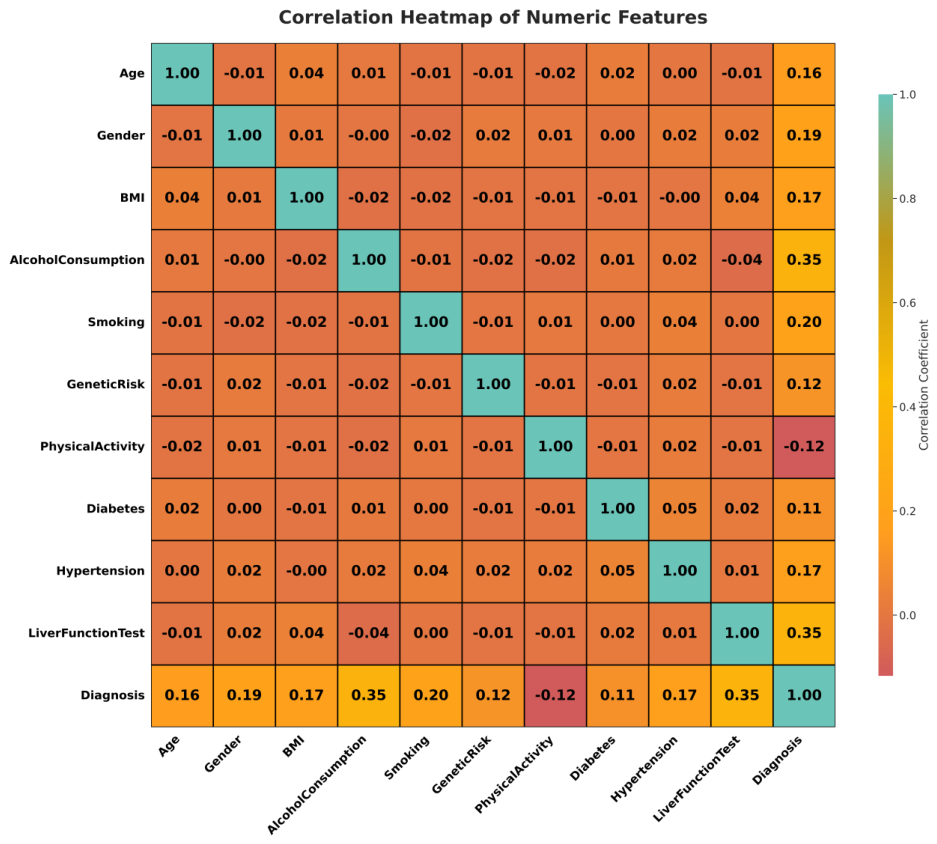
Figure 7.
Class Distribution Before and After SMOTE For Liver Disease Dataset
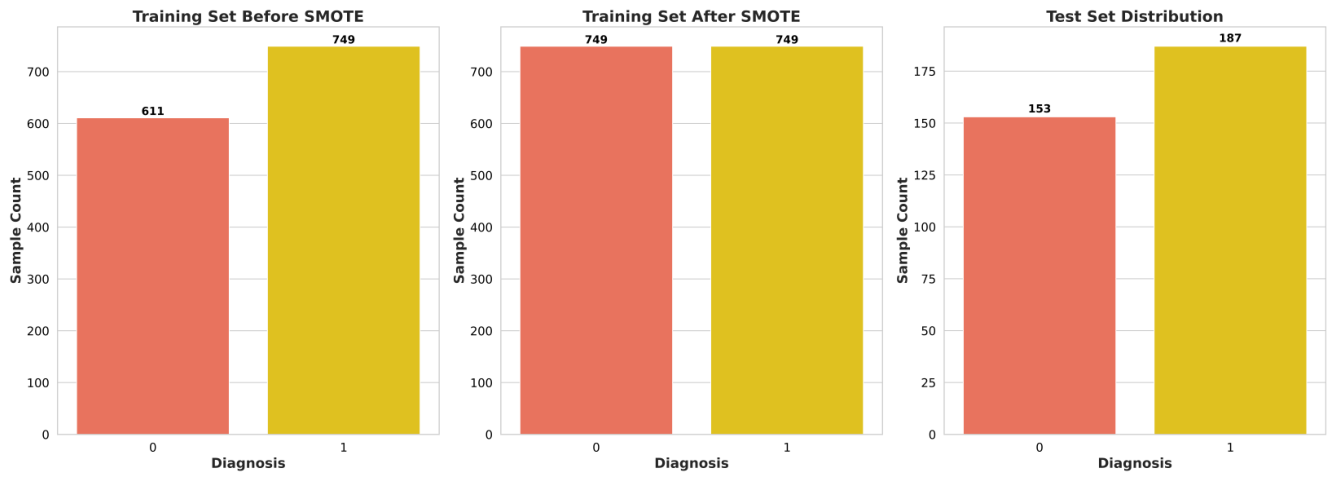
Figure 8.
Comparative line graph of train and validation accuracy with log loss for the Stacking Classifier and the proposed XAI-LiverSHAPNet, demonstrating superior generalization and reduced error rates.
Figure 8.
Comparative line graph of train and validation accuracy with log loss for the Stacking Classifier and the proposed XAI-LiverSHAPNet, demonstrating superior generalization and reduced error rates.
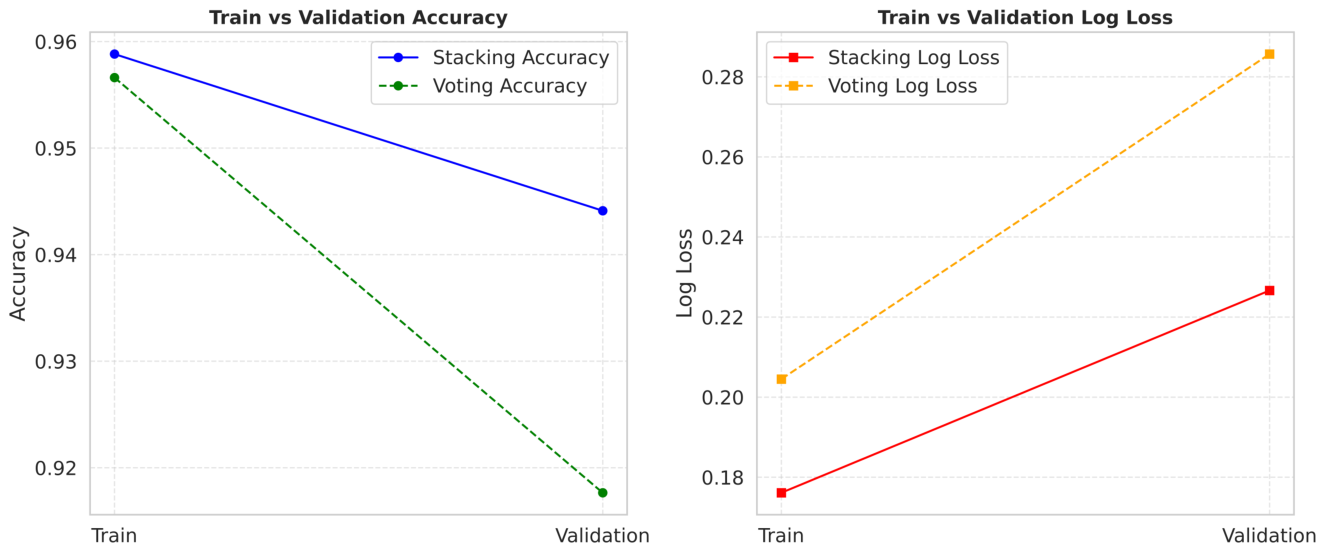
Figure 9.
ROC AUC curves of the ensemble models in predicting liver disease screening
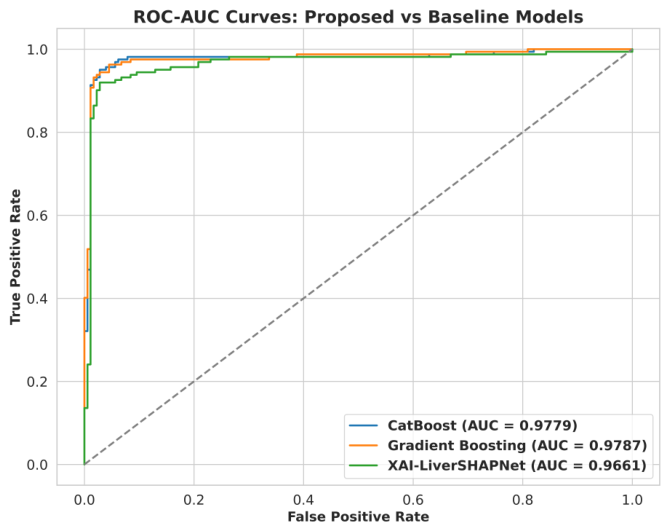
Figure 10.
Confusion matrix analysis showing the performance of baseline models and proposed XAI-LiverSHAPNet in predicting liver disease
Figure 10.
Confusion matrix analysis showing the performance of baseline models and proposed XAI-LiverSHAPNet in predicting liver disease
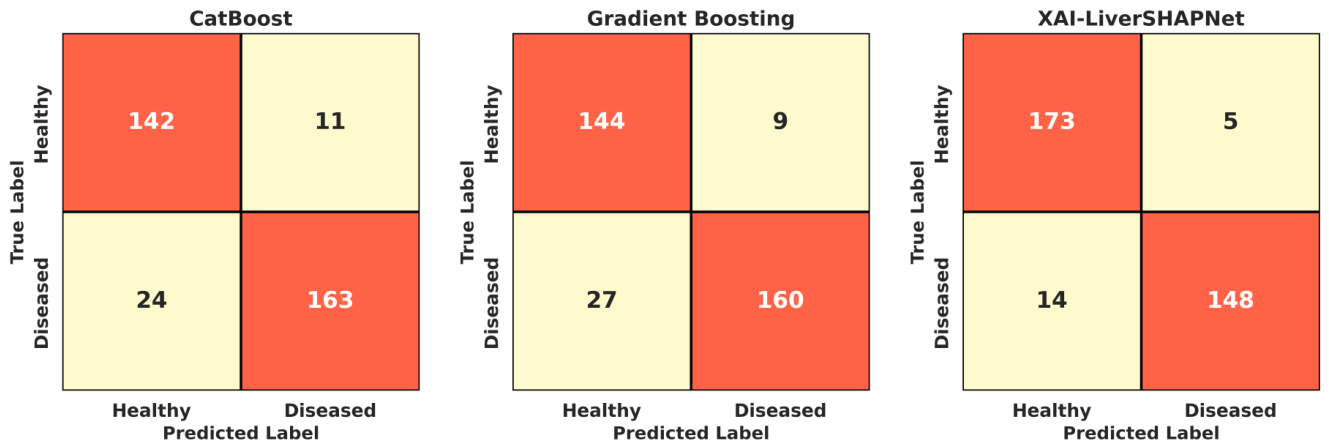
Figure 11.
Visualization using t-SNE method of the feature space obtained for liver disease diagnosis. The convex hulls for the Healthy and Diseased classes are shown to depict the separation between overlapping regions.
Figure 11.
Visualization using t-SNE method of the feature space obtained for liver disease diagnosis. The convex hulls for the Healthy and Diseased classes are shown to depict the separation between overlapping regions.
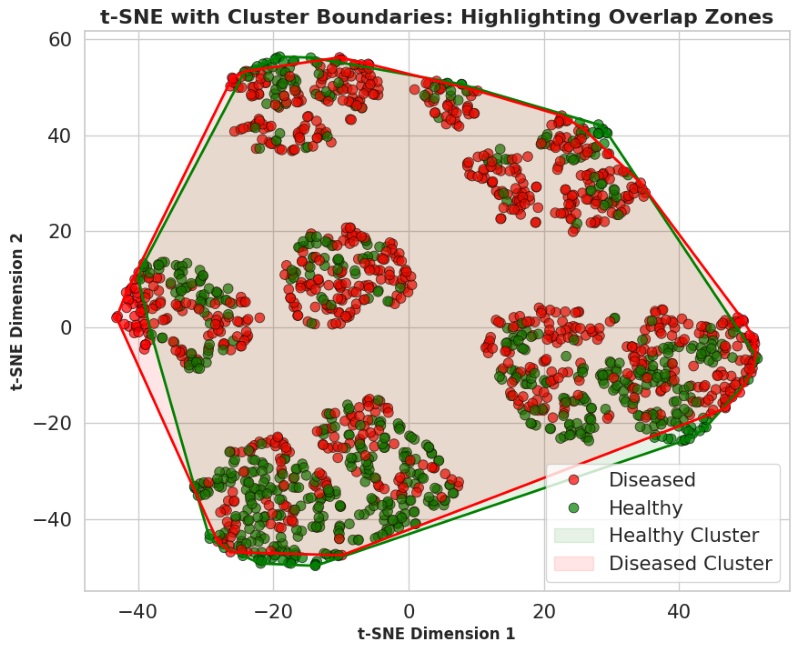
Figure 12.
SHAP summary plot showing importance of features for predicting liver disease using the XAI-LiverSHAPNet framework.
Figure 12.
SHAP summary plot showing importance of features for predicting liver disease using the XAI-LiverSHAPNet framework.
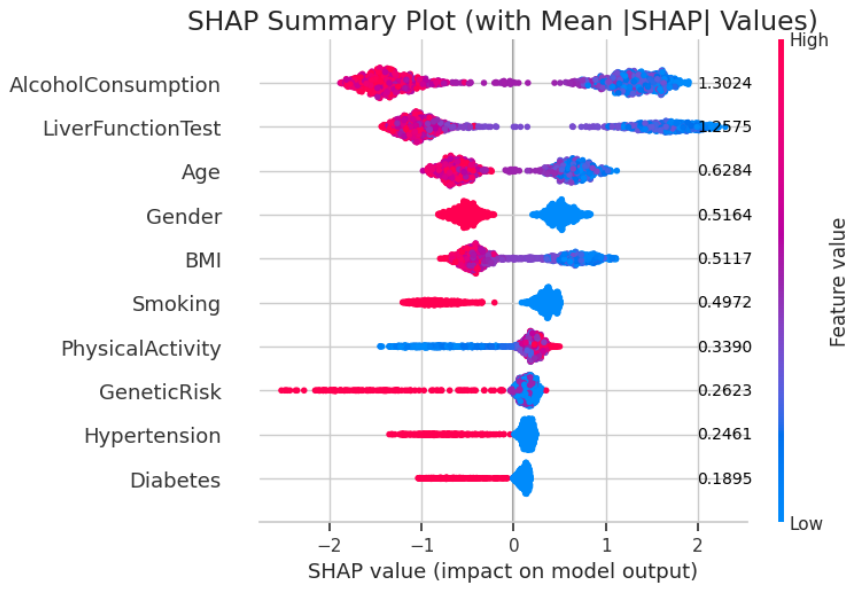
Figure 13.
Future directions of artificial intelligence in healthcare. LLMs and multimodal foundation models are among the leading technologies that drive clinical reasoning, knowledge integration, and adaptive healthcare intelligence. Research questions of the future will include issues such as scalable data collection, multi-objective optimization, trustworthy AI, formal verification, and domain adaptation. The future development is likely to boost clinical translation by means of personalized medicine, decision-making assistance, risk stratification, early diagnosis, preventive care, and mass clinical screening.
Figure 13.
Future directions of artificial intelligence in healthcare. LLMs and multimodal foundation models are among the leading technologies that drive clinical reasoning, knowledge integration, and adaptive healthcare intelligence. Research questions of the future will include issues such as scalable data collection, multi-objective optimization, trustworthy AI, formal verification, and domain adaptation. The future development is likely to boost clinical translation by means of personalized medicine, decision-making assistance, risk stratification, early diagnosis, preventive care, and mass clinical screening.
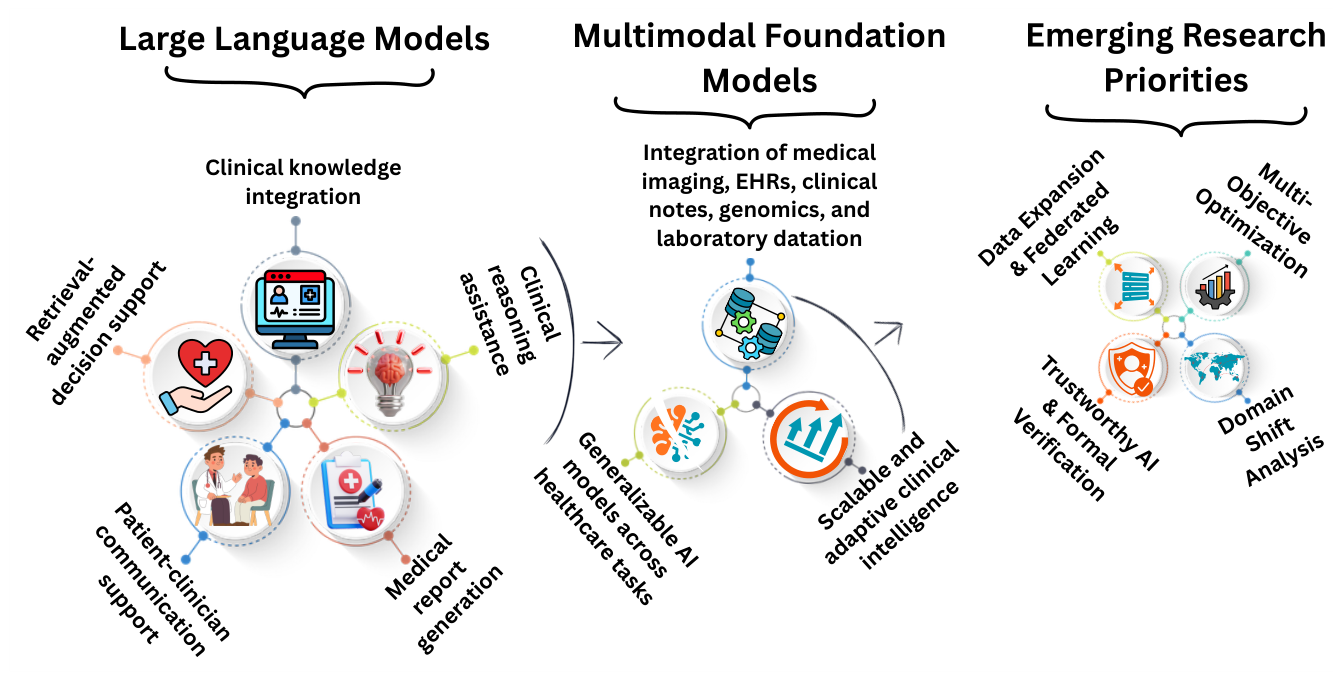

Table 1.
Liver Disease Dataset Features
| Feature | Data Type | Description |
|---|---|---|
| Age | Int64 | Age of the patient (years) |
| Gender | Int64 | Gender of the patient (0 = Male, 1 = Female) |
| BMI | Float64 | Body Mass Index |
| AlcoholConsumption | Float64 | Average alcohol intake (units per week) |
| Smoking | Int64 | Smoking status (0 = Non-smoker, 1 = Smoker) |
| GeneticRisk | Int64 | Family history of liver disease (0 = No, 1 = Yes) |
| PhysicalActivity | Float64 | Physical activity (hours per week) |
| Diabetes | Int64 | Diabetes status (0 = No, 1 = Yes) |
| Hypertension | Int64 | Hypertension status (0 = No, 1 = Yes) |
| LiverFunctionTest | Float64 | Liver function biochemical test score |
| Diagnosis | Int64 | Target variable (0 = No Liver Disease, 1 = Liver Disease) |
Table 2.
Descriptive Statistical Summary of Clinical and Lifestyle Features in the Liver Disease Data
Table 2.
Descriptive Statistical Summary of Clinical and Lifestyle Features in the Liver Disease Data
| Feature | Type | Statistics |
|---|---|---|
| Continuous Variables | ||
| Age | Continuous | Mean = 50.39, SD = 17.64 |
| BMI | Continuous | Mean = 27.70, SD = 7.21 |
| AlcoholConsumption | Continuous | Mean = 9.83, SD = 5.76 |
| PhysicalActivity | Continuous | Mean = 5.00, SD = 2.85 |
| LiverFunctionTest | Continuous | Mean = 59.86, SD = 22.99 |
| Categorical/Binary Variables | ||
| Gender | Binary (0 = Male, 1 = Female) | 0: 850 (50%), 1: 850 (50%) |
| Smoking | Binary (0 = Non-smoker, 1 = Smoker) | 0: 1210 (71%), 1: 490 (29%) |
| GeneticRisk | Binary (0 = No, 1 = Yes) | 0: 816 (48%), 1: 884 (52%) |
| Diabetes | Binary (0 = No, 1 = Yes) | 0: 1462 (86%), 1: 238 (14%) |
| Hypertension | Binary (0 = No, 1 = Yes) | 0: 1445 (85%), 1: 255 (15%) |
| Diagnosis | Binary (0 = Healthy, 1 = Diseased) | 0: 765 (45%), 1: 935 (55%) |
Table 3.
The table shows skewness values of numerical features. When the skewness is positive, the distribution is right skewed, whereas when the skewness is negative, the distribution is left skewed.
Table 3.
The table shows skewness values of numerical features. When the skewness is positive, the distribution is right skewed, whereas when the skewness is negative, the distribution is left skewed.
| Feature | Skewness |
|---|---|
| Age | -0.04 |
| BMI | -0.07 |
| Alcohol Consumption | 0.02 |
| Physical Activity | -0.02 |
| Liver Function Test | 0.04 |
Table 4.
Hyperparameter configuration of the evaluated machine learning models. Best parameters obtained from GridSearchCV are reported.
Table 4.
Hyperparameter configuration of the evaluated machine learning models. Best parameters obtained from GridSearchCV are reported.
| Model | Key Hyperparameters |
|---|---|
| Logistic Regression (LR) | C=1, solver=’liblinear’, max_iter=1000 |
| Support Vector Classifier (SVC) | kernel=’rbf’, C=1, gamma=0.1, probability=True |
| Decision Tree (DT) | max_depth=10, min_samples_split=2 |
| Random Forest (RF) | n_estimators=100, max_depth=None |
| Gradient Boosting (GB) | n_estimators=100, learning_rate=0.1 |
| k-Nearest Neighbors (KNN) | n_neighbors=5 |
| Extra Trees (ET) | n_estimators=100, max_depth=None |
| CatBoost | iterations=100, depth=6, learning_rate=0.1 |
| XGBoost | n_estimators=100, max_depth=6, learning_rate=0.1 |
| Voting Classifier (CatBoost + GB) | Soft voting with CatBoost (iterations=100, depth=6, learning_rate=0.1) and Gradient Boosting (n_estimators=100, learning_rate=0.1), weights=[2,1] |
| XAI-LiverSHAPNet (CatBoost + GB) | Base: CatBoost (iterations=100, depth=6, learning_rate=0.1), Gradient Boosting (n_estimators=100, learning_rate=0.1); Final: LogisticRegression (max_iter=1000), cv=5, passthrough=True |
Table 5.
Hardware and software specifications for the experimental setup.
| Parameter | Details |
|---|---|
| Experimental Framework | Intel(R) Core(TM) i5-6300U CPU @ 2.40GHz 2.50GHz |
| Programming Language | Python 3.10.12 |
| Pandas Version | 2.2.2 |
| NumPy Version | 1.26.4 |
| TensorFlow Version | 2.17.0 |
| Scikit-learn Version | 1.5.2 |
| Installed RAM | 16.00 GB |
| System Architecture | 64-bit |
Table 6.
Model performance for liver disease detection without class balancing and preprocessing.
| Model | Accuracy | MCC | Specificity | ROC AUC | Precision | Recall | F1-score | Time (s) |
|---|---|---|---|---|---|---|---|---|
| LR | 0.8264 | 0.6496 | 0.8104 | 0.8948 | 0.82 | 0.83 | 0.82 | 0.1210 |
| SVM | 0.8382 | 0.6744 | 0.8366 | 0.9115 | 0.84 | 0.84 | 0.84 | 0.4998 |
| DT | 0.8470 | 0.6940 | 0.8627 | 0.8484 | 0.85 | 0.85 | 0.85 | 0.0170 |
| RF | 0.8911 | 0.7841 | 0.9215 | 0.9546 | 0.89 | 0.89 | 0.89 | 1.4577 |
| GB | 0.8852 | 0.7698 | 0.8954 | 0.9503 | 0.88 | 0.89 | 0.88 | 2.2235 |
| KNN | 0.8088 | 0.6135 | 0.7843 | 0.8846 | 0.81 | 0.81 | 0.81 | 0.0137 |
| XGBoost | 0.8882 | 0.7761 | 0.9019 | 0.9495 | 0.89 | 0.89 | 0.89 | 3.3394 |
| CatBoost | 0.9058 | 0.8116 | 0.9215 | 0.9629 | 0.90 | 0.91 | 0.91 | 1.3837 |
| ET | 0.8852 | 0.7698 | 0.8954 | 0.9391 | 0.88 | 0.89 | 0.88 | 0.8526 |
| Voting (CatBoost + GB) | 0.8970 | 0.7959 | 0.9281 | 0.9624 | 0.90 | 0.90 | 0.90 | 2.8875 |
| Stacking (CatBoost + GB) | 0.9058 | 0.8132 | 0.9346 | 0.9641 | 0.90 | 0.91 | 0.91 | 12.2180 |
Table 7.
Performance comparison of hyperparameter-tuned machine learning models for liver disease classification, including train/test accuracy, per-class metrics, macro-average scores, MCC, and specificity.
Table 7.
Performance comparison of hyperparameter-tuned machine learning models for liver disease classification, including train/test accuracy, per-class metrics, macro-average scores, MCC, and specificity.
| Model | Class | Train Acc. | Test Acc. | Precision | Recall | F1 Score | MCC | Specificity |
|---|---|---|---|---|---|---|---|---|
| LR | Diseased | 0.83 | 0.84 | 0.86 | 0.84 | 0.85 | 0.67 | 0.84 |
| Healthy | 0.81 | 0.83 | 0.82 | |||||
| Macro Avg | 0.84 | 0.84 | 0.84 | |||||
| SVM | Diseased | 0.84 | 0.83 | 0.85 | 0.84 | 0.85 | 0.66 | 0.84 |
| Healthy | 0.81 | 0.82 | 0.81 | |||||
| Macro Avg | 0.83 | 0.83 | 0.83 | |||||
| DT | Diseased | 0.99 | 0.84 | 0.86 | 0.83 | 0.85 | 0.67 | 0.83 |
| Healthy | 0.81 | 0.84 | 0.82 | |||||
| Macro Avg | 0.83 | 0.84 | 0.83 | |||||
| RF | Diseased | 0.99 | 0.90 | 0.91 | 0.90 | 0.91 | 0.79 | 0.90 |
| Healthy | 0.88 | 0.90 | 0.89 | |||||
| Macro Avg | 0.89 | 0.89 | 0.89 | |||||
| GB | Diseased | 0.96 | 0.89 | 0.90 | 0.90 | 0.90 | 0.78 | 0.90 |
| Healthy | 0.88 | 0.88 | 0.88 | |||||
| Macro Avg | 0.89 | 0.89 | 0.89 | |||||
| kNN | Diseased | 0.88 | 0.84 | 0.87 | 0.83 | 0.85 | 0.68 | 0.83 |
| Healthy | 0.81 | 0.85 | 0.83 | |||||
| Macro Avg | 0.84 | 0.84 | 0.84 | |||||
| CatBoost | Diseased | 0.96 | 0.91 | 0.93 | 0.91 | 0.92 | 0.82 | 0.91 |
| Healthy | 0.89 | 0.92 | 0.90 | |||||
| Macro Avg | 0.91 | 0.91 | 0.91 | |||||
| XGBoost | Diseased | 0.99 | 0.89 | 0.90 | 0.90 | 0.90 | 0.77 | 0.90 |
| Healthy | 0.88 | 0.88 | 0.88 | |||||
| Macro Avg | 0.89 | 0.89 | 0.89 | |||||
| ET | Diseased | 1.00 | 0.87 | 0.88 | 0.90 | 0.89 | 0.74 | 0.90 |
| Healthy | 0.87 | 0.84 | 0.86 | |||||
| Macro Avg | 0.87 | 0.87 | 0.87 |
Table 8.
Performance metrics of ensemble classifiers on the liver disease dataset. Macro-averaged metrics are shown directly after each Train/Test set
Table 8.
Performance metrics of ensemble classifiers on the liver disease dataset. Macro-averaged metrics are shown directly after each Train/Test set
| Model | Set | Accuracy | MCC | Specificity | Precision | Recall | F1-Score | Time (s) |
|---|---|---|---|---|---|---|---|---|
| Voting (Catboost+GB) | Train | 0.957 | 0.912 | 0.967 | 0.957 | 0.955 | 0.956 | 0.050 |
| Macro Avg | - | - | - | 0.957 | 0.955 | 0.956 | - | |
| Test | 0.918 | 0.835 | 0.938 | 0.918 | 0.917 | 0.917 | 0.028 | |
| Macro Avg | - | - | - | 0.920 | 0.918 | 0.919 | - | |
| XAI-LiverSHAPNet | Train | 0.959 | 0.916 | 0.967 | 0.959 | 0.958 | 0.958 | 0.052 |
| Macro Avg | - | - | - | 0.959 | 0.958 | 0.958 | - | |
| Test | 0.944 | 0.889 | 0.972 | 0.946 | 0.943 | 0.944 | 0.017 | |
| Macro Avg | - | - | - | 0.945 | 0.945 | 0.944 | - |
Table 9.
Ten-fold stratified cross-validation mean accuracy (± standard deviation) for all classifiers and ensemble models after hyperparameter tuning.
Table 9.
Ten-fold stratified cross-validation mean accuracy (± standard deviation) for all classifiers and ensemble models after hyperparameter tuning.
| Model | Mean CV Accuracy ± SD |
|---|---|
| LR | 0.83 ± 0.03 |
| SVM | 0.83 ± 0.03 |
| DT | 0.85 ± 0.03 |
| RF | 0.90 ± 0.02 |
| GB | 0.91 ± 0.02 |
| KNN | 0.82 ± 0.03 |
| CatBoost | 0.92 ± 0.01 |
| XGB | 0.90 ± 0.03 |
| ET | 0.89 ± 0.03 |
| Voting Ensemble(Catboost+GB) | 0.9259 ± 0.0132 |
| XAI-LiverSHAPNet | 0.9312 ± 0.0151 |
Table 10.
Comprehensive statistical evaluation of the proposed model XAI-LiverSHAPNet on the liver disease dataset. Mean scores and results of Paired t-test, Wilcoxon Signed-Rank test, and One-Way ANOVA are shown.
Table 10.
Comprehensive statistical evaluation of the proposed model XAI-LiverSHAPNet on the liver disease dataset. Mean scores and results of Paired t-test, Wilcoxon Signed-Rank test, and One-Way ANOVA are shown.
| Metric | Description / Test | Result |
|---|---|---|
| Accuracy | Mean Accuracy (Voting vs Stacking) | 0.9259 vs 0.9312 |
| Paired t-test | , | |
| Wilcoxon Signed-Rank | , | |
| One-Way ANOVA | , | |
| F1-Score | Mean F1 (Voting vs Stacking) | 0.9171 vs 0.9230 |
| Paired t-test | , | |
| Wilcoxon Signed-Rank | , | |
| One-Way ANOVA | , | |
| Kappa | Mean Kappa (Voting vs Stacking) | 0.8501 vs 0.8608 |
| Paired t-test | , | |
| Wilcoxon Signed-Rank | , | |
| One-Way ANOVA | , | |
| MCC | Mean MCC (Voting vs Stacking) | 0.8510 vs 0.8619 |
| Paired t-test | , | |
| Wilcoxon Signed-Rank | , | |
| One-Way ANOVA | , | |
| Balanced Accuracy | Mean Balanced Accuracy | 0.9245 vs 0.9298 |
| Paired t-test | , | |
| Wilcoxon Signed-Rank | , | |
| One-Way ANOVA | , | |
| Youden’s J | Mean Youden’s J | 0.8490 vs 0.8596 |
| Paired t-test | , | |
| Wilcoxon Signed-Rank | , | |
| One-Way ANOVA | , | |
| ROC AUC | Mean ROC AUC | 0.9541 vs 0.9557 |
| Paired t-test | , | |
| Wilcoxon Signed-Rank | , | |
| One-Way ANOVA | , | |
| Brier Score | Mean Brier Score | 0.0756 vs 0.0628 |
| Paired t-test | , | |
| Wilcoxon Signed-Rank | , | |
| One-Way ANOVA | , | |
| Log Loss | Mean Log Loss | 0.2830 vs 0.2466 |
| Paired t-test | , | |
| Wilcoxon Signed-Rank | , | |
| One-Way ANOVA | , | |
| PR AUC | Mean PR AUC | 0.9367 vs 0.9380 |
| Paired t-test | , | |
| Wilcoxon Signed-Rank | , | |
| One-Way ANOVA | , |
Table 11.
Ablation study for features: Evaluate classifier performances of Stacking and Voting by sequentially deleting features.
Table 11.
Ablation study for features: Evaluate classifier performances of Stacking and Voting by sequentially deleting features.
| Removed Feature | Accuracy | MCC | Precision | Recall | F1-Score |
|---|---|---|---|---|---|
| Stacking Classifier | |||||
| AlcoholConsumption | 0.7853 | 0.5647 | 0.7843 | 0.7805 | 0.7818 |
| LiverFunctionTest | 0.7265 | 0.4460 | 0.7237 | 0.7222 | 0.7228 |
| Gender | 0.8529 | 0.7038 | 0.8512 | 0.8526 | 0.8518 |
| Smoking | 0.8794 | 0.7596 | 0.8781 | 0.8815 | 0.8789 |
| BMI | 0.8824 | 0.7643 | 0.8808 | 0.8835 | 0.8817 |
| Age | 0.8676 | 0.7328 | 0.8662 | 0.8666 | 0.8664 |
| PhysicalActivity | 0.9059 | 0.8142 | 0.9051 | 0.9091 | 0.9056 |
| GeneticRisk | 0.9029 | 0.8049 | 0.9014 | 0.9034 | 0.9022 |
| Hypertension | 0.9118 | 0.8242 | 0.9104 | 0.9138 | 0.9113 |
| Diabetes | 0.9206 | 0.8410 | 0.9191 | 0.9219 | 0.9201 |
Table 12.
Comparison of XAI-LiverSHAPNet with selected state-of-the-art methods.
| Study | Performance Score | Strengths & Explainability | Limitations |
|---|---|---|---|
| [15] | Extra Trees Accuracy: 92% | User-friendly early detection | Lacks interpretability; limited integration |
| [16] | Ensemble Classifier Accuracy: 90.88% | SHAP + LIME; Interpretable predictions | Limited to symptomatic patients |
| [17] | Logistic Regression AUC: 0.867 | SHAP; Interpretable insights | Focused on Diabetic Retinopathy population only |
| [18] | Random Forest AUC: 0.928 | SHAP; Explainable 10-feature model | Single-center data; mostly US population |
| XAI-LiverSHAPNet (Proposed) | Custom Ensemble (CatBoost + Gradient Boosting) Test Accuracy: 94.4% CV Accuracy | SHAP + t-SNE/UMAP; Early detection; hybrid visualization; Enables binary liver disease identification; Supports clinical decision-making | Slightly higher training complexity |
Disclaimer/Publisher’s Note: The statements, opinions and data contained in all publications are solely those of the individual author(s) and contributor(s) and not of MDPI and/or the editor(s). MDPI and/or the editor(s) disclaim responsibility for any injury to people or property resulting from any ideas, methods, instructions or products referred to in the content. |
© 2026 by the authors. Licensee MDPI, Basel, Switzerland. This article is an open access article distributed under the terms and conditions of the Creative Commons Attribution (CC BY) license (http://creativecommons.org/licenses/by/4.0/).
Copyright: This open access article is published under a Creative Commons CC BY 4.0 license, which permit the free download, distribution, and reuse, provided that the author and preprint are cited in any reuse.