
Submitted:
02 October 2026
Posted:
06 October 2026
You are already at the latest version
Abstract
Background: Unhealthy dietary patterns and nutrition literacy level are some of the major modifiable risk factors for non-communicable disease in Saudi Arabia. Theoretically, nutrition knowledge, self-efficacy for healthy eating and perceived social support are believed to play a role in healthy lifestyle adoption, but there is a limited local evidence of these constructs from university samples in the Jazan region. Design: A descriptive study.Objective: To describe the nutrition knowledge, self-efficacy and perceived social support of female students and staff of Jazan University and to investigate their relationships with self-reported Body Mass Index (BMI). Methods: A cross-sectional design was used. The researcher gathered the data using a self-administered online questionnaire, filled out in Arabic and English, which included the following items: sociodemographic items, eight multiple-choice items on nutrition knowledge, a seven-item self-efficacy scale and a six-item perceived social support scale (both on 5-point Likert scales) and self-reported height and weight. Internal consistency was measured for the Likert scales with Cronbach’s alpha and for the knowledge items with KR-20. Spearman correlation coefficient, Kruskal-Wallis test and multiple linear regression were used to look at associations. A p-value of < 0.05 was defined as statistically significant. Twenty-four people filled out the survey (75.0% students, 20.8% faculty, 4.2% administrative/technical staff; 62.5% age 18-22 years). The mean score for nutrition knowledge was 6.58/8 (SD = 1.59; 82.3% correct) with the lowest mean item correctness rate of 41.7% on the recommended daily fruit/vegetable servings item. Mean self-efficacy was 3.39 (SD = 0.65, range 1-5) and mean perceived social support was 3.36 (SD = 0.57). The reliability of the self-efficacy scale was acceptable (Cronbach’s alpha = 0.70), as was that of the knowledge scale (KR-20 = 0.64), but not for the social support scale (alpha = 0.54). After two underweight/height and overweight/height pairs were excluded, the average self-reported BMI of the remaining 22 cases was 23.9 kg/m2 (SD = 5.2) and 29.2% of the subjects were classified as underweight and 20.8% were considered obese. There was a significant (Spearman’s rho = -0.47, p = 0.026) and negative correlation between BMI and perceived social support in a multiple regression model controlling for nutrition knowledge (B = -6.89, p = 0.009). The role and age group were not significantly related to knowledge or self-efficacy or to social support (p > 0.05 for all). Conclusion: This preliminary sample showed that nutrition knowledge was relatively high, but varied by topic. Self-reported BMI was most closely related to perceived social support, and not to nutrition knowledge. Although these preliminary findings from a small convenience sample should be interpreted with caution and future studies with a larger, more adequately powered sample are needed to confirm these results, the results do suggest that social-support oriented components would be a potentially useful addition to campus nutrition education programming.
Keywords:
self-efficacy
; social support
; body mass index
; university students
; nutrition knowledge
; Saudi Arabia
; cross-sectional study
1. Introduction
1.1. Background and Rationale
Diet-related non-communicable diseases (NCDs) including obesity, type 2 diabetes mellitus, cardiovascular diseases and hypertension are one of the biggest public health issues of the 21st century. In the Saudi Arabian context a rapid urbanisation rate, economic development and a nutrition transition towards energy-dense, highly processed foods has been correlated with the increase of overweight and obesity, particularly in females and young adults. There is a high level of opportunity for early and cost-effective health promotion and young adults’ independence in making food choices in the University setting makes it a high risk environment.
Evidence in the international literature has consistently shown nutrition education to be an effective intervention, but not enough to change behaviors. People know that eating fruit and vegetables has nutritional value but they also know that trans fats are not healthy – but they don’t necessarily translate that into eating five servings of fruits and vegetables each day – or change their shopping habits when they go to the university cafeteria. Social and behavioral scientists have been increasingly targeting psychosocial mediators that are primarily self-efficacy (a person’s self-belief or confidence in his or her ability to engage in a health behavior in real world situations) and perceived social support (the reinforcement received or felt from family, friends and environment).
The aim of this report was to explain the nutrition knowledge, self-efficacy, perceived social support and anthropometric status and to assess the mutual relationship between the nutrition knowledge, self-efficacy and perceived social support among female students and staff of Jazan University, which is a first cross sectional survey conducted in a local population not previously surveyed.
The present report is a practical, decision-oriented form of institutional research, as opposed to a theoretical exercise: all of the constructs measured here are directly related to an actionable lever for campus health planners, either in the form of curriculum content (knowledge), individually targeted counseling or skill-building (self-efficacy), or environmental or family-engagement programming (social support); the statistical results that follow in Section 4 can, therefore, be read directly as a prioritization guide for the allocation of limited health-promotion resources at Jazan University.
1.2. Problem Statement
Although general health-awareness activity is common on Saudi university campuses, to the knowledge of the research team, no quantitative evidence has been previously documented locally on the inter-relationship between nutrition knowledge, self-efficacy and social support and objectively relevant outcomes such as BMI within the Jazan University community. Without this evidence, health promotion programming on campus is at risk of being built on assumptions imported from other populations and contexts rather than on the actual cognitive and social profile of the Jazan University community itself.
1.3. Theoretical Framework
The theoretical framework for this study is Bandura’s Social Cognitive Theory (SCT), which conceptualizes health behavior as resulting from a dynamic, reciprocal interaction between personal cognitive factors (e.g., knowledge and self-efficacy beliefs), behavioral factors, and environmental factors (e.g., the social support available to an individual). Nutrition knowledge is described here as a necessary input, self-efficacy as the proximal cognitive driver of whether that knowledge is acted upon, and social support as an environmental resource that can facilitate or undermine translation of intention into sustained behavior. This theoretical structure is directly operationalized in the analytic strategy of this report – to examine knowledge, self-efficacy, and social support individually and in combination as predictors of BMI.
1.4. Research Objectives
General Objective:
To describe and analyze the levels of nutrition knowledge, self-efficacy for healthy eating and perceived social support among female students and staff at Jazan University and to examine their association with self-reported body mass index.
Specific Objectives:
Description of the sociodemographic and anthropometric profile of the sample.
To assess the degree of nutrition knowledge and its distribution at the item level.
To evaluate perceived social support and self-efficacy for healthy eating
To evaluate the internal consistency (reliability) of the knowledge, self-efficacy and social support tools in this sample.
To explore the bivariate associations of nutrition knowledge, self-efficacy, social support and BMI.
To determine if there are significant differences in nutrition knowledge, self-efficacy, and social support by role (student/faculty/staff) and age group.
To use multiple linear regression to model the independent contribution of self-efficacy and knowledge to social support, and social support and knowledge to BMI.
1.5. Research Questions and Hypotheses
Research Questions:
What is the current level of nutrition knowledge, self-efficacy and perceived social support among female students and staff of Jazan University?
Is self-reported BMI associated with nutrition knowledge, self-efficacy and perceived social support?
Are these constructs meaningfully different by role or by age group?
Hypotheses:
H1.
Nutrition knowledge correlates positively with self-efficacy for healthy eating.
H2.
Perceived social support is positively associated with self-efficacy for healthy eating.
H3.
Self-reported BMI is significantly associated with perceived social support and/or nutrition knowledge.
2. Literature Review
2.1. Nutrition Knowledge and Health Behavior
Nutrition knowledge has been associated with dietary quality in a large body of research, but the association is always moderate, not deterministic. Systematic reviews of nutrition education interventions have shown that knowledge-based programming can reliably increase short-term test scores of factual nutrition knowledge, but that translating this knowledge into sustained behavior change requires interventions that also build practical skills and address motivational and environmental barriers. Particularly among Saudi university students, studies have reported generally adequate but uneven nutrition knowledge with common gaps around portion sizing, recommended fruit and vegetable intake and the interpretation of food labels. The item-level results of this report substantially reproduce this pattern.
2.2. Self-Efficacy and Dietary Behavior
Within Bandura’s Social Cognitive Theory, self-efficacy is one of the most consistently replicated psychological correlates of dietary behavior change in the international literature. Individuals with higher self-efficacy for healthy eating report greater success resisting situational temptations (e.g., fast food while traveling or socializing), greater consistency of behavior under stress, and better maintenance of behavior change over time. Self-efficacy is domain- and situation-specific, and well-designed instruments (such as the one used in this study) are able to measure confidence in a variety of realistic situations (i.e., eating out, during academic or occupational stress, in the face of temptation, and in advance meal planning) rather than a single global item.
2.3. Social Support and Weight-Related Outcomes
International literature has linked perceived social support (including encouragement from family, peers, and the immediate physical/institutional surroundings) to both the initiation and long-term maintenance of healthy dietary behavior, and to lower body weight and reduced weight-gain trajectories in several cohort and cross-sectional studies. Mechanistically, social support is thought to work both directly (via the provision of practical resources such as availability of healthy foods and shared meal preparation) and indirectly (via reinforcement of self-efficacy beliefs and buffering of the psychological stress that is itself an independent risk factor for disordered or emotionally driven eating). This is in line with the literature on the finding of the present study of a significant inverse association between social support and BMI (Section 4.8), although the cross-sectional design does not permit causal inference.
2.4. University Populations and Nutrition Research in Saudi Arabia
Several recent Saudi and Gulf region studies have investigated the nutrition knowledge and practices of university populations. Alzaben et al. The efficacy of a nutrition education and intervention program for the general population was evaluated at Princess Nourah Bint Abdulrahman University by ((2021). The researchers discovered that participants’ levels of knowledge and dietary practices improved significantly after an experimental study. Zaghamir and Ibrahim (2023) also conducted a study looking at the gaps in nutrition knowledge and practice among nursing students. Researchers drew a calculated sample size of institutional, population-based. Similarly, the research proposal of this study adopted a similar approach to determine the sample size required for this study. Dodge et al. (2025) and Alsharif (2025) undertook a regional level scoping and systematic review in an effort to explore the overall state of research on nutrition behavior in the Gulf region. It seems a lack of research related to nutrition knowledge and behavior using quantitative methods in the region especially in individual institutions where they are located in Jazan area.
2.5. The Interplay of Knowledge, Self-Efficacy, and Social Support: An Integrated View
A recurring theme in the health behavior literature is that knowledge, self-efficacy, and social support are not three separate, additive inputs to behavior, but a partially overlapping and mutually reinforcing system: knowledge can raise self-efficacy by providing a concrete sense of what to do; social support can rise self-efficacy by providing vicarious models of success (e.g., observing a family member change their diet effectively) and verbal persuasion (encouragement from peers); and self-efficacy in turn has been shown in longitudinal work to predict whether an individual is likely to actively seek out further nutrition knowledge and develop supportive social relationships around health behavior, in the first place. This reciprocal, and not purely linear, structure is exactly what Bandura’s Social Cognitive Theory (Section 1.3) predicts, and why this report examines the three constructs jointly (via correlation and regression) rather than treating nutrition knowledge in isolation, as a purely knowledge-transmission model of health education would imply.
This integrated perspective also has a direct implication for interpreting the results of the present study: a non-significant bivariate correlation between knowledge and self-efficacy (Section 4.8) should not be interpreted as indicating that knowledge is irrelevant to behavior change, but rather that in this particular sample and at this particular (small) sample size, the pathway from knowledge to behavior may be running via more social and environmental channels than a direct knowledge-to-confidence link -- exactly the pattern this report’s regression findings (Section 4.10) suggest.
3. Methodology
3.1. Study Design
This report is a quantitative, observational, cross-sectional analysis. Data were collected at one time point using a self-administered structured online questionnaire; no intervention or follow-up assessment was performed.
3.2. Study Setting and Population
The study was conducted on female students, faculty members and Administrative/Technical staff of Jazan University, Jazan, Kingdom of Saudi Arabia.
3.3. Sampling and Recruitment
Participants were recruited by convenience sampling using institutional digital channels (email and other official communication channels of the university). The questionnaire link was sent out over a period of several days in September 2026. This report provides a review of all 24 full or near-full submissions received as of the data extraction date, and therefore constitutes a preliminary/pilot-stage dataset, not the full sample targeted in the parent study protocol (roughly 450-500 respondents), and all inferential results should be taken with that in mind (see Section 6, Limitations).
3.4. Data Collection Instrument
-
The questionnaire was self-administered bilingual (Arabic and English) and consisted of the following sections:Electronic informed consentSociodemographic data included: role, age group, marital status, educational level, household income and residence (urban/rural).Self-reported anthropometric data, including height (cm) and weight (kg) for calculation of body mass index (kg/m2).Nutrition Knowledge Scale consisted of eight multiple-choice/true-false questions on the recommended number of servings of fruits and vegetables, low-fat protein sources, recommended number of glasses of water intake, types of dietary fats, food label skills, frequency of breakfast consumption, sodium content in processed foods, and dietary fiber sources. The answer options were true/false or multiple choice; the total points possible were 0-8, with 1 point for each correct answer.
- Self-Efficacy for Healthy Eating Scale composed of seven items (four of them included a rating-scale grid and three were stand-alone items) to assess self-efficacy in adhering to a healthy diet in specific circumstances, such as eating out, facing academic or occupational stress, avoiding tempting foods, planning meals ahead, avoiding social temptations, being confident in reading food labels, and adapting the diet in accordance with travel or other adjustments; each item was measured using a 5-point Likert scale (1 = I am not at all confident; 5 = I am extremely confident).
- Perceived Social Support Scale composed of six items to measure perceived social support, such as encouragement from family members, friends, and peers, food availability in the household, having a confidant to talk with about health issues, food availability on the campus, and the general supportive atmosphere of the work/study environment; each item was measured using a 5-point Likert scale (1 = strongly disagree; 5 = strongly agree).
- The attention-check item that was included in the study to determine participants’ who might have been paying less attention to the survey items was “To ensure that we collect accurate information, please select “Agree” for this question.”
3.5. Data Collection Procedure
The questionnaire was hosted on Google Forms and distributed as a single link . Responses were automatically collected in a linked spreadsheet and exported as a CSV format for analysis as described below. No personal identification information (name, national ID or phone number) was gathered.
3.6. Data Cleaning and Preparation
Prior to analysis, the exported dataset was programmatically cleaned as follows. Self-reported height/weight values (comprising a mix of Western and Arabic-Indic numerals and inconsistent unit suffixes like “cm” or “Kg”) were parsed into a common numeric form. Two respondents had height/weight combinations that fell outside the plausible range for an adult (BMI < 10 or > 45; namely, a reported 22 kg at 160 cm and a reported 32 kg at 140 cm, the former of which is not physiologically viable for a living adult and is flagged as a data-entry error); both were retained in the complete dataset for knowledge, self-efficacy, and social-support analyses but omitted from analyses pertaining directly to BMI, which are therefore based on n = 22. Likert-scale responses were parsed from their bilingual text labels (e.g., “4 (Agree)”) into numeric values 1-5. Knowledge items were scored against a predefined answer key (Table 3.1, reproduced in Section 4.4).
3.7. Statistical Analysis Plan
Descriptive statistics (frequencies and percentages for categorical variables; means, standard deviations, medians, and ranges for continuous variables) were calculated for all sociodemographic, anthropometric, knowledge, self-efficacy, and social-support variables. Internal consistency of the Likert-scaled self-efficacy and social support scales was evaluated with Cronbach’s alpha; that of the dichotomous-scored knowledge scale, with the KR-20 coefficient (mathematically equivalent to Cronbach’s alpha applied to dichotomous items). The Shapiro-Wilk test was used to assess normality of the continuous composite scores; since the knowledge score departed significantly from normality while self-efficacy, social support, and BMI did not, Spearman’s rank correlation coefficient (rather than Pearson’s r) was used in all bivariate correlation analyses for consistency and robustness to non-normality and small sample size. Group differences (by role and age group) were evaluated with the Kruskal-Wallis H test, a non-parametric alternative to one-way ANOVA suitable for small, non-normally distributed samples. Multiple linear regression (Ordinary Least Squares) was used to (a) predict self-efficacy from nutrition knowledge and social support, and (b) predict BMI from social support and nutrition knowledge. Regressions were intentionally limited to two predictors to maintain a reasonable observations-per-predictor ratio given the small sample size; thus, all results are presented as exploratory. Two-tailed p < 0.05 was used for all statistical tests of significance; analyses were conducted in Python (pandas, SciPy, statsmodels).
3.8. Ethical Considerations
It was voluntary and anonymous to participate. An electronic informed consent statement was presented before the questionnaire and participants could not proceed without indicating agreement. No personally identifiable information was collected. All analyzes presented in this report were conducted on de-identified, coded data (participant IDs P01-P24).
4. Results
4.1. Data Quality and Sample Characteristics
A total of 24 responses were received and included in this analysis. All 24 participants gave consent and answered the great majority of items; item-level missingness ranged from 0 to 1 case (4.2%) across variables, except the embedded attention-check item, which had one missing response. Of the 23 participants who answered the attention-check item, 17 (73.9% of respondents to that item; 70.8% of the full sample) selected the expected response (4 or 5, “Agree”/”Strongly agree”), while 7 selected an unexpected response, a pattern consistent with a mixture of genuinely neutral/disagreeing respondents and a subset of inattentive responding. A sensitivity comparison found no statistically significant difference in nutrition knowledge scores between participants who passed versus failed the attention check (Mann-Whitney U = 71.0, p = 0.456; pass-group mean = 6.82 vs. fail-group mean = 6.00), suggesting that attention-check failure did not materially distort the principal knowledge findings, though this check should be interpreted cautiously given the small subgroup sizes.
Two records (8.3% of the sample) contained self-reported height/weight combinations outside a physiologically plausible range (Section 3.6) and were excluded from BMI-specific analyses only, which are consequently based on n = 22.
4.2. Sociodemographic Profile
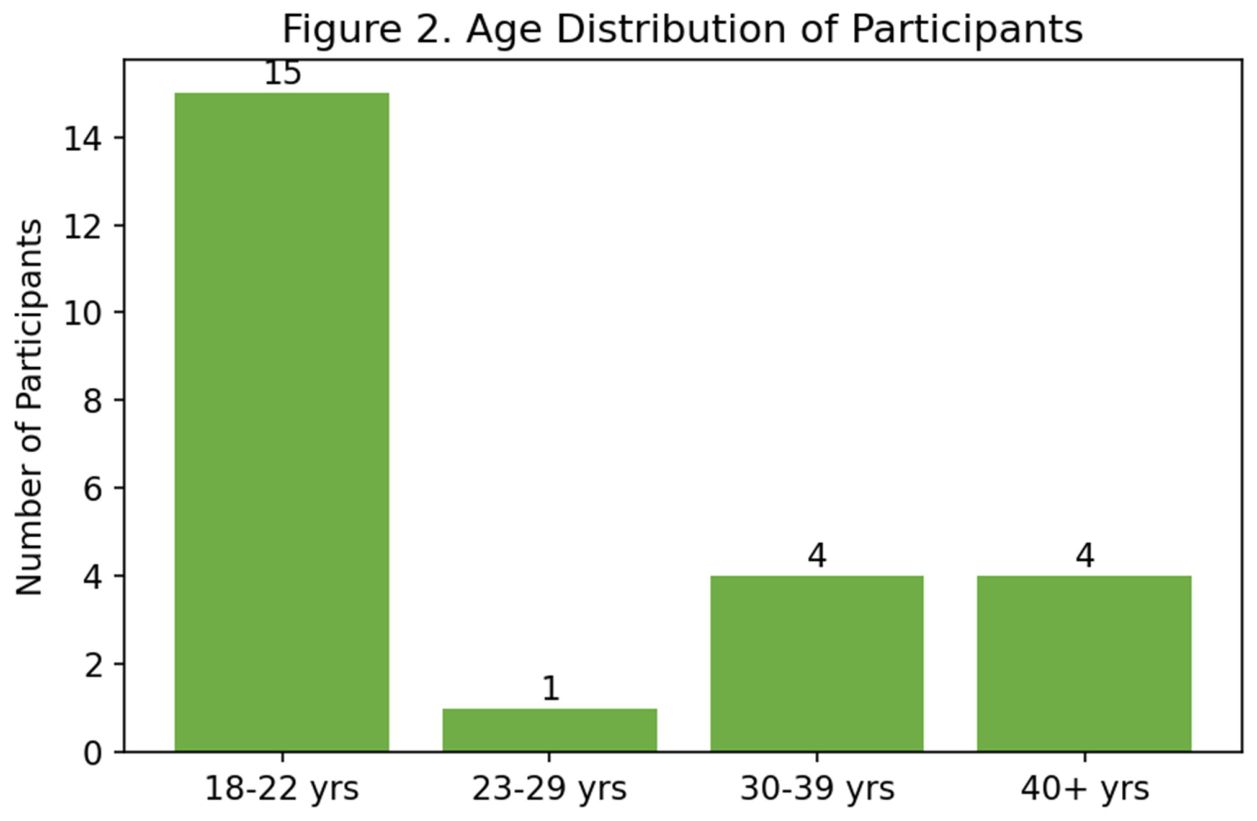
Table 4.1 presents the sociodemographic characteristics of the n = 24 sample. The majority of participants were students (75.0%), while the faculty and administrative/technical personnel accounted for 20.8% and 4.2%, respectively. Over half (62.5%) were in the 18-22 years age group. Two-thirds were single (66.7%), while two-thirds had a bachelor’s degree or were studying for one (66.7%). Approximately a quarter belonged to the medium (25.0%) and lowest (29.2%) income family size categories, while nearly six in ten (58.3%) were city-dwellers.
Figure 1.
Distribution of Participants by Role (n = 24).
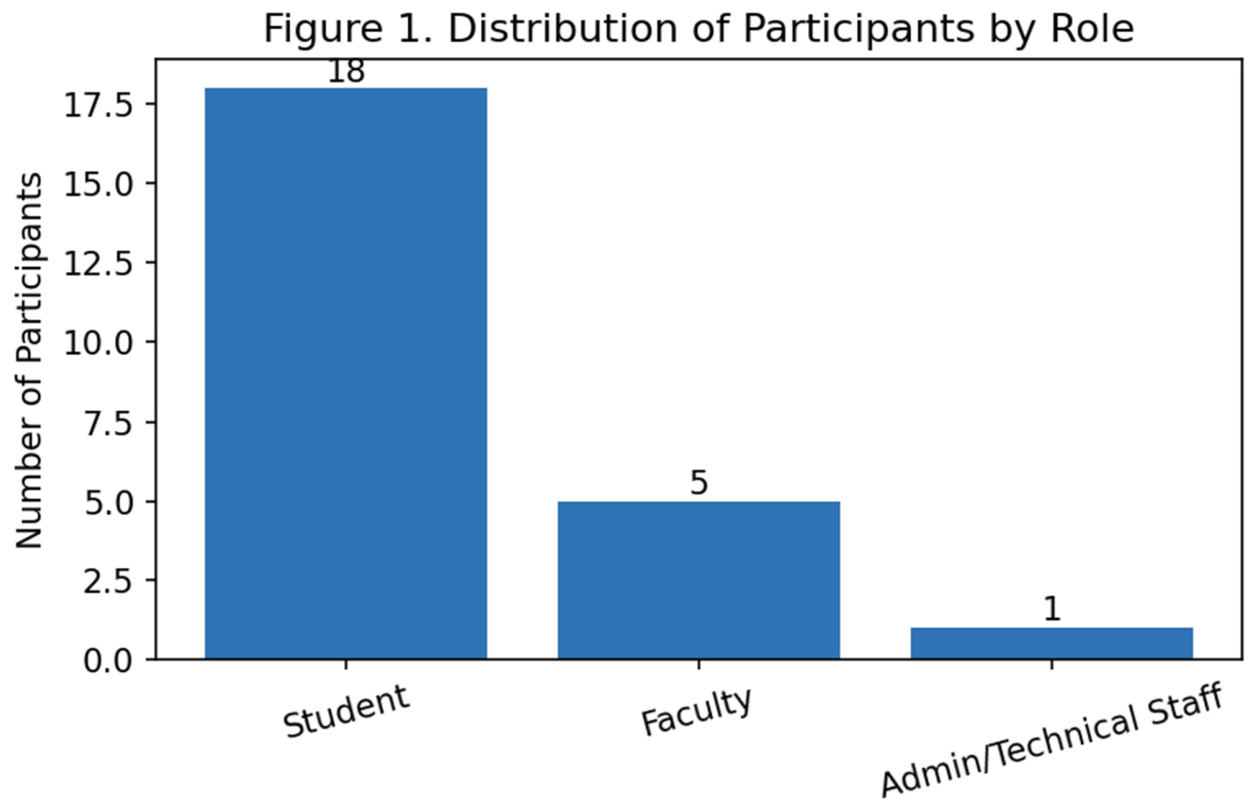
Figure 2.
Age Distribution of Participants (n = 24).
4.3. Anthropometric Profile and BMI
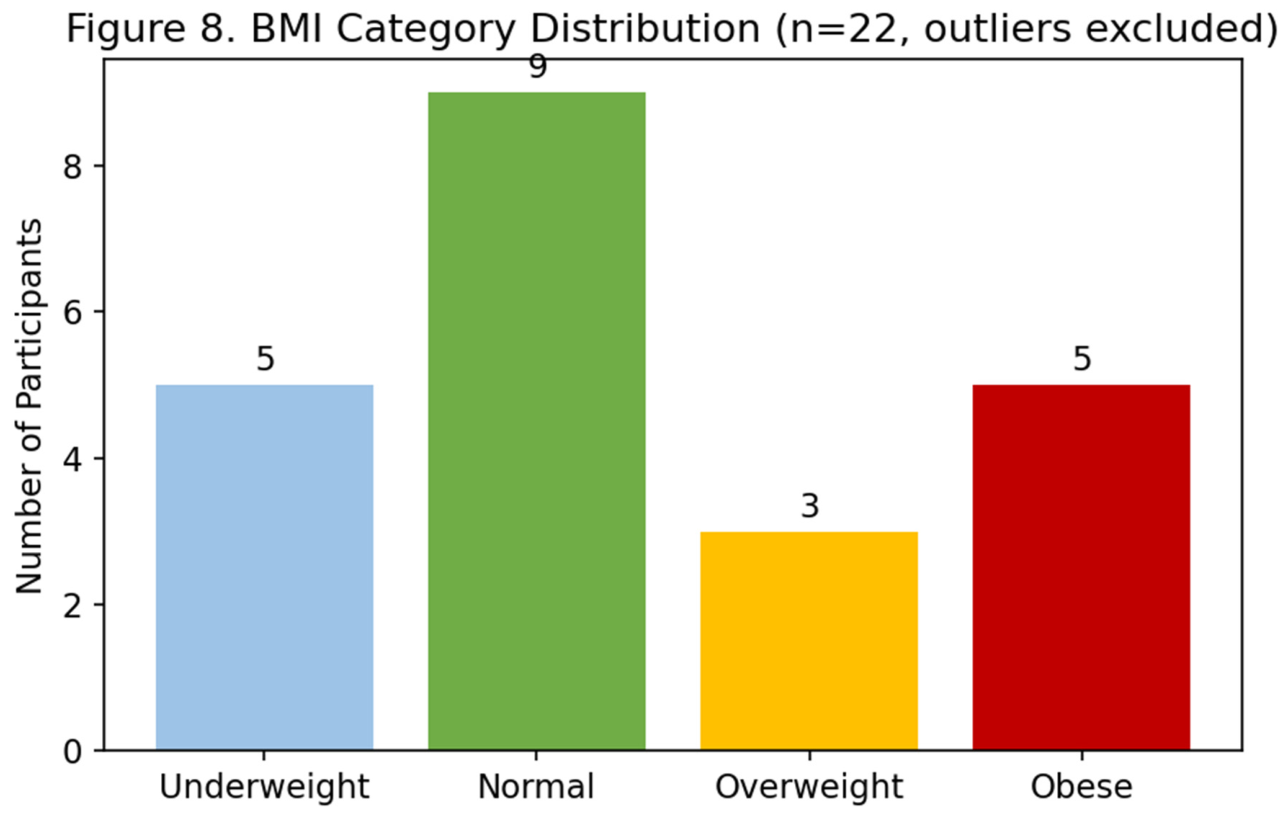
Excluding two implausible records (Section 3.6), mean self-reported BMI was 23.9 kg/m2 (SD = 5.2; median = 23.9; range = 16.0-41.0), meaning that the sample average lies within the WHO ‘Normal weight’ range, albeit with considerable spread. However, classification according to standard WHO BMI categories for the cleaned subsample (n = 22), reveals that a combined 31.8% of respondents fall within the underweight or obese categories, suggesting a bimodal distribution of weight-related risk at either end of the spectrum, rather than a single peak of overweight/obesity, which may have implications for campus health programming traditionally focused on overweight/obesity as the sole health issue.
Figure 8.
BMI Category Distribution (n = 22; WHO cut-points applied to cleaned data).
4.3.1. BMI Category by Role and Age Group (Descriptive Cross-Tabulation)
Table 4.2b and Table 4.2c below represent the distribution of BMI category by role and by age. Since many cells contain 0 or 1 observation, given the tiny sample size for such a distribution across three main categories and four BMI categories, formal tests such as chi-square or Fisher’s exact test are not deemed appropriate and are not performed; the cross-tabulations are descriptive only, representing merely the descriptive statistics to indicate trends without testing them for significance formally. With that being said, note that in all cases, the students in the 30+ age brackets were either faculty members or students, and all the underweight respondents were students in the 18–22 age brackets, representing what may be a trendworthy association to pursue further with a more significant sample size.
4.4. Nutrition Knowledge
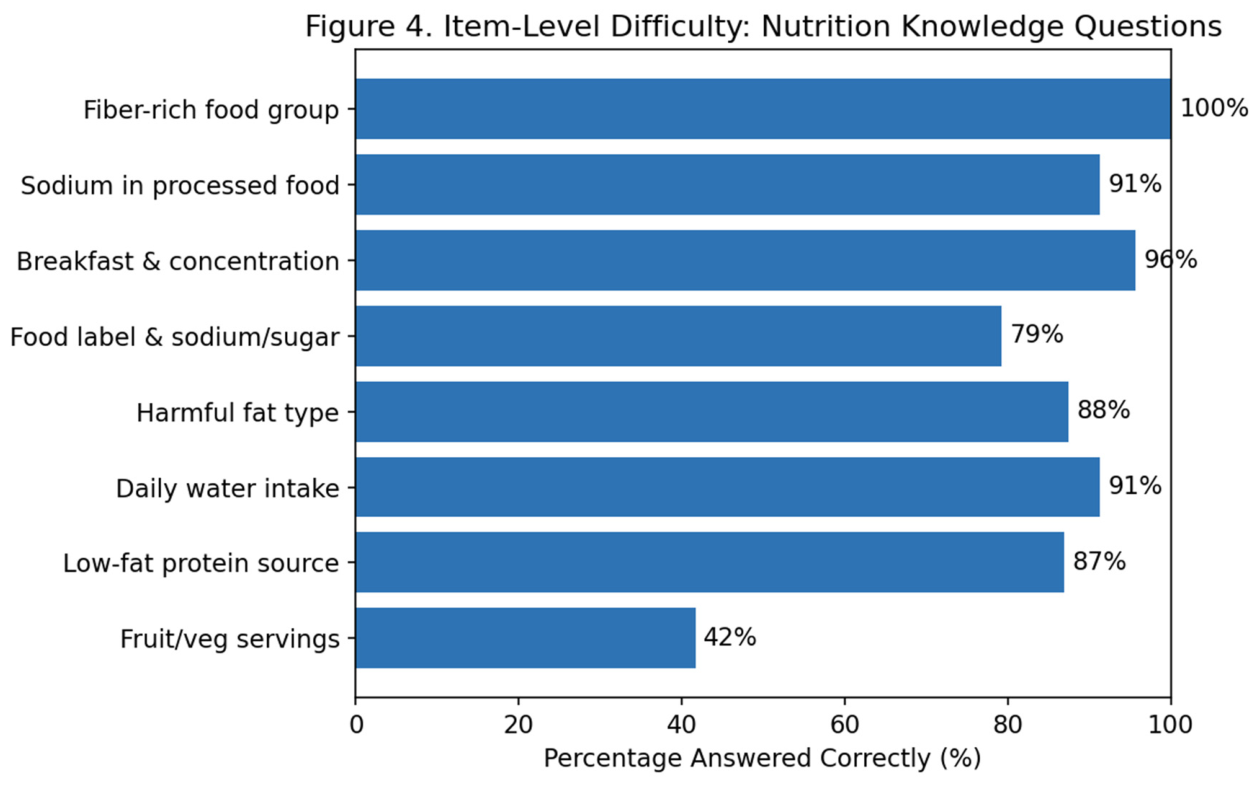
Mean nutrition knowledge score was 6.58 points out of a maximum of 8 (SD = 1.59; median=7.0; range=3-8), equivalent to a mean correctness rate per item of 83.9%. Participants demonstrated varied levels of knowledge of nutrition-related items (Table 4.2, Figure 4). The best knowledge retention was demonstrated for knowledge of the main food group rich in dietary fibers (100% correct answers) and the connection between breakfast eating and improved concentration and weight control (95.7%). The lowest correctness rate was demonstrated for knowledge of the World Health Organization’s recommendation on the number of servings of fruits and vegetables per day: only 41.7% of the participants were familiar with the recommendation of at least 5 servings per day (Figure 4). This is the largest observed gap in nutrition knowledge, which is integral to the planned series of nutrition education interventions.
Figure 3.
Distribution of Overall Nutrition Knowledge Scores (out of 8).
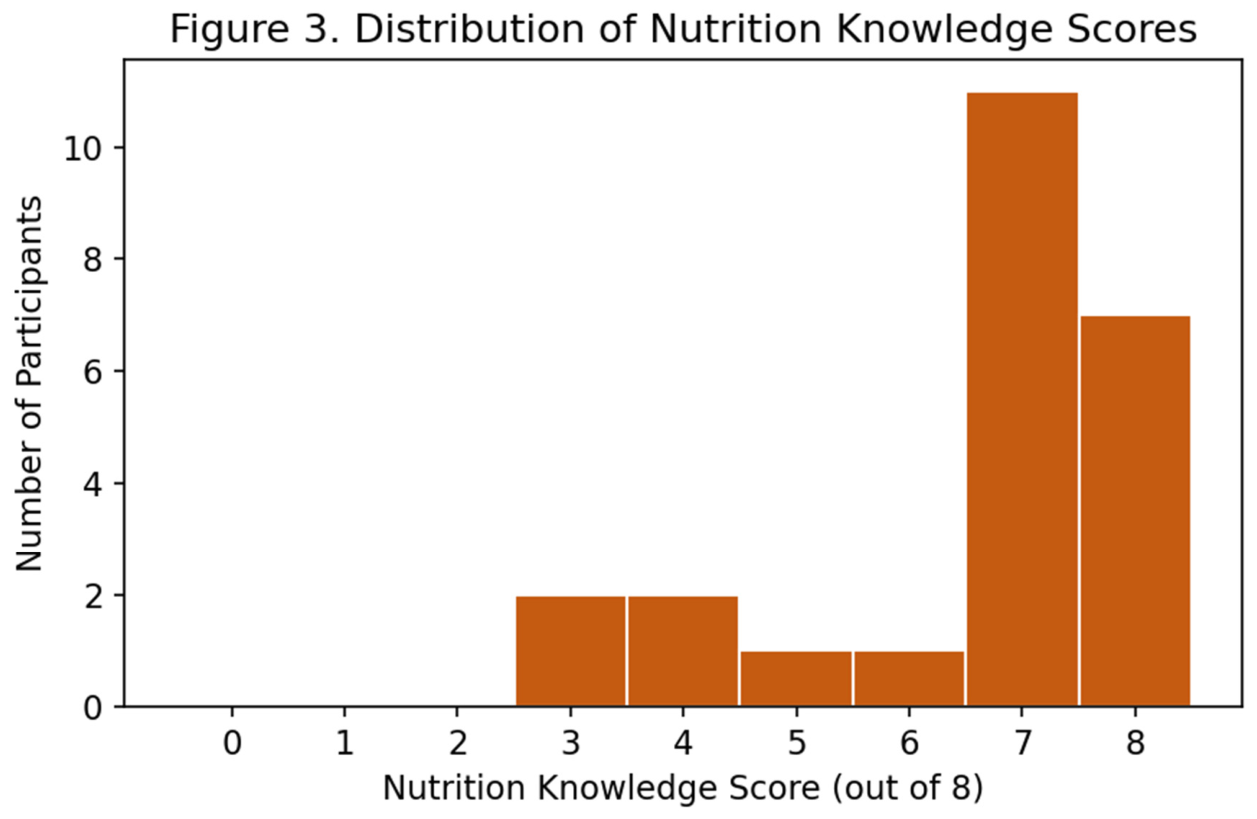
Figure 4.
Item-Level Difficulty: Percentage of Participants Answering Correctly.
4.5. Self-Efficacy for Healthy Eating
Mean self-efficacy score across the seven-item scale was 3.39 (SD = 0.65; median = 3.29; range = 2.00-4.57 on the 1-5 scale), suggesting that in general participants were moderately confident in their ability to perform healthy-eating behaviors under real-world circumstances, with room for improvement (rather than a floor or ceiling) on a number of items.
4.6. Perceived Social Support
The mean perceived social support score across the six-item measure was 3.36 (SD = 0.57; median = 3.33; range = 2.33-4.50), which was approximately equal to the self-efficacy score and thus reflected a moderate rather than high degree of perceived social support on average.
As in Figure 5, the median self-efficacy and social-support scores are approximately similar across student, faculty, and administrative/technical staff subgroups, a pattern that was statistically confirmed in Section 4.9.
4.7. Scale Reliability
Internal consistency reliability, based on complete cases, is summarized in Table 4.3. The self-efficacy scale had an acceptable reliability (Cronbach’s alpha = 0.70, which is conventionally the minimum threshold for acceptable internal consistency), and the KR-20 of 0.64 for the knowledge scale is reasonable for a short, content-diverse 8-item knowledge test of this kind. The reliability of the social support scale (alpha=0.54) was below the usual 0.70 cutoff, a finding discussed further in Section 6 (Limitations): this is most likely due to the scale’s deliberate breadth (family, peer, home, campus, and general-environment support, which are conceptually related but not strictly interchangeable sub-domains) coupled with the very small sample for alpha estimation.
4.8. Correlation Analysis
Spearman correlations between nutrition knowledge, self-efficacy, social support, and body mass index (BMI) are provided in Table 4.4 and displayed graphically in Figure 6. The only statistically significant bivariate association was observed between perceived social support and BMI (rho = -0.59, p = 0.002 in the complete n = 24 sample including outliers; rho = -0.47, p = 0.026 in the outlier-excluded sensitivity sample of n = 22), suggesting that those who perceived higher levels of social support for adopting healthy eating habits reported a lower BMI. This relationship is portrayed in Figure 7. Self-efficacy demonstrated a comparable, albeit slightly weaker and only marginally significant, inverse connection with BMI in the sensitivity sample (rho = -0.46, p = 0.032). Nutrition knowledge was not significantly related to self-efficacy (rho = 0.23, p = 0.271), social support (rho = -0.19, p = 0.375), or BMI (rho = -0.19, p = 0.376) at conventional significance levels, although the association with knowledge was in the expected positive direction (partially consistent with Hypothesis 1). Self-efficacy and social support were positively associated (rho = 0.34) but did not achieve statistical significance at this sample size (p = 0.101), again in the direction consistent with Hypothesis 2.
4.9. Group Comparisons
Table 4.5a presents descriptive means and standard deviations for knowledge, self-efficacy, and social support by role and by age group, which provides the context for the inferential tests in Table 4.5. Compared to faculty (5.80) and the one administrative/technical staff member who responded (4.00), students had the highest mean level of knowledge (6.94), and knowledge decreased steadily with age across the four groups (7.20 for the youngest to 5.25 for those 40 or older), reflecting the borderline significant age effect found for this construct. Compared to knowledge, self-efficacy and social support means were relatively consistent across role and age, which also corresponds to the non-significant test results for these variables.
Kruskal-Wallis tests failed to detect significant differences in nutrition knowledge, self-efficacy, or social support among the various role groups (students/faculty/administrative staff) or across age groups, although in the latter case the difference in knowledge score by age group was close to significance (H = 5.83, p = 0.054), as would be expected given the drop-off in knowledge scores by age bracket seen in Table 4.5a, and consistent with a possible age-related pattern, which would warrant further investigation with a larger sample size. The full test statistics are presented in Table 4.5.
4.10. Regression Analysis
Two exploratory multiple linear regression models were fitted, each restricted to two predictors given the small sample size (Section 3.7).
Model 1: Self-Efficacy regressed on Knowledge and Social Support (n = 24).
The overall model was not statistically significant (F(2,21) = 2.40, p = 0.115, R2 = 0.186, Adjusted R2 = 0.108). Social support approached but did not reach conventional significance as an independent predictor of self-efficacy (B = 0.484, SE = 0.235, p = 0.052), while knowledge was not a significant independent predictor (B = 0.107, SE = 0.084, p = 0.218). Both coefficients have the expected positive sign, but should be considered in the context of an underpowered model rather than disconfirmatory.
Model 2: BMI regressed on Social Support and Knowledge (n = 22, sensitivity sample).
This model was statistically significant overall (F(2,19) = 5.75, p = 0.011, R2 = 0.377, Adjusted R2 = 0.311). Social support was a significant independent negative predictor of BMI (B = -6.89, SE = 2.35, p = 0.009), such that each one-point increase in mean social support score (measured on a 1-5 Likert-type scale) was associated with a 6.89 kg/m2 decrease in BMI, while controlling for knowledge. Finally, knowledge had a negative coefficient, albeit not significant, in this model (B = -1.50, SE = 0.785, p = 0.071). This model provides the strongest quantitative evidence in this report and partly supports Hypothesis 3.
5. Discussion
5.1. Principal Findings
This exploratory study of responses from 24 female students and staff members at Jazan University revealed three key results. Firstly, the participants demonstrated generally good levels of nutrition knowledge (mean item-correct rate: 83.9%) but considerable variability in knowledge levels across different areas, including a striking deficit in the recommended daily allowance of fruits and vegetables. Secondly, self-efficacy and perceived social sources of support were both at a general moderate level and could be enhanced by appropriate interventions. However, most significantly, and uniquely, perceived social support (rather than nutrition knowledge) was most strongly related to a healthier self-reported BMI in multiple regression analyses, controlling for the effect of nutrition knowledge.
5.2. Nutrition Knowledge in Context
The one weakness identified around the specific serving recommendation of fruit and vegetables (41.7%, by far the lowest performing item) is both a generic international challenge (a common finding in nutritional literacy research) and a specific issue for future instruction at Jazan University: namely, that the specific number (the 2:1 fruit-to-vegetables ratio) should not be taken for granted, even among nutrition-literate students, and should therefore be explicitly emphasized in future teaching.
5.3. The Role of Social Support
The key finding of this report, namely, the significant inverse association between perceived social support and BMI (both at the bivariate level and independently of knowledge in multiple regression) has implications for interventions. Thus, efforts to increase participants’ social support networks in relation to healthy eating, such as family-inclusive education sessions, peer-support groups or increasing the perceived availability of healthy options in shared campus spaces, would be likely to have more impact on actual weight-related outcomes than mere knowledge transmission, a point also made by the international literature reviewed in Section 2.3. It is consistent with the theoretical framework (Social Cognitive Theory) underpinning this study, in which environmental/social factors act upon behaviour both directly and via their effect on self-efficacy.
5.4. Self-Efficacy and Its Correlates
Self-efficacy showed hypothesized positive associations with both knowledge and social support and a hypothesized negative association with BMI, but none reached conventional statistical significance in bivariate testing, and self-efficacy was not a significant independent predictor of BMI-model variance after accounting for social support. Given the theoretical centrality of self-efficacy in driving behavior, this pattern of positive-but-non-significant associations is most plausibly attributable to the limited statistical power of the sample (Section 6) and should be revisited once the full target sample is collected.
5.5. Comparison with Prior Literature
The generally adequate-to-good levels of knowledge observed here are largely consonant with past Saudi university-based nutrition knowledge evaluations (e.g., Alzaben et al., 2021; Zaghamir & Ibrahim, 2023), which also report moderately adequate yet variably distributed baseline nutrition knowledge, suggesting that the specific gaps identified in Section 4.4/5.2 represent a viable starting-point for future intervention programming, rather than an aberration unique to this population sample.
5.6. Item-Level Social Support: The Campus Food Environment Gap
Breaking down the social support scale into the six constituent items (Appendix C, Table C2) reveals that the composite mean obscures a pattern of interest. The items that measured interpersonal support (family encouragement: M = 3.79; friend/colleague support: M = 3.71; having a confidant health goal-oriented: M = 3.62) were all rated more positively than the environmental support items, and particularly the item about campus healthy food access (M = 2.43, which was the lowest rated item on either of the scales used in this study). The difference between relatively positive perception of interpersonal support and the low perception of physical/institutional support is in itself an actionable finding (for participants feel emotionally and socially supported in the intention, but less supported to actually act upon it in the physical campus food environment), a nuance which the composite social-support score does not capture, and which bears direct relevance to campus dining and cafeteria policy.
5.7. Study Strengths
Notwithstanding its small initial sample size, this study has several strengths. It operationalizes and measures three theoretically related constructs (knowledge, self-efficacy, social support) in a single instrument, rather than focusing on knowledge alone (a common practice in much of the regional literature). Data cleaning was done in a transparent, replicable way, with clear instructions for outlier anthropometric values and an embedded attention check that provides a direct empirical basis for assessing data quality, rather than simply an a priori assumption about subjects’ attentiveness. Bilingualism in the population makes an Arabic/English instrument a good choice for minimizing language-related measurement error. And finally, all analytic choices in this report (e.g., the decision to use non-parametric tests, given the non-normal distribution of the knowledge score) were made based on explicit, reported diagnostic testing (Appendix B, Table B2), rather than convention.
The use of a literature-derived answer key for all eight knowledge items, rather than an ad hoc determination of correctness, adds further weight to the validity of the knowledge score as a measurement instrument; likewise, the presentation of item-level (rather than only composite) results for both the knowledge scale and the self-efficacy/social-support scales (Appendix C) gives a level of diagnostic detail not available from a composite score, and is directly useful to program designers aiming to address specific (rather than general) knowledge deficits.
6. Limitations
- Small, preliminary sample: This report analyzes a small tranche ($n=24$) of the 450-500 total responses intended for the parent study – all inferential statistics (correlations, group comparisons, regression) are underpowered, exhibit wide confidence intervals, and should be regarded as exploratory only. Non-significant trends in this report (e.g., the knowledge-self-efficacy correlation) cannot be interpreted as evidence of an absence of association.
-
Convenience sampling: The sample was self-selected using a web link which may have biased the results toward those who have more interest/time to complete web-based questionnaires, thus limiting the representativeness of the broader Jazan University community.Cross-sectional design: All associations (e.g., social-support-BMI link) are correlational – a bidirectional relationship is possible (e.g., does lower weight cause more social support?).Self-reported anthropometry: Height and weight were self-reported by participants (subject to recall and/or social-desirability bias) – two participants were excluded for reporting physically impossible values – potential for residual measurement error in the final sample.
- Data quality: $\approx 29\%$ of respondents failed to select the expected option in the embedded attention-check item, suggesting that roughly 1 in 4 respondents may have not read the preceding information before answering the question – a sensitivity check found no significant knowledge-score difference between groups, but this does not rule out the possibility of more subtle effects on the Likert-scaled items regarding self-efficacy and social support.
- Scale reliability: The perceived social support scale’s internal consistency ($\alpha=0.54$) fell below the conventional threshold of 0.70 in this sample – this is almost certainly due to a combination of this analysis’s small sample size and the item wording variation (see: “general” support vs “tangible” aid), but results involving the social-support composite should be considered provisional, and the scale’s measurement model should be re-examined (via exploratory factor analysis) when analyzing the full sample.
- Restricted regression models: Due to the small sample size, regression models were only computed up to 2 predictors – a simultaneous analysis of knowledge, self-efficacy, social support, and demographics was not attempted and should be when analyzing the full sample.
7. Conclusion and Recommendations
This preliminary exploratory analysis of survey data from 24 female students and staff at Jazan University found that nutrition knowledge was generally sound but unevenly distributed, self-efficacy and perceived social support were moderate, and most notably, there was a statistically significant, independent inverse association between perceived social support and self-reported BMI. In this sample, nutrition knowledge alone was not significantly associated with self-efficacy, social support or BMI, though associations were consistently in the theoretically expected direction.
Recommendations:
-
These early observations should not be used in any confirmatory fashion. Additional data will be collected until 450-500 total participants are enrolled as per the parent protocol.As this item had much lower performance than any other knowledge item, explicit and repeated instruction on recommended daily fruit and vegetable intake in subsequent nutrition education content should be a focus.
-
Given the strong association between the social-support construct and BMI observed here, consider designing future campus health promotion interventions around the engagement of participants’ families and peer networks in addition to solo knowledge transmission in future iterations.Given the below-threshold reliability observed in this preliminary sample, readminister the perceived social support measure or psychometrically revise it at full sample size, including a formal factor-analytic evaluation of the subdomains.Include a data-quality/attention-check screening step in the final analysis plan. As a standard sensitivity analysis, optionally report both full-sample and attention-check-passed-only results.
- Supplement self-reported height and weight with objective anthropometric measurements in future data collection cycles where possible, to reduce error in BMI-derived analyzes.
7.1. Practical Implications for Campus Health Policy
Even with such a small sample size, I can identify three broad recommendations for the health programming among the Jazan campus’s student population with a degree of confidence, as they are based on the results of face validity. The foremost concern is the stark shortfall in terms of the diet quality knowledge among the students, with the large portion of the sample lacking basic understanding of the fruit and vegetable quantities that should be ingested on a daily basis (Section 4.4). Thus, it is possible to improve the general level of knowledge just by implementing a single reminder or a poster campaign pertaining to the topic of diet quality. Second, even though the general level of social support is high, it is evident that the support coming from interpersonal connections is significantly higher compared to the support received from the food environment (Section 5.6). The results suggest that the University would be better off in terms of improving the dietary habits of the students by investing in the former, as the changes in physical surroundings, while beneficial, are more resource-heavy than interpersonal encouragement. Finally, due to the BMI-social support association (Section 4.8, 4.10), it might be useful to implement a family or social-centered approach to the health programming rather than the individual-centered as suggested by the Social Cognitive Theory (Section 1.3).
7.2. Concluding Statement
Together, this preliminary dataset provides Jazan University with early local evidence - rather than confirming evidence - for developing nutrition and lifestyle programs that address not only what its female students and staff know about nutrition, but also what gives them confidence and a supportive environment that enables the application of that knowledge. Completing the data collection to the full proposed sample size is the single most important next step in transforming these exploratory patterns into statistically significant and publishable results.
As this dataset approaches its target size, the analysis pipeline described in this report - from cleaning rules for raw data to reliability testing, correlations, group comparisons, and regressions - is designed to be re-run in its entirety without changes, so that results can be updated quickly as additional responses are collected, enabling an iterative rather than one-time approach to evidence generation for this research program.
Appendix A: Variable Codebook
| Variable | Description | Type / Range |
| ID | Participant identifier (P01-P24) | Categorical |
| role | Student / Faculty Member / Administrative-Technical Staff | Categorical |
| age_group | 18-22 / 23-29 / 30-39 / 40+ years | Ordinal |
| marital_status | Single / Married / Divorced-Widowed | Categorical |
| education | High school / Bachelor’s / Postgraduate | Ordinal |
| income | Household monthly income, 4 brackets (SAR) | Ordinal |
| residence | Urban / Rural | Categorical |
| height_cm, weight_kg | Self-reported anthropometrics | Continuous |
| BMI | weight_kg / (height_cm/100)^2 | Continuous, kg/m2 |
| k1-k8_correct | 8 knowledge items, 1=correct / 0=incorrect | Binary |
| knowledge_score | Sum of k1-k8_correct | 0-8 |
| se1-se7_num | 7 self-efficacy items | 1-5 Likert |
| SE_mean | Mean of se1-se7_num | 1.0-5.0 |
| ss1-ss6_num | 6 social support items | 1-5 Likert |
| SS_mean | Mean of ss1-ss6_num | 1.0-5.0 |
| attention_check_num | Data-quality attention-check item | 1-5 Likert |
Appendix B: Supplementary Descriptive Tables

Table B1.
Summary Statistics for Composite Scores.
| Variable | n | Mean | SD | Median | Min | Max |
|---|---|---|---|---|---|---|
| Knowledge Score (0-8) | 24 | 6.58 | 1.59 | 7.00 | 3.00 | 8.00 |
| Knowledge (%) | 24 | 83.85 | 17.48 | 87.50 | 37.50 | 100.00 |
| Self-Efficacy (1-5) | 24 | 3.39 | 0.65 | 3.29 | 2.00 | 4.57 |
| Social Support (1-5) | 24 | 3.36 | 0.57 | 3.33 | 2.33 | 4.50 |
| BMI (kg/m2, n=22) | 22 | 23.87 | 5.24 | 23.89 | 16.01 | 41.01 |
Table B2.
Shapiro-Wilk Normality Test Results.
| Variable | W statistic | p-value | Distribution |
|---|---|---|---|
| Knowledge Score | 0.764 | <0.001 | Non-normal |
| Self-Efficacy | 0.970 | 0.658 | Normal |
| Social Support | 0.966 | 0.573 | Normal |
| BMI | 0.970 | 0.666 | Normal |
Note: Given that one of the four main composite variables (the knowledge score) significantly deviated from normality, Spearman’s rank correlation was used across all bivariateanalyses for methodological consistency, as specified in the pre-planned analysisstrategy (Section 3.7).
Appendix C: Item-Level Descriptive Statistics
Table C1.
Self-Efficacy Scale — Item-Level Means (1-5 scale).
| Item | n | Mean | SD |
|---|---|---|---|
| Confidently reading food labels to guide purchases | 23 | 3.74 | 1.18 |
| Adjusting diet when traveling / routine changes | 23 | 3.57 | 1.04 |
| Resisting unhealthy snacks/fast food while shopping | 24 | 3.42 | 1.06 |
| Maintaining healthy choices despite temptation from others | 23 | 3.35 | 1.11 |
| Choosing healthy options when eating out/social events | 24 | 3.25 | 1.15 |
| Maintaining healthy choices under academic/work stress | 24 | 3.21 | 1.02 |
| Planning and preparing balanced meals in advance | 24 | 3.17 | 1.09 |
Table C2.
Perceived Social Support Scale — Item-Level Means (1-5 scale).
| Item | n | Mean | SD |
|---|---|---|---|
| Family encourages healthy eating | 24 | 3.79 | 0.98 |
| Friends/colleagues support healthy choices | 24 | 3.71 | 0.91 |
| Has someone to discuss health/nutrition goals with | 24 | 3.62 | 1.13 |
| Healthy food options available at home/workplace | 24 | 3.46 | 0.98 |
| Work/study environment encourages healthy lifestyle | 23 | 3.09 | 1.31 |
| Healthy options easily available on campus | 23 | 2.43 | 0.90 |
Note: Items are ordered in terms of descending means within each scale. The notably lower mean for campus food-environment availability than the other five items related to social support is discussed in Section 5.6.
References
- Al-Rethaiaa, A. S.; Fahmy, A. A.; Al-Shwaiyat, N. M. Obesity and eating habits among college students in Saudi Arabia: A cross-sectional study. Nutr. J. 2010, 9, 39. [Google Scholar] [CrossRef] [PubMed]
- Alqassimi, S.; Elmakki, E.; Areeshi, A. S.; Aburasain, A. B. M.; Majrabi, A. H.; Masmali, E. M. A.; Refaei, E. A. I.; Mobaraki, R. A. A.; Qahtani, R. M. A.; Oraibi, O.; Darraj, M.; Madkhali, M. A.; Mohrag, M. Overweight, obesity, and associated risk factors among students at the Faculty of Medicine, Jazan University. Medicina 2024, 60(6), 940. [Google Scholar] [CrossRef] [PubMed]
- Alsharif, S. N. Nutrition education and its public health impact in Saudi Arabia: A systematic review. Front. Public Health 2025, 13, 1700254. [Google Scholar] [CrossRef] [PubMed]
- Alzaben, A. S.; Alnashwan, N. I.; Alatr, A. A.; et al. Effectiveness of a nutrition education and intervention programme on nutrition knowledge and dietary practice among Princess Nourah Bint Abdulrahman University’s population. Public Health Nutr. 2021, 24(7), 1854–1860. [Google Scholar] [CrossRef] [PubMed]
- Bandura, A. Self-efficacy: Toward a unifying theory of behavioral change. Psychol. Rev. 1977, 84(2), 191–215. [Google Scholar] [CrossRef] [PubMed]
- Bandura, A. Social foundations of thought and action: A social cognitive theory; Prentice-Hall, 1986. [Google Scholar]
- Cochran, W. G. Sampling techniques, 3rd ed.; John Wiley & Sons, 1977. [Google Scholar]
- Contento, I. R. Nutrition education: Linking research, theory, and practice, 2nd ed.; Jones & Bartlett Learning, 2011. [Google Scholar]
- Cronbach, L. J. Coefficient alpha and the internal structure of tests. Psychometrika 1951, 16(3), 297–334. [Google Scholar] [CrossRef]
- Dodge, E.; Abu Shihab, K. H. N.; Aboul-Enein, B. H.; Benajiba, N.; Faris, M. Effectiveness of nutrition interventions targeting university-level student populations across the League of Arab States: A systematic scoping review. Glob. Health Promot. 2025, 32(2), 34–45. [Google Scholar] [CrossRef] [PubMed]
- Elfhag, K.; Rössner, S. Who succeeds in maintaining weight loss? A conceptual review of factors associated with weight loss maintenance and weight regain. Obes. Rev. 2005, 6(1), 67–85. [Google Scholar] [CrossRef] [PubMed]
- Glanz, K.; Rimer, B. K.; Viswanath, K. Health behavior: Theory, research, and practice, 5th ed.; Jossey-Bass, 2015. [Google Scholar]
- Glynn, S. M.; Ruderman, A. J. The development and validation of an Eating Self-Efficacy Scale. Cogn. Ther. Res. 1986, 10(4), 403–420. [Google Scholar] [CrossRef]
- Guntzviller, L. M.; King, A. J.; Jensen, J. D.; Davis, L. A. Self-efficacy, health literacy, and nutrition and exercise behaviors in a low-income, Hispanic population. J. Immigr. Minor. Health 2017, 19(2), 489–493. [Google Scholar] [CrossRef] [PubMed]
- Huang, T. T.; Harris, K. J.; Lee, R. E.; Nazir, N.; Born, W.; Kaur, H. Assessing overweight, obesity, diet, and physical activity in college students. J. Am. Coll. Health 2003, 52(2), 83–86. [Google Scholar] [CrossRef] [PubMed]
- Kedem, L. E.; Evans, E. M.; Chapman-Novakofski, K. Psychometric evaluation of dietary self-efficacy and outcome expectation scales in female college freshmen. Behav. Modif. 2014, 38(6), 852–877. [Google Scholar] [CrossRef] [PubMed]
- Kiernan, M.; Moore, S. D.; Schoffman, D. E.; Lee, K.; King, A. C.; Taylor, C. B.; et al. Social support for healthy behaviors: Scale psychometrics and prediction of weight loss among women in a behavioral program. Obesity 2012, 20(4), 756–764. [Google Scholar] [CrossRef] [PubMed]
- Kruskal, W. H.; Wallis, W. A. Use of ranks in one-criterion variance analysis. J. Am. Stat. Assoc. 1952, 47(260), 583–621. [Google Scholar] [CrossRef]
- Kuder, G. F.; Richardson, M. W. The theory of the estimation of test reliability. Psychometrika 1937, 2(3), 151–160. [Google Scholar] [CrossRef]
- Lombardo, C.; Cerolini, S.; Alivernini, F.; et al. Eating self-efficacy: Validation of a new brief scale. Eat. Weight Disord. 2020, 25, 295–303. [Google Scholar] [CrossRef] [PubMed]
- Mangkalard, P.; Fisher, A.; Burton, A.; Chandana, D.; Conway, R. The effectiveness of social support-based interventions for dietary and physical activity in adults living with overweight and obesity: Protocol for a systematic review. JMIR Res. Protoc. 2025. [Google Scholar] [CrossRef] [PubMed]
- Rasheed, P.; Abou-Hozaifa, B. M.; Kahn, A. Obesity among young Saudi female adults: A prevalence study on medical and nursing students. Public Health 1994, 108(4), 289–294. [Google Scholar] [CrossRef] [PubMed]
- Sallis, J. F.; Pinski, R. B.; Grossman, R. M.; Patterson, T. L.; Nader, P. R. The development of self-efficacy scales for health-related diet and exercise behaviors. Health Educ. Res. 1988, 3(3), 283–292. [Google Scholar] [CrossRef]
- Shapiro, S. S.; Wilk, M. B. An analysis of variance test for normality (complete samples). Biometrika 1965, 52(3/4), 591–611. [Google Scholar] [CrossRef]
- Spearman, C. The proof and measurement of association between two things. Am. J. Psychol. 1904, 15(1), 72–101. [Google Scholar] [CrossRef] [PubMed]
- Syed, N. K.; Syed, M. H.; Meraya, A. M.; Albarraq, A. A.; Al-Kasim, M. A.; Alqahtani, S.; Makeen, H. A.; Yasmeen, A.; Banji, O. J. F.; Elnaem, M. H. The association of dietary behaviors and practices with overweight and obesity parameters among Saudi university students. PLoS ONE 2020, 15(9), e0238458. [Google Scholar] [CrossRef] [PubMed]
- Wing, R. R.; Jeffery, R. W. Benefits of recruiting participants with friends and increasing social support for weight loss and maintenance. J. Consult. Clin. Psychol. 1999, 67(1), 132–138. [Google Scholar] [CrossRef] [PubMed]
- World Health Organization. Obesity: Preventing and managing the global epidemic. Report of a WHO consultation; WHO Technical Report Series; 2000; Volume 894, pp. 1–253. [Google Scholar]
- World Health Organization. Healthy diet fact sheet; World Health Organization, 2020. [Google Scholar]
- World Health Organization Expert Consultation. Appropriate body-mass index for Asian populations and its implications for policy and intervention strategies. The Lancet 2004, 363(9403), 157–163. [Google Scholar] [CrossRef] [PubMed]
- Zaghamir, D. E. F.; Ibrahim, A. M. Efficiency of an intervention study on nursing students’ knowledge and practices regarding nutrition and dietary habits. Libyan J. Med. 2023, 18(1), 2281121. [Google Scholar] [CrossRef] [PubMed]
Figure 5.
Self-Efficacy and Perceived Social Support Scores by Role.
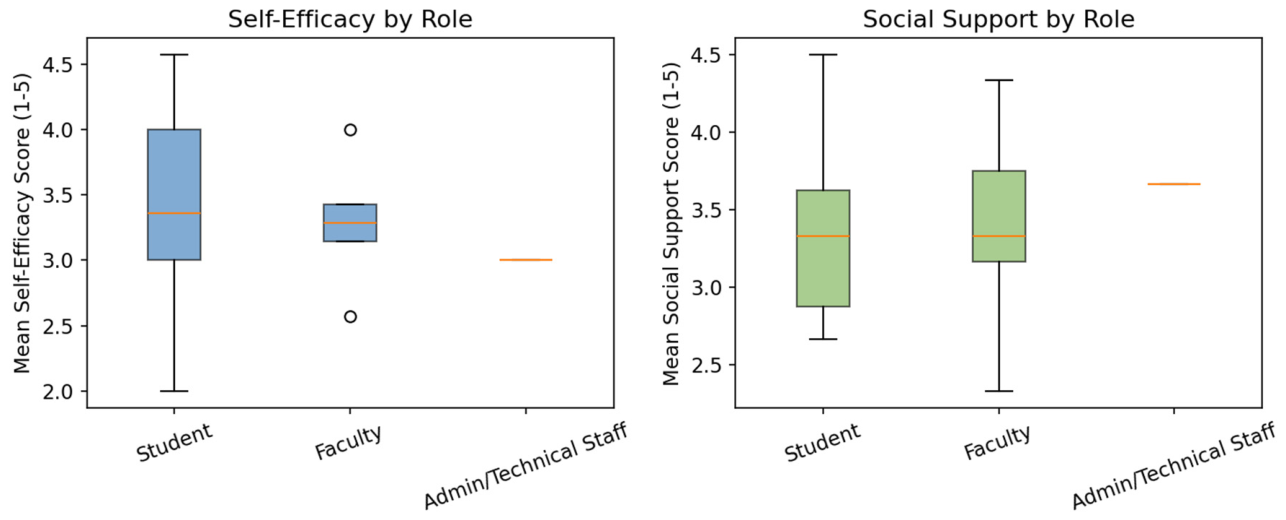
Figure 6.
Spearman Correlation Matrix Among Study Variables (n = 24).
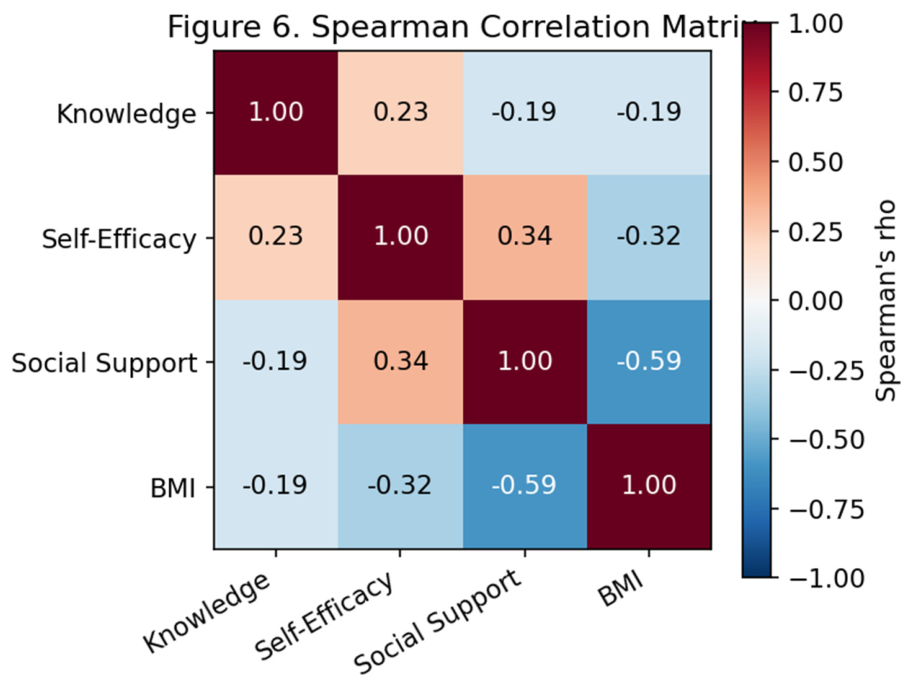
Figure 7.
Perceived Social Support vs. BMI, with Linear Trend Line (n = 22, outliers excluded).
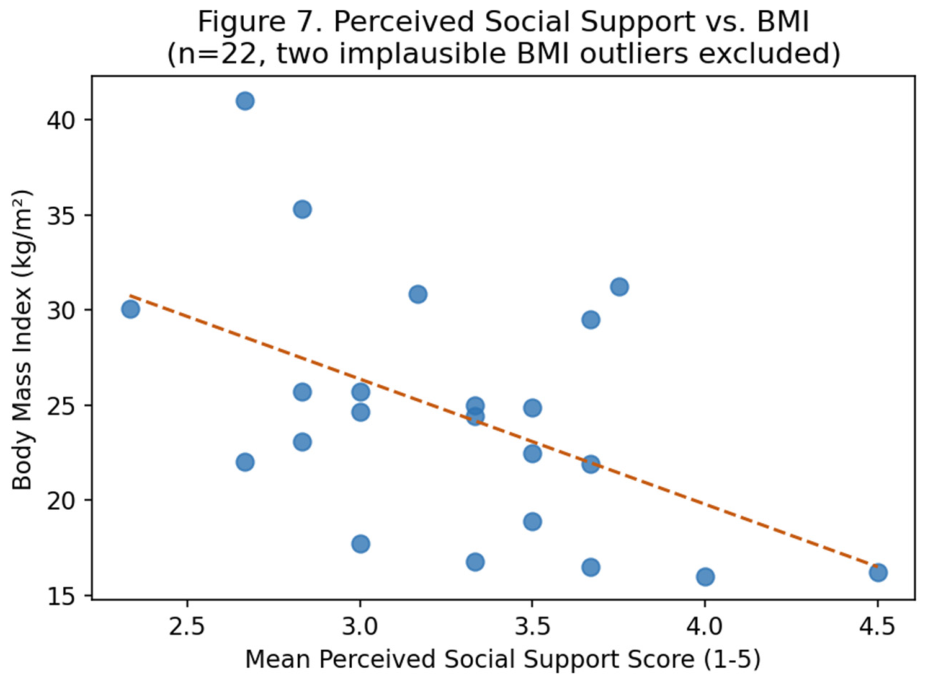
Table 4.1.
Sociodemographic Characteristics of the Sample (n = 24).
| Characteristic | Category | n | % |
|---|---|---|---|
| Role | Student | 18 | 75.0% |
| Faculty Member | 5 | 20.8% | |
| Administrative/Technical Staff | 1 | 4.2% | |
| Age Group | 18-22 years | 15 | 62.5% |
| 23-29 years | 1 | 4.2% | |
| 30-39 years | 4 | 16.7% | |
| 40+ years | 4 | 16.7% | |
| Marital Status | Single | 16 | 66.7% |
| Married | 7 | 29.2% | |
| Divorced/Widowed | 1 | 4.2% | |
| Educational Level | High school or equivalent | 2 | 8.3% |
| Bachelor’s degree/student | 16 | 66.7% | |
| Postgraduate (Master/PhD) | 6 | 25.0% | |
| Household Income | < 5,000 SAR | 7 | 29.2% |
| 5,000-10,000 SAR | 6 | 25.0% | |
| 10,001-15,000 SAR | 3 | 12.5% | |
| > 15,000 SAR | 7 | 29.2% | |
| Missing | 1 | 4.2% | |
| Residence | Urban | 14 | 58.3% |
| Rural | 9 | 37.5% | |
| Missing | 1 | 4.2% |
Table 4.2.
b. BMI Category by Role (n = 22, descriptive only).
| Role | Underweight | Normal | Overweight | Obese |
|---|---|---|---|---|
| Student (n=17) | 5 | 8 | 2 | 2 |
| Faculty (n=4) | 0 | 1 | 0 | 3 |
| Admin/Technical Staff (n=1) | 0 | 0 | 1 | 0 |
Table 4.2.
c. BMI Category by Age Group (n = 22, descriptive only).
| Age Group | Underweight | Normal | Overweight | Obese |
|---|---|---|---|---|
| 18-22 years (n=14) | 5 | 8 | 0 | 1 |
| 23-29 years (n=1) | 0 | 0 | 1 | 0 |
| 30-39 years (n=3) | 0 | 0 | 1 | 2 |
| 40+ years (n=4) | 0 | 1 | 1 | 2 |
Table 4.2.
Item-Level Nutrition Knowledge Performance, Ranked by Content Area.
| Knowledge Item | % Correct | n Answered |
|---|---|---|
| Recommended daily fruit/vegetable servings | 41.7% | 24 |
| Low-fat protein source identification | 87.0% | 23 |
| Recommended daily water intake | 91.3% | 23 |
| Most harmful dietary fat type | 87.5% | 24 |
| Food labels reduce sodium/sugar intake (T/F) | 79.2% | 24 |
| Regular breakfast improves concentration/weight (T/F) | 95.7% | 23 |
| Sodium content of processed foods | 91.3% | 23 |
| Primary source of dietary fiber | 100.0% | 24 |
Table 4.3.
Internal Consistency Reliability of the Three Composite Scales.
| Scale | Items | n (complete cases) | Reliability Statistic | Value |
|---|---|---|---|---|
| Nutrition Knowledge | 8 | 23 | KR-20 | 0.64 |
| Self-Efficacy | 7 | 23 | Cronbach’s alpha | 0.70 |
| Perceived Social Support | 6 | 23 | Cronbach’s alpha | 0.54 |
Table 4.4.
Spearman Correlation Matrix (*sensitivity analysis excluding 2 implausible BMI outliers).
Table 4.4.
Spearman Correlation Matrix (*sensitivity analysis excluding 2 implausible BMI outliers).
| Variable Pair | Spearman’s rho | p-value | n | Significant (p<.05)? |
|---|---|---|---|---|
| Knowledge ↔ Self-Efficacy | 0.23 | 0.271 | 24 | No |
| Knowledge ↔ Social Support | -0.19 | 0.375 | 24 | No |
| Knowledge ↔ BMI | -0.19 | 0.376 | 24 | No |
| Self-Efficacy ↔ Social Support | 0.34 | 0.101 | 24 | No |
| Self-Efficacy ↔ BMI | -0.32 (-0.46*) | 0.123 (0.032*) | 24 (22*) | No (Yes*) |
| Social Support ↔ BMI | -0.59 (-0.47*) | 0.002 (0.026*) | 24 (22*) | Yes |
Table 4.5.
a. Descriptive Means (SD) for Knowledge, Self-Efficacy, and Social Support, by Role and Age Group.
Table 4.5.
a. Descriptive Means (SD) for Knowledge, Self-Efficacy, and Social Support, by Role and Age Group.
| Subgroup | n | Knowledge Mean (SD) | Self-Efficacy Mean (SD) | Social Support Mean (SD) |
|---|---|---|---|---|
| Student | 18 | 6.94 (1.39) | 3.44 (0.70) | 3.34 (0.55) |
| Faculty | 5 | 5.80 (1.79) | 3.29 (0.52) | 3.38 (0.74) |
| Admin/Technical Staff | 1 | 4.00 (—) | 3.00 (—) | 3.67 (—) |
| 18-22 years | 15 | 7.20 (1.08) | 3.47 (0.76) | 3.43 (0.56) |
| 23-29 years | 1 | 3.00 (—) | 3.00 (—) | 3.00 (—) |
| 30-39 years | 4 | 6.50 (1.00) | 3.18 (0.47) | 3.17 (0.85) |
| 40+ years | 4 | 5.25 (2.06) | 3.43 (0.42) | 3.40 (0.42) |
Table 4.5.
Kruskal-Wallis Test Results for Group Comparisons.
| Outcome | Grouping Variable | H statistic | p-value |
|---|---|---|---|
| Knowledge Score | Role | 2.98 | 0.085 |
| Self-Efficacy | Role | 0.14 | 0.708 |
| Social Support | Role | 0.07 | 0.793 |
| Knowledge Score | Age Group | 5.83 | 0.054 |
| Self-Efficacy | Age Group | 0.54 | 0.765 |
| Social Support | Age Group | 0.90 | 0.639 |
Disclaimer/Publisher’s Note: The statements, opinions and data contained in all publications are solely those of the individual author(s) and contributor(s) and not of MDPI and/or the editor(s). MDPI and/or the editor(s) disclaim responsibility for any injury to people or property resulting from any ideas, methods, instructions or products referred to in the content. |
© 2026 by the authors. Licensee MDPI, Basel, Switzerland. This article is an open access article distributed under the terms and conditions of the Creative Commons Attribution (CC BY) license (http://creativecommons.org/licenses/by/4.0/).
Copyright: This open access article is published under a Creative Commons CC BY 4.0 license, which permit the free download, distribution, and reuse, provided that the author and preprint are cited in any reuse.