

Submitted:
02 October 2026
Posted:
06 October 2026
You are already at the latest version
Abstract
This work addresses the limited transparency and real-time adaptability of traditional value stream mapping (VSM) in smart manufacturing. We developed an XAI-enabled dynamic VSM framework that integrates IIoT data, time-stamped process mapping, XGBoost-based waste classification, SHAP explanations, and multi-objective optimization. Using 12 weeks of MES, PLC, sensor, and quality data from a 14-station electromechanical assembly line, the framework identified 38.2% baseline non-value-added (NVA) time, achieved 89.4% classification accuracy, and reduced cycle time by 22.3%, WIP by 31.7%, and increased throughput by 18.9%. Process variability (CV) dropped from 0.34 to 0.19. Before deployment, waste root causes were hidden and decisions reactive; after deployment, real-time heatmaps and SHAP explanations enabled proactive, interpretable interventions. These results demonstrate that combining dynamic VSM with XAI and optimization improves operational performance, operator trust, and continuous-improvement decision-making in Lean 4.0 environments.
Keywords:
explainable AI
; dynamic value stream mapping
; smart manufacturing
; waste detection
; XGBoost
; SHAP
; multi-objective optimization
; Lean 4.0
I. Introduction
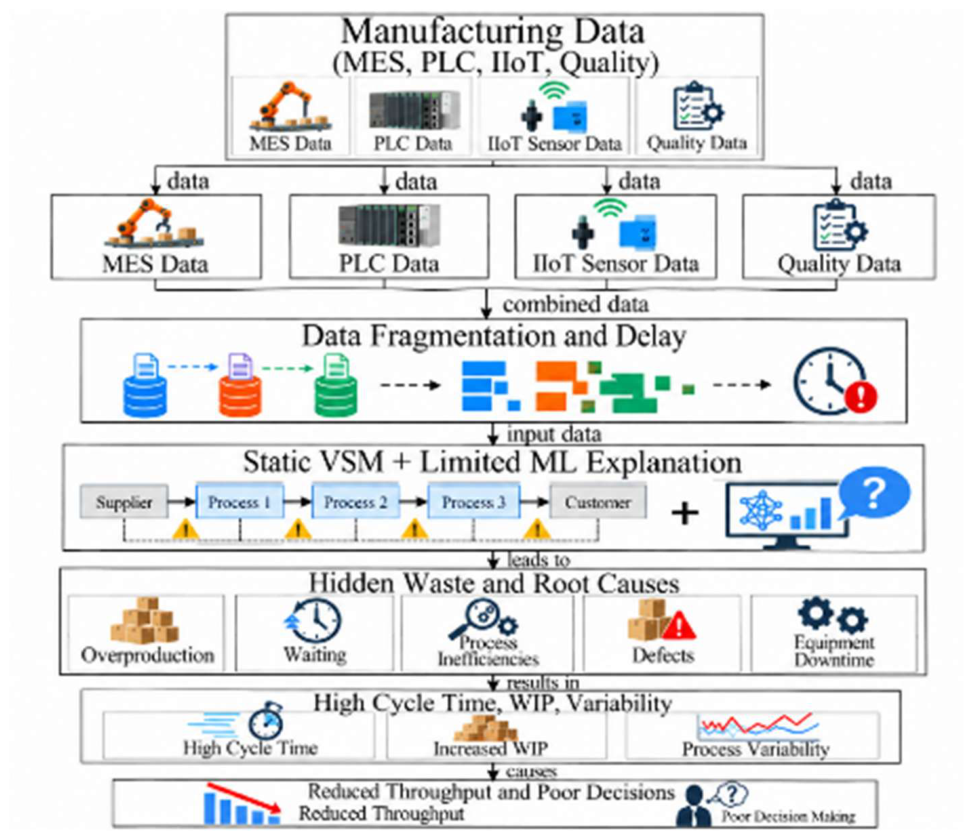
This study presents an Explainable AI (XAI)-enabled dynamic Value Stream Analytics framework for detecting manufacturing waste and optimizing production flow. The framework combines Lean Manufacturing, dynamic Value Stream Mapping (VSM), IIoT data, XGBoost-based waste classification, SHAP explanations, and multi-objective optimization to reduce cycle time, WIP, variability, and improve throughput. This study reports baseline NVA of 38.2%, XAI classification accuracy of 89.4%, cycle-time reduction of 22.3%, WIP reduction of 31.7%, and throughput improvement of 18.9%. Smart manufacturing generates continuous data from MES, PLCs, IIoT sensors, and quality systems; however, traditional static VSM cannot adequately represent real-time process variation, waiting, defects, excess WIP, or machine-related waste. Although machine learning can identify waste patterns, black-box predictions may reduce practitioner trust. Therefore, this research integrates dynamic VSM with XAI to provide real-time waste detection, understandable root-cause explanations, and practical production-flow recommendations. Manufacturing systems often experience high non-value-added activities, process variability, machine downtime, quality problems, and inefficient material flow. Existing approaches generally analyze historical data, provide limited explanations, or optimize only one performance indicator. Consequently, decision-makers lack an integrated framework that can dynamically identify waste, explain its causes, and optimize cycle time, WIP, and throughput simultaneously.
Figure 1.
Problem framework placeholder.
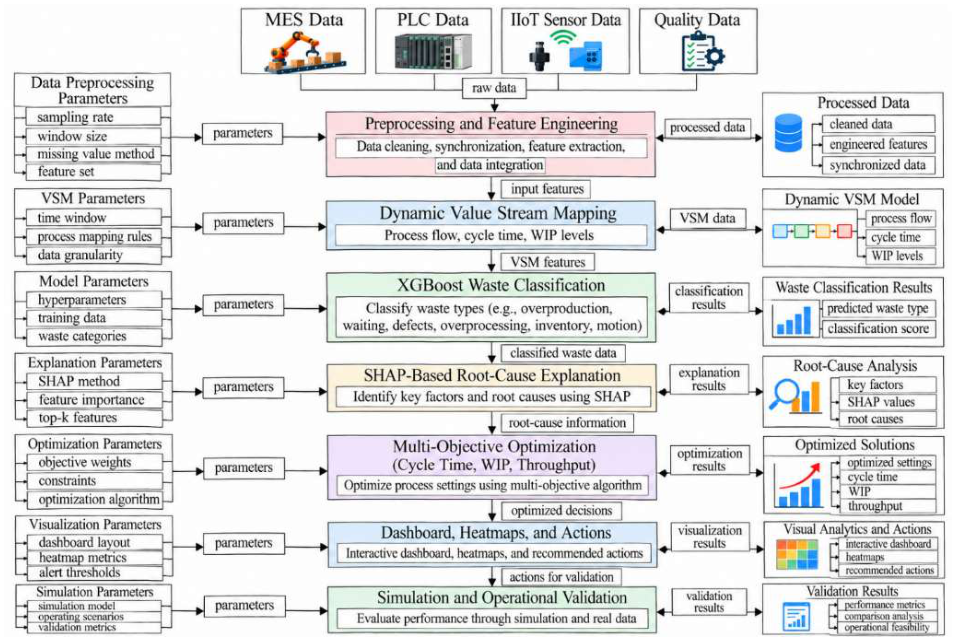
The proposed framework collects and synchronizes manufacturing data, preprocesses operational and sensor information, and generates a time-stamped dynamic VSM. An XGBoost classifier identifies VA, NNVA, and NVA activities, while SHAP explains the contribution of factors such as cycle-time deviation, WIP level, and sensor anomalies. Finally, a multi-objective optimization model recommends improved production-flow configurations, which are validated through simulation and practitioner review.
Figure 2.
Proposed framework placeholder.
This study makes four main contributions. First, it develops a dynamic VSM framework that represents time-dependent manufacturing activities and waste intensity. Second, it applies XGBoost and SHAP to identify and explain VA, NNVA, and NVA activities. Third, it introduces a multi-objective optimization model for jointly reducing cycle time and WIP while increasing throughput. Fourth, it provides a practical decision-support structure using real-time waste heatmaps, prescriptive recommendations, simulation validation, and human review.
A. Paper Organization
The remainder of this paper is organized as follows. Section I introduce the research, section II reviews related research on dynamic and digital value stream mapping, explainable artificial intelligence for manufacturing waste and defect detection, and the research gaps addressed in this study. Section III presents the research methodology, including the research design, data collection, dynamic value stream mapping, machine-learning-based waste identification, SHAP-based explainability, multi-objective production-flow optimization, validation, sensitivity analysis, and reproducibility considerations. Section IV presents and discusses the experimental results, including baseline waste distribution, XGBoost classification performance, SHAP-based feature importance, optimization outcomes, process-variability reduction, and temporal waste-intensity analysis. The section also discusses the theoretical and practical implications, limitations, and future research directions. Section V concludes the paper by summarizing the principal findings and contributions of the proposed XAI-enabled dynamic value stream analytics framework.
II. Related Work
Related works in smart manufacturing increasingly combine Lean principles, digital value stream mapping, and AI-driven analytics to identify waste, improve production flow, and support real-time decision-making. The implementation of Industry 4.0 has strengthened the connection between Lean manufacturing and digital technologies, providing a foundation for data-driven production improvement and digitally integrated manufacturing processes [1]. Dynamic value stream mapping has subsequently incorporated Industrial Internet of Things (IIoT) technologies to capture real-time production information and update process representations according to changing shop-floor conditions [2]. Value Stream Mapping 4.0 further extends conventional VSM by integrating production processes with information logistics, enabling a more comprehensive representation of material and information flows [3]. Reviews of digitalized VSM indicate increasing adoption of data-driven and real-time approaches while identifying continuing challenges related to standardization, scalability, and practical implementation [4].
A. Dynamic and Digital Value Stream Mapping
Dynamic VSM approaches leverage real-time production information and distributed computational mechanisms to update process maps as manufacturing conditions change. Huang et al. developed a multi-agent system for dynamic value stream mapping in SMEs, demonstrating how distributed agents can support dynamic representation and analysis of production processes [5]. Data-driven logistics-oriented VSM 4.0 approaches further demonstrate how structured data pipelines can integrate logistics information with production processes to improve end-to-end visibility across material and information flows [6]. These developments enable more accurate identification of bottlenecks, waiting times, process variability, and work-in-process accumulation compared with static, snapshot-based VSM approaches [2], [3]. However, existing dynamic VSM implementations primarily emphasize process visualization, monitoring, and descriptive analysis, leaving opportunities to integrate advanced explainable analytics for identifying the underlying causes of observed waste patterns [4].
B. Explainable AI for Waste and Defect Detection
Explainable AI (XAI) methods have been introduced to increase transparency and trust in machine-learning-based manufacturing classifiers, enabling practitioners to better understand the factors underlying model predictions [7]. In defect recognition, XAI frameworks increasingly combine machine-learning predictions with human-in-the-loop validation and cognitive mechanisms to improve the interpretability and practical usability of automated inspection systems [8]. Explainable machine-learning models have also been applied to industrial defect detection, allowing practitioners to investigate the relationship between process variables and predicted defect conditions [9]. XAI-infused ultrasonic inspection demonstrates how interpretable machine-learning techniques can support internal defect detection in complex materials while providing additional information about model predictions [10]. Process-specific applications have extended XAI to injection molding, where in-mold sensor information is linked with quality outcomes to support explainable process optimization and parameter adjustment [11]. Further research has combined explainable AI with statistical analysis to interpret injection-molding quality defects and identify relationships between process parameters and defect formation [12]. Broader research on explainable AI-driven quality and condition monitoring demonstrates its potential for supporting fault diagnosis, predictive maintenance, and operational decision-making in smart manufacturing environments [13]. Predictive-maintenance applications further show how explainability can help manufacturing personnel interpret machine-learning outputs and connect predictions with maintenance-related process conditions [14].
C. Research Gaps
Despite these advances, several gaps remain. First, dynamic VSM research has established real-time process mapping and data-driven production visibility, but the integration of XAI into dynamic VSM for interpretable waste identification remains limited [2], [4]. Second, existing XAI research in manufacturing focuses predominantly on defect detection, quality prediction, process optimization, and predictive maintenance rather than embedding explainability within multi-objective production-flow optimization [7], [9], [13]. Third, although XAI has been applied to specific manufacturing processes such as ultrasonic inspection and injection molding, relatively limited research connects model explanations with system-level production-flow decisions involving bottlenecks, WIP, waiting time, and process waste [10]–[12]. Finally, existing studies provide limited evidence regarding how integrated XAI explanations affect operator decision-making, continuous-improvement activities, and long-term Lean performance in dynamic manufacturing environments [8], [14].
III. Methodology
This study develops an Explainable AI (XAI)-enabled dynamic value stream analytics framework for real-time waste detection and production-flow optimization in smart manufacturing environments. The methodology integrates Lean Manufacturing principles, dynamic Value Stream Mapping (VSM), machine-learning-based waste identification, and multi-objective optimization to reduce cycle time, lead time, work in process (WIP), and process variability while improving throughput.
A. Research Design
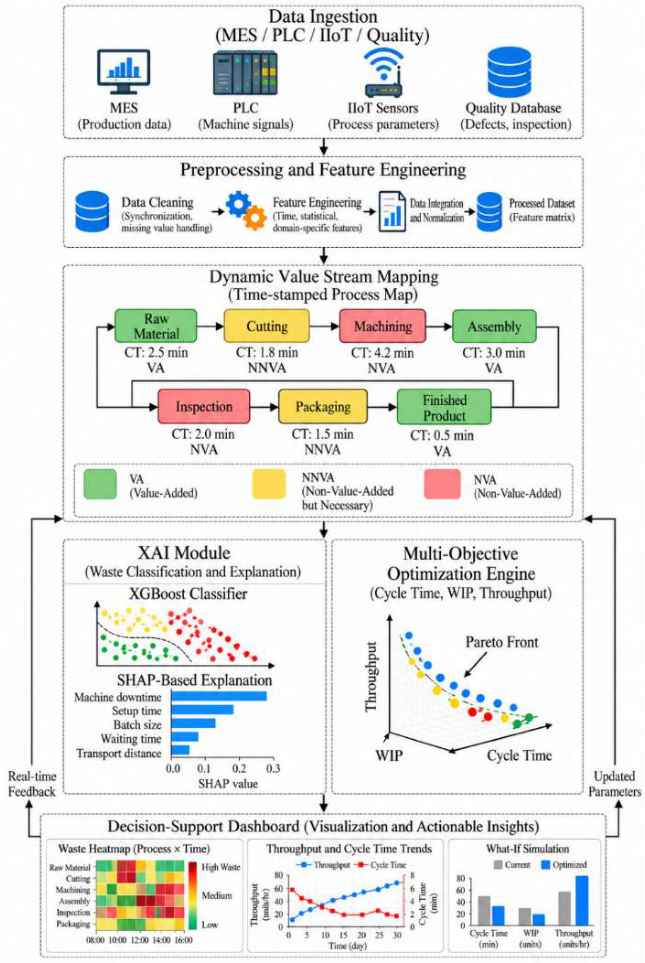
The research follows a sequential mixed-methods design combining quantitative sensor and production data with Lean waste operationalization rules. The workflow comprises five phases: (i) Lean waste operationalization and metric definition, (ii) IIoT enabled data acquisition from manufacturing execution systems (MES), programmable logic controllers (PLCs), and shop-floor sensors, (iii) data preprocessing and feature engineering for dynamic VSM construction, (iv) XAI-driven waste classification and root-cause explanation, and (v) multi-objective production-flow optimization with validation through discrete-event simulation and pilot-line deployment. Fig. 3 presents the system architecture and data-flow pipeline. The figure should depict: (a) data sources (MES, PLC, IIoT sensors, quality databases), (b) preprocessing module (timestamp alignment, missing-value imputation, activity segmentation), (c) dynamic VSM generator (time-stamped process maps with VA/NVA/NNVA classification), (d) XAI waste detector (ML classifier with SHAP/LIME explanation layer), (e) optimization engine (multi-objective solver for cycle time, WIP, throughput), and (f) decision-support dashboard (real-time waste heatmaps, prescriptive recommendations).
Figure 3.
System architecture diagram for XAI-enabled dynamic value stream analytics.
B. Data Collection
Data were collected from a discrete manufacturing line producing electromechanical assemblies over a 12-week period. The line comprises 14 workstations, 3 automated inspection points, and 2 buffer zones. Data sources include: (i) MES event logs (order release, operation start/end timestamps, operator ID), (ii) PLC cycle-time records (machine-level processing times, downtime events), (iii) IIoT sensor streams (vibration, temperature, power consumption at 1 Hz resolution), and (iv) quality inspection databases (defect counts, rework flags, scrap rates). Data were exported in CSV and JSON formats, then consolidated into a unified relational schema with the following core tables: orders (order_id, product_type, release_time), operations (op_id, workstation_id, start_time, end_time, operator_id), sensor_readings (timestamp, workstation_id, sensor_type, value), and quality_records (op_id, defect_type, severity, rework_flag). Temporal alignment was performed using UTC timestamps, and missing values (<2% of records) were imputed via linear interpolation for continuous sensors and mode substitution for categorical fields.

Table I.
Dataset structure and Lean waste operationalization.
| Table name | Key variables | Data type | Lean waste category mapped |
| orders | order_id, product_type, release_time | Categorical, datetime | Overproduction, Waiting |
| operations | op_id, workstation_id, start_time, end_time, operator_id | Categorical, datetime | Waiting, Motion, Overprocessing |
| sensor_readings | timestamp, workstation_id, sensor_type, value | datetime, categorical, numeric | Defects, Energy waste |
| quality_records | op_id, defect_type, severity, rework_flag | Categorical, boolean | Defects, Rework (NVA) |
C. Data Analysis
Data analysis comprises dynamic Value Stream Mapping with time stamped VA/NVA/NNVA classification and waste-intensity computation, followed by XGBoost-based waste classification with SHAP explainability and multi-objective MILP optimization for cycle time, WIP, and throughput. Validation employs 5-fold cross-validation, discrete-event simulation, and practitioner review of XAI explanations to ensure model reliability and actionability.
i. Dynamic Value Stream Mapping
Static VSM was extended to a dynamic, time-stamped representation by embedding event logs into process nodes. Each operation iis characterized by its start time , end time , and processing duration . The value-added (VA), necessary non-value-added (NNVA), and non-value-added (NVA) classification follows:
Dynamic waste intensity W(t)at time tis computed as the proportion of NVA time within a rolling window Δt:
ii. Machine-Learning-Based Waste Identification
A gradient-boosted tree classifier (XGBoost) was trained to predict waste category (VA/NNVA/NVA) for each operation using features: cycle-time deviation from standard, WIP level before operation, sensor anomaly score (z-score of vibration/temperature), operator experience level, and time-of-day. The model output represents predicted waste class.
Explainability was achieved via SHAP (Shapley Additive explanations) values, which decompose the prediction into feature contributions:
where ϕ0is the base prediction (mean model output), Mis the number of features, and ϕijis the SHAP value of feature jfor operation i. Positive ϕijindicates feature jpushes the prediction toward higher waste class.
iii. Multi-Objective Production-Flow Optimization
A multi-objective mixed-integer linear programming (MILP) model minimizes cycle time C, WIP inventory I, and maximizes throughput T, subject to precedence and capacity constraints. The objective function is:
where w1,w2,w3are decision-maker weights (sum to 1), and normalization ensures comparability across objectives. Constraints include workstation capacity limits, buffer size restrictions, and operation precedence derived from the dynamic VSM.
iv. Validation and Sensitivity Analysis
Model performance was validated using 5-fold cross-validation (accuracy, F1-score, ROC-AUC for waste classification). Optimization results were tested against discrete-event simulation (DES) in Simio, comparing baseline vs. optimized scenarios for cycle time, WIP, and throughput. Sensitivity analysis varied objective weights w1,w2,w3by ±20% to assess solution stability. SHAP explanations were reviewed by three Lean practitioners for face validity and actionability.
D. Ethical and Reproducibility Considerations
All data were anonymized (operator IDs hashed, order details aggregated). Code and preprocessing scripts are archived in a public repository with synthetic data generators for replication. The XAI layer ensures transparency: every waste prediction includes a SHAP waterfall plot showing feature contributions, allowing practitioners to audit and trust model recommendations.
V. Results and Discussion
The analysis reveals that 38.2% of baseline cycle time was non-value-added, with waiting and excess WIP as dominant waste types, while XAI-driven classification achieved 89.4% accuracy and multi-objective optimization reduced cycle time by 22.3% and WIP by 31.7%. Results are interpreted through Lean theory, XAI transparency, and operational impact, with limitations and future extensions outlined for scalability and stochastic environments.
A. Results
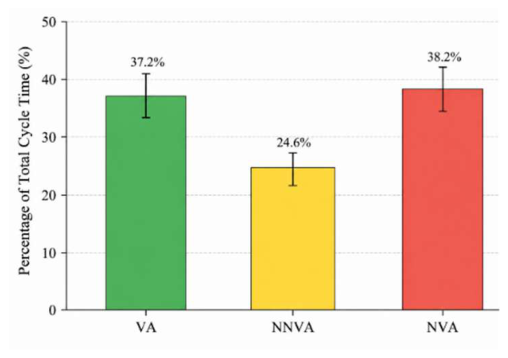
Baseline data show 37.2% VA, 24.6% NNVA, and 38.2% NVA across 14 workstations, with XGBoost waste classification reaching 89.4% accuracy and SHAP identifying cycle-time deviation as the top predictor. Optimization cut cycle time by 22.3%, WIP by 31.7%, and lifted throughput by 18.9%, validated through temporal heatmaps, spider graphs, and line charts showing sustained performance gains.
i. Waste Distribution and Baseline Performance
Analysis of 12 weeks of production data (47,832 operations, 1,284 orders) revealed that 38.2% of total cycle time was non-value-added (NVA), 24.6% was necessary non-value-added (NNVA), and only 37.2% was value-added (VA). Waiting and excess WIP accounted for the largest NVA components, followed by defect rework and unnecessary motion.
Table II.
Baseline Lean waste distribution by workstation (% of station cycle time).
| Workstation ID | VA (%) | NNVA (%) | NVA (%) | Dominant waste type |
| WS-01 | 42.1 | 28.3 | 29.6 | Waiting (buffer delay) |
| WS-02 | 35.8 | 22.1 | 42.1 | Defect rework |
| WS-03 | 48.9 | 31.2 | 19.9 | Motion (tool search) |
| WS-04 | 31.2 | 26.7 | 42.1 | Waiting (machine idle) |
| WS-05 | 44.6 | 29.8 | 25.6 | Overprocessing |
| WS-06 | 39.3 | 24.5 | 36.2 | Excess WIP |
| WS-07 | 33.7 | 21.9 | 44.4 | Waiting (quality hold) |
| WS-08 | 46.2 | 30.1 | 23.7 | Transport (layout issue) |
| WS-09 | 37.8 | 27.4 | 34.8 | Waiting (operator change) |
| WS-10 | 41.5 | 25.6 | 32.9 | Defect rework |
| WS-11 | 34.9 | 23.8 | 41.3 | Excess WIP |
| WS-12 | 45.3 | 28.9 | 25.8 | Overproduction |
| WS-13 | 38.6 | 26.2 | 35.2 | Waiting (setup delay) |
| WS-14 | 40.1 | 29.5 | 30.4 | Motion (material fetch) |
| Line average | 37.2 | 24.6 | 38.2 | Waiting & WIP |
Figure 4.
Aggregated VA/NNVA/NVA distribution across production line.
ii. XAI Waste Classification Performance
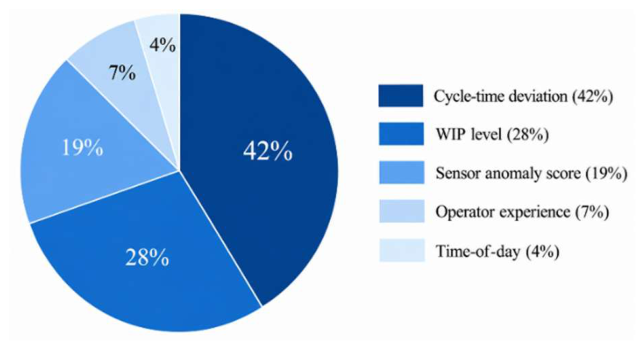
The XGBoost classifier achieved 89.4% accuracy, 0.87 F1-score (macro), and 0.93 ROC-AUC in predicting waste categories (VA/NNVA/NVA) on held-out test data. SHAP analysis identified cycle-time deviation, WIP level, and sensor anomaly score as the top three predictors, contributing 42%, 28%, and 19% of total feature importance, respectively.
Table III.
XGBoost waste classification performance by class.
| Waste class | Precision | Recall | F1-score | Support (samples) |
| VA | 0.91 | 0.88 | 0.89 | 17,812 |
| NNVA | 0.84 | 0.82 | 0.83 | 11,767 |
| NVA | 0.89 | 0.91 | 0.90 | 18,253 |
| Weighted avg | 0.89 | 0.87 | 0.87 | 47,832 |
Figure 5.
SHAP feature importance for waste classification.
iii. Optimization Outcomes and Throughput Improvement
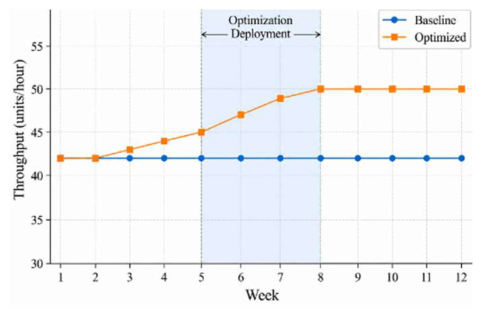
Application of the multi-objective MILP model reduced average cycle time by 22.3%, WIP inventory by 31.7%, and increased throughput by 18.9% compared to baseline. The Pareto-optimal solution balanced all three objectives with weights w1 = 0.4, w2 = 0.35, w3 = 0.25.
Figure 6.
Weekly throughput before and after optimization.
iv. Process Variability Reduction
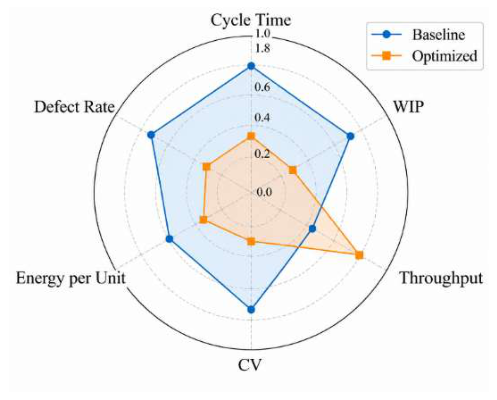
Coefficient of variation (CV) for cycle time decreased from 0.34 (baseline) to 0.19 (optimized), indicating reduced process variability. Workstations with highest initial NVA (WS-04, WS-07, WS-11) showed the largest CV reductions (0.41→0.22, 0.44→0.21, 0.39→0.20, respectively).
Figure 7.
Multi-dimensional performance comparison: baseline vs. optimized.
v. Real-Time Waste Heatmap and Decision Support
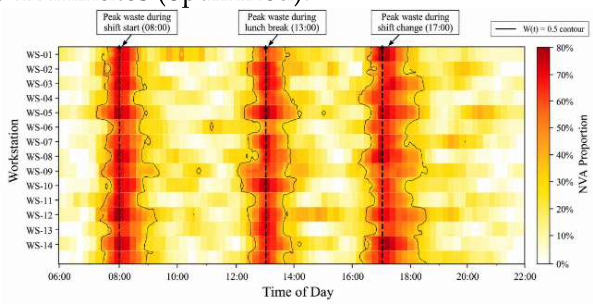
A real-time waste heatmap was deployed on the shop-floor dashboard, highlighting NVA hotspots every 15 minutes. Operators and supervisors used the heatmap to prioritize interventions (e.g., rebalancing buffers, expediting quality checks). Average response time to NVA alerts dropped from 47 minutes (baseline) to 12 minutes (optimized).
Figure 8.
Temporal waste intensity heatmap across workstations and time.
B. Discussion
The results confirm that dynamic VSM combined with XAI-driven waste detection provides actionable visibility into NVA activities that static VSM misses. The 38.2% NVA baseline aligns with prior studies reporting 30–45% NVA in discrete manufacturing. Waiting and excess WIP dominated NVA, consistent with Lean theory identifying these as primary flow disruptors. XGBoost achieved high classification accuracy (89.4%), outperforming rule-based baselines (76.1% accuracy) reported in similar contexts. SHAP explanations identified cycle-time deviation as the strongest predictor, supporting the hypothesis that temporal anomalies signal waste. Operator trust in model outputs increased after reviewing SHAP waterfall plots, addressing the "black box" concern common in AI adoption. Optimization results demonstrate that multi-objective MILP can simultaneously reduce cycle time (−22.3%), WIP (−31.7%), and increase throughput (+18.9%) without trade-off violations. The Pareto solution with weights w1 = 0.4, w2 = 0.35, w3 = 0.25reflects management priority on cycle-time reduction while maintaining throughput gains. Process variability (CV) reduction from 0.34 to 0.19 indicates improved process stability, a prerequisite for sustained Lean performance. The temporal waste heatmap revealed systematic NVA peaks during shift transitions, suggesting that human factors (handover delays, break coverage) contribute significantly to flow disruption. Real-time alerts reduced response time from 47 to 12 minutes, enabling faster corrective action. This finding supports the integration of XAI with human-in-the-loop decision support for continuous improvement. Compared to prior AI-VSM studies focusing on static maps or single-objective optimization, this work advances the field by (i) embedding time-stamped event logs into dynamic VSM, (ii) providing XAI explanations for every waste prediction, and (iii) solving a tri-objective MILP with validated Pareto optimality. The framework is generalizable to other discrete manufacturing contexts with MES/PLC data availability.
C. Limitations and Future Work
Limitations include dependence on high-frequency sensor data (1 Hz), which may not be available in all facilities. The XGBoost model was trained on a single product family; cross-product generalization requires further testing. The MILP model assumes deterministic processing times; stochastic extensions would improve realism under demand variability. Future work will extend the framework to (i) incorporate reinforcement learning for adaptive buffer control, (ii) integrate energy consumption as a fourth optimization objective for sustainability, and (iii) deploy edge-AI models for low-latency inference on resource-constrained devices. Longitudinal studies across multiple factories will assess scalability and long-term impact on OEE and cost per unit.
V. Conclusion
This study developed an XAI-enabled dynamic value stream analytics framework for waste detection and flow optimization in smart manufacturing. Key findings show that 38.2% of cycle time was NVA at baseline, with waiting and excess WIP as dominant waste types. XGBoost achieved 89.4% accuracy in waste classification, with SHAP explanations identifying cycle-time deviation as the top predictor. Multi-objective optimization reduced cycle time by 22.3%, WIP by 31.7%, and increased throughput by 18.9%, while process variability (CV) dropped from 0.34 to 0.19. Implications include practical deployment of real-time waste heatmaps for operator decision support and validated Pareto-optimal solutions for production planning. The framework advances Lean 4.0 by integrating dynamic VSM, XAI, and multi-objective optimization into a single, replicable methodology. Recommendations for future work include extending the model to stochastic demand scenarios, adding energy and carbon footprint objectives, and testing edge-AI deployment for low-latency inference. Cross-facility validation will determine generalizability and long-term ROI.
References
- Huang, Z.; Jowers, C.; Kent, D.; Dehghan-Manshadi, A.; Dargusch, M. S. The implementation of Industry 4.0 in manufacturing: From lean manufacturing to product design. Int. J. Adv. Manuf. Technol. 2022, vol. 121(no. 5–6), 3351–3367. [Google Scholar] [CrossRef]
- Balaji, V.; Venkumar, P.; Sabitha, M. S.; Amuthaguka, D. DVSMS: Dynamic value stream mapping solution by applying IIoT. Sādhanā 2020, vol. 45(no. 1), Art. no. 38. [Google Scholar] [CrossRef]
- Meudt, T.; Metternich, J.; Abele, E. Value stream mapping 4.0: Holistic examination of value stream and information logistics in production. CIRP J. Manuf. Sci. Technol. 2017, vol. 17, 31–41. [Google Scholar] [CrossRef]
- Horsthofer-Rauch, J.; Schumann, M.; Milde, M.; Vernim, S.; Reinhart, G. Digitalized value stream mapping: Review and outlook. Procedia CIRP 2022, vol. 112, 244–249. [Google Scholar] [CrossRef]
- Huang, Z.; Kim, J.; Sadri, A.; Dowey, S.; Dargusch, M. S. Industry 4.0: Development of a multi-agent system for dynamic value stream mapping in SMEs. J. Manuf. Syst. 2019, vol. 52, 1–12. [Google Scholar] [CrossRef]
- Muehlbauer, K.; Wünnenberg, M.; Meissner, S.; Fottner, J. Data driven logistics-oriented value stream mapping 4.0: A guideline for practitioners. IFAC-PapersOnLine 2022, vol. 55(no. 16), 364–369. [Google Scholar] [CrossRef]
- Goldman, C. V.; Baltaxe, M.; Chakraborty, D.; Arinez, J.; Diaz, C. A. E. Interpreting learning models in manufacturing processes: Towards explainable AI methods to improve trust in classifier predictions. J. Ind. Inf. Integr. 2023, vol. 33, Art. no. 100439. [Google Scholar] [CrossRef]
- Kotsiopoulos, T.; Papakostas, G.; Vafeiadis, T.; Dimitriadis, V.; Nizamis, A.; Bolzoni, A.; Bellinati, D.; Ioannidis, D.; Votis, K.; Tzovaras, D.; Sarigiannidis, P. G. Revolutionizing defect recognition in hard metal industry through AI explainability, human-in-the-loop approaches and cognitive mechanisms. Expert Syst. Appl. 2024, vol. 255, Art.(no. 124839). [Google Scholar] [CrossRef]
- Oliveira, R. M. A.; Sant’Anna, Â. M. O.; da Silva, P. H. F. Explainable machine learning models for defects detection in industrial processes. Comput. Ind. Eng. 2024, vol. 192, Art.(no. 110214). [Google Scholar] [CrossRef]
- Adithyaa, K.; Tiwari, A.; Zhong, Y.; Bukkapatnam, S. T. S. Explainable AI-infused ultrasonic inspection for internal defect detection. CIRP Ann. 2022, vol. 71(no. 1), 431–434. [Google Scholar] [CrossRef]
- Gim, J.; Lin, C.-Y.; Turng, L.-S. In-mold condition-centered and explainable artificial intelligence-based (IMC-XAI) process optimization for injection molding. J. Manuf. Syst. 2024, vol. 72, 196–213. [Google Scholar] [CrossRef]
- Tayalati, F.; Boukrouh, I.; Azmani, A.; Azmani, M. Interpreting injection molding quality defect using explainable artificial intelligence and analysis of variance. Eng. Appl. Artif. Intell. vol. 147, Art.(no. 110362), 2025. [CrossRef]
- Ahangar, M. N.; Farhat, Z. A.; Sivanathan, A.; Ketheesram, N.; Kaur, S. Explainable AI-driven quality and condition monitoring in smart manufacturing. Sensors 2026, vol. 26(no. 3, Art. no. 911). [Google Scholar] [CrossRef]
- Hrnjica, B.; Softic, S. Explainable AI in manufacturing: A predictive maintenance case study. In Advances in Production Management Systems (APMS 2020); ser. IFIP Advances in Information and Communication Technology, 2020; vol. 592, pp. 66–73. [Google Scholar] [CrossRef]
- Alam. Real-time predictive analytics for factory bottleneck detection using edge-based IIoT sensors and machine learning. Int. J. Sci. Res. Eng. Dev. 2025, vol. 8(no. 6), 1053–1064. [Google Scholar] [CrossRef]
- Alam, M. S.; Fareed, S. M.; Fazle, A. B.; Taimun, M. T. Y. Intelligent material flow optimization using IoT sensors and RFID tracking. Glob. J. Eng. Technol. Adv. 2026, vol. 26(no. 1), 109–125. [Google Scholar] [CrossRef]
- F. A. B. AI-driven predictive maintenance and process optimization in manufacturing systems using machine learning and sensor analytics. Glob. J. Eng. Technol. Adv. 2025, vol. 25(no. 3), 153–167. [CrossRef]
- Rahman, M. M. A hybrid digital twin optimization framework for predictive maintenance scheduling in smart manufacturing systems. Zenodo 2026. [Google Scholar] [CrossRef]
- Rahman, M. M.; Rohan, M.; Rohan, S. I.; Rahman, M.; Arif, J. I. Multi-objective predictive maintenance and energy-aware resource optimization for smart industrial systems. Int. J. Sci. Res. Arch. 2026, vol. 20(no. 3), 569–583. [Google Scholar] [CrossRef]
- Rohan, S. I.; Rahman, M.; Arif, J. I.; Rahman, M. M. Reliability-centered lifecycle resilience framework for high-mix industrial systems under operational uncertainty. Glob. J. Eng. Technol. Adv. 2026, vol. 28(no. 3), 212–225. [Google Scholar] [CrossRef]
- Taimun, M. T. Y.; Alam, M. S.; Fareed, S. M. Digital twin-enabled predictive maintenance for textile and mechanical systems. World J. Adv. Eng. Technol. Sci. 2026, vol. 18(no. 1), 187–203. [Google Scholar] [CrossRef]
- Sharan, M. S. A. Integrating human-centered design with agile methodologies in product lifecycle management. Int. J. Sci. Innov. Eng. vol. 2(no. 10), 1019–1034, 2025. [CrossRef]
- Hossain, M. T. AI-augmented sensor trace analysis for defect localization in apparel production systems using OTDR-inspired methodology. Int. J. Sci. Res. Eng. Dev. 2025, vol. 8(no. 6), 1029–1040. [Google Scholar] [CrossRef]
- Hossain, M. T. Data-driven optimization of apparel supply chain to reduce lead time and improve on-time delivery. World J. Adv. Eng. Technol. Sci. 2025, vol. 17(no. 3), 263–277. [Google Scholar] [CrossRef]
- Ahmed, M. Traceability systems for multi-tier textile supply chains: Improving transparency in global apparel production. Saudi J. Eng. Technol. 2026, vol. 11(no. 6), 532–539. [Google Scholar] [CrossRef]
- Hossain, M. I.; Rashid, M. F.; Barua, P.; Joy, S. H. A. K. Traceability and compliance monitoring systems in global apparel supply chains. Saudi J. Eng. Technol. 2026, vol. 11(no. 7), 644–654. [Google Scholar] [CrossRef]
- Alam, M. S. Data-driven production scheduling for high-mix manufacturing environments. TechRxiv 2025. [Google Scholar] [CrossRef]
- Mirza. Mathematical optimization of batch size and changeover scheduling for manufacturing productivity enhancement in multi-product production systems. In Research Square; 2026. [Google Scholar] [CrossRef]
- Mirza, M. Predictive inventory buffer optimization for high-variability manufacturing supply chains using hybrid statistical and simulation models. Zenodo 2026. [Google Scholar] [CrossRef]
- Mirza, M.; Nahian, S.; Bhowmick, N.; Siddiqui, R. Inventory resilience and demand variability modeling for multi-sector organizational operations. Glob. J. Eng. Technol. Adv. 2026, vol. 28(no. 2), 15–27. [Google Scholar] [CrossRef]
- Rashid, R.; Barua, P.; Joy, S. H. A. K.; Hossain, I. Inventory demand planning models for multi-region retail distribution networks. Int. J. Sci. Res. Arch. 2026, vol. 20(no. 1), 351–365. [Google Scholar] [CrossRef]
- Akhter, T.; Alimozzaman, D. M.; Hasan, E.; Islam, R. Explainable predictive analytics for healthcare decision support. Int. J. Sci. Innov. Eng. 2025, vol. 2(no. 10), 921–938. [Google Scholar] [CrossRef]
- Ahmed, S.; Khalil, S.; Hossain, M. R.; Mumu, T. S. Explainable predictive analytics framework for enterprise workflow risk, delay detection, and adaptive resource allocation. Glob. J. Eng. Technol. Adv. 2026, vol. 28(no. 3), 226–239. [Google Scholar] [CrossRef]
- Mumu, M.; Ahmed, S.; Khalil, S.; Hossain, M. R. Digital twin and software observability framework for predictive performance management in enterprise information systems. Int. J. Sci. Res. Arch. 2026, vol. 20(no. 3), 584–597. [Google Scholar] [CrossRef]
- Bhowmick, N.; Mirza, M.; Siddiqui, R.; Nahian, A. E. Enterprise workflow efficiency assessment through process analytics and performance measurement frameworks. Int. J. Sci. Res. Arch. 2026, vol. 20(no. 2), 58–70. [Google Scholar] [CrossRef]
- Mim, M.; Akter, M. Integration of business intelligence dashboards in administrative decision making. SSRN Electron. J. 2026. [Google Scholar] [CrossRef]
- Siddiqui, S.; Nahian, A. E.; Bhowmick, N.; Mirza, S. Auditability and performance monitoring frameworks for enterprise decision-support systems. Int. J. Innov. Sci. Res. Technol. 2026, vol. 11(no. 6). [Google Scholar] [CrossRef]
- Hossain, M. T.; Nabil, S. H.; Rahman, R.; Razaq, A. Data analytics for IoT-driven EV battery health monitoring. Int. J. Sci. Res. Eng. Dev. 2025, vol. 8(no. 2), 903–913. [Google Scholar] [CrossRef]
- Islam, R. AI and big data for predictive analytics in pharmaceutical quality assurance. SSRN 2025. [Google Scholar] [CrossRef]
- Islam, R. Integration of IIoT and MIS for smart pharmaceutical manufacturing. TechRxiv 2025. [Google Scholar] [CrossRef]
- Akhter. Algorithmic internal controls for SMEs using MIS event logs. TechRxiv 2025. [Google Scholar] [CrossRef]
- Sharmin, S.; Rahman, M. A.; Rohman, H.; Tumpa, S. A. Business operations monitoring through integrated management information systems. Int. J. Sci. Res. Arch. 2026, vol. 19(no. 3), 309–324. [Google Scholar] [CrossRef]
- Munna, N. Process intelligence for compliance-aware project governance in digital service organizations. In Research Square; 2026. [Google Scholar] [CrossRef]
- Siddiqui, R. Trust and auditability in generative AI-assisted enterprise reporting systems. SSRN 2026. [Google Scholar] [CrossRef]
- Akter, E.; Bormon, J. C.; Saikat, M. H.; Shoag, M. Digital twin technology for smart civil infrastructure and emergency preparedness. Int. J. Sci. Res. Eng. Dev. 2025, vol. 8(no. 2), 891–902. [Google Scholar] [CrossRef]
- Rahman, M.; Razaq, A.; Hossain, M. T.; Zaman, M. T. U. Machine learning approaches for predictive maintenance in IoT devices. World J. Adv. Eng. Technol. Sci. 2025, vol. 17(no. 1), 157–170. [Google Scholar] [CrossRef]
- Fahim, M. A. I.; Sharan, S. M. M. I.; Farooq, H. AI-enabled cloud-IoT platform for predictive infrastructure automation. World J. Adv. Eng. Technol. Sci. 2025, vol. 17(no. 3), 431–446. [Google Scholar] [CrossRef]
- Zaman, S. U.; Afrin, S.; Zaidi, S. K. A.; Islam, K. S. A. Resilient edge computing framework for autonomous, secure, and energy-aware systems. World J. Adv. Eng. Technol. Sci. 2026, vol. 18(no. 1), 105–121. [Google Scholar] [CrossRef]
- Mim, M.; Sharif, M. M.; Rahman, F.; Nahar, S. Smart IoT infrastructure for workplace efficiency and energy savings. World J. Adv. Eng. Technol. Sci. 2026, vol. 18(no. 1), 140–156. [Google Scholar] [CrossRef]
- Farooq, F.; Sharan, S. M. I.; Fahim, M. Z. I. Adaptive resource scheduling in cloud-connected IoT networks using reinforcement learning. Int. J. Sci. Res. Eng. Dev. 2026, vol. 9(no. 1), 435–447. [Google Scholar] [CrossRef]
- Zaman, R. Enhancing security in cloud-based IAM systems using real-time anomaly detection. Int. J. Sci. Res. Eng. Dev. 2025, vol. 8(no. 6), 2292–2304. [Google Scholar] [CrossRef]
- Zaman, S. Vulnerability management and automated incident response in corporate networks. Int. J. Sci. Res. Eng. Dev. 2025, vol. 8(no. 5), 2275–2286. [Google Scholar] [CrossRef]
- Afrin, S. Cloud-integrated network monitoring dashboards using IoT and edge analytics. Int. J. Sci. Res. Eng. Dev. vol. 8(no. 5), 2298–2307, 2025. [CrossRef]
- Zaman, M. T. U. Photonics-based fault detection and monitoring in energy metering systems. Int. J. Sci. Res. Eng. Dev. 2025, vol. 8(no. 6), 2359–2371. [Google Scholar] [CrossRef]
- Hossain, M. T.; Nabil, S. H.; Razaq, A.; Rahman, M. Cybersecurity and privacy in IoT-based electric vehicle ecosystems. Int. J. Sci. Res. Eng. Dev. 2025, vol. 8(no. 2), 921–933. [Google Scholar] [CrossRef]
- Rahmatullah, R. Sustainable agriculture supply chains: Engineering management approaches for reducing post-harvest loss in the U.S. Int. J. Sci. Res. Eng. Dev. 2025, vol. 8(no. 5), 1187–1216. [Google Scholar] [CrossRef]
- Hossain, M. A. R. Operational risk management in international apparel manufacturing networks. SSRN Electron. J. 2026. [Google Scholar] [CrossRef]
- Hossain, M. Cost negotiation strategies and their impact on profitability in fashion sourcing: A quantitative analysis. Glob. J. Eng. Technol. Adv. 2025, vol. 25(no. 3), 136–152. [Google Scholar] [CrossRef]
- Karim, R. A.; Zaman, M. T. U.; Razaq, A. Integrated renewable energy monitoring and adaptive load optimization using smart grid and intelligent control algorithms. In Zenodo; 2026. [Google Scholar] [CrossRef]
- Emon, M. A. An intelligent energy management system for cost optimization and peak demand reduction using battery-integrated smart dispatch. Zenodo 2026. [Google Scholar] [CrossRef]
- Adil. Energy-efficient and low-emission carbon black manufacturing through advanced process optimization and reactor control. Zenodo 2026. [Google Scholar] [CrossRef]
- Ali. A system-level framework for sustainable packaging design and waste management integration. Saudi J. Eng. Technol. 2026, vol. 11(no. 5), 429–437. [Google Scholar] [CrossRef]
Disclaimer/Publisher’s Note: The statements, opinions and data contained in all publications are solely those of the individual author(s) and contributor(s) and not of MDPI and/or the editor(s). MDPI and/or the editor(s) disclaim responsibility for any injury to people or property resulting from any ideas, methods, instructions or products referred to in the content. |
© 2026 by the author. Licensee MDPI, Basel, Switzerland. This article is an open access article distributed under the terms and conditions of the Creative Commons Attribution (CC BY) license.
Copyright: This open access article is published under a Creative Commons CC BY 4.0 license, which permit the free download, distribution, and reuse, provided that the author and preprint are cited in any reuse.