
Submitted:
02 October 2026
Posted:
06 October 2026
You are already at the latest version
Abstract
Urban traffic congestion in the vicinity of educational institutions is largely determined by the use of cars for school trips. The paper analyzes the impact of the implementation of the Pedibus program on the performance of an urban intersection in the municipality of Pitești, using real traffic data and microscopic modeling in the PTV Vissim environment. The results indicate that the intersection currently operates at service level F, with high delays and capacity overrun. The implementation of the Pedibus program, modelled through a reduction in school-related vehicle flows based on the school mobility survey and the assumed participation scenario, leads to improvements in intersection performance and a transition from LOS F to LOS E. The study highlights the effectiveness of mobility measures based on changing user behavior, demonstrating their potential to reduce congestion in school areas without major interventions on the infrastructure.
Keywords:
urban traffic congestion
; Pedibus
; school mobility
; microsimulation
; level of service
; traffic management
1. Introduction
Urban traffic management is a much more common challenge in the current context, marked by the increase in motorization and pressure on existing infrastructure. Road intersections are critical points of the transport network, directly influencing traffic capacity, service level and road safety. [1]
Urban congestion is not determined only by the total volume of traffic, but also by its concentration in specific time intervals. Traffic generated by school trips contributes significantly to the intensification of flows during peak hours, and the predominant use of cars contributes to the increase in delays and the deterioration of safety conditions [2,3].
The analysis of traffic data collected in the field and the simulations carried out in the PTV Vissim environment highlighted the fact that the Calea Bascovului – Tache Ionescu – Strada Depozitelor intersection in the municipality of Pitești operates under severe congestion conditions, corresponding to the LOS F service level, characterized by high delays and exceeding traffic capacity. In this context, it becomes necessary to identify transport demand management solutions based on changing user behavior. Pedibus-type programs, which involve organized walking of students, represent an effective alternative for reducing car traffic in school areas [4,5]. Recent research has highlighted Walking School Bus programs as active school mobility measures that can reduce private vehicle dependency, promote active travel and improve school travel conditions. A systematic review also identified routing, scheduling and placement as important areas for further development of Walking School Bus programs [5].
The paper analyzes the potential impact of a Pedibus program on the performance of the analyzed intersection, using real traffic data and microscopic modeling in the PTV Vissim environment. The main objective of this study is to highlight the main advantages brought by Pedibus, without the need for major interventions on the existing infrastructure.
2. Materials and methods
2.1. Urban Context and Study Area
The case study was conducted in the Municipality of Pitești, in the urban area served by the “Alexandru Davila” Middle School. The choice of this area was based on the simultaneous existence of important traffic flows and school trips concentrated in specific intervals of the educational program.
The analyzed area is characterized by the presence of road arteries with a major role in urban traffic, as well as streets with a predominantly local function, which provide access to residential areas and to the educational unit. Within this network is the intersection of Calea Bascovului – Tache Ionescu – Strada Depozitelor, selected to be analyzed in terms of traffic characteristics and to assess the impact of school mobility measures.
The “Alexandru Davila” Middle School is located near the analyzed intersection, which allows analyzing the relationship between school mobility and the functioning of the road network in the studied area. From a methodological point of view, the analysis does not automatically consider all trips to school as sources of traffic for the analyzed intersection. The link between school trips and the flows crossing the intersection is analyzed separately, based on the identified travel routes and traffic data collected in the field.
In this context, the study area was analyzed at three successive levels: the municipality of Pitești, the area related to the “Alexandru Davila” Middle School, as well as the road and pedestrian network in the vicinity of the Calea Bascovului – Tache Ionescu – Strada Depozi-telor intersection. This delimitation allows the transition from the general analysis of the urban context to the identification of school trips and, subsequently, to the evaluation of the Pedibus routes and their relationship with road traffic.
The location of the analyzed area in the Municipality of Pitești and the positioning of the educational unit in relation to the main elements of the transport network highlighted in Figure 1.
2.2. School Area and Characteristics of School Mobility
The "Alexandru Davila" Junior High School is located in the analyzed area, close to a road network characterized by streets with different functions, from arteries with a role of distributing urban traffic to streets with local functionality, which ensure access to the neighborhoods in the vicinity of the educational unit. This configuration provides the necessary conditions for the simultaneous analysis of school mobility and its interaction with road traffic in the studied area.
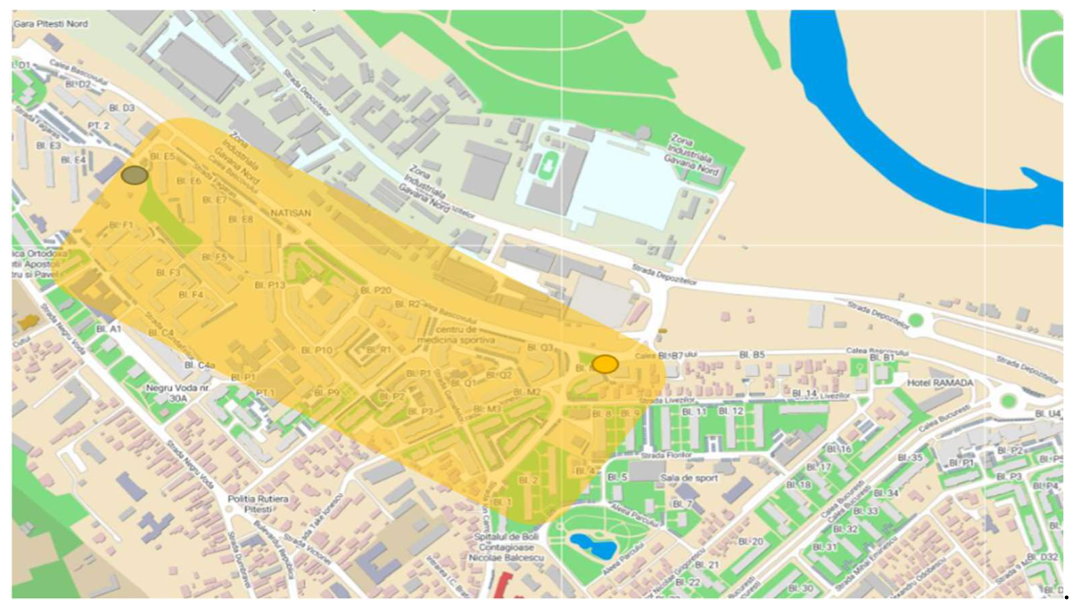
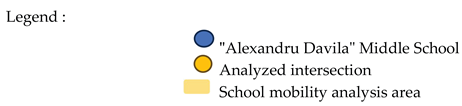
Figure 2.
Delimitation of the area of analysis of school mobility in the municipality of Pitești [7].
Figure 2.
Delimitation of the area of analysis of school mobility in the municipality of Pitești [7].
To characterize school mobility, an opinion poll was designed and applied to parents of students, with 71 respondents. The questionnaire aimed to identify the main modes of travel used to access school and assess the availability for the use of active mobility alternatives, including organized Pedibus-type travel.
The data obtained indicate a significant use of personal cars for school trips, by approximately 55–60% of students. At the same time, the analysis of the spatial distribution of students indicates the existence of trips coming from areas located at relatively short distances from the school, which creates favorable premises for the organization of collective pedestrian routes.
Based on the questionnaire results and the spatial distribution of the students, the three proposed Pedibus routes can potentially serve all 71 students included in the school mobility analysis. Considering that approximately 55–60% of students currently travel to school by personal car, the Pedibus scenario assumes that a substantial proportion of these car trips could be replaced by organized walking trips. Consequently, the 70–80% reduction represents an estimated potential reduction in school-related car traffic, used as an input for the simulated Pedibus scenario, rather than a reduction measured after actual implementation.
These results do not allow the direct attribution of the traffic observed at the analyzed intersection to school trips. To establish this relationship, it is necessary to analyze the actual routes used by parents and the directions of travel after dropping students off at school. Consequently, in the next stage of the study, the pedestrian network in the school area was analyzed, with the aim of identifying route options that would allow the grouping of student trips within the Pedibus program.
2.3. Data Collection and Processing
Data collection was carried out using a UAV (Unmanned Aerial Vehicle) system, which allowed the recording of traffic flows from an aerial perspective, without influencing the behavior of traffic participants. The UAV monitoring covered the 07:00–09:00 morning interval and the 14:00–17:00 afternoon interval. The video material obtained was processed using the DataFromSky application, through which vehicle trajectories, speeds, traffic intensities and classification by vehicle types were extracted. Based on the recorded traffic patterns, the 07:30–08:00 interval was identified as the critical morning period for the subsequent analysis of school-related traffic and the simulated Pedibus scenario. Traffic volumes used in the analysis were expressed in veh/h by converting the number of vehicles recorded during the analyzed observation interval to an hourly equivalent.
The analysis of school mobility was based on data obtained following the application of the questionnaire to 71 parents, used to assess travel behavior and estimate the potential for implementing the Pedibus program.
2.4. Data Processing and Analysis
The collected data were processed to determine the main traffic indicators. The process included: classifying vehicles by category (passenger cars, heavy vehicles), determining traffic intensities by direction of travel, identifying dominant lanes, analyzing the temporal distribution of flows, estimating the equivalents in reference vehicles (PCE – Passenger Car Equivalent), according to technical standards. This stage allowed the identification of critical directions and time intervals with maximum demand on the infrastructure.
2.5. Identification and Characterization of Pedibus Routes
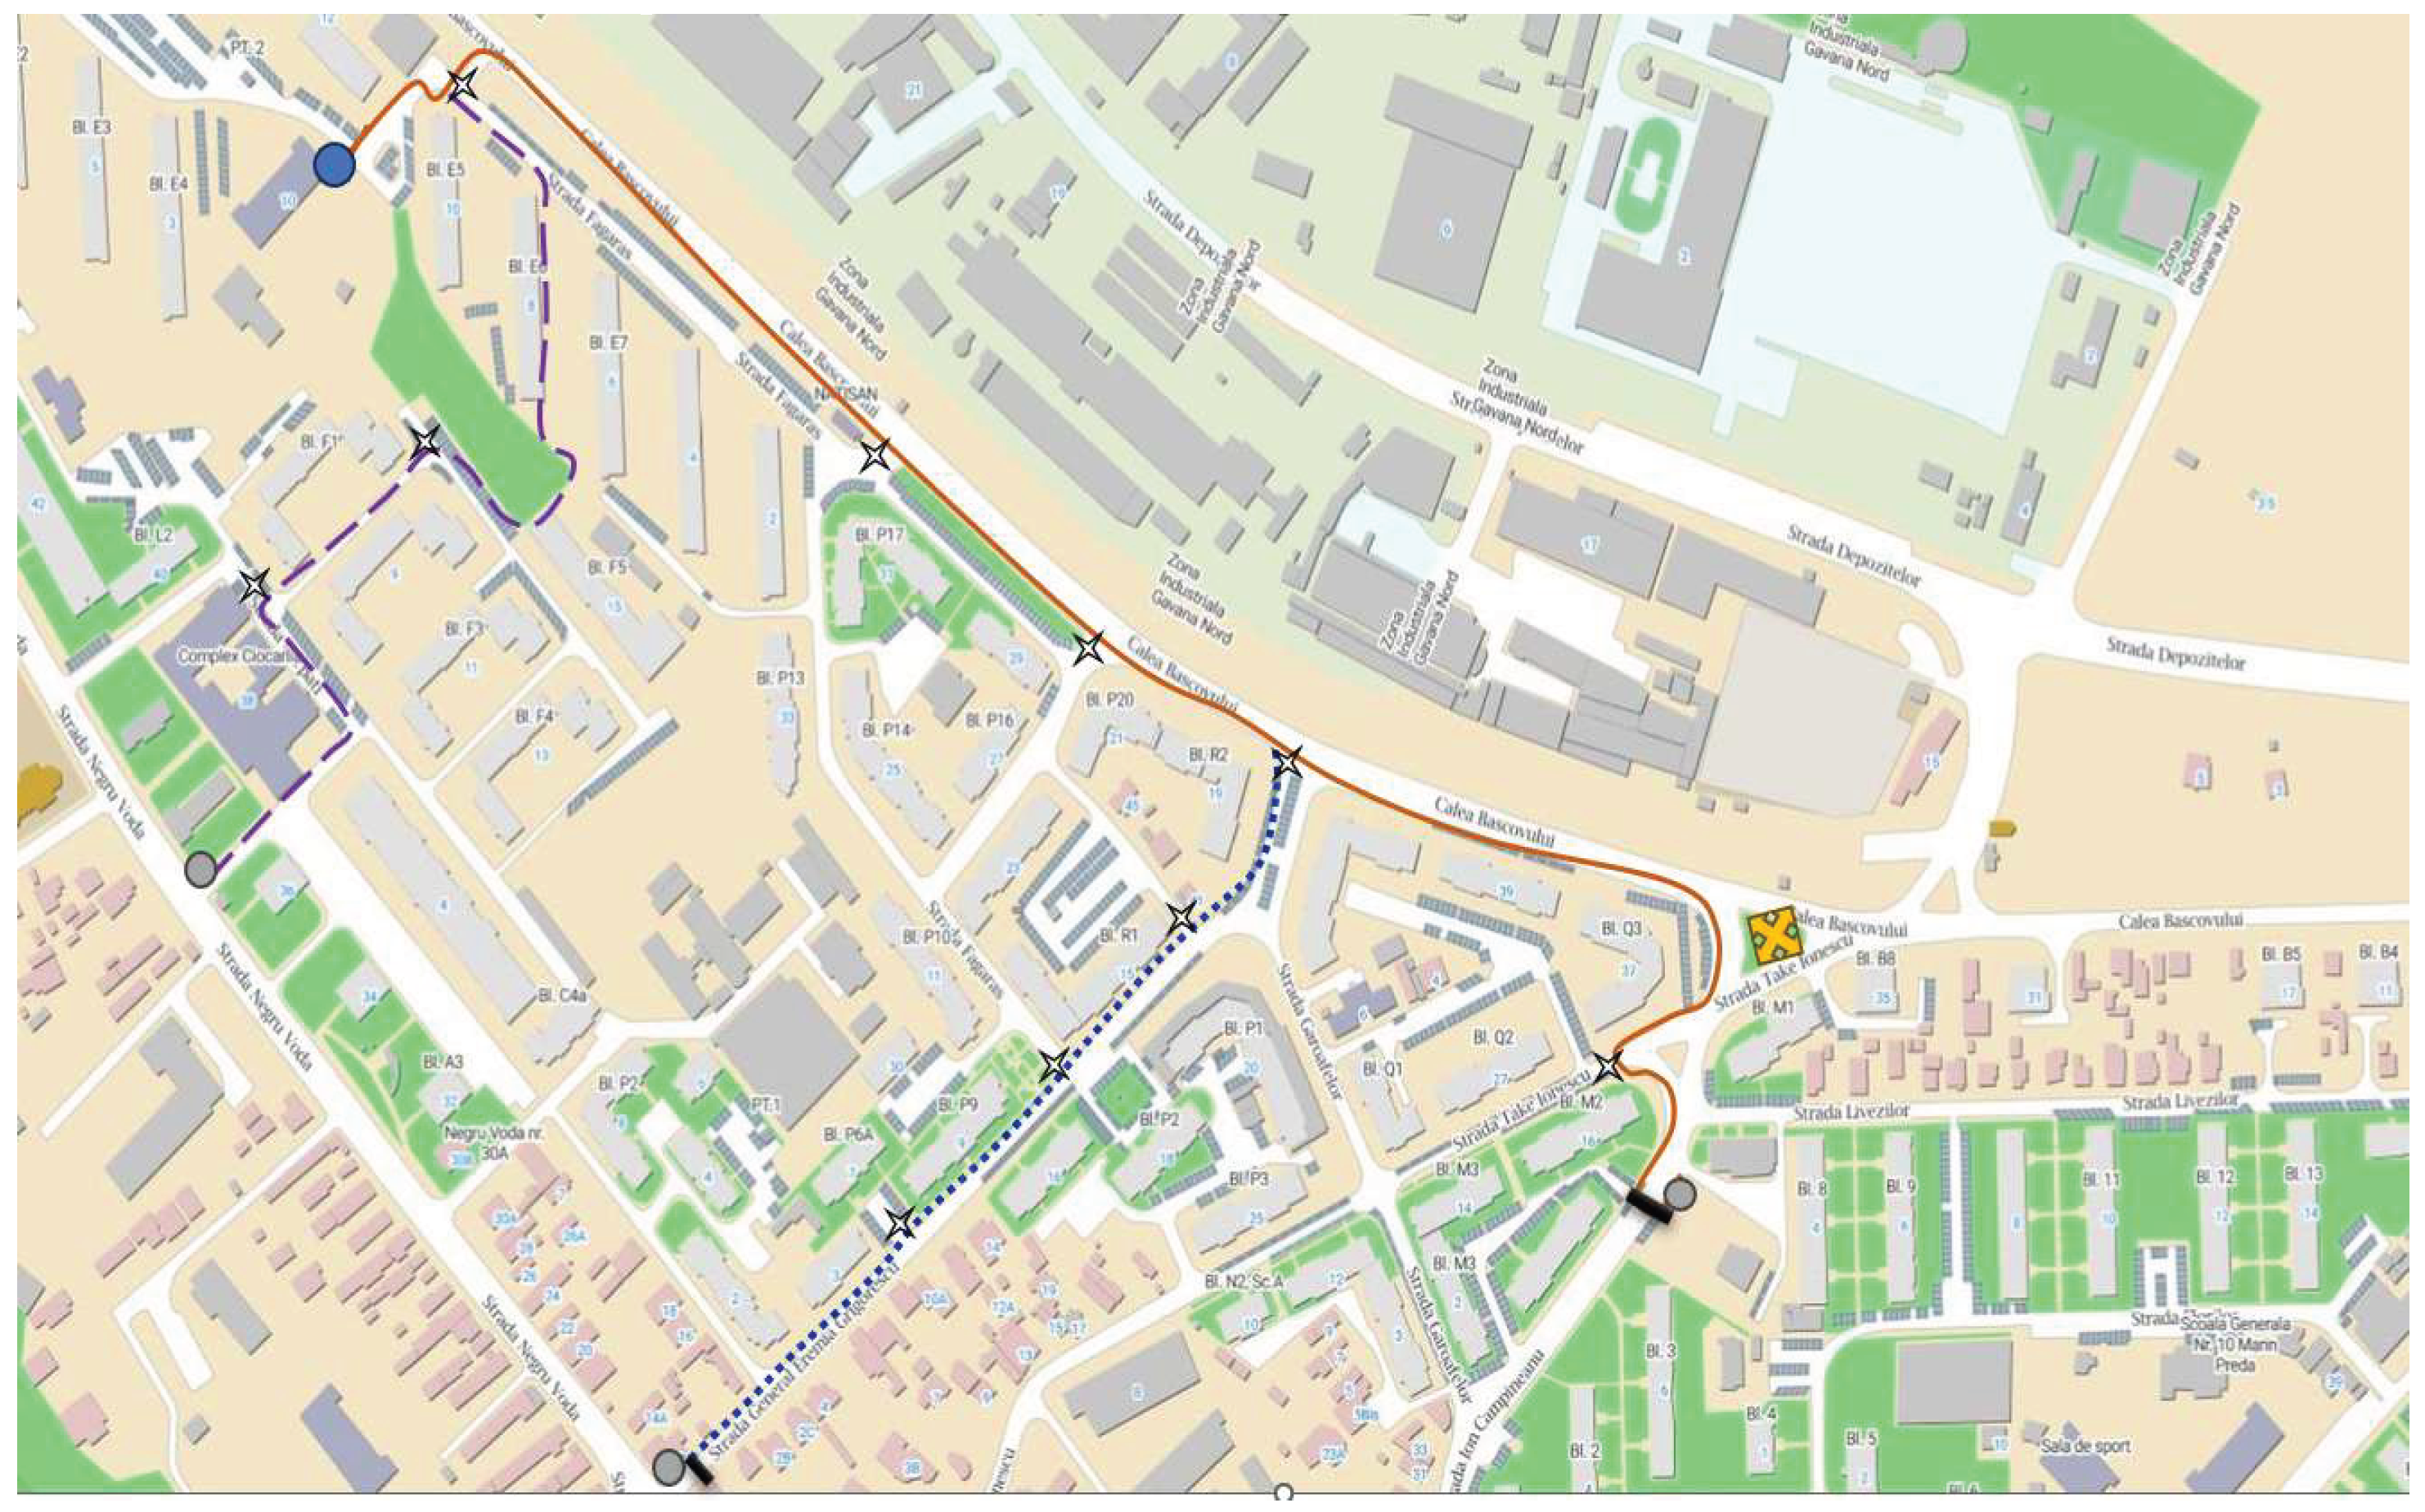
Following the analysis of the pedestrian network in the studied area, three routes were identified that can be used to organize the movement of students within the Pedibus program. The establishment of the routes took into account the distribution of students according to residence, the configuration of the streets and the possibility of progressive reunion of participants during the journey to school [8].
The three routes start from different areas and use sectors of the street network that lead to Făgăraș Street, in the vicinity of the educational unit. Through this organization, the individual movements of students can be grouped in common directions, which allows the analysis of an alternative to individual transport by car [8].
Route 1 starts from the area of Ion Câmpineanu Street, continues towards Calea Bascovului and ends on Făgăraș Street. The measured length of the route is 909.2 m, and the route serves 16 students. Areas, streets served: Ion Câmpineanu, Nicolae Bălcescu, General Gheorghe Magheru, Făgăraș.
Route 2 starts from the area of Eremia Grigorescu Street, continues on Calea Bascovului and ends on Făgăraș Street. It has a length of 605.9 m and serves 29 students. Areas, streets served: Eremia Grigorescu, Trandafirilor, Aleea Negoiu, Calea Bascovului, Făgăraș.
Route 3 starts from the area of Negru Vodă Street, continues on Carpați Street, then uses Calea Bascovului, with Făgăraș Street as its destination. The length of the route is 914.1 m, and the number of students served is 26. Areas, streets served: Negru Vodă, Carpați, Aleea Negoiu, Calea Bascovulu, Făgăraș.
The estimated travel times presented in Table 2 were determined considering the specific conditions of group walking rather than assuming uninterrupted pedestrian movement at a constant walking speed. The estimates account for possible delays associated with road crossings, short stops and the progressive gathering of students along the routes. Therefore, the estimated times are slightly higher than those obtained from a simple calculation based solely on route length and an average walking speed of 4.5–5 km/h.
The proposed routes serve students residing on streets included in the school district of the "Alexandru Davila" Junior High School, the routes being established according to the distribution of the areas of origin and their connectivity with the pedestrian network to the educational unit.
In total, the three routes allow the organization of travel for 71 students, a number corresponding to the participants included in the school mobility analysis. The differences between the routes in terms of length and number of students served allow a comparison between the proposed variants. The lengths were determined by measuring the actual route on the analyzed network, and the number of students for each route was established based on the distribution of participants in the school mobility study. The spatial configuration of the three routes and the identified collection points are presented in Figure 3. In the next stage, the routes will be comparatively evaluated based on criteria regarding the length of the route, the number of students served, travel time and safety conditions, in order to substantiate the proposed solution for the implementation of the Pedibus program.
2.6. Evaluation Criteria and Mathematical Model for Pedibus Routes
The evaluation of Pedibus routes was carried out by considering several criteria that can influence the feasibility and attractiveness of an organized pedestrian trip. The approach used starts from the representation of the pedestrian network as a network of nodes and arcs, where the nodes represent the points of origin, collection points, intersections or other points relevant for pedestrian travel, and the arcs represent the route sectors between these points. Such a representation allows the individual evaluation of each route and the comparison of variants based on common criteria. The approach is inspired by the multi-objective optimisation model proposed for planning Walking School Bus routes by Wang. Recent literature confirms the importance of route planning and optimisation for Walking School Bus programs, while also highlighting the need for further development of routing and scheduling methodologies [10]
In the case of the present study, the criteria were adapted to the characteristics of the analyzed area and to the available data. Four main components were considered: route length, travel time, pedestrian safety conditions and the number of students served. The choice of these criteria aims to achieve a compromise between travel efficiency and the route's ability to serve as many students as possible, without neglecting safety conditions.
2.6.1. Representation of the Pedestrian Network
The pedestrian network of the study area can be represented as a directed graph G = (N,A) , where N represents the set of nodes, and, A the set of pedestrian arcs. Each arc a ∈ A is associated with a length la , and the route r is represented by the sequence of arcs used for the movement between the origin and destination points.
This representation allows the differentiation between pedestrian movement sectors and the points where the route intersects the road network. Thus, the characteristics of the route can be determined by summing the values of the component arcs. Modeling a pedestrian network through nodes and arcs, including for the representation of crossings, is also used in the approach proposed by Wang et al. for planning Walking School Bus routes [10].
2.6.2. Route Length
The total length of a route r is determined by summing the lengths of the component pedestrian sectors:
where:
Lr– total length of the route r [m];
la– length of the pedestrian arc a [m].
For the three routes analyzed, the lengths determined by measuring the actual route are 909.2 m for Route 1, 605.9 m for Route 2 and 914.1 m for Route 3.
2.6.3. Travel Time
Travel time is an important criterion for organizing a Pedibus route, as the travel time must be within a reasonable range for the students and volunteers accompanying the group. As a first approximation, the travel time of a pedestrian sector can be determined by relating its length to the average travel speed:
and the total time for the route r is:
or, for a constant average speed :
Where vp represents the average pedestrian travel speed.
In the present study, the estimated time is used as a comparative indicator between routes. For the preliminary estimate, an average pedestrian speed of approximately 4.5–5.0 km/h is considered. The travel times presented in Table 2 also take into account the practical characteristics of organized group movement, including roadway crossings, short waiting periods and the movement of students as a group. Therefore, the reported values may be slightly higher than the theoretical travel times obtained by dividing route length by average walking speed. The approach to calculating the time by relating the arch length to the average speed is similar to the principle used in the routing model proposed by Wang et al. [10]
2.6.4. Pedestrian Safety Criterion
Pedestrian safety is a separate evaluation criterion, since the route with the minimum length is not necessarily the most appropriate route for a group of children. The evaluation takes into account elements such as the number and type of crossings, proximity to important traffic flows, continuity of pedestrian infrastructure and characteristics of points of interaction with road traffic.
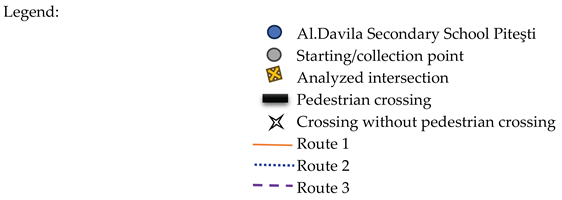
In the present study, safety is assessed descriptively using the number of roadway crossings that are not made through arranged pedestrian crossings. These points were identified directly on the proposed routes and are represented in Figure 4. For each route, the number of such crossings was recorded as an indicator of the potential exposure of the group of students to direct interaction with road traffic. A lower number of crossings without a pedestrian crossing is therefore considered to indicate more favorable safety conditions.
2.6.5. Number of Students Served
A fourth criterion is the number of students who can use each route. This indicator is important because the objective of the program is not only to reduce the length or time of travel, but also to group as many individual trips as possible into an organized pedestrian trip.
For each route r, is defined:
Nr = number of students served by the route
In the analyzed case, the values are Nr = 16 , N2 = 29, N3 = 26, and , resulting in a total of 71 students included in the three routes.
2.6.6. Comparing Proposed Routes
The application of the criteria defined above allows a comparison between the three routes analyzed. For each route, the total length, the estimated travel time and the number of students served are determined, and the safety conditions are evaluated according to the characteristics of the pedestrian infrastructure and the points of interaction with road traffic.
In the case of the three routes analyzed, the lengths are 909.2 m for Route 1, 605.9 m for Route 2 and 914.1 m for Route 3. The number of students served is 16, 29 and 26, respectively. These values highlight, even at a descriptive level, the existence of a compromise between the length of the route and the service capacity. Route 2 is the shortest and simultaneously serves the largest number of students, while Routes 1 and 3 have longer lengths, but allow the inclusion of distinct groups of students from other areas.
For this reason, the comparison does not aim to eliminate longer routes based solely on distance, but rather to evaluate the set of criteria. In the case of a Pedibus program, a longer route may remain relevant if it allows for the inclusion of an additional number of students or if it offers more favorable travel conditions.

Table 1.
Indicators used to evaluate Pedibus routes.
| Criterion | Symbol | Optimisation direction | Unit |
| Route length | Lr | minimize | m |
| Travel time | Tr | minimize | min |
| Safety indicator | Sr | minimize | number |
| Students served | Nr | maximize | students |
2.7. Analysis of the Link Between School Mobility and the Analyzed Intersection
The identification of Pedibus routes represents the first stage in assessing the possible impact of school mobility on road traffic in the analyzed area. In order to appreciate this impact, it is necessary to analyze the spatial relationship between the access routes to the school and the road intersection studied.
From the point of view of the movement to school, the Pedibus routes are oriented towards the educational unit and use the local pedestrian network. At this stage, it is important to differentiate between the student's movement to school and the subsequent movement of the parent to their own destination. Thus, the fact that a student is brought to school by car does not automatically imply that the respective car contributes to the flows observed in the analyzed intersection.
To verify this relationship, the analysis was oriented towards the route taken by the parents after stopping at school. If the parent's subsequent destination is in a direction that involves crossing the analyzed intersection, the respective movement may contribute to the traffic observed in the study area. In contrast, trips using other traffic directions cannot be directly attributed to the intersection under analysis.
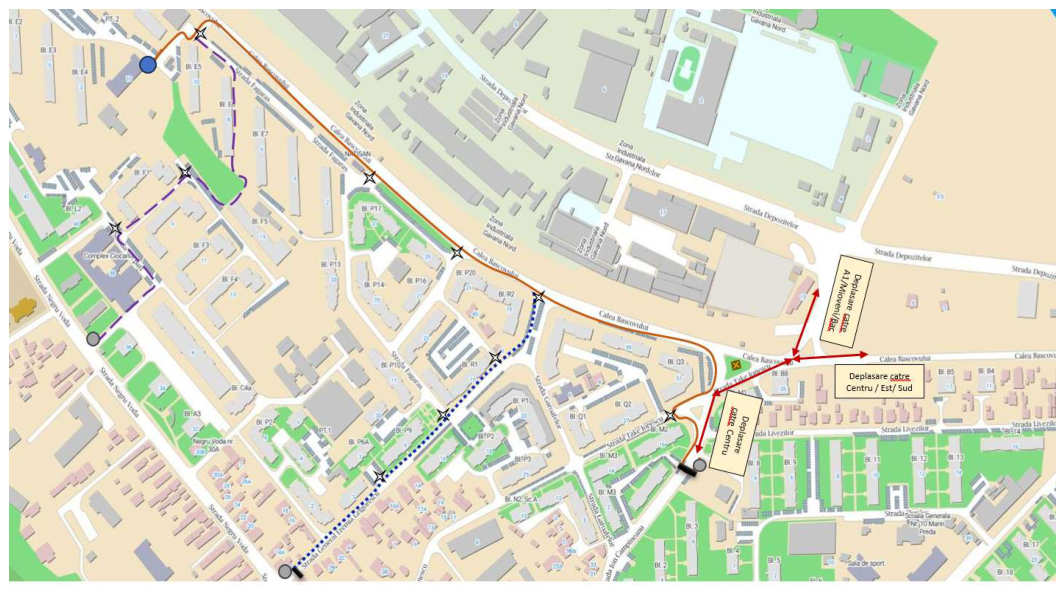
Figure 5.
Possible directions of travel for parents after dropping off students at school and the relationship with the analyzed intersection.
Figure 5.
Possible directions of travel for parents after dropping off students at school and the relationship with the analyzed intersection.
Therefore, the potential effect of the implementation of the Pedibus program on road traffic should be estimated only for that part of the school trips for which a direct relationship with the intersection flows can be established. This approach avoids unjustified attribution of the entire traffic generated by the transport of students to the analyzed intersection.
Next, the relationship between school trips and road traffic is used to define the alternative simulated traffic scenario associated with the Pedibus program. The reduction of car flow is not considered uniform for all traffic directions, but is applied depending on the direction of travel and the identified connection with the intersection area[12].
Table 2.
Pedibus route characteristics and evaluation criteria.
| Route |
Streets / service area |
No. of stud. | Route length (m) | Estimated time (min) | Crossings without pedestrian crossings | Share of students served (%) |
| T1 |
Ion Câmpineanu – Calea Bascovului – Făgăraș | 16 |
909,2 | 13-15 | 5 | 22,5 |
| T2 | Eremia Grigorescu – Calea Bascovului – Făgăraș | 29 | 605,9 | 9-10 | 2 | 40,8 |
| T3 | Negru Vodă – Carpați – Calea Bascovului – Făgăraș | 26 | 914,1 | 13-15 | 3 | 36,7 |
| Total | - | 71 | - | 10 | 100 |
The table summarizes the main characteristics of the three Pedibus routes and the criteria used to evaluate them. The three routes serve a total of 71 students, distributed between T1, T2 and T3, and have lengths ranging from 605.9 m to 914.1 m. From a pedestrian safety point of view, 10 crossings of the roadway without a pedestrian crossing were identified, distributed between the three routes. Route T2 serves the largest number of students and has the shortest length, while routes T1 and T3 have longer lengths and a different number of crossings without a pedestrian crossing.
2.8. Traffic Modeling
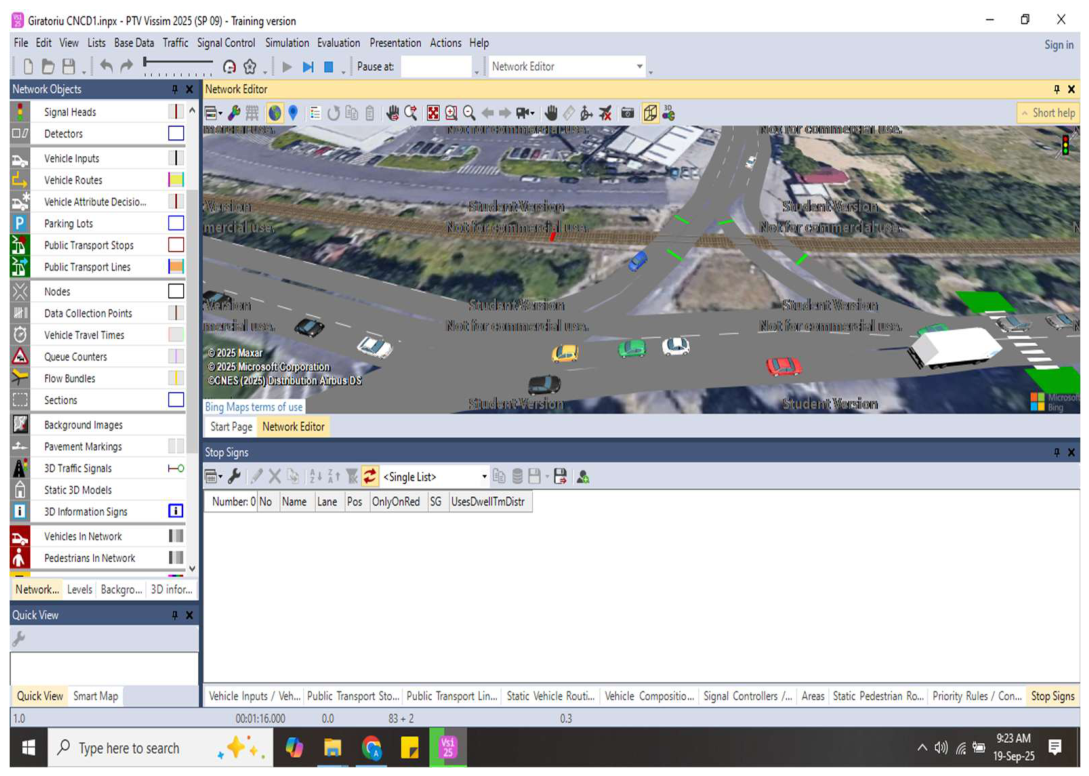
The traffic modeling at the intersection was performed using the microscopic simulation software PTV Vissim [13,14]. The model was built based on the real geometry of the intersection and traffic data collected in the field. The model configuration included the definition of traffic lanes, traffic flows by direction, traffic light cycles and priority rules.
The PTV Vissim model was adjusted based on field observations, taking into account parameters related to vehicle movement dynamics, including desired speed, standstill distance, safety distance, vehicle-following behavior, acceleration and deceleration, lane-changing behavior, and traffic signal operation, in order to reproduce the observed traffic conditions as closely as possible [13,14].
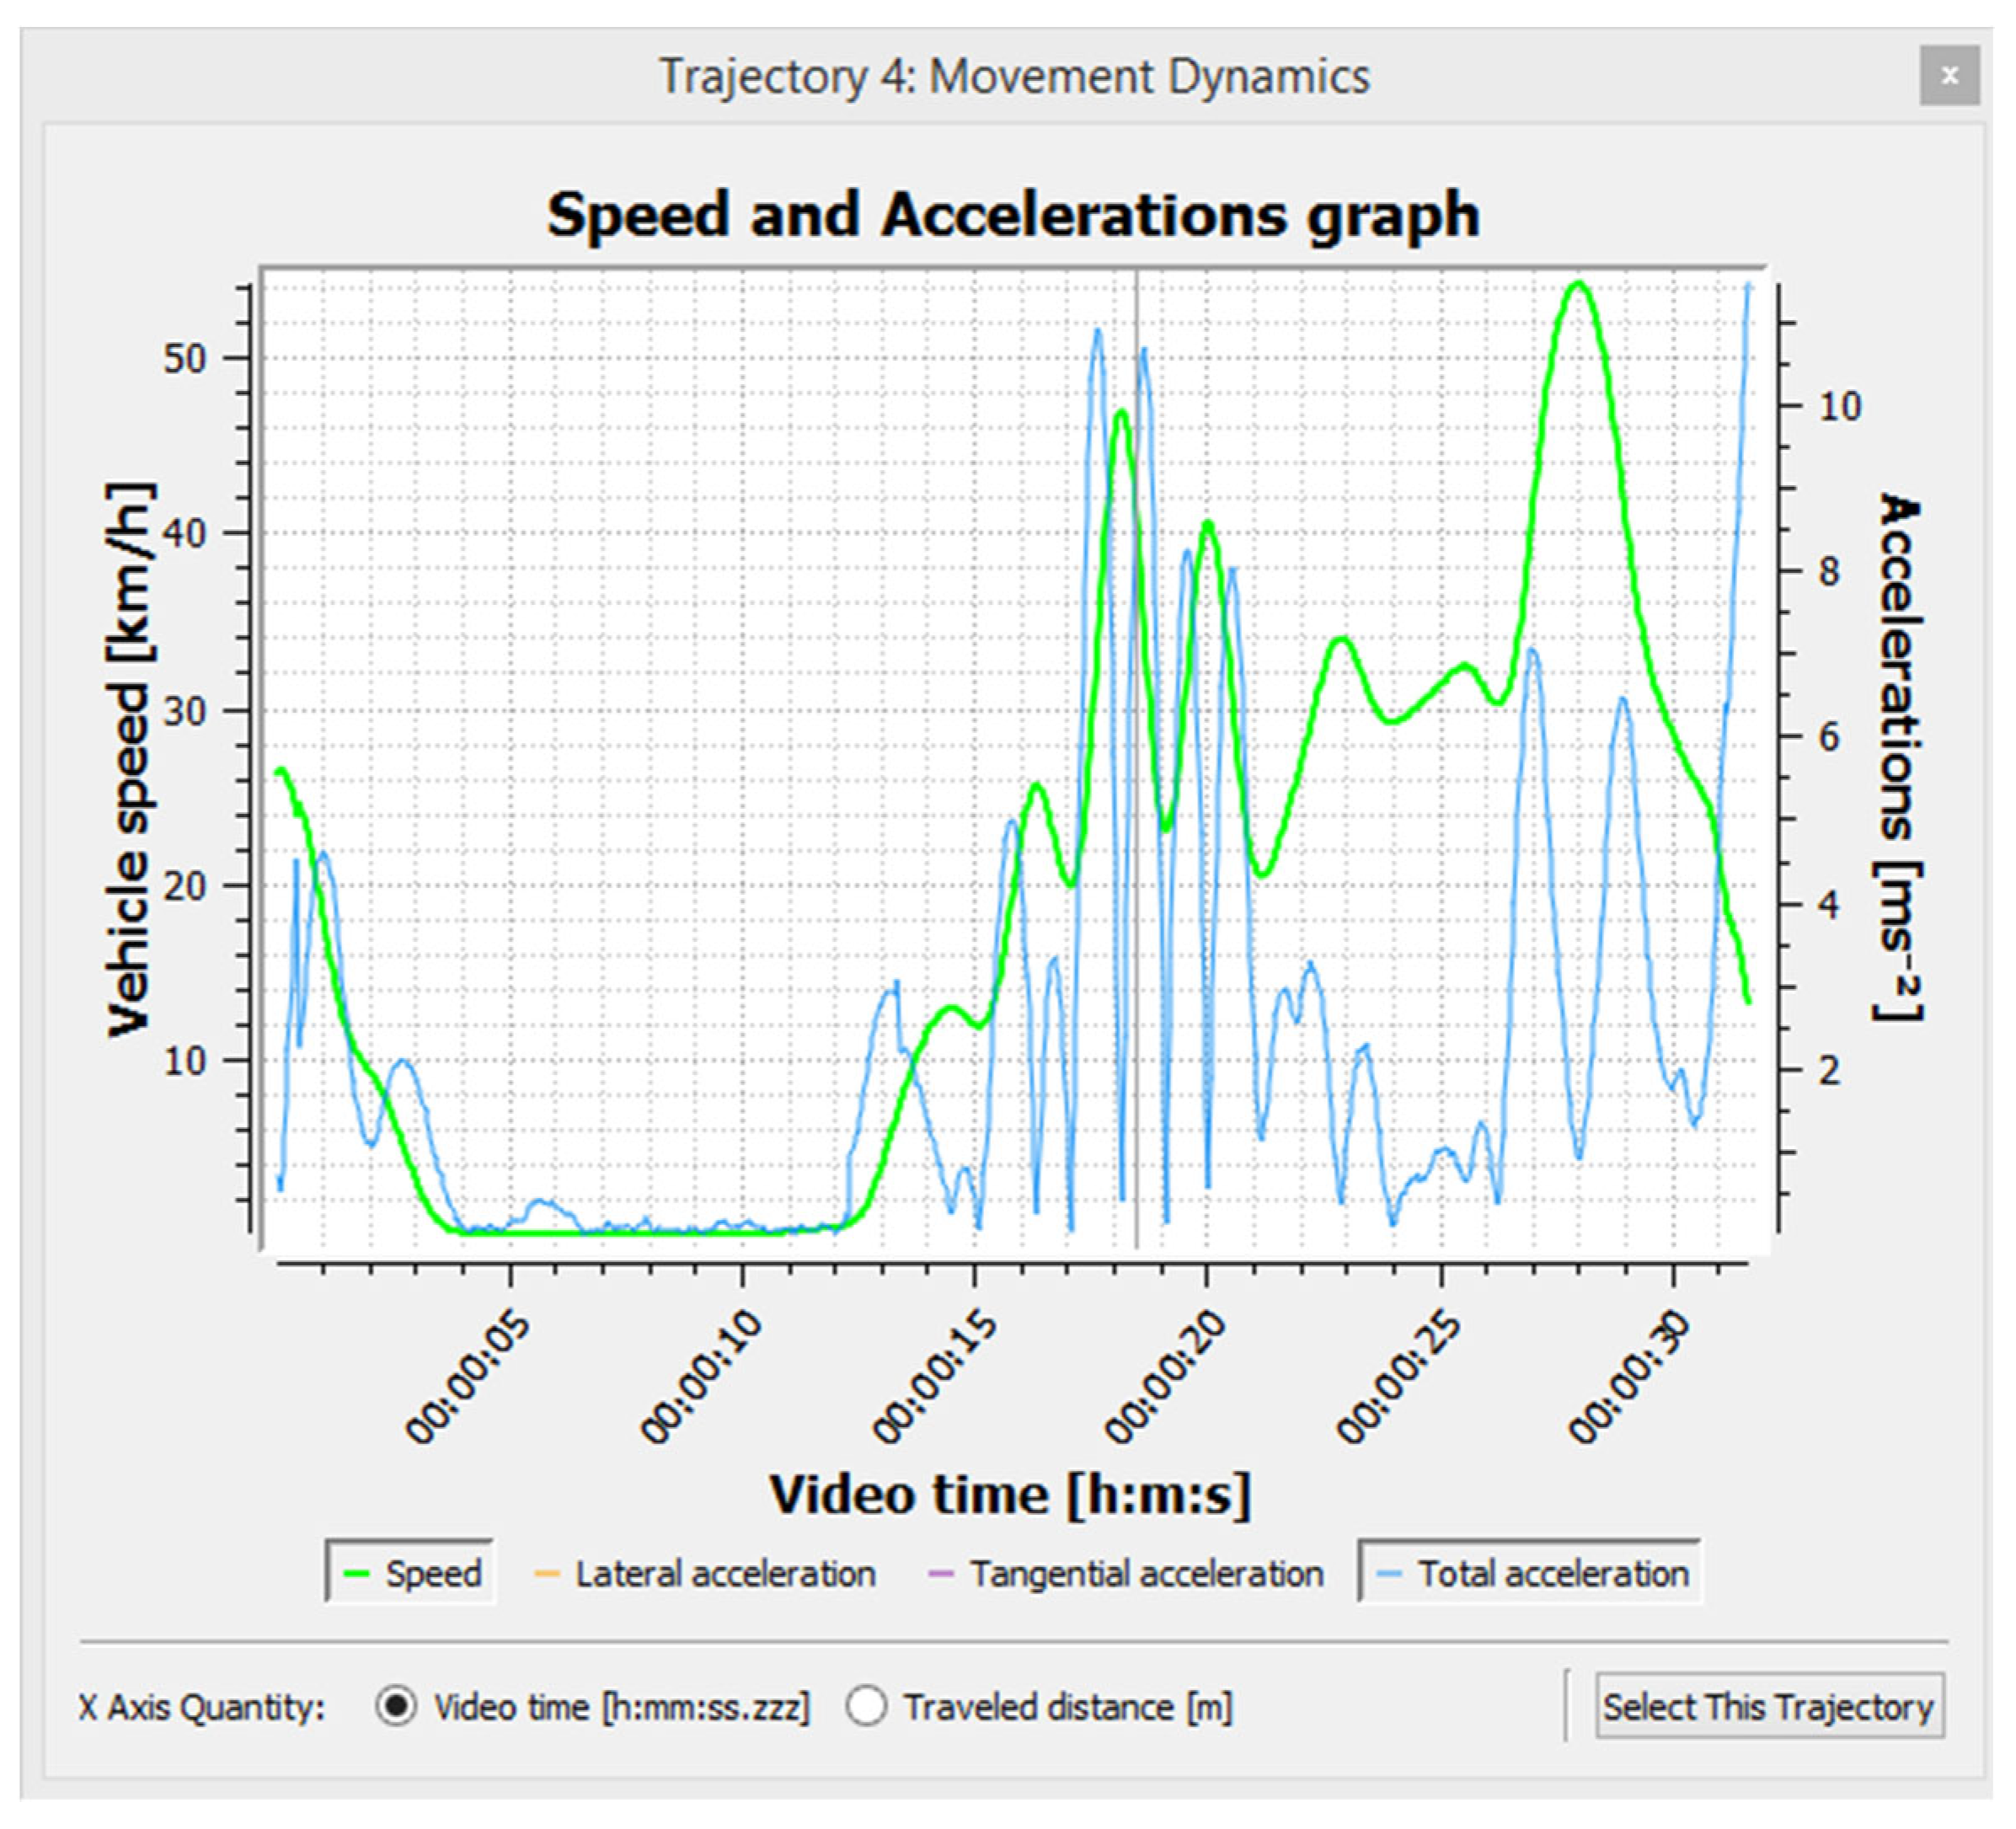
Figure 6.
Vehicle movement dynamics and trajectory analysis in the PTV Vissim model [14].
Figure 6.
Vehicle movement dynamics and trajectory analysis in the PTV Vissim model [14].
The model results were subsequently compared with the observed traffic conditions, with particular attention to the formation of waiting queues, the distribution of traffic flows, and delay times during peak periods.
The vehicle behavior parameters were set using the values available in the PTV Vissim environment, with point adjustments being made based on field observations to obtain a representation as close as possible to the observed traffic conditions. The importance of calibration procedures and performance measures for improving the reliability of microscopic traffic simulation models has also been emphasized in recent studies [15,16].
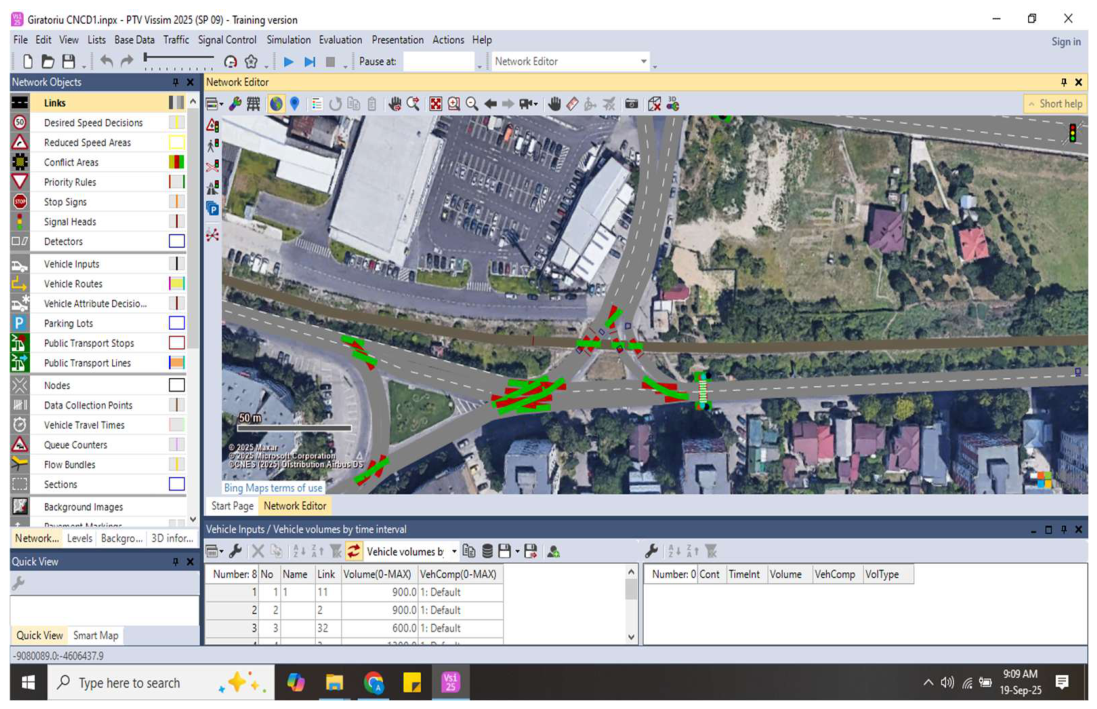
Figure 7.
Microsimulation model of the intersection analyzed in the PTV Vissim environment.
Scenario 1 – Current situation (without Pedibus): reflects real traffic conditions, characterized by the predominant use of cars for school trips;
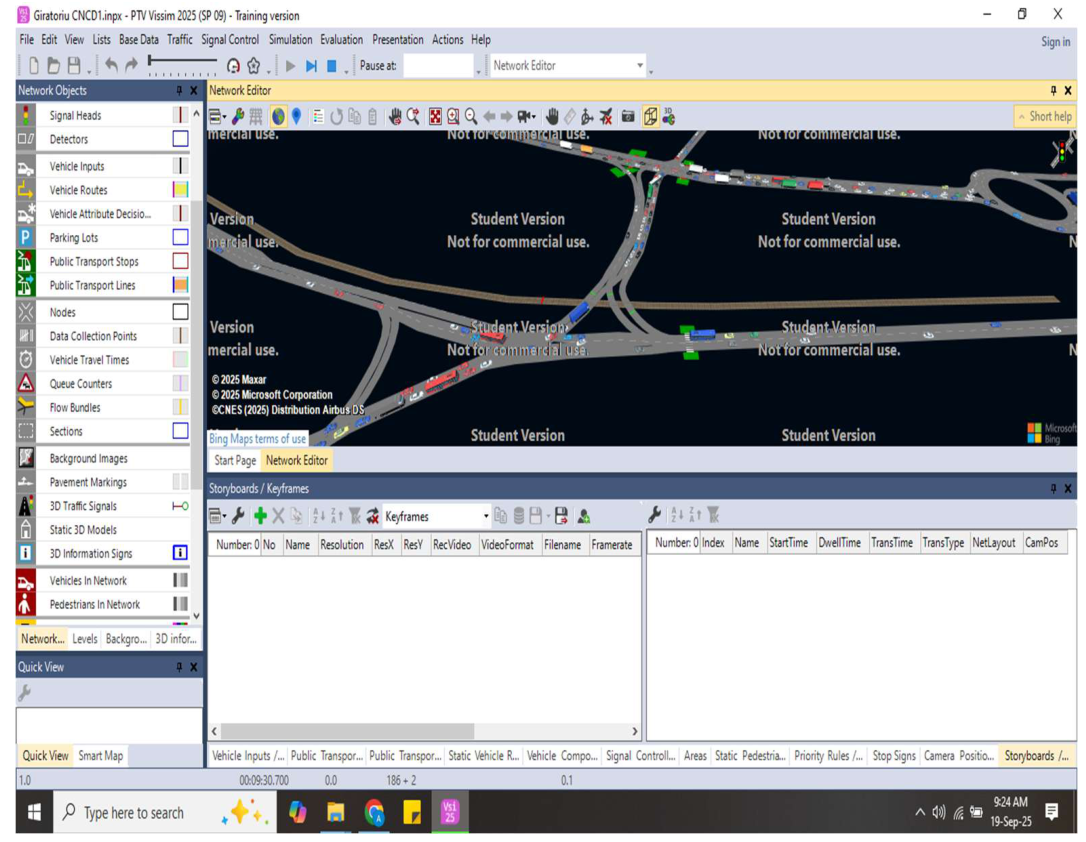
Figure 8.
Image from initial traffic simulation software.
3. Results
Performance indicators
The intersection performance evaluation was based on average delay, level of service (LOS) and flow/capacity ratio (v/c). The indicators were determined through simulations performed in the PTV Vissim environment and were used to characterize the traffic conditions at the analyzed intersection.
3.1. Average Delay (d) - Expressed in Seconds/Vehicle;
Delay was evaluated using the simulation outputs obtained in PTV Vissim. The analysis distinguishes between control delay, expressed in seconds per vehicle (s/veh), which was used for the determination of the intersection level of service (LOS), and the average delay reported in minutes per vehicle (min/veh), which was used for the comparative assessment of the two traffic scenarios. For the analysis performed, the control delay at the intersection was determined based on the following relationship:
DC- Control delay at the intersection;
Vb- Traffic volume for arm b.
3.1.1. Service level (LOS) – determined based on the average delay per vehicle;
The level of service was determined based on the average control delay and allows the characterization of traffic conditions from level A, corresponding to favorable travel conditions, to level F, associated with severe congestion conditionsThe evaluation. The classification used for the analyzed intersection is presented in Table 3.
3.1.2. Flow-Capacity Ratio (Xi = vi/ci)
Used to assess the degree of infrastructure utilization; It is defined as the ratio between the actual traffic flow and the capacity. It is calculated independently for each lane group, with the relationship:
Comparing the two scenarios allowed the assessment of the potential impact of the proposed measure on the performance of the intersection and on general traffic conditions.
3.2. Current Traffic Conditions
3.2.1. Traffic Volume and Characteristics
The analyzed intersection presents high traffic volumes, with important variations in peak intervals. Data collected by UAV monitoring in the intervals 07:00–09:00 and 14:00–17:00 highlighted the overlap of general urban traffic with trips associated with the school program. For the school-related traffic analysis, the 07:30–08:00 interval was identified as the critical morning period based on the recorded traffic patterns. The distribution of flows by directions highlights an uneven demand for the intersection. The highest values were recorded on the Calea Bascovului – Tache Ionescu relationship, with 693 vehicles, respectively on the Strada Depozitelor – Calea Bascovului relationship, with 348 vehicles. These two relationships represent the main traffic flows identified during the analyzed period. The total volume related to the Calea Bascovului entrance is 795 vehicles, while the Tache Ionescu and Strada Depozitelor entrances register 207 and 461 vehicles, respectively. The uneven distribution of flows indicates a greater demand on certain traffic relationships and explains the occurrence of delays and queues during peak periods.
The results highlight the uneven nature of the traffic distribution at the intersection, with a significant concentration of flows on the Calea Bascovului – Tache Ionescu and Strada Depozitelor – Calea Bascovului routes. These routes are relevant for the further evaluation of the effect of the Pedibus measure, as any reduction in school trips using these routes may contribute to reducing the demand on the intersection.
The traffic volumes presented in Table 4 represent the vehicle flows recorded for each entry and exit direction at the analyzed intersection during the observation period. The total volume for each approach was determined by summing the corresponding turning movements. Thus, the Calea Bascovului, Tache Ionescu, and Strada Depozitelor approaches recorded total volumes of 795, 207, and 461 vehicles, respectively, resulting in an overall observed volume of 1463 vehicles.
3.2.2. Level of Service and Intersection Performance
The evaluation of the intersection's performance, carried out with the Vissim program based on the HCM methodology, indicates that it operates at LOS F service level,corresponding to a severe congestion situation.
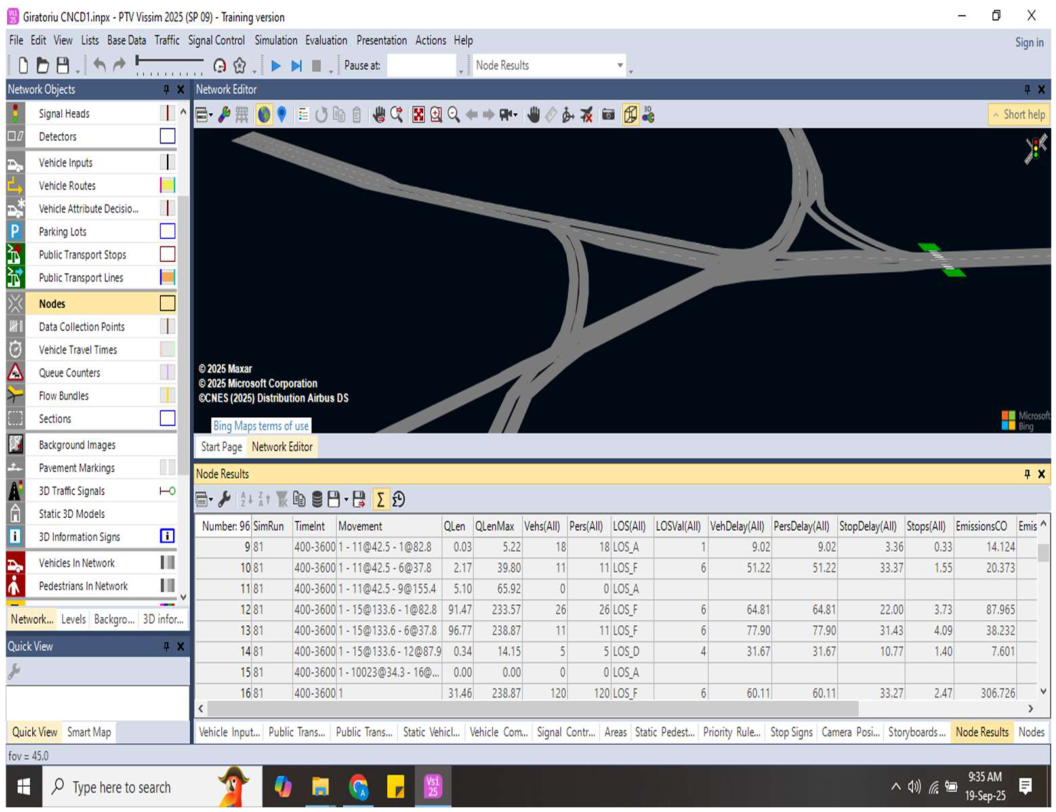
Figure 10.
Image from the software with service level report generation [14] ;.
Figure 10.
Image from the software with service level report generation [14] ;.
The simulation results confirm that the intersection operates under difficult conditions during peak periods, which justifies the analysis of traffic demand reduction measures. The contribution of school trips and the possibility of reducing part of the car flows through the simulated Pedibus scenario are further analyzed.
4. Discussions
4.1. Comparison of Traffic Scenarios
To assess the potential impact of the Pedibus program on the performance of the analyzed intersection, two distinct scenarios were compared: the current situation (without Pedibus) and the alternative simulated scenario (with Pedibus). The volume/capacity ratio (v/c) values were determined based on traffic volumes obtained through UAV monitoring and simulations performed in the PTV Vissim environment for the two analyzed scenarios
The traffic volumes presented in Table 5 were used to assess the traffic conditions for each analyzed movement through the volume-to-capacity (v/c) ratio. For the current situation, the traffic volumes correspond to the observed flows recorded during the analyzed peak period. For the Pedibus scenario, the traffic volumes were estimated by reducing the school-related vehicle flows, based on the results of the questionnaire applied to parents and the estimated potential participation in the Pedibus program. The v/c ratio was calculated for each movement as the ratio between the corresponding traffic volume and the estimated capacity.
Traffic volume values were determined based on data collected through UAV monitoring, field observations, and simulations performed in the PTV Vissim environment. In the Pedibus scenario, the reduction of flows generated by school trips during the peak period 07:30–08:00 was considered, which leads to a decrease in the volume/capacity ratio and an improvement in the level of service of the intersection.
The traffic volumes presented in Table 6 represent estimated aggregated values used to characterize the overall traffic conditions at the analyzed intersection during the critical peak interval. These values are not obtained by directly summing the individual turning movements presented in Table 5, as the two tables have different roles in the analysis. Table 5 presents the traffic volumes for the individual movements considered in the v/c analysis, while Table 6 summarizes the estimated overall traffic conditions for the comparison of the two scenarios. The estimated traffic volumes are approximately 1290 veh/h for the current situation and 1020 veh/h for the Pedibus scenario.
4.2. Analysis of Results
The simulated reduction in school traffic is associated with improved intersection performance, including decreased saturation, improved service level, and reduced delays, highlighting the potential of the Pedibus program as a congestion reduction measure[17].
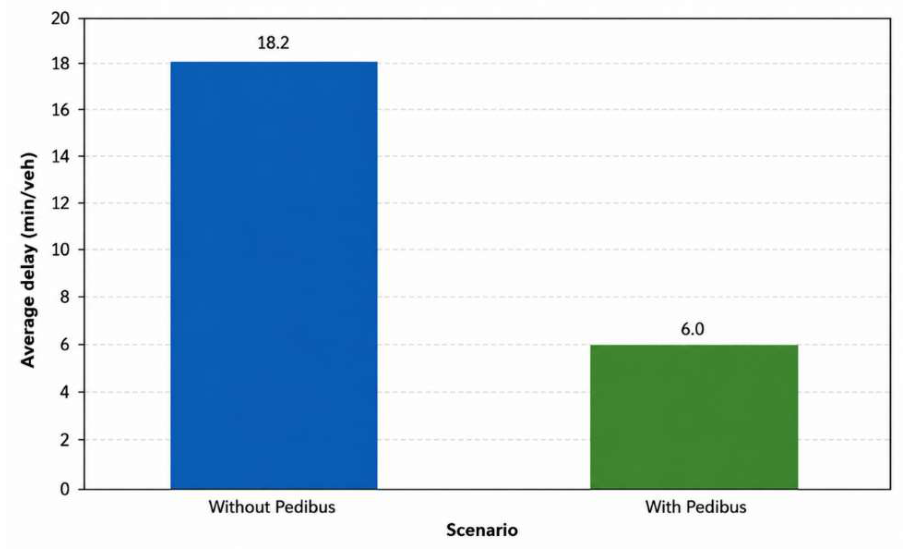
Figure 11.
Impact of the Pedibus program on average delay time.
4.3. Limitations of the Study
This study has several limitations that should be considered when interpreting the results. First, the analysis was conducted for a single school area and a single critical intersection in the municipality of Pitești; therefore, the results cannot be directly generalized to other urban contexts without additional case studies. Second, the school mobility survey included 71 respondents, which provides useful information regarding travel behaviour but represents a relatively limited sample for generalizing the results to the entire school population.
Third, the Pedibus program was not implemented and monitored under real operating conditions. The effects presented in this study were obtained through a simulated alternative scenario in which a reduction in school-related vehicle flows was assumed based on the available survey information and the proposed participation scenario. Consequently, the magnitude of the simulated benefits depends on the assumptions used to define the participation level and the corresponding reduction in vehicle demand. In addition, the results obtained from the PTV Vissim simulation depend on the assumptions and estimated traffic reductions used to define the Pedibus scenario [18].
Fourth, although pedestrian safety was considered in the evaluation of the proposed routes, the assessment was based on a limited set of indicators, primarily related to road crossings and interaction with vehicular traffic. A more comprehensive safety assessment would require additional indicators, such as pedestrian exposure, traffic speed, crossing characteristics, visibility and conflict analysis. In addition, the analysis did not explicitly quantify the influence of built-environment characteristics, school location and infrastructure conditions on students’ travel mode choices, which may affect participation in walking-based school mobility programs [19]. Travel behaviour is also influenced by individual and socio-environmental factors that were not explicitly modelled in the present study. Further research could therefore examine these factors in greater detail when assessing the potential adoption of active school travel measures [20].
Finally, the present study focuses primarily on traffic performance. Potential benefits related to emissions, fuel consumption, noise, physical activity and health were not directly quantified. Future research should therefore include field implementation of the Pedibus program, a larger longitudinal survey of travel behaviour, direct monitoring of participation rates and a more comprehensive assessment of environmental, safety and health impacts.
5. Conclusions
The study conducted on the Calea Bascovului – Tache Ionescu – Strada Depo-zitelor intersection in the municipality of Pitești highlights the significant impact of school traffic on the level of urban congestion. The analysis of the collected data and the simulations performed in the PTV Vissim environment demonstrated that the intersection operates under critical conditions, respecting the service level F, characterized by high delays and exceeding the traffic capacity.
The results obtained indicate that the simulated Pedibus scenario can represent a potentially effective solution for managing school mobility and reducing the demand for car transport. The estimated reduction in traffic generated by student trips leads to a decrease in the saturation degree of the intersection, a decrease in average delays and an improvement in the service level from LOS F to LOS E.
The study also highlights the fact that measures based on changing user behavior can produce important effects on the performance of urban traffic without major interventions on the road infrastructure. In addition, the simulated Pedibus scenario may contribute to improving pedestrian safety, reducing car use and promoting active mobility among students[21].
Several limitations should be considered when interpreting the results of this study. First, the analysis was conducted for a single intersection and a specific school area in the municipality of Pitești, which limits the generalization of the results to other urban contexts. Second, the school mobility analysis was based on a questionnaire completed by 71 parents, and the actual participation in a future Pedibus program may differ from the estimated participation used in the simulated scenario. Third, the Pedibus program was not implemented during the study; therefore, the estimated 70–80% reduction in school-related car traffic represents a potential scenario rather than a reduction measured under real operating conditions. Finally, the results obtained from the PTV Vissim simulation depend on the assumptions and estimated traffic reductions used to define the Pedibus scenario.
At the same time, the simulated Pedibus scenario may contribute to sustainable urban mobility by reducing car use and encouraging active travel. Previous research evaluating Walking School Bus programs under real operating conditions has examined their potential to support active school travel [22]. The present study therefore indicates potential benefits in terms of pollutant emissions and fuel consumption, although these effects were not directly quantified in the present analysis. By limiting the potential use of cars in school areas, the program is consistent with the objectives of sustainable urban mobility and modern transport policies, with potential benefits for the urban environment and quality of life. Research on walking-based school mobility has also highlighted the importance of school access and the characteristics of the surrounding road network in supporting walking as a mode of travel [23]. In addition, promoting walking may support healthier mobility habits among students and contribute to the development of responsible behaviors regarding urban mobility [24].
In conclusion, the Pedibus program has the potential to represent a viable and sustainable alternative for reducing congestion in school areas in the municipality of Pitești within the conditions and assumptions considered in the present study. The results suggest that such a measure can simultaneously address school-related traffic demand and encourage active travel, although its effectiveness under real operating conditions should be confirmed through field implementation and subsequent monitoring. In order to increase the efficiency of this type of measure, it is recommended to develop pedestrian infrastructure, involve local authorities and conduct awareness campaigns on the benefits of active mobility [25].
Abbreviations
The following abbreviations were used:
| Abbreviation | Meaning |
| LOS | Level of Service (Service level) |
| HCM | Highway Capacity Manual |
| UAV | Unmanned Aerial Vehicle (unmanned aerial vehicle / drone) |
| v/c | Volume-to-Capacity Ratio (volume/capacity ratio) |
| s/veh | Seconds per Vehicle (seconds/vehicle) |
| PTV Vissim | Microscopic traffic simulation software |
References
- Boroiu, A.-A.; Neagu, E. Road Traffic and Road Safety. Applications; University of Pitești Publishing House: Pitești, Romania, 2015. [Google Scholar]
- Sun, W.; Guo, D.; Li, Q.; Fang, H. School Runs and Urban Traffic Congestion: Evidence from China. Reg. Sci. Urban Econ. 2021, 86, 103606. [Google Scholar] [CrossRef]
- Ji, X.; Guan, H.; Lu, M.; Chen, F.; Qin, W. International Research Progress in School Travel and Behavior: A Literature Review and Bibliometric Analysis. Sustainability 2022, 14, 8857. [Google Scholar] [CrossRef]
- Mendoza, J.A.; Watson, K.; Baranowski, T.; Nicklas, T.A.; Uscanga, D.K.; Hanfling, M.J. The Walking School Bus and Children’s Physical Activity: A Pilot Cluster Randomized Controlled Trial. Pediatrics 2011, 128, e537–e544. [Google Scholar] [CrossRef] [PubMed]
- Agyeman, S.; Alimo, P.K.; Donkoh, V.; Cheng, L. Toward Cleaner Production of Walking School Buses and Bicycle Trains: A Systematic Review. J. Clean. Prod. 2023, 426, 139031. [Google Scholar] [CrossRef]
- Pitești Municipality. Residential Parking Spaces in Pitești Municipality; Pitești Municipality: Pitești, Romania. Available online: https://www.parcaripitesti.ro/ (accessed on 25 August 2026).
- Pitești City Hall. Available online: https://www.primariapitesti.ro/ (accessed on 17 July 2025).
- McDonald, N.C. Children’s Mode Choice for the School Trip: The Role of Distance and School Location in Walking to School. Transportation 2008, 35, 23–35. [Google Scholar] [CrossRef]
- Google Earth. Available online: https://earth.google.com/ (accessed on 17 July 2025).
- Wang, J.Y.T.; Wu, Z.; Kang, Y.; Brown, E.; Wen, M.; Rushton, C.; Ehrgott, M. Walking School Bus Line Routing for Efficiency, Health and Walkability: A Multi-Objective Optimisation Approach. J. Multi-Criteria Decis. Anal. 2023, 30, 109–131. [Google Scholar] [CrossRef]
- Pitești Municipality. Register of Green Spaces in Pitești Municipality; Pitești Municipality: Pitești, Romania, 2023. [Google Scholar]
- European Commission. Sustainable Urban Mobility Planning Guidelines; Publications Office of the European Union: Brussels, Belgium, 2019. [Google Scholar]
- Hofinger, F.; Haberl, M.; Fellendorf, M.; Rosenkranz, P.; Mischinger, M.; Brandenburg, A.; Hoser, M. 3-Step Calibration Process of a Microscopic Traffic Flow Simulation Platform for Mixed Traffic Scenarios. Transp. Res. Procedia 2023, 72, 1778–1785. [Google Scholar] [CrossRef]
- PTV AG. PTV Vision Vissim 7 User Manual; PTV AG: Karlsruhe, Germany, 2014. [Google Scholar]
- Xie, H.; Qin, C.; Zhi, P.; Dong, Y.; Li, J. Metamodel-Based Calibration of Microscopic Traffic Simulation: A Vissim Case Study. J. Highw. Transp. Res. Dev. Engl. Ed. 2023, 17, 49–58. [Google Scholar] [CrossRef]
- Li, H.; Yuan, Z.; Chen, S.; Zhu, C. Exploring the Effects of Measures of Performance and Calibration Strategies on Calibrating Traffic Microsimulation Model: A Quantitative Analysis Approach. IET Intell. Transp. Syst. 2023, 17, 1200–1219. [Google Scholar] [CrossRef]
- Prakayaphun, T.; Hayashi, Y.; Vichiensan, V.; Takeshita, H. Identifying Impacts of School-Escorted Trips on Traffic Congestion and the Countermeasures in Bangkok: An Agent-Based Simulation Approach. Sustainability 2023, 15, 16244. [Google Scholar] [CrossRef]
- Al-Msari, H.; Koting, S.; Ahmed, A.N.; El-Shafie, A. Review of Driving-Behaviour Simulation: VISSIM and Artificial Intelligence Approach. Heliyon 2024, 10, e25936. [Google Scholar] [CrossRef] [PubMed]
- Li, M.; Wang, Y.; Zhou, D. Effects of the Built Environment and Sociodemographic Characteristics on Children’s School Travel. Transp. Policy 2023, 134, 191–202. [Google Scholar] [CrossRef]
- Smith, M.; Zhang, Y.; McGlashan Fainu, H.; Cavadino, A.; Zhao, J.; Morton, S.; Hopkins, D.; Carr, H.; Clark, T. Socio-Environmental Factors Associated with Active School Travel in Children at Ages 6 and 8 Years. Transp. Res. Interdiscip. Perspect. 2024, 23, 101026. [Google Scholar] [CrossRef]
- Voulgaris, C.T.; Hosseinzade, R.; Pande, A.; Alexander, S.E. Neighborhood Effects of Safe Routes to School Programs on the Likelihood of Active Travel to School. Transp. Res. Rec. 2021, 2675, 10–21. [Google Scholar] [CrossRef]
- Johnson, A.M.; Zhou, C.; Haviland, M.; Mendoza, J.A. Evaluation of a Walking School Bus Program: A Cluster Randomized Controlled Trial. Int. J. Behav. Nutr. Phys. Act. 2024, 21, 55. [Google Scholar] [CrossRef] [PubMed]
- Salvo, G.; Sanfilippo, L.; Brignone, A. Investigating Access to Schools through Walking: A Study of Built School Road Networks. Sustainability 2024, 16, 7452. [Google Scholar] [CrossRef]
- Ma, L.; Shi, W.; Huang, Y.; Lin, J. Active School Travel in China: Unveiling Multifaceted Influences for Sustainable Mobility. Transp. Res. Part D. Transp. Environ. 2024, 134, 104361. [Google Scholar] [CrossRef]
- Loh, V.; Sahlqvist, S.; Veitch, J.; Walsh, A.; Cerin, E.; Salmon, J.; Mavoa, S.; Timperio, A. Active Travel, Public Transport and the Built Environment in Youth: Interactions with Perceived Safety, Distance to School, Age and Gender. J. Transp. Health 2024, 38, 101895. [Google Scholar] [CrossRef]
Figure 1.
Location of the study area in the municipality of Pitești [6]( https://www.parcaripitesti.ro/).
Figure 1.
Location of the study area in the municipality of Pitești [6]( https://www.parcaripitesti.ro/).
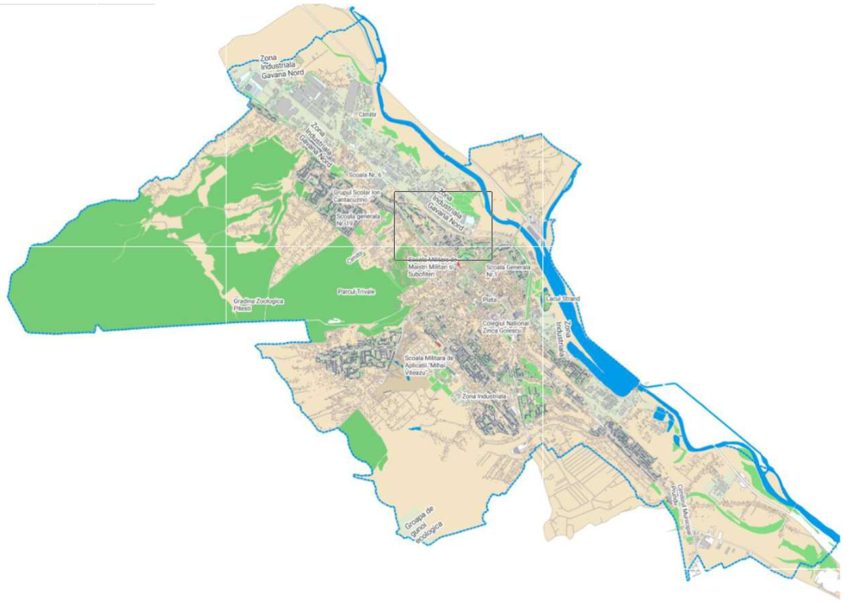
Figure 3.
Proposed Pedibus routes and their relationship to the analyzed intersection [9].
Figure 3.
Proposed Pedibus routes and their relationship to the analyzed intersection [9].
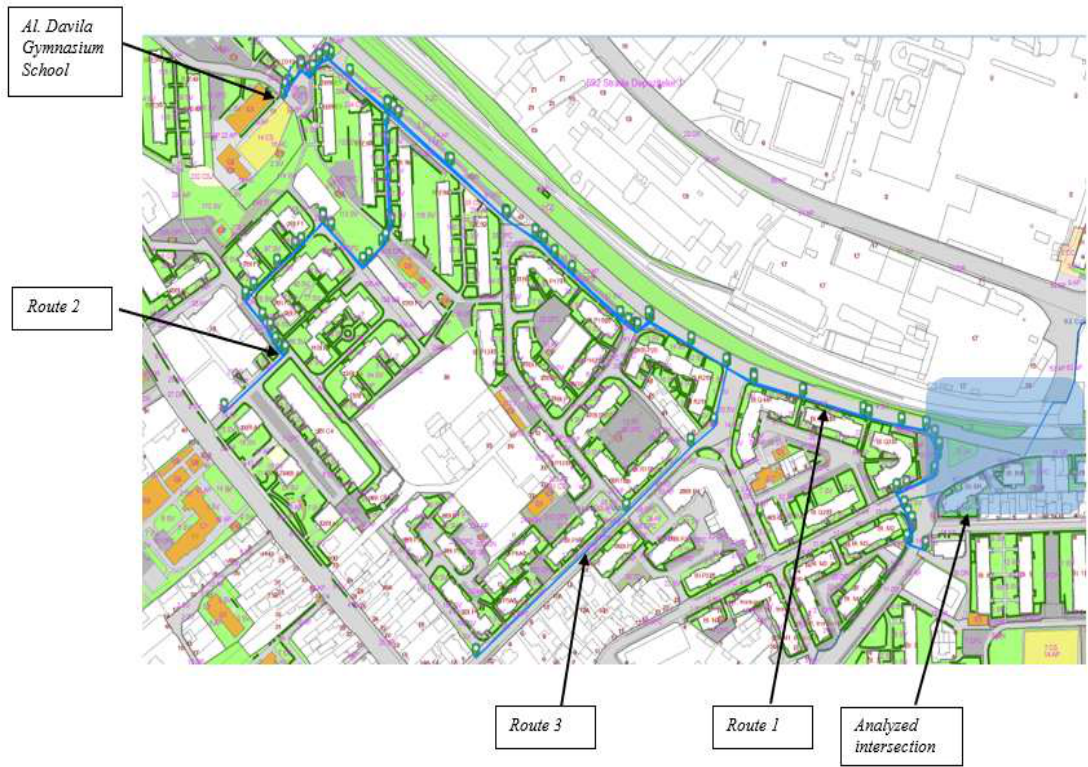
Figure 4.
Pedibus routes and road network crossing points in the study area [11].
Figure 4.
Pedibus routes and road network crossing points in the study area [11].
3.
Level of Service (LOS) Classification.
| Service level (LOS) | Control delay (s/veh) |
| A | < 10 |
| B | 10 – 20 |
| C | 20 – 35 |
| D | 35 – 55 |
| E | 55 – 80 |
| F | > 80 |
Table 4.
Distribution of traffic flows by entry and exit directions in the analyzed intersection.
| Entry | Exit direction | Traffic volume (vehicles) |
| Calea Bascovului | Spre Ion Câmpineanu | 54 |
| Calea Bascovului | Spre Tache Ionescu | 693 |
| Calea Bascovului | Spre Calea Bascovului | 48 |
| Calea Bascovului – Total | 795 | |
| Tache Ionescu | Spre Ion Câmpineanu | 27 |
| Tache Ionescu | Spre Tache Ionescu | 36 |
| Tache Ionescu | Spre Calea Bascovului | 144 |
| Tache Ionescu – Total | 207 | |
| Strada Depozitelor | Spre Calea Bascovului | 348 |
| Strada Depozitelor | Spre Tache Ionescu | 108 |
| Strada Depozitelor | Spre Centru | 5 |
| Strada Depozitelor – Total | 461 |
Table 5.
Traffic volumes used to determine the v/c ratio.
| Traffic flow | Without Pedibus (veh/h) | With Pedibus (veh/h) | Estimated capacity C (veh/h) | v/c Without Pedibus |
v/c With Pedibus |
| Calea Bascovului → Tache Ionescu | 693 | 610 | 640 | 1,08 | 0.95 |
| Calea Bascovului→ Ion Câmpineanu | 54 | 48 | 180 |
0,3 |
0.27 |
| Calea Bascovului → înainte | 48 | 42 | 180 | 0,27 | 0.23 |
| Tache Ionescu → Calea Bascovului | 144 | 120 | 220 | 0,65 | 0.55 |
| Tache Ionescu → Ion Câmpineanu | 27 | 24 | 120 | 0,23 | 0.20 |
| Tache Ionescu → înainte | 36 | 30 | 120 | 0,30 | 0.25 |
| Str. Depozitelor → Calea Bascovului | 348 | 280 | 320 |
1,09 |
0.88 |
| Str. Depozitelor → Tache Ionescu | 108 | 90 | 180 | 0,60 | 0.50 |
Table 6.
Comparison of intersection performance for the analyzed scenarios.
| Parameter | Without Pedibus | With Pedibus |
| Estimated traffic volume V (veh/h) | ≈ 1290 | ≈ 1020 |
| Estimated capacity C (veh/h) | ≈ 1190 | ≈ 1200 |
| Green/cycle ratio (g/C) | 0.29 | 0.29 |
| Volume/capacity ratio (v/c) | 1.08 | 0.85 |
| Service level (LOS) | F | E |
| Average delay (min/veh) | ≈ 18.2 | ≈ 6 |
Disclaimer/Publisher’s Note: The statements, opinions and data contained in all publications are solely those of the individual author(s) and contributor(s) and not of MDPI and/or the editor(s). MDPI and/or the editor(s) disclaim responsibility for any injury to people or property resulting from any ideas, methods, instructions or products referred to in the content. |
© 2026 by the authors. Licensee MDPI, Basel, Switzerland. This article is an open access article distributed under the terms and conditions of the Creative Commons Attribution (CC BY) license (http://creativecommons.org/licenses/by/4.0/).
Copyright: This open access article is published under a Creative Commons CC BY 4.0 license, which permit the free download, distribution, and reuse, provided that the author and preprint are cited in any reuse.