

Submitted:
02 October 2026
Posted:
05 October 2026
You are already at the latest version
Abstract
The Zero-Degree Level (ZDL) serves as a critical boundary for aircraft structural icing in the presence of supercooled droplets. Understanding its spatiotemporal evolution is crucial for evaluating mid-tropospheric thermal shifts and aviation safety. Using ERA5 reanalysis data (1990–2024) across 38 Greek airports, this study analyzes trend dynamics of mean freezing levels and lower-tail cold extremes (Q25) via Mann-Kendall and Sen’s slope methods. Overall, the 0°C isotherm exhibits a systematic upward shift within a 10,000–14,000 ft Mean envelope (with Q25 values extending down to 6,500–8,500 ft), showing statistically significant warming trends across over 80% of stations. Crucially, the Q25 threshold displays a lower rate of long-term shifting than the mean, governed by strong seasonal asymmetries. November acts as the primary warming hotspot (Q25 up to +63 ft/yr), indicating delayed early-winter cold-air outbreaks, whereas September exhibits trend stagnation. Winter shows strong intra-seasonal contrasts, transitioning from January cold-tail stationarity to widespread February warming. Spring functions as a thermal bridge toward summer’s elevated freezing levels (>15,000 ft Mean). Spatially, maritime sectors benefit from sea-surface thermal buffering, whereas enclosed northern inland basins display persistent cold-air pooling. Operationally, these shifts displace the primary structural icing window (0°C to -20°C) to higher flight levels.
Keywords:
Zero-Degree Level (ZDL)
; ERA5 reanalysis
; Mann-Kendall Test
; Sen’s slope
; spatiotemporal trends
; in-flight icing
; aviation safety
1. Introduction
The vertical thermal structure and thermodynamic stratification of the troposphere are undergoing profound, modifications driven by anthropogenic climate change, with consequences for regional hydro-climatological systems and the global aviation sector [1]. Within the framework of atmospheric thermodynamics, the Zero-Degree Level (ZDL)—defined as the lowest height above ground where the ambient temperature drops to 0°C—represents the thermodynamic threshold initiating ice melting during fall and the presence of supercooled liquid water and ice in ascending air masses. Long-term spatial and temporal shifts in the ZDL provide an exceptionally sensitive, integrated signal of lower-to-mid-tropospheric warming, offering a robust diagnostic tool for structural climate monitoring [2,3]. On a global scale, multi-decadal observations and model simulations consistently demonstrate a significant vertical displacement of the freezing level (e.g. [4]). However, this tropospheric warming is highly non-uniform. Driven by multiple anthropogenic and natural feedback mechanisms—including lapse-rate shifts, snow-albedo dynamics, and atmospheric radiative forcing—warming rates often vary with height (Elevation-Dependent Warming). Consequently, thermal trends at operational flight levels can outpace those recorded by standard surface stations [5,6]
In the field of operational aviation meteorology and aeronautical engineering, the ZDL is a critical deterministic baseline rather than a mere theoretical isotherm. It directly governs the spatial envelope, microphysical environment, and severity of aircraft in-flight icing, which remains one of the most persistent, structural hazards to flight safety during all flight phases [7,8]. The atmospheric layer immediately extending above the ZDL—typically bounded by ambient temperatures between 0°C and -20°C—frequently acts as a thermodynamic reservoir for Supercooled Liquid Water (SLW) droplets within stratiform and cumuliform cloud complexes [9]. When an aircraft traverses this unstable layer, aerodynamic impaction causes these SLW droplets to rapidly freeze upon the airframe. This ice accretion fundamentally deforms the cross-sectional geometry of the airfoils, leading to a severe degradation of the lift, a dramatic escalation of drag, and a critical reduction in stall margin capacity [10,11]. Beyond aerodynamic degradation, structural ice accumulation can freeze flight control surfaces, unbalance propeller blades causing destructive airframe vibrations, and induce induction system or compressor icing in turbine engines, leading to power loss or in the case of severe icing to complete engine failure [12,13].
Furthermore, the altitude of the ZDL relative to aerodrome elevation introduces severe operational constraints on ground-based airport infrastructure and terminal area management.
When the ZDL drops into close proximity with the surface during winter storms, airports face complex precipitation transitions (e.g., rain to freezing rain, ice pellets, or heavy wet snow), which immediately degrade runway friction coefficients and trigger mandatory ground de-icing and anti-icing protocols [14]. Conversely, a systematically rising ZDL introduces a complex dual impact on in-flight icing hazards. On one hand, it shifts the primary icing hazard envelope to higher flight levels, effectively reducing risks during initial climb and approach phases. On the other hand, this upward shift may concurrently expand the vertical depth of convective instability and alter operational flight envelopes, complicating descent profiles and holding patterns for arriving aircraft [15,16]. Warmer atmospheric conditions can increase atmospheric moisture capacity according to the Clausius–Clapeyron relationship, potentially modifying the liquid-water content and phase partitioning of mixed-phase clouds. Such changes may alter the altitude, frequency, and severity of aircraft icing conditions, although the response depends strongly on the concurrent temperature and cloud-microphysical environment [17,18,19].
It should be acknowledged that mid-tropospheric warming also carries broader operational consequences, such as elevated density altitude during warm months that imposes aircraft take-off and payload performance reduction [20,21,22]. However, while these thermodynamic shifts affect mainly low-altitude summer operations, the present study intentionally focuses on freezing level dynamics and structural icing hazards involving cold air extreme volatility (Q25) measures.
While macro-scale global reanalyses offer valuable perspective regarding planetary freezing level behaviour, high-resolution regional assessments are vital to resolve localised interactions between synoptic-scale circulation and complex physiographic features [23]. Within Eastern Europe and the Balkans, recent research has initiated the exploration of these dynamics documented multi-decadal freezing level variations across the continental landscape of Romania [24]. Nevertheless, the transitional maritime-to-continental environment of the Eastern Mediterranean, and specifically the Greek peninsula, introduces a highly distinct atmospheric regime subject to complex atmospheric forcings that directly modulate the ZDL. The climate dynamics of this region are governed by a complex interaction between the widening of the Hadley cell, the seasonal migration of the subtropical jet stream, and intense cyclogenesis along the Mediterranean storm track [25,26,27]. The complex geomorphology of Greece, which is characterised by steep mountain chains located close to open sea basins, exerts a powerful effect regulating lower-tropospheric moisture transport and thermal stratification [28,29].
Although historical trend analyses of Greek surface air temperatures have established robust warming signatures [30,31], operational icing research over the region remains exceedingly sparse. Recent work [32] addressed short-term meteorological forecasting and numerical simulation of in-flight icing events over Greece using high-resolution weather prediction model results combined with icing algorithm diagnosis during specific synoptic disturbances. However, a comprehensive multi-station climatological inventory focusing strictly on the long-term vertical evolution and cold-tail extremes of the ZDL over the region’s critical aviation infrastructure remains evidently absent from contemporary literature. To address this gap, the present study establishes a spatiotemporal analysis of the ZDL across 38 airports in Greece throughout a 35-year period (1990–2024) using ERA5 reanalysis data [33], processed via non-parametric Mann-Kendall and Sen's slope statistical metrics.
The principal objective of this work is to evaluate shifting in-flight icing hazards across Greek aerodromes by quantifying long-term trends in Mean ZDL geometric heights and 25th percentile (Q25) cold extremes. By focusing explicitly on localized airport grid points, this study establishes a regional baseline to resolve how seasonal asymmetries, geographical latitude, and complex geomorphology modulate the freezing level envelope. Ultimately, this research aims to provide actionable climatological insights to support regional terminal area management, flight planning, and operational safety protocols for both manned aviation and Unmanned Aircraft Systems (UAS).
2. Data and Methodology
2.1. Data
In this study, hourly atmospheric data were retrieved from the ERA5 reanalysis dataset obtained from the Copernicus Climate Change Service (C3S) Climate Data Store [34]. ERA5 is the fifth-generation reanalysis of the global atmosphere developed by the European Centre for Medium-Range Weather Forecasts (ECMWF) [33]. ERA5 applies a sophisticated four-dimensional variational (4D-Var) data assimilation system within the ECMWF Integrated Forecasting System (IFS), integrating global observations into a coherent physical framework providing gridded datasets with a spatial resolution of 0.25° × 0.25°.
The vertical behavior of the zero-degree isotherm (ZDL) is explored over Greece during the 35-year period 1990-2024. In this context the corresponding ECMWF zero-degree level (deg0l) referring to the geometric height of the 0 °C isothermal level above ground level was extracted at the nearest grid nodes corresponding to 38 operational airport stations in the Athens Flight Information Region (Greece), covering the whole Greek territory from across the continental domain to the Ionian and Aegean islands. The location (nearest grid node) of each station together with the ICAO (International Civil Aviation Organization) four-letter code are shown in Figure 1, while the name-list of the airports and the corresponding code is presented in Table 1.
The choice of ERA5 reanalysis dataset is justified by its wide use worldwide in climatological studies (e.g., [35,36,37,38]) and by its demonstrated ability to represent free-tropospheric temperature profiles and long-term temperature variability over Mediterranean, including regions characterized by complex topography, as well as its extensive application in Mediterranean-scale climatological studies (e.g., [39,40,41]). This airport-centric approach directly connects climatic tropospheric trends with local aviation weather profiles (related to freezing level or density altitude) and flight operations from conventional aircrafts to Unmanned Aerial Systems (UAS).
2.2. Methodology
In order to thoroughly investigate the temporal evolution and variability of ZDL across each station, the data were processed and aggregated at three distinct temporal scales, namely, annually to track long-term climate trends, seasonally and monthly to capture the corresponding time variations throughout the year. Additionally, for each station and timeframe, the 25th percentile (Q25) was computed. While the mean values represent the central tendency of ZDL, Q25 specifically highlights the lower bound of ZDL (i.e., colder condition episodes and lower-altitude potential freezing occurrences), offering an empirical baseline for the colder atmospheric regime, capturing cold-air outbreaks and possible low-level in-flight icing conditions.
Subsequently, the non-parametric Mann-Kendall test and Sen’s slope estimator were employed to each of these metrics (mean and Q25) across annual, seasonal, and monthly series to evaluate trend direction, magnitude, and statistical significance of the ZDL trends. Non-parametric methods are particularly suited for atmospheric and climatological time series, as they exhibit robustness against outliers, non-Gaussian distributions, and missing values. The statistical significance of monotonic trends in ZDL was evaluated at the standard 95% confidence level (p < 0.05), following the widely accepted threshold for hydro-climatic trend analysis [42,43,44].
The Mann-Kendall test (MK) is suitable for evaluating time data series when each observation xj may be represented by the general type:
where f(t) is a continuous, monotonic function of time, and εj the residuals for a large sample that are assumed to be oriented from the same normal distribution with zero mean. The statistic metric S is then calculated as:
where n is the length of the time series, xj and xk represent the data values at sequential time steps j and k (j > k), respectively, and sign() is the sign function defined as:
xj = f(tj) + εj
For sample sizes n > 10, the variance of S is calculated by:
where m represents the number of tied groups and ti is the number of data points in the ith group. The standardized test statistic ZMK is calculated as:
A positive ZMK indicates an upward trend (rising ZDL), whereas a negative value indicates a downward trend. The null hypothesis of no trend is rejected at a confidence level of 95% if ZMK > 1.96 (p < 0.05).
While the MK test determines the presence and significance of a trend, it does not quantify its magnitude. The robust non-parametric Sen’s Slope Estimator [44] was used to compute the magnitude of the slope:
This procedure is a non-parametric estimating of the slope of a trend in the sample of N pairs of data. For N=[n(n-1)/2] distinct pairs of data points, Sen’s slope Qmed is defined as the median of all individual slopes Qi:
The median slope Qmed provides an unbiased measure of the rate of change per unit time, expressed here in feet per year (ft/yr). These statistical trend methods have been widely applied in climate change studies (e.g., [24,45,46]).
To thoroughly decipher both the mean state and the cold boundaries of the troposphere over the Greek airports, the whole statistical trend analysis was performed to the mean timeframe values as well as the lower distribution tail Q25. Comparing the divergence between Sen's slopes of the Mean and Q25 allows for the detection of asymmetric distribution shifts (e.g., tropospheric compression or expansion) across Greece.
It is noted that for the purposes of this all freezing level (ZDL) altitude metrics throughout this analysis are expressed in feet (ft), following the standard operational conventions in aviation meteorology and flight planning.
3. Results
3.1. Analysis of Timeframe ZDL Variability
The seasonal and monthly distribution profiles of the mean Zero-Degree Level (ZDL) across the Greek territory are synthesized in Figure 2. The regional ZDL displays a classic, pronounced unimodal annual cycle following the solar radiation forcing and the climatic atmospheric thermal state of the Eastern Mediterranean. As depicted in Figure 2a, the seasonal mean ZDL spans a broad vertical column of over 8,500 ft between the cold and warm regimes. The annual baseline is centred at approximately 10,500 ft. Winter marks the lowest altitude envelope, with median ZDL values hovering at roughly 6,500 ft and lower extreme tails reaching down to 2,500 ft, signifying the primary operational window for low-level in-flight icing risk. Conversely, summer elevates the freezing level above 14,500 ft, effectively clearing lower flight levels from structural icing conditions. Notably, a distinct seasonal asymmetry is observed between the transitional periods: Autumn remains substantially warmer than Spring by approximately 2,500 ft, driven by the strong thermal inertia and heat storage of the surrounding Mediterranean Sea.
A more detailed assessment of the monthly progression (Figure 2b) isolates January and February as the most critical months for low-altitude freezing levels, both exhibiting median values close to 6,000 ft and absolute minima descending below 2,500 ft. The ZDL undergoes an accelerated upward displacement during late spring (April to June), reaching its climatological peak in July and August (> 15,000 ft). Furthermore, the wider interquartile ranges and extended whiskers during the winter and early spring months reflect the heightened synoptic variability mainly caused by passing frontal systems and dynamic cold-air advections over Greece.
To assess the colder boundary of the tropospheric regime and the baseline envelope for low-level in-flight icing risk, the distribution of the 25th percentile (Q25) ZDL is illustrated in Figure 3. As shown in Figure 3a, the annual Q25 ZDL is centred around 7,500 ft, representing a systematic downward shift of approximately 3,000 ft relative to the annual mean state. The seasonal dynamics reveal severe operational constraints during the cold period: winter exhibits a median Q25 height below 5,000 ft, with the absolute minimum bounds descending down to 500 ft. This indicates that under cold-air outbreak regimes, structural icing hazards extend down to airport terminal manoeuvring areas and low-altitude flight corridors.
Transitioning through the annual cycle, Spring maintains a lowered Q25 envelope at approximately 7,200 ft, with lower whiskers reaching 3,000 ft. In contrast, Summer Q25 values remain highly elevated with a median exceeding 13,500 ft and a strict lower bound above 9,500 ft, effectively eliminating low-level icing potential during the warm season.
The monthly breakdown (Figure 3b) emphasizes January and February as the most intense cold-regime months, both recording median Q25 altitudes near 4,500 ft and lower whiskers reaching the surface level. The extended lower whiskers observed from December through March possibly highlight the high vulnerability of the region to dynamic, episodic continental cold-air advections mainly from North-Eastern Europe. The effect of such cold outbreaks also emerge in the statistical scores of specific aerodromes as will be presented in next section’s results. The seasonal thermal lag remains evident in the Q25 metric as well, with October (~ 10,500 ft) remaining substantially warmer than April (~ 7,500 ft).
To decipher the spatial variability of the lower freezing level boundary, the study domain was sub-classified into four geographical sub-regions: (a) North Greece, (b) Central Greece, (c) West Greece, and (d) South Greece and Islands (Figure 4). Table 1 summarises the airports considered in this work divided into the different geographical regimes. The reason for selecting this division is based on synoptic climatology and circulation pattern classifications (e.g., [25,47,48,49]), in which, the Hellenic peninsula is divided into sub-regions exhibiting coherent responses to distinct synoptic-scale atmospheric forcing. This spatial heterogeneity is primarily driven by the north-south oriented Pindus Mountain range—acting as an orographic barrier—and the thermal contrast introduced by the Aegean and Ionian Seas.
A strong, systematic north-to-south latitudinal gradient is evident during the cold season. As depicted in Figure 4a, North Greece exhibits the most severe low-altitude freezing exposure; the median Q25 ZDL during January and February drops to approximately 2,000 ft, with lower whiskers extending down to close to surface levels. Central Greece (Figure 4b) follows a similar behaviour, with mid-winter median Q25 values around 3,500 ft. Both continental domains demonstrate pronounced dispersion (wide interquartile ranges and long whiskers), highlighting their direct exposure to dynamic, continental North Europe cold-air advections.
In contrast, South Greece and Aegean Islands (Figure 4c) exhibits a highly buffered, maritime modulated regime. The mid-winter Q25 ZDL remains strictly elevated, with median values anchored around 5,000 ft and absolute minimum bounds rarely descending below 4,000 ft. Furthermore, the remarkably narrow interquartile ranges across all months reflect strong spatial homogeneity and the maritime buffering effect of the Aegean Sea, which dampens extreme continental cooling.
West Greece (Figure 4d) represents a transitional zone, where winter median Q25 ZDL hovers near 4,500ft, yet exhibits sporadic extended lower tails (< 2,000 ft) driven by frontal passages originating from the Central Mediterranean and Adriatic Sea and orographic blocking along the Pindus mountain range. During the summer peak (July--August), the regional disparities narrow significantly, with Q25 heights reaching 13,000 ft in the north and up to 15,000 ft in the south regime.
3.2. Trend Analysis of ZDL Regional Variability
Prior to evaluating monotonic trends, the temporal fluctuation of the annual mean ZDL was examined across selected representative stations, one for each geographical region (North, East, West and South Greece and Aegean islands) over the 35-year study period (1990–2024). Overall, the annual mean ZDL exhibited substantial inter-annual variability alongside a noticeable long-term upward shift.
In Northern Greece, as represented by Alexandroupolis aerodrome (LGAL), both the annual mean (Figure 5a) and cold-tail extreme (Q25) ZDL (Figure 5b) display strong, statistically significant upward trends. Specifically, the baseline annual Mean ZDL at LGAL stands at 9,370.82 ft, exhibiting a robust warming rate with a Sen’s Slope (SS) of +32.8 ft/yr (Mann-Kendall test statistic MK = +4.74, p < 0.05). A parallel elevation shift is observed for the cold-tail metric, where the annual Q25 Mean ZDL averages 6,562.07 ft with an almost identical warming trajectory (SS = +32.6 ft/yr, MK = +4.15, p < 0.05). This co-evolution demonstrates a coherent, unimodal upward displacement of the entire freezing level distribution over this northern airspace.
Representing East-Central Greece, Athens International Airport (LGAV) exhibits a statistically significant upward trajectory across both parameters. The baseline annual Mean ZDL at LGAV (Figure 5c) exceeds the 10,000 ft threshold (10,105.65 ft) with a positive trend (SS = +25.2 ft/yr, MK = +4.43, p < 0.05). Concurrently, Q25 metric (Figure 5d) averages 7,318.69 ft and displays an even steeper elevation rate of +32.9 ft/yr (MK = +4.12, p < 0.05)[cite: 12]. This pronounced shift highlights that lower-tropospheric winter and transitional-season cold intrusions over the Attica basin are undergoing systematic thermal erosion. While earlier decades recorded annual Q25 levels below 6,500 ft (e.g., 1991, 1996, and 2003), the post-2013 period demonstrates a marked upward shift, with Q25 values consistently exceeding 7,500 ft and peaking above 8,500 ft in 2018.
In Western Greece, as exemplified by Ioannina aerodrome (LGIO), both annual Mean (Figure 5e) and Q25 ZDL (Figure 5f) parameters exhibit clear warming trends. The baseline annual Mean ZDL at LGIO is established at 7,201.60 ft (SS = +24.8 ft/yr, MK = +4.03, p < 0.05). In parallel, the cold-tail extreme (Q25) metric averages 4,177.75 ft, displaying a steeper elevation rate of +29.0 ft/yr (MK = +3.56, p < 0.05). This warming rate in the Q25 metric indicates that cold-air masses over the mountainous terrain of Western Greece are subject to notable vertical retreat. Although annual Q25 levels dropped below 3,500 ft during the first half of the record (reaching an absolute low near 3,000 ft in 2005), the post-2013 period marks a distinct shift, with Q25 values regularly exceeding 4,500 ft and peaking above 5,300 ft in 2020.
Finally, representing the southeastern marine domain, Rhodes aerodrome (LGRP) demonstrates statistically significant upward trends in both metrics. The annual Mean ZDL at LGRP (Figure 5g) averages 11,068.92 ft (SS = +20.8 ft/yr, MK = +3.86, p < 0.05), reflecting a baseline freezing level well elevated above the mainland stations. Notably, the Q25 metric (Figure 5h) exhibits a steeper warming trajectory, averaging 8,118.61 ft with an elevation rate of +33.8 ft/yr (MK = +3.75, p < 0.05). This accelerated rise in the Q25 threshold highlights that maritime air over the southern Aegean undergoes substantial thermal modification. Although there is a case for which Q25 value falls below 7,000 ft (1992), recent conditions feature multi-year levels where the annual Q25 metric consistently exceeds 8,500 ft.
3.3. Analysis of Monotonic ZDL Trends
The analysis of monotonic ZDL includes yearly, seasonal and monthly mean trends of the zero degree level (ZDL) as well as the 25th percentile (Q25) threshold and the non-parametric Sen's slope trends for both the Mean and Q25 ZDL metrics across the 38 Hellenic airports.
3.3.1. Annual Trend Patterns
The spatial distributions of the annual absolute altitudes and the Sen's slope trends for both the Mean and Q25 ZDL metrics are illustrated in Figure 6 and Figure 7, respectively. To visually contextualize the spatial distribution of the freezing level metrics relative to the complex regional terrain, the station-point metrics are overlaid against the surface orography derived from the ERA5 reanalysis grid.
As shown in Figure 6a, the climatological annual Mean ZDL exhibits a strong Northwest-to-Southeast latitudinal and topographically driven gradient. The lowest mean values are anchored over the high-altitude continental northwestern domain (e.g., Kastoria - LGKA at approximately 6,436 ft, whereas the highest elevations extend over the southern maritime sector, exceeding 11,000 ft across mainly Southeastern Aegean (LGKS, LGPL, LGKO, LGRP). On the other hand the Q25 spatial footprint (Figure 6b) mirrors this spatial geometry with a uniform downward offset of approximately 3,000 ft, ranging from ~ 3,364 ft at LGKA to greater than 8,000 ft at the southern insular stations.
The spatial analysis of the Sen's slope trends reveals a remarkable contrast between the mean warming rate and the lower-tail envelope shift. Specifically, the mean trend pattern indicate that all operational stations exhibit statistically significant positive trends (p < 0.05). The most intense upward displacement of the annual mean ZDL (Figure 7a) is concentrated over Northern and Northeastern Greece (e.g., LGAL and LGKV exceeding +30 ft/yr), whereas the southern maritime domain exhibits more moderate mean slopes (+21 to +24 ft/yr}. In contrast, the same analysis for Q25 Trend Pattern shows that the annual Q25 metric (Figure 7b) demonstrates accelerated upward trends domain-wide, with Sen's slopes ranging from +27 ft/yr to over +37 ft/yr}). Notably, the maximum Q25 upward rates shift toward Crete (e.g., LGSA and LGIR exceeding +36 ft/yr).
This spatial difference shows that while northern continental areas experience the fastest rise in average ZDL, southern maritime regions suffer the largest loss of cold-air events (Q25). As a result, the atmospheric layer where in-flight icing risk occurs is systematically pushed to higher altitudes.
3.2.2. Seasonal Trend Patterns
The winter season (December-January-February) represents the most critical period for aviation safety due to the regional lowering of the freezing level. Figure 8 and Figure 9 depict the spatial patterns of winter Mean and Q25 ZDL altitudes alongside their respective Sen's slope linear trends.
During winter, the climatological Mean ZDL (Figure 8a) ranges from a low of ~2,600 ft and ~3,200 ft over continental Northwestern Greece (LGKA, LGKZ, LGIO) to over 7,000 ft across the southern maritime sector (LGSA, LGKS, LGKO, LGRP). The winter Q25 ZDL threshold (Figure 8b) reveals severe low-altitude exposure across Northern and Central mainland sites, where the lower quartile freezing level descends below 1,500 ft and even down to ~300 ft (LGKA), frequently bringing structural icing conditions down to surface approach corridors. Conversely, the southern maritime domain remains protected, maintaining winter Q25 levels well above 4,500 ft.
The non-parametric trend analysis uncovers a pronounced, spatially focused warming hotspot during the winter season. The Winter Mean ZDL Trends showcase a striking Northeast-to-Southwest gradient (Figure 9a). In particular, Northern and Northeastern Greece experience an exceptional upward displacement rate of the mean freezing level, with stations such as Alexandroupoli (LGAL), Kavala (LGKV) and Thessaloniki (LGTS), exceeding +39 ft/yr to +45 ft/yr (p < 0.05). In contrast, Southern Aegean and Ionian stations exhibit more moderate mean trends (~ +27 to +32 ft/yr). On the other hand, the lower-tail Q25 metric (Figure 9b) demonstrates a strong spatial decoupling. The northern continental corridor (LGAL, LGKV, LGTS) exhibits an intense shift of its coldest days, with Q25 rising at rates up to +40 ft/yr. Conversely, across the Southern Aegean, Crete, and Ionian Sea, winter Q25 trends drop below +15 ft/yr and lose statistical significance (p > 0.05).
This behaviour indicates that winter climate change over Greece is predominantly driven by a rapid retreat of continental Balkan cold-air outbreaks over Northern Greece, whereas the maritime Southern Aegean experiences a more stable winter thermal baseline.
During the spring transitional period, the regional atmospheric boundary layer undergoes substantial thermal expansion, lifting the Zero-Degree Level across the entire Greek airspace. Figure 10 and Figure 11 summarize the seasonal baseline and trend behaviour for spring Mean and Q25 ZDL metrics, respectively. The climatological Mean ZDL (Figure 10a) ranges from approximately 5,100 ft and 5,800 ft over Western Macedonia (LGKA, LGKZ) to over 9,600 ft across Crete and the Southeastern Aegean (LGSA, LGKS, LGRP, LGKO). Similarly, the lower-tail Q25 ZDL envelope (Figure 10b) relaxes significantly relative to winter, maintaining baseline values above 3,100 ft even over northern inland corridors and exceeding 7,800 ft in the south.
The linear trend magnitude during spring displays distinct spatial properties compared to the winter season. Mean upward displacement rates are moderate overall, ranging from +18 to +25 ft/yr (p < 0.05). Notably, the primary warming axis shifts westward and southward. The highest mean upward rates (>+23 ft/yr) are recorded along Northwestern Greece (LGKR, LGIO, LGPZ) and central Aegean insular sites (LGHI, LGIK, LGLM), whereas Northern continental nodes (LGKA, LGKZ) exhibit reduced slope magnitudes (~ +16 to +18 ft/yr) (Figure 11a). This spring pattern suggests that thermal modulation over Greece during spring is governed primarily by maritime air mass intrusions from the Ionian and Central Mediterranean, blunting the continental thermal contrast observed during winter. The Q25 metric exhibits a more spatially fragmented response (Figure 11b), with Sen's slope values generally bounded between +3.4 and +23.2 ft/yr, however, they are all of low statistical significance which is reduced especially for the smaller rates (< +10 ft/yr) at central mainland and Peloponnese stations (e.g. LGLR, LGKL) and approaches significance at higher-end Q25 displacement rates (>+20 ft/yr) restricted to Northeastern coastal nodes (LGMT, LGLM), and Central Crete (LGIR).
During the summer season, radiative heating drives the Zero-Degree Level to its absolute annual maximum elevation across the Hellenic FIR. Figure 12 and Figure 13 illustrate the spatial distribution of summer Mean and Q25 ZDL altitudes along with their non-parametric Sen's slope trends. The climatological Mean ZDL (Figure 12a) reaches peak operational altitudes, ranging from ~10,500 ft over inland Northwestern Greece (LGKA, LGKZ) to over 15,100 ft across Crete and the Southeastern Aegean Sea (e.g., LGSA, LGKS, LGRP, LGKO). The Q25 lower-bound boundary (Figure 12b) reflects similarly elevated conditions, staying above 9,400 ft in the north (LGKA) and exceeding 14,000 ft across southern maritime area, effectively eliminating low-level structural icing hazards for terminal aviation during summer.
The summer linear displacement rates reveal a robust spatial divergence between northern continental and southern maritime domains. Upward trend rates display a sharp latitude-dependent gradient (Figure 13a). Northern coastal and Aegean insular sites, specifically LGKV, LGAL, LGLM, and LGTS, exhibit the strongest statistically significant warming rates, ranging from +23.3 to +26.4 ft/yr. Moving southward, trend magnitudes decline to +14.0 to +16.0 ft/yr across the Southern Aegean and Crete, where most maritime stations fail to achieve statistical significance at the 95% confidence level. The Q25 lower-tail metric (Figure 13b) demonstrates an even widespread loss of trend significance. A statistically significant upward slope is localized primarily over LGAL (>+19.0 ft/yr) and inland Macedonia (LGKA, LGKZ, LGTS, ~ +12.0 to +13.5 ft/yr). Across the Central/Southern Aegean, Peloponnese, and Crete, Q25 trend slopes drop below +6.0 ft/yr and are statistically non-significant (p > 0.05).
This summer thermal structure highlights the dominating influence of the persistent Etesian northerly wind regime over the Aegean Sea, which maintains a thermally stable marine boundary layer in the central and south Aegean, while northern continental corridors experience unbuffered warming (Tyrlis and Lelieveld, 2013).
The autumn transitional season marks the progressive return of lower atmospheric freezing levels alongside an intensifying thermal contrast across the Hellenic subcontinent. Figure 14 and Figure 15 display the seasonal spatial climatology and non-parametric Sen's slope trend profiles for autumn Mean and Q25 ZDL levels. The autumn climatological Mean ZDL (Figure 14a) ranges from a regional low of approximately 7,500 ft over inland Western Macedonia (LGKA, LGKZ) to over 12,500 ft across the Southern Aegean and Crete (e.g., LGKP, LGKS, LGSA). The Q25 operational envelope (Figure 14b) descends into lower approach levels over Northern Greece (~ 5,900 ft to 6,600 ft), while remaining well elevated across southern insular corridors (>9,600 ft).
The non-parametric trend analysis reveals an extraordinary warming amplification in the lower tail of the distribution over Northern Greece. Specifically, the autumn Mean ZDL trends display mean upward slopes with a strong latitudinal gradient (Figure 15a). Northern and Northeastern continental corridors (LGAL, LGKV, LGTS, LGKZ) record robust, statistically significant upward displacement rates exceeding +28.0 to +32.0 ft/yr (p < 0.05). Conversely, southern maritime sites experience substantially smaller mean upward slopes (~ +15.0 to +17.0 ft/yr) that predominantly lack of statistical significance. In addition, the autumn Q25 metric (Figure 15b) demonstrates an intense warming signal across Northern Greece. The lower quartile ZDL over Thrace, Macedonia, and Thessaly (LGKV, LGAL, LGTS, LGKZ, LGKA, LGLR) shifts upward at exceptional rates ranging from +32.0 to +40.0 ft/yr (p < 0.05). In sharp contrast, across the Peloponnese, Central/Southern Aegean, and Crete, Q25 trends drop below +10.0 ft/yr and lose statistical significance (p > 0.05). This disproportionate elevation of the autumn Q25 threshold over Northern Greece indicates a significant seasonal delay in the onset of early-winter cold air outbreaks, effectively contracting the annual operational icing window over northern approach paths.
3.2.3. Monthly Trend Patterns
A focused examination of the winter months reveals a contrast between absolute thermal structure and long-term elevation trends. Specifically, January and February represent the coldest core of the year, with Mean ZDL heights dropping below 2,341 ft over northwestern continental Greece (LGKA) and extending up to 7,287 ft over the southeastern Aegean (LGKP) (Figure 16). December exhibits a relatively milder structure, with mean heights bounded between 3,022 ft (LGKA) and 8,379 ft (LGKP). All three months demonstrate a persistent, tight Northwest-to-Southeast spatial gradient reflecting continental northern cold air mass intrusions. Despite sharing similar spatial distributions, the long-term trend behaviour diverges significantly across the winter sequence. December and February exhibit rapid, statistically significant upward shifts in the freezing level, with Sen's slope rates ranging between +35 ft/yr at western Greece (LGRX, LGPZ) to +56 ft/yr at northern Greece (LGKV) in December and +37 (LGIO – western Greece) to +55 ft/yr (LGAL – northern Greece) in February and over +46 ft/yr across most southern and maritime stations (p < 0.05). In sharp contrast, January demonstrates warming stagnation. Sen's slope values remain near zero (-9 to +9 ft/yr), with no stations exhibiting statistically significant long-term trends. This suggests that although early and late winter experience strong warming, mid-winter temperatures remain aligned with historical baselines.
Analysing the 25th percentile (Q25) of the Zero Degree Level (Figure 17) provides insights into the behaviour of the coldest atmospheric conditions during the winter regime. January and February exhibit the most critical low-altitude freezing conditions of the year. The Q25 ZDL height drops as low as 345 ft in January and 694 ft in February over northwestern continental Greece (LGKA), indicating that cold air masses frequently depress the freezing level down to near-surface altitudes. Across all three winter months, a steep Northwest-to-Southeast gradient is maintained, with Q25 heights over the southeastern maritime sector reaching between ~5,750 ft and ~6,930 ft. December and February display upward trends in their Q25 metrics, with Sen's slope values reaching up to +66 ft/yr (p<0.05) in December (LGKV) and +56 ft/yr (p < 0.05)in February (LGTS). This suggests a substantial warming and elevation shift of the coldest tail of the ZDL distribution during early and late winter. However, in general the trends show low statistical significance. As analysed for the mean values January Q25 displays operational stagnation, with Sen's slope values bounded between -5 and +17 ft/yr and a total absence of statistically significant trends across the station network. This confirms that the mid-winter cold extremes have remained remarkably resilient to long-term shifting over the 1990–2024 study period.
The spring months transition exhibits a progressive elevation of the freezing layer (Figure 18). Mean ZDL heights undergo a substantial seasonal rise from March to May. Northwest-to-Southeast regional baselines expand from 3,277 ft (LGKA) to 8,323 ft (LGKP) in March, 4,806 ft (LGKA) to 10,038 ft (LGKP) in April, and ultimately reach pre-summer levels of 7223 ft (LGKA) to 12034 ft (LGKP) in May. The tight NW–SSE spatial gradient remains persistent throughout the season. April emerges as the core driver of spring warming, demonstrating the highest Sen's slope values ranging between +24 ft/yr and +39 ft/yr, with robust statistical significance (p < 0.05) across northwestern, western, and southwestern stations. March maintains a moderate upward trajectory (+11 to +30 ft/yr), with absence though of statistically significant trends. May exhibits a notable deceleration in trend magnitude, with Sen's slope rates dropping to +4 to +14 ft/yr. Although warming continues, the lower slope values indicate that late-spring freezing levels are shifting at a considerably slower annual pace compared to the rapid mid-spring adjustments observed in April.
The 25th percentile (Q25) analysis illustrates the spatial variability and long-term trends of the colder thermal regimes during the spring months (Figure 19). Across all three months, Q25 heights display a persistent Northwest-to-Southeast tilt, driven by continental cold-air mass intrusions from the north. The baseline heights experience a pronounced seasonal ascent. March Q25 ranges from a minimum of 1,489 ft in NW mainland Greece (LGKA) to 6,852 ft in the SE Aegean (LGKP). April freezing levels shift upward, spanning between 3,459 ft (LGKA) and 8,678 ft (LGKP) with statistical significance (p < 0.05) established across almost the entire domain, spanning western, central, southern mainland, and insular networks. May baseline values reach pre-summer thresholds, bounded between 5,968 ft (LGKA) and 10,925 ft (LGKP). April exhibits the most spatially coherent warming of the cold spectrum. Sen's slope values range from +11 ft/yr (LGKV) to +55 ft/yr (LGIR), with statistical significance (p < 0.05) established across almost the entire domain apart from the NE. March trend magnitudes cover a broader numerical spectrum +7 ft/yr (LGPL) to +64 ft/yr (LGAL), however with lack of statistical significance. May demonstrates a marked slowdown in warming velocity, with Sen's slope rates dropping to +3 to +20 ft/yr with absence of statistically significant trends.
The spatial and temporal patterns of the monthly Mean ZDL during summer reflect a sharp contrast between mid-summer warming and early-summer stability (Figure 20). Mean ZDL displays the characteristic Northwest-to-Southeast gradient across all summer months. June base elevations extend from 9,497 ft (LGKA) in NNW Greece to 14,372 ft (LGKP) in the SE Aegean. July peak summer heights are reached, bounded between 10,963 ft (LGKA) and 16,372 ft (LGKP). August Mean ZDL remains practically identical to July thresholds, ranging from 10,979 ft (LGKA) to 16,359 ft (LGKP). June shows almost complete absence of long-term trend significance (p >= 0.05) with the exception of 3 stations in the central south Aegean, and with Sen's slope values oscillating near zero (-17 to +4 ft/yr). July demonstrates strong, widespread upward shifts, with Sen's slope values between +32 and +42 ft/yr and statistically significant trends (p < 0.05) dominating the entire domain. August exhibits moderate positive trends (+16 to +36 ft/yr), fully statistically significant (p < 0.05).
The spatial distribution and temporal trends of the summer Q25 ZDL illustrate a distinct transition from early-summer thermal steadiness to pronounced mid-and-late summer elevation shifts Figure 21). June Q25 elevations span from a seasonal lower boundary of 8,332 ft (LGKA) in the Northwest to 13,353 ft (LGKP) in the Southeast and statistical significance mainly for the southern maritime stations. July represents the absolute annual peak for Q25 elevations, extending between 10,007 ft (LGKA) in NW Greece and 15,679 ft (LGKP) in the SE Aegean and complete statistical significance. August exhibits near-identical spatial baselines to July, ranging from 10,021 ft (LGKA) to 15,679 ft (LGKP). On the other hand the Sen’s slope analysis showed that June exhibits predominantly negative to neutral values (-26 to +8 ft/yr) with statistical significance for a few stations, reflecting stable early-summer atmospheric baselines over the 35-year study period. July marks the most severe warming trend across the lower ZDL spectrum, with Sen's slopes ranging between +15 and +54 ft/yr and statistically significant upward trends (p < 0.05) that dominate the entire Greek domain. August exhibits moderate positive slopes (+7 to +38 ft/yr), with complete statistically significant trends.
The spatial and temporal characteristics of the autumn ZDL depict a progressive seasonal lowering of the freezing level alongside an intensifying trend toward late-season warming (Figure 22). Mean ZDL preserves the spatial Northwest-to-Southeast tilt while undergoing steady thermal cooling across the season months. September base elevations remain high, spanning from 9,250 ft (LGKA) in NW Greece to 14,663 ft (LGKP) in the SE Aegean. October reflects moderate seasonal lowering, bounded between 7,771 ft and 12,515 ft. November marks the sharpest seasonal decrease, with Mean ZDL ranging from 5,406 ft in the NW to 10,465 ft in the SE. Based on the Sen’s Slope analysis September exhibits positive values between +11 and +28 ft/yr, though statistical significance (p < 0.05) is sparse and limited to isolated Northeastern station (LGAL). October displays moderate upward slopes (+14 to +24 ft/yr), with absence of statistically significant warming. Finally, November demonstrates the strongest thermal shift of the autumn season, with Sen's slopes reaching +18 to +44 ft/yr and widespread statistical significance (p < 0.05) that covers Western, Central, Northern Greece, and the Northern Aegean, signalling late-autumn atmospheric warming.
The Q25 ZDL captures the cold-tail dynamics and early-season cold-air intrusions across the Greek territory during autumn (Figure 23). It exhibits a strong Northwest-to-Southeast gradient, with freezing levels progressively shifting to lower altitudes as winter approaches. In particular, September baseline Q25 heights range from 8,119 ft in the NW to 13,843 ft in the SE. October seasonal lowering shifts Q25 bounds between 6,451 ft in the NW and 11,599 ft in the SE, while November marks a sharp vertical fall, with Q25 elevations dropping between 3,708 ft in the NW and 9,377 ft in the SE. The trend patterns for Sen's Slope and significance show moderate values in September with values ranging from +4 to +32 ft/yr, and statistical significance (p < 0.05) confined mainly to northern inland and northern Aegean stations. October slopes reach +4 to +42 ft/yr, with limited statistical significance. November displays the strongest cold-tail warming of the season, with Sen's slopes reaching up to +63 ft/yr. Statistically significant trends (p < 0.05) encompass almost the entire Greek domain, indicating a substantial reduction in the frequency or severity of early-winter cold air masses.
3.4. ZDL Height Frequency Distribution
The frequency distribution of the ZDL height across the ERA5 dataset (Figure 24) illustrates the vertical envelope and modal behaviour of the 0°C isotherm over the Greek territory. ZDL occurrences span broad atmospheric layers from surface level up to ~18,500 ft. The primary frequency core is concentrated between 10,000 ft and 14,000 ft, exceeding 500,000 values per bin and reflecting the dominant freezing level altitudes during extended summer and transitional seasons. The profile exhibits secondary peaks (e.g., around 7,000 ft and 16,000 ft), signifying the bimodal or multimodal nature of the regional climate driven by distinct winter cold-air masses and summer thermal peaks. Cold-tail occurrences (<5,000 ft) reflect winter cold-air outbreaks, whereas the sharp frequency drop-off above 16,000 ft establishes the upper climatological boundary of the freezing level over the Eastern Mediterranean, with values rarely exceeding 18,000 ft even during extreme summer heatwaves.
4. Discussion - Suggestions
The multi-decadal statistical evaluation of the Zero Degree Location (ZDL) over the Athens FIR reveals a highly non-linear, structurally complex, and seasonally contrasted climate signal. Rather than exhibiting a uniform annual warming trend, the mid-tropospheric thermal regime undergoes sharp spatial and temporal reconfigurations. The overall frequency distribution reveals ZDL over Greece operating within a wide vertical band (surface to ~18,500 ft), with the primary operational core concentrated between 10,000 ft and 14,000 ft (~3,000–4,250 m). The multimodal profile highlights the distinct seasonal transitions characterizing the Eastern Mediterranean climate.
4.1. Comparative Analysis of Mean and Q25 ZDL Dynamics
At the macro-scale, the annual aggregated metrics present a critical divergence between the shifting of the bulk environmental mean and the behaviour of the lower thermal boundaries (Q25). On an annual basis, the systematic increase in mean ZDL heights points toward sustained tropospheric warming, in full alignment with the mid-tropospheric amplification mechanisms over the Mediterranean basin documented in previous studies [1,50]. Conversely, the annual Q25 profile, representing the historical baseline of the coldest synoptic environments, exhibits a distinctly lower rate of long-term shifting. This structural pattern suggests that while the upper envelope of the 0°C isotherm systematically extends toward higher altitudes, the lower boundary associated with severe cold-air intrusions remains relatively bound, thereby broadening the overall operational envelope and seasonal dispersion of the freezing level.
When decomposing the annual signal into seasonal blocks, the thermodynamic forcing clarifies into distinct physical regimes, revealing that the transition seasons dominate the annual warming signal. Autumn represents the most volatile and aggressive non-stationary regime within the study area. Both the Mean and Q25 configurations display widespread, statistically significant upward trends (p < 0.05). The physical mechanism driving this uniform elevation is the multi-decadal expansion of the subtropical high-pressure belt and enhanced sea-surface temperature (SST) feedback loops. This leads to a systematic delay in the onset of autumn-like tropospheric cooling, effectively extending summer thermal characteristics deep into November. In stark contrast, the aggregated winter season acts as a zone of intense thermal contrast. While the seasonal mean drifts upward, the lower tail (Q25) resists long-term shifting. This decoupling highlights a high-variance synoptic setup where the region remains exposed to intense, episodic continental cold air masses that temporarily depress the ZDL, offsetting the underlying radiative warming signal. Spring exhibits moderate but steady upward trends, capturing a signature of radiative heating over the Balkan Peninsula. Summer profiles exhibit the highest absolute ZDL elevations, locking the 0°C isotherm into high-altitude levels and significantly broadening the vertical extent of the warm, unstable boundary layer.
The monthly breakdown exposes a sharp sub-seasonal oscillation during the winter cycle, heavily modulated by regional geography. December functions as a highly unstable transitional node. While the Mean exhibits significant warming, the Q25 profile experiences a marked expansion of interannual variance, characterized by high-magnitude Sen's slopes alongside limited statistical significance. This behaviour demonstrates that the early-winter lower thermal tail is highly volatile, fluctuating between southern warm intrusions and early-season cold air outbreaks. January uncovers a remarkable climatological feature: near-absolute stationarity. With 0 out of 38 stations exhibiting statistically significant trends in the Q25 profile and Sen's slopes collapsing close to a net-zero baseline (e.g., LGSA +0.02 ft/yr, LGKF +0.04 ft/yr), the core winter cold tail appears remarkably insulated from regional climate warming. This indicates that the geometric and thermal structure of the 0°C isotherm during peak cold events has remained practically unaltered over the 35-year study period. February executes a clear departure from January's stationarity, returning a robust, spatially homogeneous warming signal where 37 out of 38 stations exhibit statistically significant upward trends (p < 0.05) in the Mean ZDL, accompanied by tight, high-magnitude Sen's slopes (+41 to +55 ft/yr). This pattern diagnoses an acceleration in the retreat of winter conditions, effectively forcing February to transition toward early-spring thermal characteristics.
March serves as a key transitional bridge where spring warming begins to establish its spatial footprint. While the Mean ZDL demonstrates widespread, statistically significant upward trends across the majority of station networks, the Q25 cold tail retains a moderate degree of interannual variability, reflecting slow late-winter cold intrusions over the northern mainland. April marks the onset of a robust mid-tropospheric thermal reorganization. The 0°C isotherm exhibits a spatially coherent and statistically significant upward migration across both Mean and Q25 metrics, with Sen's slopes reflecting steady thermal build-up. This signal indicates that mid-spring cold outbreaks are becoming increasingly rare and shallower, allowing the freezing level to retreat smoothly toward upper flight levels. May further accelerates this seasonal transition, acting as a direct precursor to the summer regime. The month displays high-magnitude, statistically significant Sen's slopes across virtually the entire domain, effectively closing the spring window and elevating the baseline freezing level well into the upper operational flight envelope. Together, the spring trimester demonstrates a progressive, spatially uniform thermal elevation that systematically shifts the lower boundary of the freezing level prior to the onset of peak summer conditions.
June establishes the full consolidation of the summer thermal regime over the Eastern Mediterranean. The Mean ZDL demonstrates a sharp, spatially uniform elevation shift, accompanied by a widespread contraction of cold-tail variability in the Q25 profile. This reflects the effective suppress of low-tropospheric cold intrusions locking the 0°C isotherm into high atmospheric layers. July and August represent the absolute thermal peak of the annual cycle, displaying the highest baseline ZDL elevations across the entire domain (>15,000 ft Mean / >12,000 ft Q25). Both months exhibit robust, highly significant upward trends across virtually all station networks, with Sen's slopes maintaining high, stable magnitudes (+15 to +38 ft/yr). The persistent thermal forcing during this peak summer bimester lifts the freezing level well above standard regional operational flight levels, confining potential icing phenomena exclusively to convective cloud tops or deep convection events. Collectively, the summer trimester acts as a prolonged high-altitude thermal plateau, where long-term atmospheric warming operates with maximum spatial coherence and minimal interannual variance.
September presents an anomalous period of trend stagnation within the autumn cycle. Despite inheriting elevated ZDL baselines from late-summer conditions, its Sen's slope magnitudes remain remarkably mild (+4 to +32 ft/yr for Q25; +11 to +28 ft/yr for Mean), with statistical significance restricted almost exclusively to isolated northern inland stations. This indicates that early-autumn thermal structures have remained exceptionally stable over the 35-year study period, showing minimal sensitivity to broad regional warming. October acts as a progressive bridge, initiating the seasonal decline of the freezing level while displaying moderate, spatially non-uniform upward trends. The Mean ZDL reflects a steady transition toward autumn conditions, whereas the Q25 profile begins to show expanding interannual variance as early cold air masses occasionally penetrate the northern boundaries of the Greek peninsula. November emerges as the most dynamic month across the entire annual cycle, exhibiting a pronounced and unprecedented warming signal. While the Mean ZDL demonstrates high-magnitude upward shifts (up to +44 ft/yr), the Q25 profile experiences an even more drastic elevation surge, reaching Sen's slope values of up to +63 ft/yr with widespread statistical significance across virtually the entire domain. This disproportionate response in the cold tail diagnoses a fundamental structural shift in late-autumn synoptic regimes, characterized by a sharp reduction in the frequency, duration, or intensity of early-winter cold air outbreaks and an effective extension of summer-like thermal profiles deep into the late autumn.
The spatial distribution of these trends highlights a clear divide between maritime/island grids and continental or topographically enclosed sectors. Southern and island stations (e.g., LGRP - Rhodes, LGSA - Souda, LGKP - Karpathos) display cleaner, less noisy trends due to the stabilizing thermal inertia of the Mediterranean Sea. Northern and Central stations (LGAL - Alexandroupoli, LGLR - Larisa, LGBL - Volos) frequently display the highest absolute magnitudes in Sen's slopes, proving highly sensitive to continental thermal shifts. ): Enclosed basins, most notably Kastoria (LGKA) and secondarily Ioannina (LGIO), exhibit distinct local signatures. In February, while the rest of the country experiences a massive warming surge, LGKA maintains a highly suppressed Q25 slope (+11.46 ft/year) and misses formal significance. This provides empirical evidence of topographic cold air pooling (CAP); dense, cold air remains trapped within the Northwestern relief during stable synoptic setups, insulating the surface layers from the broader mid-tropospheric warming.
Overall, these findings highlight that climate-induced vertical shifts in the 0°C isotherm over Greece are not uniformly distributed throughout the year, but are primarily driven by accelerated warming during late autumn (November) and mid-summer.
4.2. Implications for Aviation Safety and In-Flight Icing Risk
The vertical structure and long-term shift of the 0°C isotherm have direct operational consequences for civil and military aviation safety, particularly regarding airframe structural icing. As the Mean and Q25 ZDL shift upward—most notably in late autumn—the altitude band where the atmospheric icing potential, driven by the presence of supercooled droplets and ice crystals, is displaced toward higher flight levels.
In addition, higher ZDLs in warmer boundary layers increase the total moisture-holding capacity of the atmosphere [51], elevating the potential for supercooled liquid water formation affecting the levels of icing potential formation [17,18,19]. When moist air masses are lifted over the Greek mountainous terrain or within convective clouds, larger amounts of supercooled droplets can form above the ZDL, leading to severe icing conditions. This is a point that requires further investigation for the Greek territory.
Furthermore, these vertical shifts carry critical operational impacts for Unmanned Aircraft Systems (UAS) operating within low-to-medium altitude envelopes (e.g., 3,000–10,000 ft). While an elevated ZDL clears the lowest atmospheric layers from icing hazards, it simultaneously displaces the primary icing window (0°C to -20°C) directly into the cruise altitudes frequently assigned to medium-altitude UAS. Given their strict payload, size, weight, and power constraints—which typically preclude active anti-icing systems—UAS face heightened vulnerability when transiting these shifted icing layers. Moreover, the increased vertical volatility of the ZDL during transitional months creates unpredictable hazards over complex terrain, where localized cloud lifting combined with higher supercooled liquid water content can cause rapid structural ice accretion on propellers and airframes, similarly as in the case of manned aircraft..
The rapid warming in November implies that historical seasonal climatologies used by flight planners are becoming obsolete. Assumptions regarding early-winter freezing levels based on 20th-century data underestimate current ZDL elevations, leading to sub-optimal route optimization and inaccurate fuel-burn estimations for anti-icing equipment usage.
Clearly, in order to robustly evaluate and quantify the long-term trends in icing potential, further research must incorporate high-resolution vertical profiles of ambient humidity and Liquid Water Content (LWC) within these specific levels.
4.3. ERA5 Data Limitations and Confidence Assessment
While ERA5 reanalysis provides a high-resolution, spatially continuous 35-year atmospheric record, certain inherent limitations must be accounted for when interpreting Zero Degree Level (ZDL) dynamics and in-flight icing risks. ERA5 operates on a horizontal grid resolution of approximately 31 km (~0.25°) and discrete levels above ground. In regions with complex topography such as the Greek peninsula with its steep mountain ranges (e.g., Pindus) and intricate coastline, the smoothed model terrain can blur smaller scale gradients. Localized mountain-wave action, thermal inversions, and microscale orographic lifting may cause local-scale ZDL fluctuations that are under-represented by the grid-averaged reanalysis output.
ERA5 relies on parameterization schemes for sub-grid scale convection and boundary-layer physics. During intense convective episodes or severe mesoscale events (e.g., cold-air damming), the modelled temperature profile near the freezing isotherm may exhibit vertical smoothing. This smoothing can introduce slight height uncertainties in the exact altitude of the 0°C surface, particularly during rapid cold-front passages.
The quality of reanalysis depends on the spatial and temporal density of assimilated observational data (radiosondes, aircraft reports, satellite soundings). Although assimilation techniques are consistent, satellite observation quality and radiosondes availability have evolved over the 1990–2024 period, potentially introducing minor non-climatic inhomogeneities in lower-tropospheric trends [33,52].
Despite these dependences, the high density of observational data across Europe ensures very high reliability for regional-scale free-tropospheric temperature structures. The long-term trends (Mean, Q25) reflect robust, synoptic-scale signals rather than modelling artifacts.
5. Conclusions
This study conducted a comprehensive 35-year climatological analysis of the Zero Degree Level (ZDL) over Greece for the period 1990–2024, analysing mean and lower-tail statistical boundaries (Q25 percentile) across 38 representative airport locations using ERA5 reanalysis data. The spatial variability, temporal trends, frequency distributions, and Sen's slope statistics were investigated across all stations.
The trend analysis revealed that on an annual basis, the 0°C isotherm exhibits a widespread and statistically significant upward shift across the entire Greek airspace, operating within a primary core band of 10,000–14,000 ft. Long-term warming is highly asymmetric across the seasonal cycle. November exhibits the most intense and geographically widespread upward shift of the freezing level across the entire annual cycle, with Sen's slopes reaching up to +44 ft/yr for Mean ZDL and +63 ft/yr for Q25 ZDL (p < 0.05). This shift indicates a significant weakening of the frequency and intensity of early-winter cold air masses. Conversely, September represents a period of trend stagnation (+4 to +32 ft/yr for Q25), with minimal statistical significance, demonstrating that regional warming is expressed primarily as an extension of late-summer thermal profiles. The winter trimester demonstrates distinct intra-seasonal contrasts with December operating as a volatile transitional node with expanded interannual variance, January revealing near-absolute climatological stationarity in its Q25 cold tail and proving that core winter cold extremes remain insulated from background regional warming. February breaks sharply from January, returning a spatially homogeneous warming signal across 37 out of 38 stations diagnosing an accelerated evacuation of winter thermal regimes toward early-spring conditions. June, July, and August establish a prolonged high-altitude thermal plateau, featuring the highest absolute freezing level baselines (>15,000 ft Mean / >12,000 ft Q25) alongside robust, spatially coherent upward trends (+15 to +38 ft/yr). Warm air masses intrusion and general heat-up of the atmospheric column during these months contract cold-tail variability and locks the 0°C isotherm into upper atmospheric layers.
Across nearly all metrics, a persistent Northwest-to-Southeast elevation gradient is observed. Statistically significant warming trends are primarily anchored across Northern, Central, and Western Greece, whereas southern island stations (e.g., Crete, Dodecanese) display more muted and localized trend significance.
The systematic upward migration of the Mean and lower thermal tail (Q25) directly reshapes the in-flight icing threat window for aviation operations. Furthermore, increased atmospheric moisture capacity above warmer boundary layers elevates the potential for severe supercooled liquid water accretion in convective and orographic lift conditions.
These findings may be of significant important for use by aviation authorities in flight management operations for manned as well as unmanned aircraft flights. Updating operational flight planning models, dynamic icing prediction algorithms, and atmospheric monitoring networks is recommended to maintain optimal safety and navigation efficiency in regional airspace.
Funding
This research received no external funding.
Data Availability Statement
The ERA5 reanalysis data used in this study are openly available from the Copernicus Climate Change Service (C3S) Climate Data Store (CDS) (Accessed on 25-OCT-2025).
References
- IPCC. Climate Change 2023: Synthesis Report. Contribution of Working Groups I, II and III to the Sixth Assessment Report of the Intergovernmental Panel on Climate Change; Lee, H., Romero, J., Eds.; IPCC: Geneva, Switzerland, 2023; pp. 1–184. [Google Scholar] [CrossRef]
- Diaz, H.F.; Bradley, R.S. Temperature variations during the last century at high elevation sites. Clim. Change 1997, 36, 253–279. [Google Scholar] [CrossRef]
- Thorne, P.W.; Lanzante, J.R.; Peterson, T.C.; Seidel, D.J.; Shine, K.P. Tropospheric temperature trends: history of an ongoing controversy. WIREs Clim. Change 2011, 2, 66–88. [Google Scholar] [CrossRef]
- Ning, L.; Bradley, R.S.; Diaz, H.F.; Hardy, D.R.; Xu, C. Atmospheric Freezing Level Height Changes. Int. J. Climatol. 2025, 45, e70133. [Google Scholar] [CrossRef]
- Pepin, N.; Bradley, R. S.; Diaz, H. F.; Baraer, M.; Caceres, E. B.; Forsythe, N.; Yang, D. Q. Mountain Research Initiative EDW Working Group. Elevation-dependent warming in mountain regions of the world. Nat. Clim. Change 2015, 5, 424–430. [Google Scholar] [CrossRef]
- Ceppi, P.; Zappa, G.; Shepherd, T.G.; Gregory, J.M. Fast and Slow Components of the Extratropical Atmospheric Circulation Response to CO2 Forcing. J. Clim. 2018, 31, 1091–1105. [Google Scholar] [CrossRef]
- Politovich, M.K. Aircraft icing caused by large supercooled droplets. J. Appl. Meteorol. 1989, 28, 856–868. [Google Scholar] [CrossRef]
- Cao, Y.; Tan, W.; Wu, Z. Aircraft icing: An ongoing threat to aviation safety. Aerosp. Sci. Technol. 2018, 75, 353–385. [Google Scholar] [CrossRef]
- Cober, S.G.; Isaac, G.A.; Strapp, J.W. Characterizations of aircraft icing environments that include supercooled large drops. J. Appl. Meteorol. 2001, 40, 1984–2002. [Google Scholar] [CrossRef]
- Rasmussen, R.M.; Politovich, M.; Marwitz, J.; Sand, W.; McGinley, J.; Smart, J.; Pielke, R.; Rutledge, S.; Wesley, D.; Stossmeister, G.; et al. Winter icing and storms project (WISP). Bull. Am. Meteorol. Soc. 1992, 73, 951–976. Available online: https://api.semanticscholar.org/CorpusID:124005383. [CrossRef]
- Gultepe, I.; Sharman, R.; Williams, P. D.; Zhou, B.; Ellrod, G.; Minnis, P.; Trier, S.; Griffin, S.; Yum, S. S.; Gharabaghi, B.; Feltz, W.; Temimi, M.; Pu, Z.; Storer, L. N.; Kneringer, P.; Weston, M. J.; Chuang, H.-Y.; Thobois, L.; Dimri, A. P.; Dietz, S. J.; França, G. B.; Almeida, M. V.; Neto, F. L. A. A review of high impact weather for aviation meteorology. Pure Appl. Geophys. 2019, 176, 1869–1921. [Google Scholar] [CrossRef]
- Thomas, S.K.; Cassoni, R.P.; MacArthur, C.D. Aircraft anti-icing and de-icing techniques and modeling. J. Aircr. 1996, 33, 841–854. [Google Scholar] [CrossRef]
- Marwitz, J.; Politovich, M.; Bernstein, B.; Ralph, F.; Neiman, P.; Ashenden, R.; Bresch, J. Meteorological Conditions Associated with the ATR72 Aircraft Accident near Roselawn, Indiana, on 31 October 1994. Bull. Am. Meteorol. Soc. 1997, 78, 41–52. [Google Scholar] [CrossRef]
- Rasmussen, R.; Dixon, M.; Hage, F.; Cole, J.; Wade, C.; Tuttle, J.; McGettigan, S.; Carty, T.; Stevenson, L.; Fellner, W.; et al. Weather support to deicing decision making (WSDDM): A winter weather nowcasting system. Bull. Am. Meteorol. Soc. 2001, 82, 579–596. [Google Scholar] [CrossRef]
- Jeck, R.K. 1998. Representative Icing Envelopes Based on FAA Icing Data Databases; Report No. DOT/FAA/AR-98/18. Atlantic City, NJ, USA. [Google Scholar]
- Bernstein, B.C.; McDonough, F.; Politovich, M.K.; Brown, B.G.; Ratvasky, T.P.; Miller, D.R.; Wolff, C.A.; Cunning, G. Current icing potential (CIP): Algorithm description and comparison with aircraft observations. J. Appl. Meteorol. 2005, 44, 969–986. [Google Scholar] [CrossRef]
- Korolev, A.; McFarquhar, G.; Field, P.R.; Franklin, C.; Lawson, P.; Wang, Z.; Williams, E.; Krämer, M.; Russell, L.M.; Strapp, J.W.; et al. Mixed-Phase Clouds: Progress and Challenges. Meteorol. Monogr. 2017, 58, 5.1–5.50. [Google Scholar] [CrossRef]
- Zhang, W.; Lv, T.; Gao, S.; Zhang, C.; Zhang, H.; Hu, M.; Yang, T. Climate change and human activities amplify aircraft icing risks in China: A 13-year nationwide analysis using first released pilot reports. J. Environ. Sci. 2026, 169, 175–183. [Google Scholar] [CrossRef]
- EASA. EN-ICCA. European Union Aviation Safety Agency (EASA)— Report on the State of Science and Knowledge on Atmospheric Icing in a Climate Change Context; European Union Aviation Safety Agency, 18 August 2026.
- Coffel, E.D.; Thompson, T.R.; Horton, R.M. The impacts of rising temperatures on aircraft takeoff performance. Clim. Change 2017, 144, 381–388. [Google Scholar] [CrossRef]
- Gratton, G.B.; Williams, P.D.; Padhra, A.; Rapsomanikis, S. Reviewing the impacts of climate change on air transport operations. Aeronaut. J. 2022, 126, 209–221. [Google Scholar] [CrossRef]
- Gratton, G.B.; Padhra, A.; Rapsomanikis, S.; Williams, P.D. The impacts of climate change on Greek airports. Clim. Change 2020, 160, 219–231. [Google Scholar] [CrossRef]
- Schär, C.; Frei, C.; Lüthi, D.; Davies, H. Surrogate climate-change scenarios for regional climate models. Geophys. Res. Lett. 1996, 23, 669–672. [Google Scholar] [CrossRef]
- Piticar, A.; Tudor, A. Increase in atmospheric freezing level height in Romania over the 1980–2024 period. Acta Geophys. 2026, 74, 147. [Google Scholar] [CrossRef]
- Maheras, P.; Flocas, H.A.; Patrikas, I.; Anagnostopoulou, C. A 40-year objective climatology of surface cyclones in the Mediterranean region: Spatial and temporal distribution. Int. J. Climatol. 2001, 21, 109–130. [Google Scholar] [CrossRef]
- Lionello, P.; Bhend, J.; Buzzi, A.; Della-Marta, P.M.; Krichak, S.O.; Jansà, A.; Maheras, P.; Sanna, A.; Trigo, I.F.; Trigo, R. Chapter 6 Cyclones in the Mediterranean region: Climatology and effects on the environment. In Developments in Earth and Environmental Sciences; Lionello, P., Malanotte-Rizzoli, P., Boscolo, R., Eds.; Elsevier: Amsterdam, Netherlands, 2006; Volume 4, pp. 325–372. [Google Scholar] [CrossRef]
- Tyrlis, E.; Lelieveld, J. Climatology and dynamics of the Summer Etesian winds over the Eastern Mediterranean. J. Atmos. Sci. 2013, 70, 3374–3396. [Google Scholar] [CrossRef]
- Xoplaki, E.; González-Rouco, J.F.; Luterbacher, J.; Wanner, H. Wet season Mediterranean precipitation variability: Influence of large-scale dynamics and trends. Clim. Dyn. 2004, 23, 63–78. [Google Scholar] [CrossRef]
- Anagnostopoulou, C.; Tolika, K.; Flocas, H.; Maheras, P. Cyclones in the Mediterranean region: Present and future climate scenarios derived from a general circulation model (HadAM3P). Adv. Geosci. 2006, 7, 9–14. [Google Scholar] [CrossRef]
- Feidas, H.; Makrogiannis, T.; Bora-Senta, E. Trend analysis of air temperature time series in Greece and their relationship with circulation using surface and satellite data: 1955–2001. Theor. Appl. Climatol. 2004, 79, 185–208. [Google Scholar] [CrossRef]
- Kotroni, V.; Bezes, A.; Dafis, S.; Founda, D.; Galanaki, E.; Giannaros, C.; Giannaros, T.; Karagiannidis, A.; Koletsis, I.; Kyros, G.; Lagouvardos, K.; Papagiannaki, K.; Papavasileiou, G. Long-Term Statistical Analysis of Severe Weather and Climate Events in Greece. Atmosphere 2025, 16, 105. [Google Scholar] [CrossRef]
- Louka, P.; Samos, I.; Gofa, F. Forecasting in-flight icing over Greece: Insights from a low-pressure system case study. Atmosphere 2024, 15, 990. [Google Scholar] [CrossRef]
- Hersbach, H.; Bell, B.; Berrisford, P.; Hirahara, S.; Horányi, A.; Muñoz-Sabater, J.; Nicolas, J.; Peubey, C.; Radu, R.; Schepers, D.; et al. The ERA5 global reanalysis. Q. J. R. Meteorol. Soc. 2020, 146, 1999–2049. [Google Scholar] [CrossRef]
- Hersbach, H.; Bell, B.; Berrisford, P.; Biavati, G.; Horányi, A.; Muñoz Sabater, J.; Nicolas, J.; Peubey, C.; Radu, R.; Rozum, I.; Schepers, D.; Simmons, A.; Soci, C.; Dee, D.; Thépaut, J.-N. ERA5 hourly data on single levels from 1940 to present. Copernicus Climate Change Service (C3S) Climate Data Store (CDS). Accessed on. 2023. (accessed on 25-OCT-2025). [CrossRef]
- Dutra, E.; Muñoz Sabater, J.; Boussetta, S.; Komori, T.; Hirahara, S.; Balsamo, G. Environmental lapse rate for high-resolution land surface downscaling: An application to ERA5. Earth Space Sci. 2020, 7, e2019EA000984. [Google Scholar] [CrossRef]
- Schauwecker, S.; Palma, G.; MacDonell, S.; Ayala, Á.; Viale, M. The Snowline and 0°C Isotherm Altitudes During Precipitation Events in the Dry Subtropical Chilean Andes as Seen by Citizen Science, Surface Stations, and ERA5 Reanalysis Data. Front. Earth Sci. 2022, 10, 875795. [Google Scholar] [CrossRef]
- García-Lee, N.; Bravo, C.; González-Reyes, Á.; Mardones, P. Spatial and temporal variability of the freezing level in Patagonia's atmosphere. Weather Clim. Dynam. 2024, 5, 1137–1151. [Google Scholar] [CrossRef]
- Velikou, K.; Lazoglou, G.; Tolika, K.; Anagnostopoulou, C. Reliability of the ERA5 in Replicating Mean and Extreme Temperatures across Europe. Water 2022, 14, 543. [Google Scholar] [CrossRef]
- Hassan, R.M.; Salah, Z.; Karacostas, T.; Katragkou, E. Assessment of reanalysis datasets against radiosonde observation over the Eastern Mediterranean region. Acta Geophys. 2023, 71, 2989–3005. [Google Scholar] [CrossRef]
- Kotsias, G.; Lolis, C.J. Air Temperature Extremes in the Mediterranean Region (1940–2024): Synoptic Patterns and Trends. Atmosphere 2025, 16, 852. [Google Scholar] [CrossRef]
- Lolis, C.J.; Kotsias, G.; Farmakidis, D. A 40-year climatology of air temperature extremes in the southern Balkans based on the ERA5 database. Theor. Appl. Climatol. 2022, 149, 355–377. [Google Scholar] [CrossRef]
- Mann, H.B. Nonparametric tests against trend. Econometrica 1945, 13, 245–259. [Google Scholar] [CrossRef]
- Kendall, M.G. Rank Correlation Methods, 4th ed.; Charles Griffin: London, UK, 1975. [Google Scholar]
- Sen, P.K. Estimates of the regression coefficient based on Kendall's tau. J. Am. Stat. Assoc. 1968, 63, 1379–1389. [Google Scholar] [CrossRef]
- Collaud Coen, M.; Andrews, E.; Bigi, A.; Martucci, G.; Romanens, G.; Vogt, F.P.A.; Vuilleumier, L. Effects of the prewhitening method, the time granularity, and the time segmentation on the Mann–Kendall trend detection and the associated Sen's slope. Atmos. Meas. Tech. 2020, 13, 6945–6964. [Google Scholar] [CrossRef]
- Gocic, M.; Trajkovic, S. Analysis of changes in meteorological variables using Mann-Kendall and Sen's slope estimator statistical tests in Serbia. Glob. Planet. Change 2013, 100, 172–182. [Google Scholar] [CrossRef]
- Kostopoulou, E.; Jones, P.D. Comprehensive analysis of the climate variability in the eastern Mediterranean. Part I: Map-pattern classification. Int. J. Climatol. 2007, 27, 1189–1214. [Google Scholar] [CrossRef]
- Kostopoulou, E.; Jones, P.D. Comprehensive analysis of the climate variability in the eastern Mediterranean. Part II: Relationships between atmospheric circulation patterns and surface climatic elements. Int. J. Climatol. 2007, 27, 1351–1371. [Google Scholar] [CrossRef]
- Flocas, H.A.; Simmonds, I.; Kouroutzoglou, J.; Keay, K.; Hatzaki, M.; Bricolas, V.; Asimakopoulos, D.N. On the dynamic and thermodynamic characteristics of Mediterranean cyclones and their trends. Theor. Appl. Climatol. 2010, 101, 373–391. [Google Scholar] [CrossRef]
- IPCC. Climate Change 2021: The Physical Science Basis. Contribution of Working Group I to the Sixth Assessment Report of the Intergovernmental Panel on Climate Change; Masson-Delmotte, V., Zhai, P., Pirani, A., Connors, S.L., Péan, C., Berger, S., Caud, N., Chen, Y., Goldfarb, L., Gomis, M.I., et al., Eds.; Cambridge University Press: Cambridge, UK and New York, NY, USA, 2021; pp. 1–2391. [Google Scholar] [CrossRef]
- Rogers, R.R.; Yau, M.K. A Short Course in Cloud Physics, 3rd ed.; Butterworth-Heinemann: Oxford, UK, 1989. [Google Scholar]
- Dee, D.P.; Uppala, S.M.; Simmons, A.J.; Berrisford, P.; Poli, P.; Kobayashi, S.; Andrae, U.; Balmaseda, M.A.; Balsamo, G.; Bauer, P.; Bechtold, P.; Beljaars, A. C. M.; van de Berg, L.; Bidlot, J.; Bormann, N.; Delsol, C.; Dragani, R.; Fuentes, M.; Geer, A. J.; Haimberger, L.; Healy, S. B.; Hersbach, H.; Hólm, E. V.; Isaksen, L.; Kållberg, P.; Köhler, M.; Matricardi, M.; McNally, A. P.; Monge-Sanz, B. M.; Morcrette, J.-J.; Park, B.-K.; Peubey, C.; de Rosnay, P.; Tavolato, C.; Thépaut, J.-N.; Vitart, F. The ERA-Interim reanalysis: Configuration and performance of the data assimilation system. Q. J. R. Meteorol. Soc. 2011, 137, 553–597. [Google Scholar] [CrossRef]
Figure 1.
Spatial distribution of the 38 examined Greek aerodromes over the ERA5 reanalysis domain, superimposed on the model’s surface orography {m). Airports are labeled by their official ICAO code. Red markers represent the nearest ERA5 grid points corresponding to each airport site.
Figure 1.
Spatial distribution of the 38 examined Greek aerodromes over the ERA5 reanalysis domain, superimposed on the model’s surface orography {m). Airports are labeled by their official ICAO code. Red markers represent the nearest ERA5 grid points corresponding to each airport site.
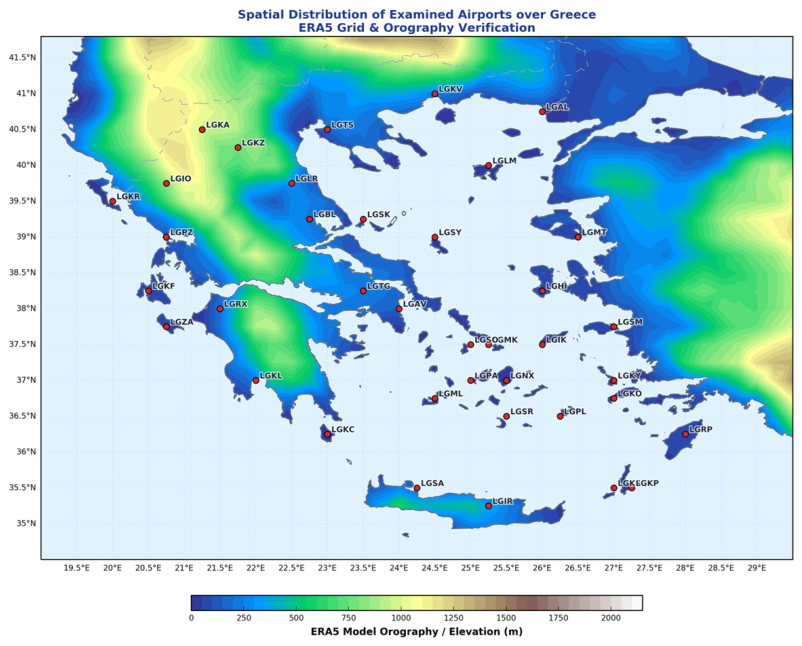
Figure 2.
Variation of ZDL in the period 1990-2024 across the study domain for different timeframes (a) Annually and seasonally; (b) Monthly. The limits of the boxes indicate the interquartile range (25th to 75th percentiles), the horizontal line within each box denotes the median (50th percentile). The upper and lower whiskers represent the maximum and minimum values, respectively.
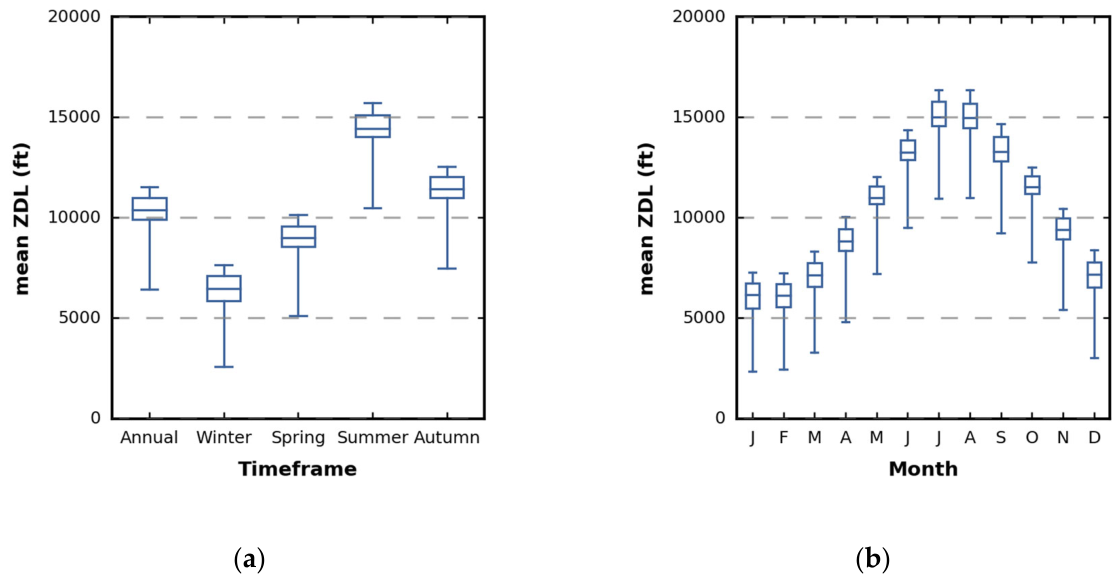
Figure 3.
Same as Figure 2 but for Q25 values.
Figure 3.
Same as Figure 2 but for Q25 values.
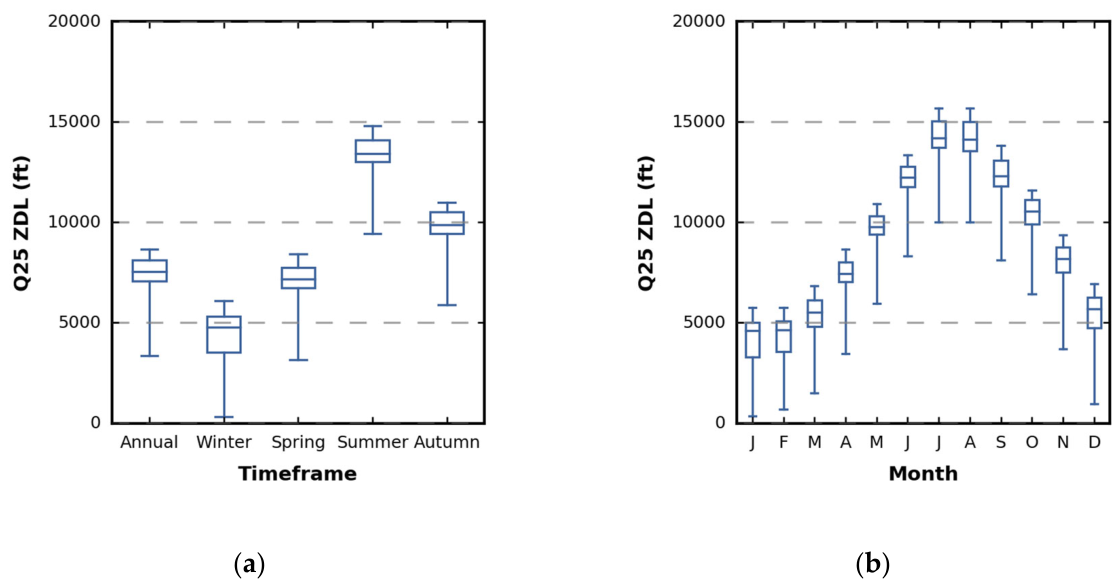
Figure 4.
Monthly distributions of Q25 ZDL across four geographical domains of Greece: (a) North, (b) Central, (c) South Greece and Aegean Islands and (d) West Greece. Box plots denote the interquartile range (25th to 75th percentiles), internal horizontal lines indicate median values, and whiskers encompass the full range of Q25 ZDL.
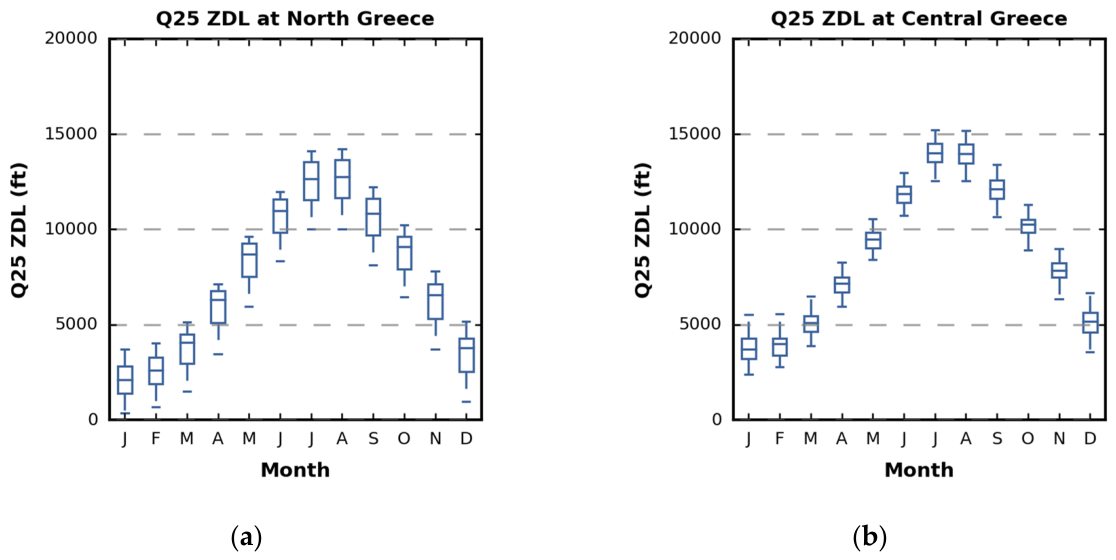
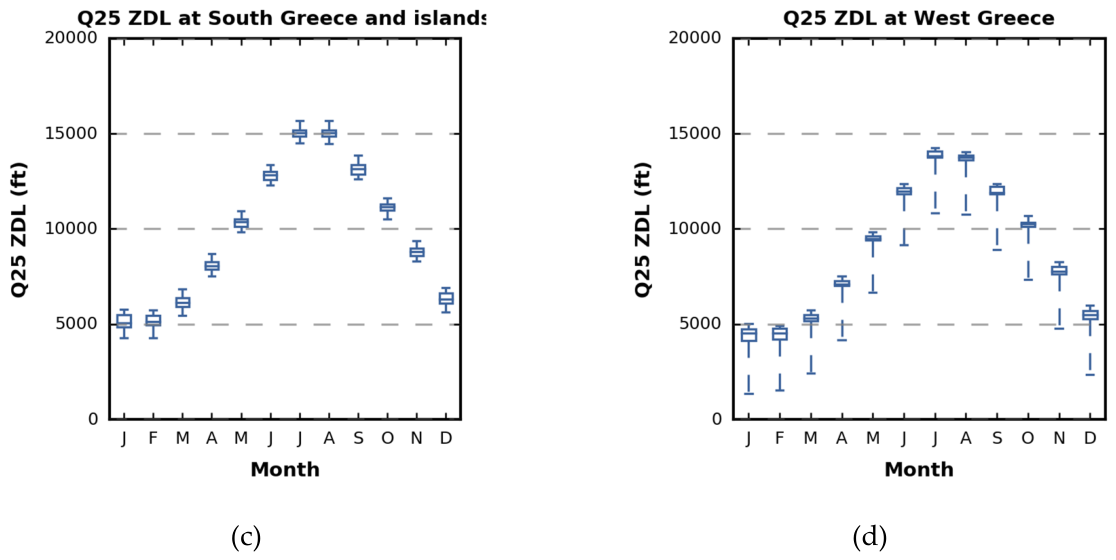
Figure 5.
Inter-annual variability of Mean ZDL (left column, blue) and Q25 cold-tail ZDL (right column, green) across four Greek aerodromes representing the different regions during 1990–2024: (a, b) Alexandroupolis (LGAL) in Northern Greece; (c, d) Athens (LGAV) in East-Central Greece; (e, f) Ioannina (LGIO) in Western Greece; and (g, h) Rhodes (LGRP) in South Greece and the Aegean Sea. Annotations in each subplot display the multi-year baseline metric value, the Sen’s Slope trend magnitude (ft/yr), and the Mann-Kendall test statistic with corresponding significance level (p < 0.05).
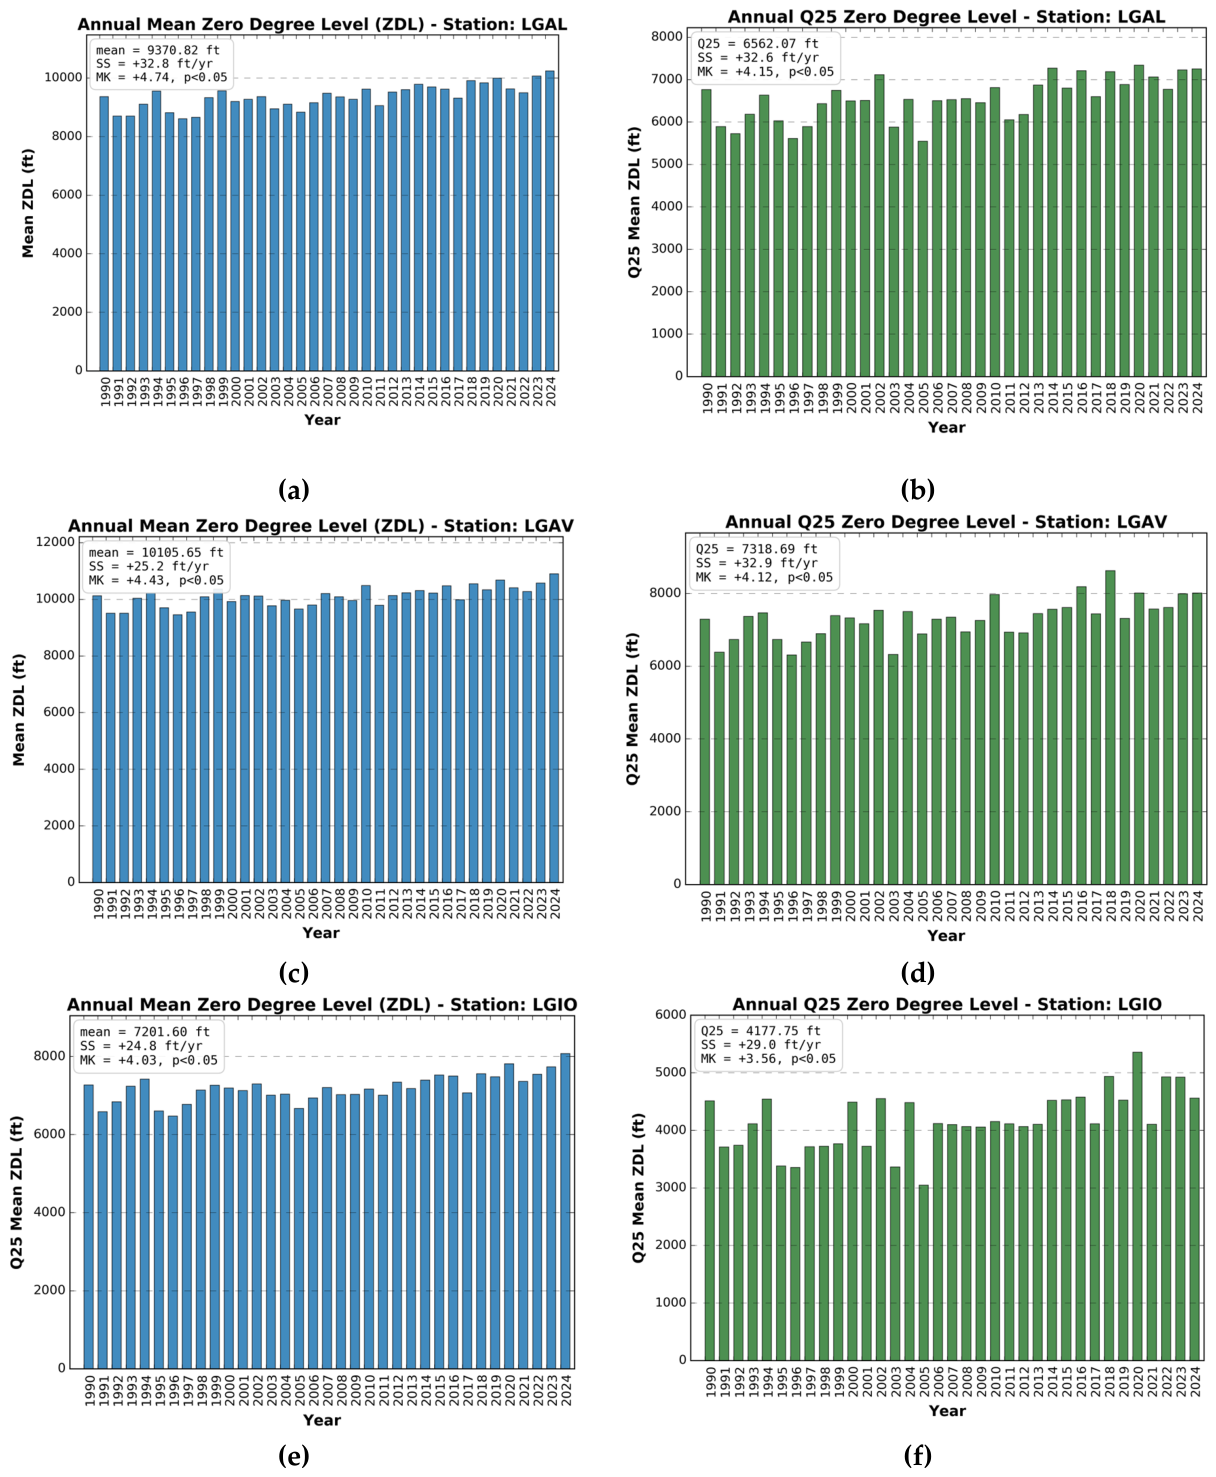
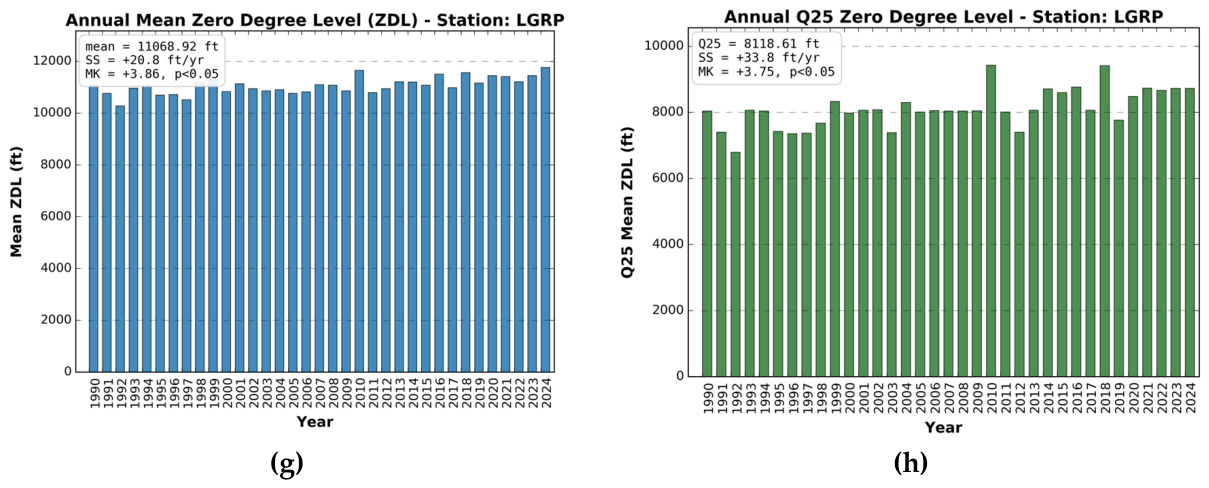
Figure 6.
Spatial distribution of the Zero-Degree Level (ZDL) across the 38 airport stations (1990–2024): (a) Annual Mean ZDL (ft); (b) Annual 25th percentile (Q25) ZDL (ft). Coloured circles represent station-specific values, while the background contours illustrate the ERA5 model surface orography. Statistical significance (p < 0.05) is denoted with the larger circles, while non-significant trends are indicated by the smaller circles.
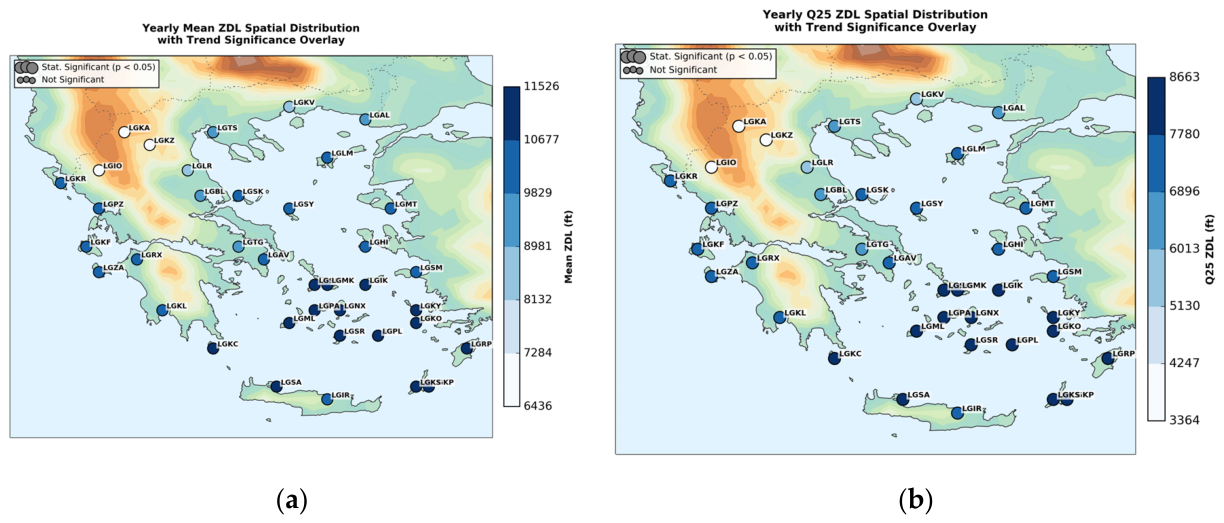
Figure 7.
Spatial distribution of Sen's slope trends (ft/yr) for: (a) Annual Mean, and (b) Annual Q25 at each airport. Coloured circles represent station-specific values, while the background contours illustrate the ERA5 model surface orography. Statistical significance (p < 0.05) is denoted with the larger circles.
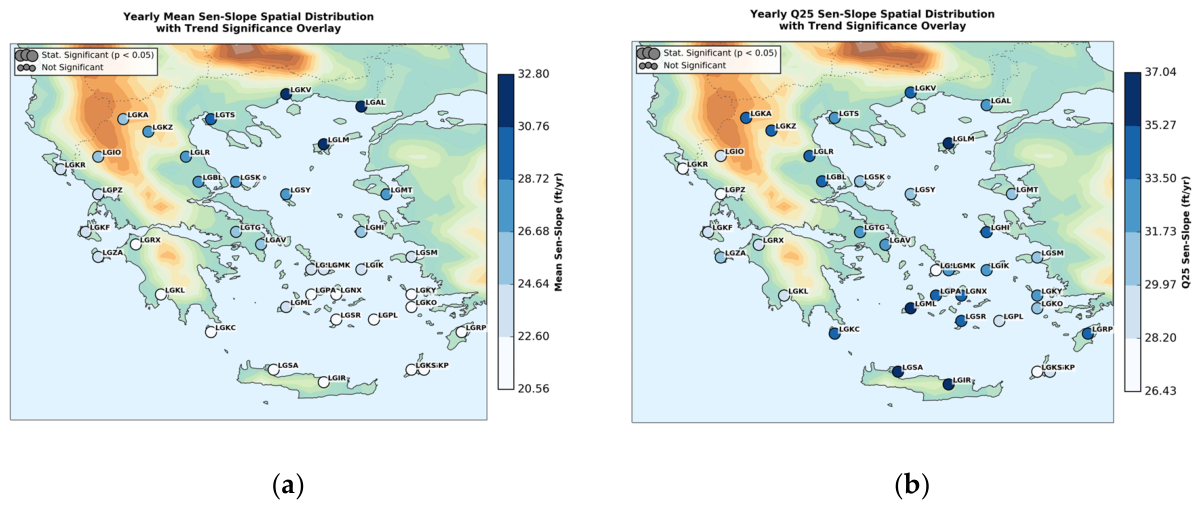
Figure 8.
Spatial distribution of the winter ZDL across the 38 airport stations (1990–2024): (a) Mean, and (b) Q25. Coloured circles represent station-specific values, while the background contours illustrate the ERA5 model surface orography. Statistical significance (p < 0.05) is denoted with the larger circles, while non-significant trends are indicated by the smaller circles.
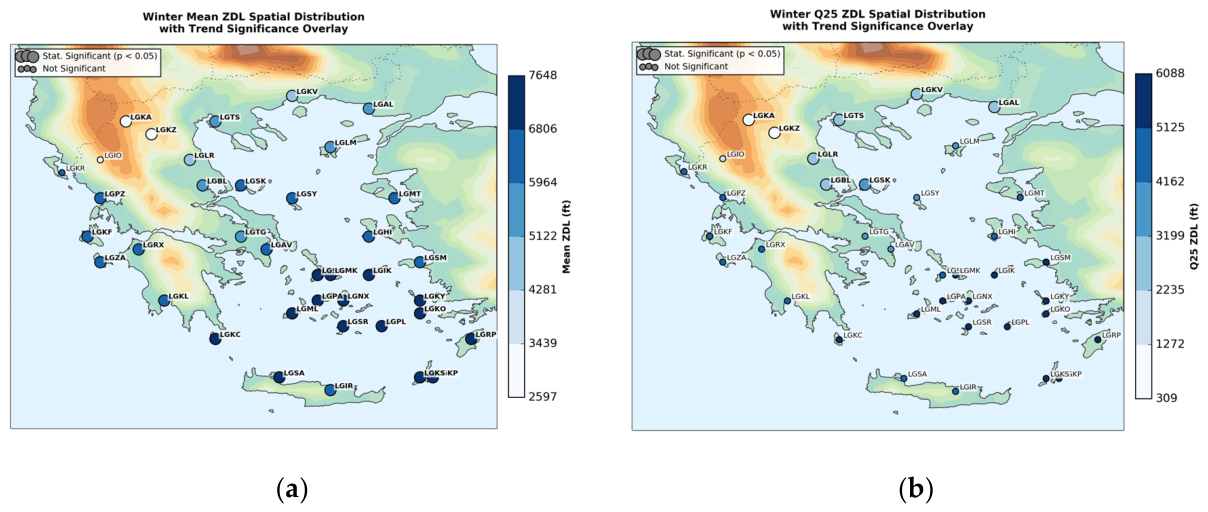
Figure 9.
Spatial distribution of Winter Sen's slope trends (ft/yr) for: (a) Mean, and (b) Q25 at each airport. Coloured circles represent station-specific values, while the background contours illustrate the ERA5 model surface orography. Statistical significance (p < 0.05) is denoted with the larger circles.
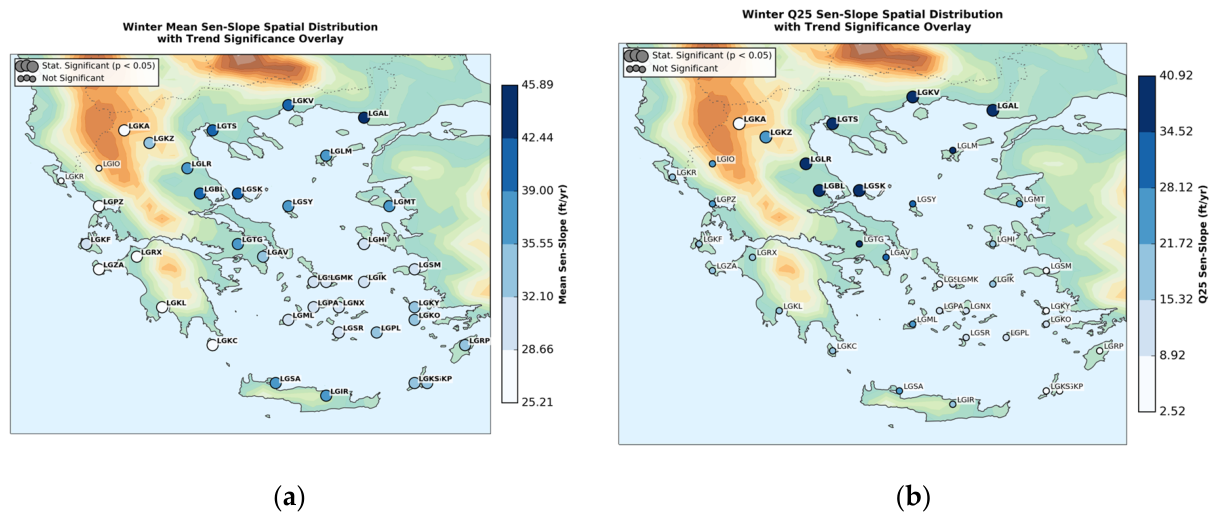
Figure 10.
Spatial distribution of the spring ZDL across the 38 airport stations (1990–2024): (a) Mean, and (b) Q25. Coloured circles represent station-specific values, while the background contours illustrate the ERA5 model surface orography. Statistical significance (p < 0.05) is denoted with the larger circles, while non-significant trends are indicated by the smaller circles.
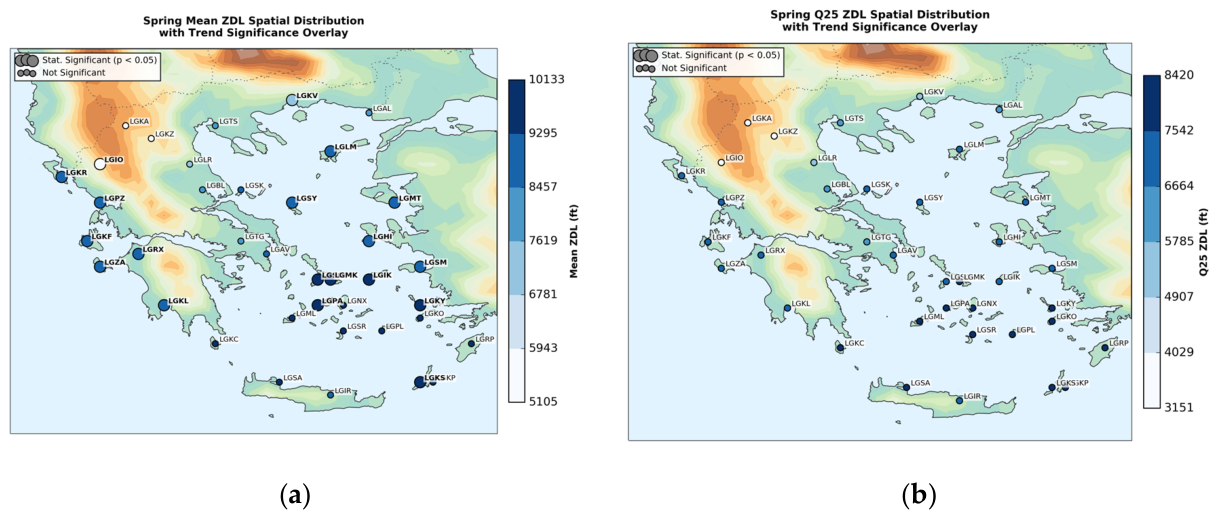
Figure 11.
Spatial distribution of Spring Sen's slope trends (ft/yr) for: (a) Mean, and (b) Q25 at each airport. Coloured circles represent station-specific values, while the background contours illustrate the ERA5 model surface orography. Statistical significance (p < 0.05) is denoted with the larger circles..
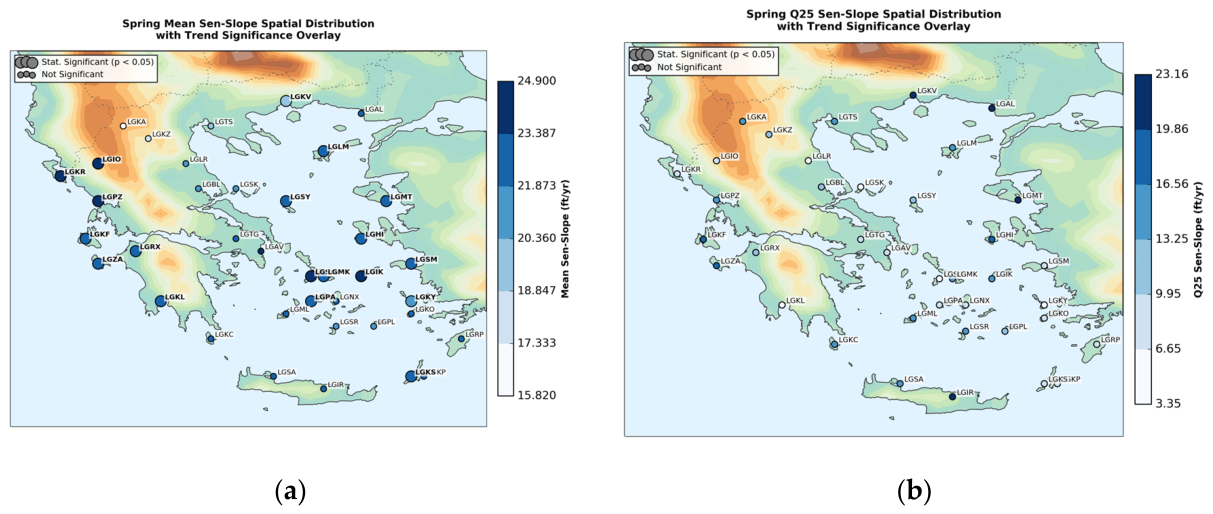
Figure 12.
Spatial distribution of the summer ZDL across the 38 airport stations (1990–2024): (a) Mean, and (b) Q25. Coloured circles represent station-specific values, while the background contours illustrate the ERA5 model surface orography. Statistical significance (p < 0.05) is denoted with the larger circles, while non-significant trends are indicated by the smaller circles.
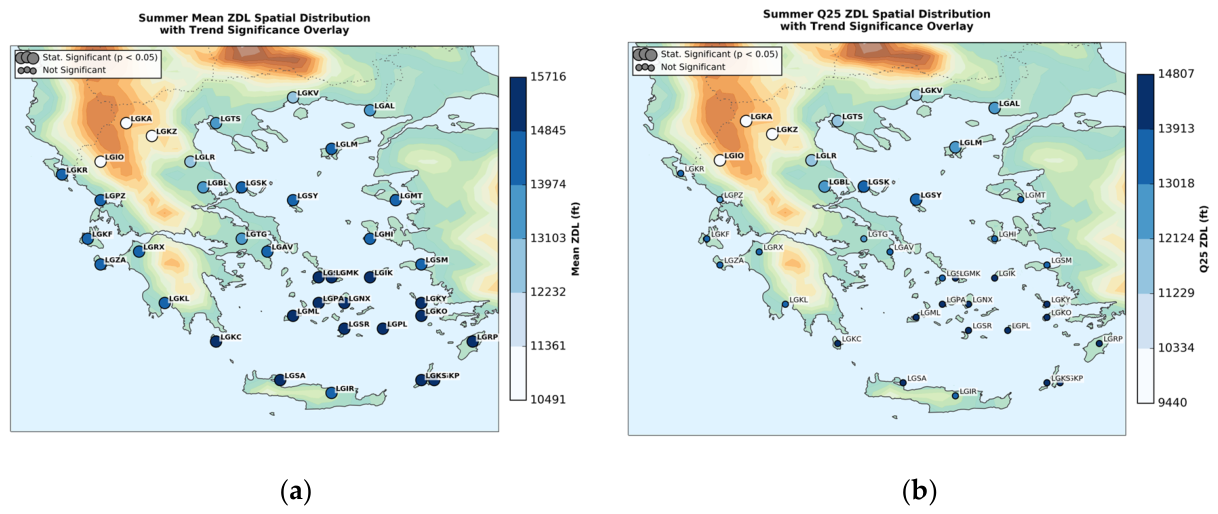
Figure 13.
Spatial distribution of Summer Sen's slope trends (ft/yr) for: (a) Mean, and (b) Q25 at each airport. Coloured circles represent station-specific values, while the background contours il-lustrate the ERA5 model surface orography. Statistical significance (p < 0.05) is denoted with the larger circles.
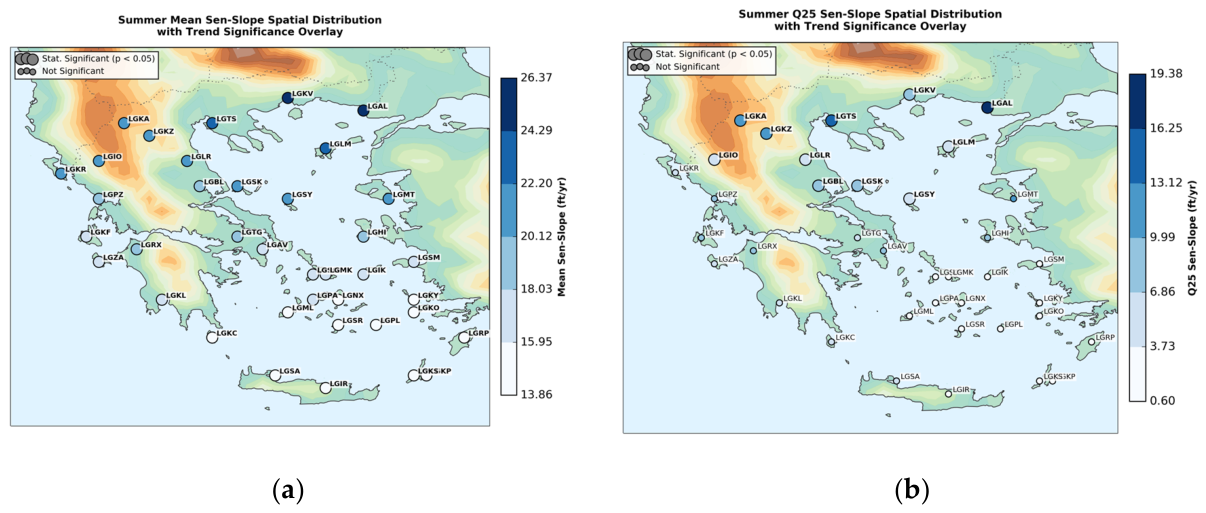
Figure 14.
Spatial distribution of the autumn ZDL across the 38 airport stations (1990–2024): (a) Mean, and (b) Q2). Coloured circles represent station-specific values, while the background contours illustrate the ERA5 model surface orography. Statistical significance (p < 0.05) is denoted with the larger circles, while non-significant trends are indicated by the smaller circles.
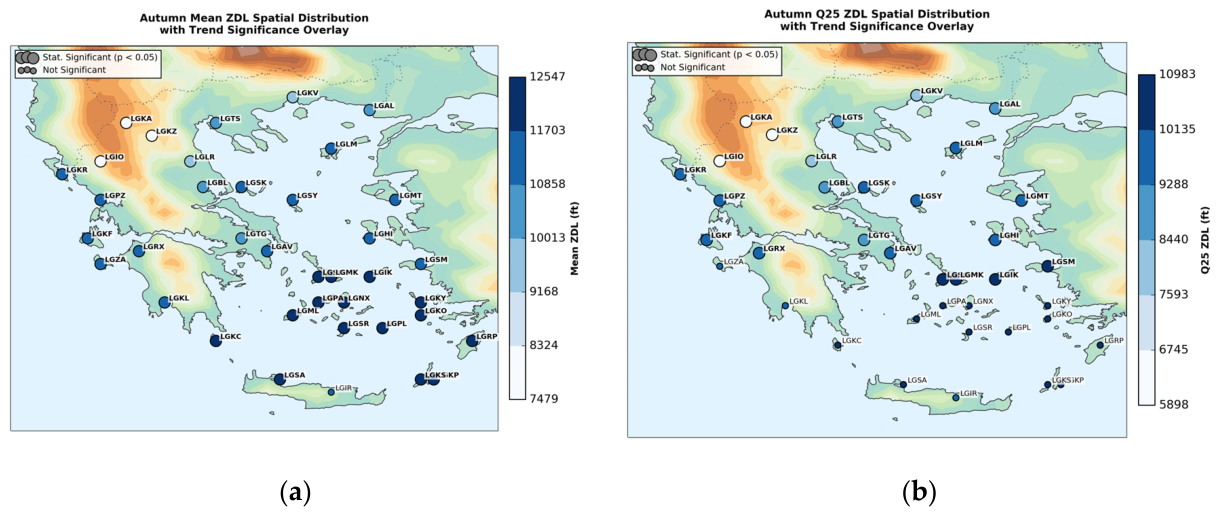
Figure 15.
Spatial distribution of autumn Sen's slope linear trends (ft/yr) for: (a) Mean, and (b) Q25. at each airport. Coloured circles represent station-specific values, while the background contours il-lustrate the ERA5 model surface orography. Statistical significance (p < 0.05) is denoted with the larger circles..
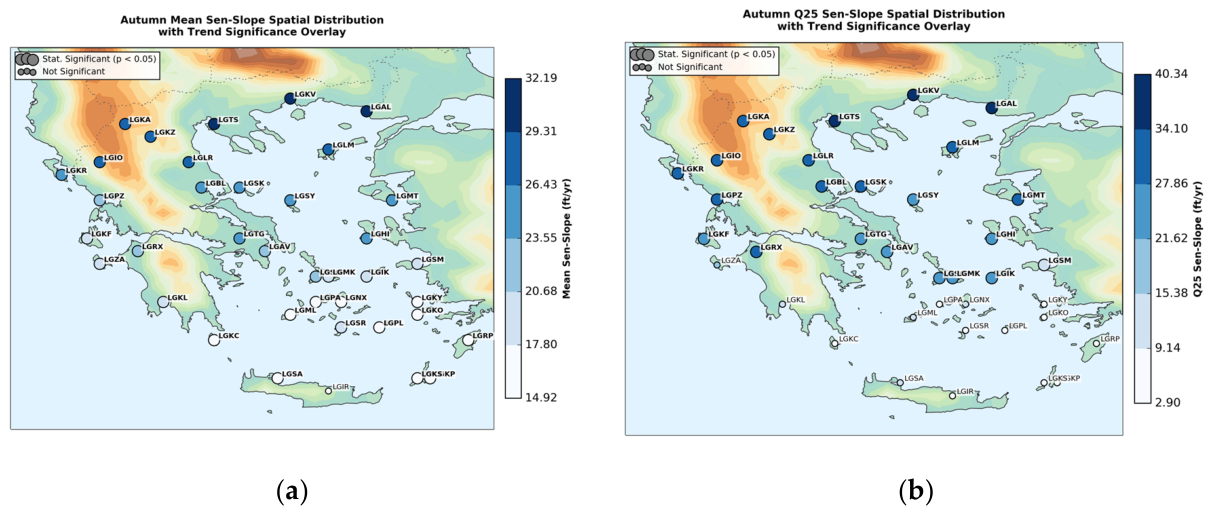
Figure 16.
Spatial distribution of the winter months ZDL height (left) and Sen’s Slope (right) across Greece (1990--2024): (a) December Mean ZDL, and (b) December Mean Sen’s-Slope, (c) January Mean ZDL, and (d) January Mean Sen’s-Slope, (e) February Mean ZDL, and (f) February Mean Sen’s-Slope. Coloured markers depict station values over ERA5 model surface orography. Statistically significant trends (p < 0.05) are highlighted.
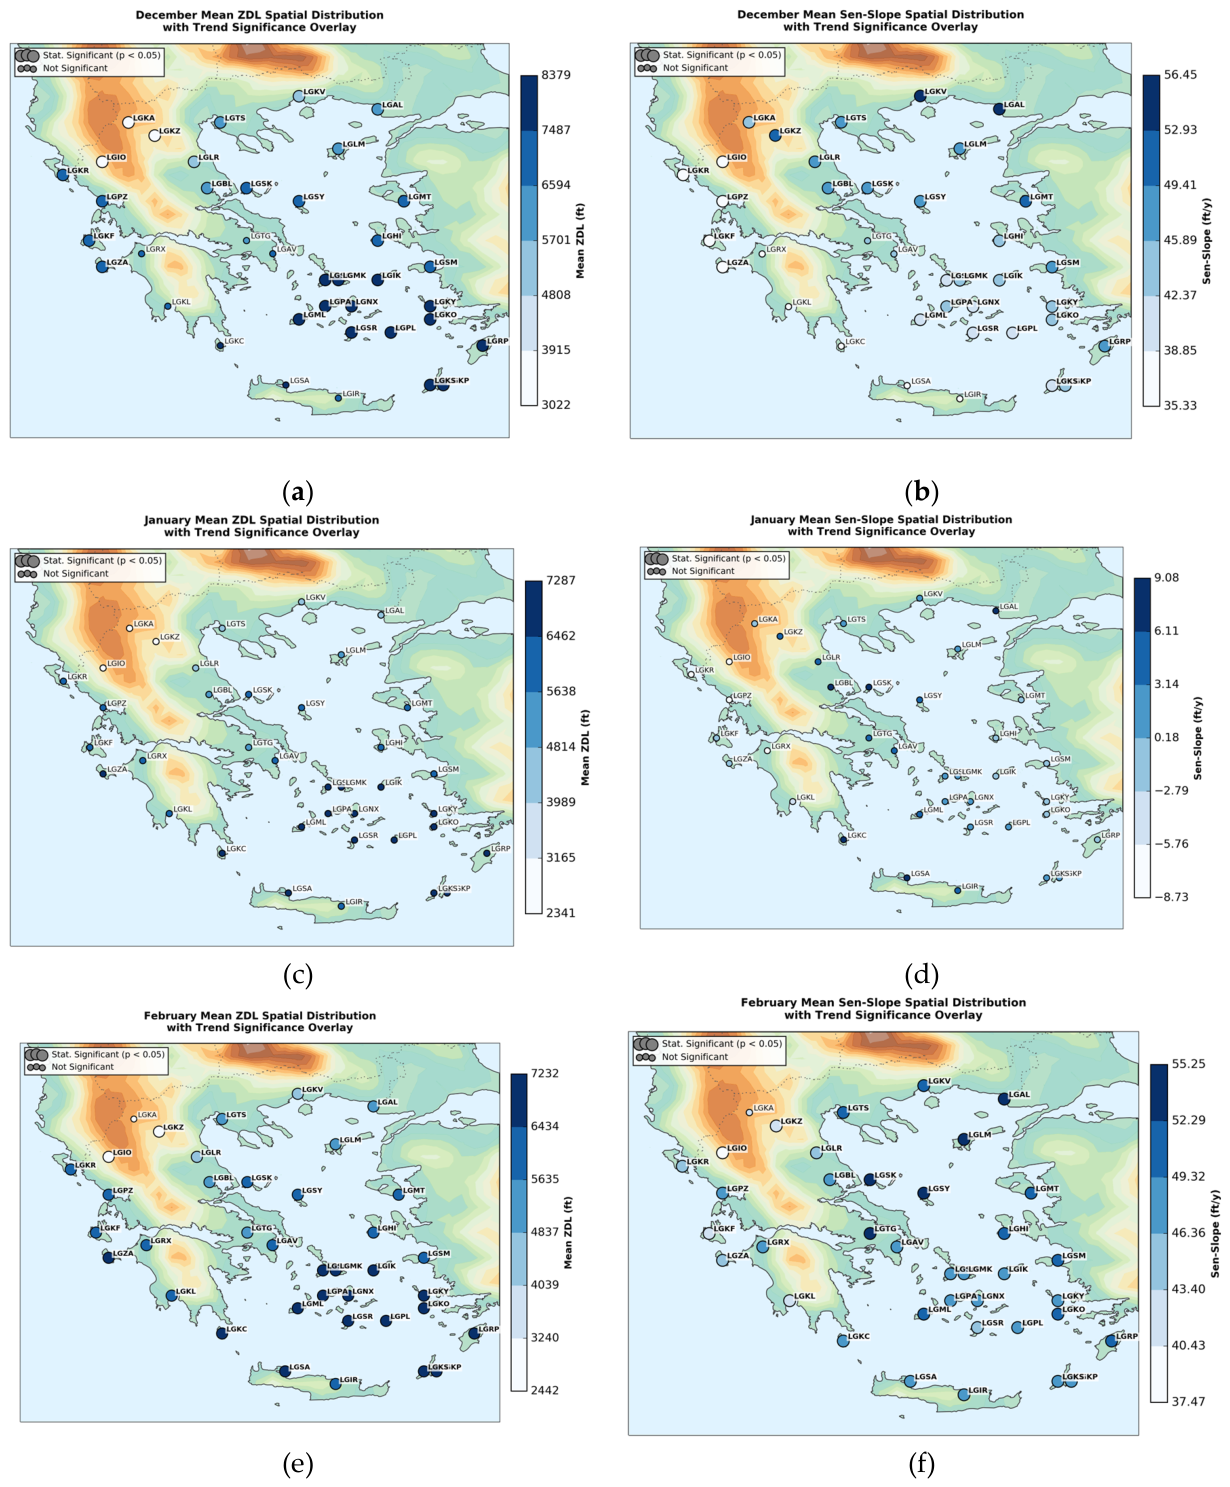
Figure 17.
Spatial distribution of the winter months Q25 ZDL (left) and Q25 Sen’s Slope (right) across Greece (1990--2024): (a) December Q25 ZDL, and (b) December Q25 Sen’s-Slope, (c) January Q25 ZDL, and (d) January Q25 Sen’s-Slope, (e) February Q25 ZDL, and (f) February Q25 Sen’s-Slope. Coloured markers depict station values over ERA5 model surface orography. Statistically significant trends (p < 0.05) are highlighted.
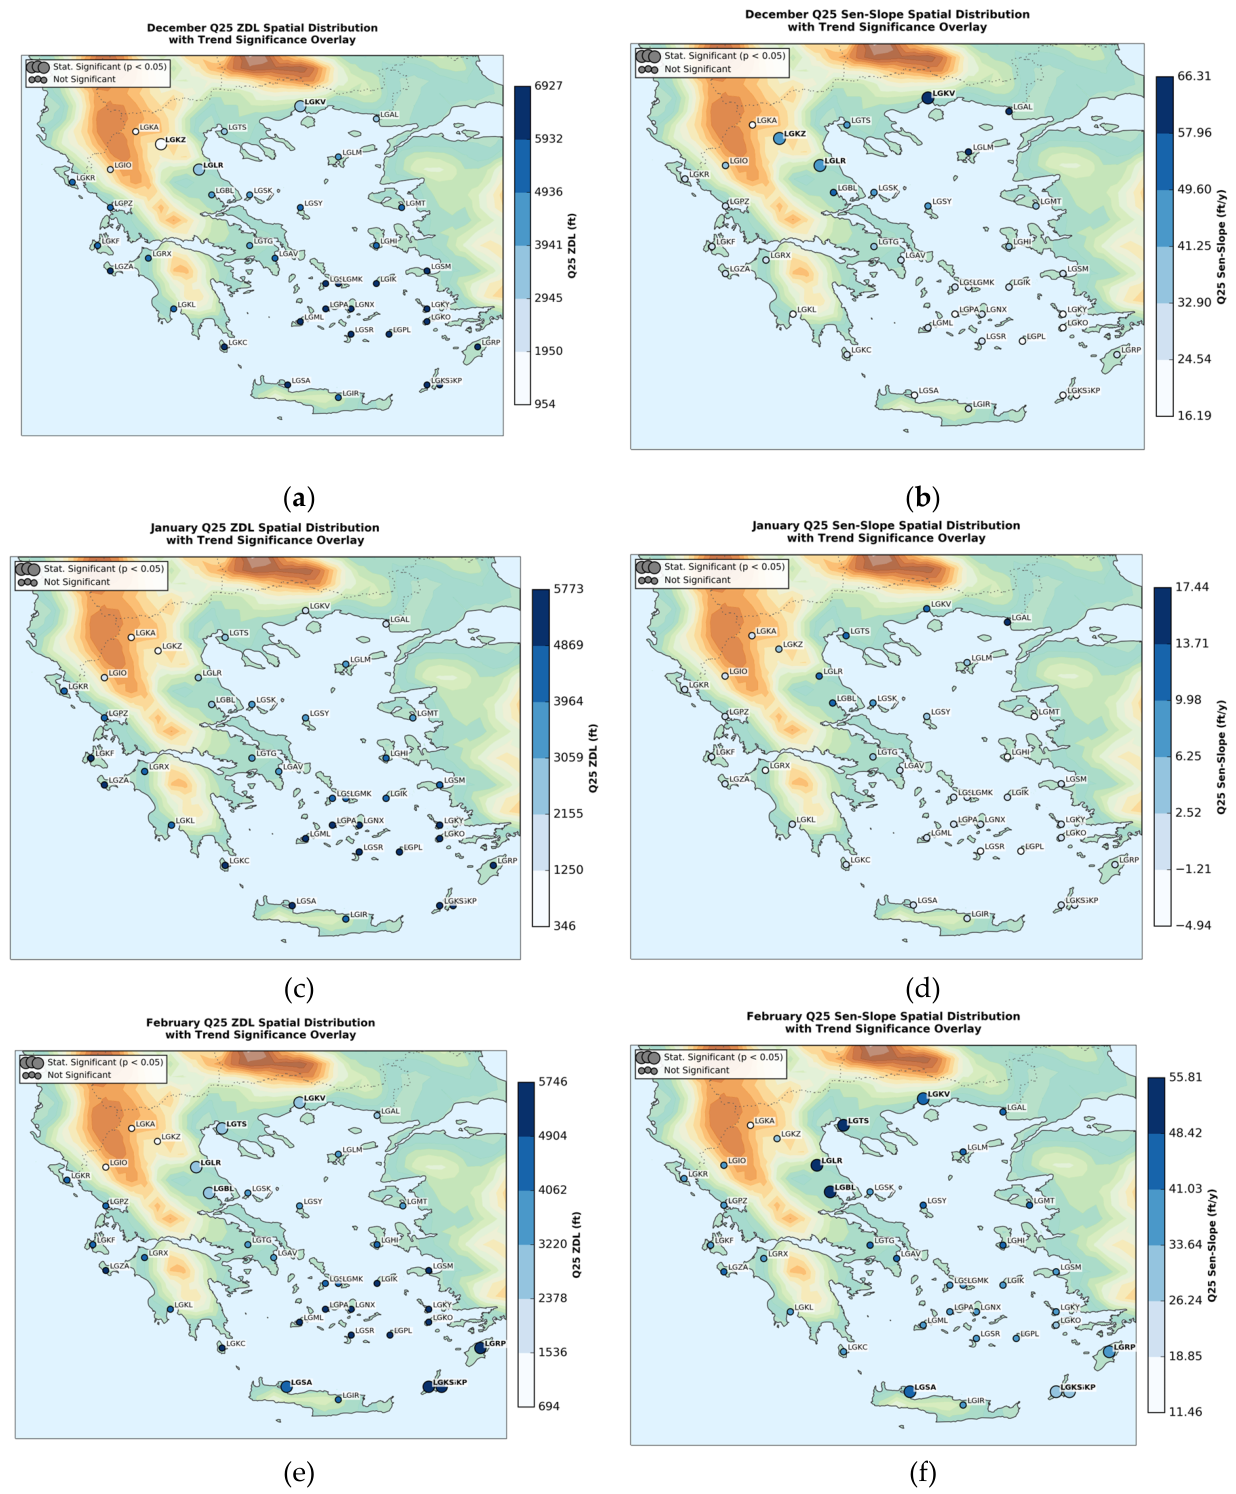
Figure 18.
Spatial distribution of the spring months Mean ZDL (left) and Sen’s Slope (right) across Greece (1990--2024): (a) March Mean ZDL, and (b) March Mean Sen’s-Slope, (c) April Mean ZDL, and (d) April Mean Sen’s-Slope, (e) May Mean ZDL, and (f) May Mean Sen’s-Slope. Coloured markers depict station values over ERA5 model surface orography. Statistically significant trends (p < 0.05) are highlighted.
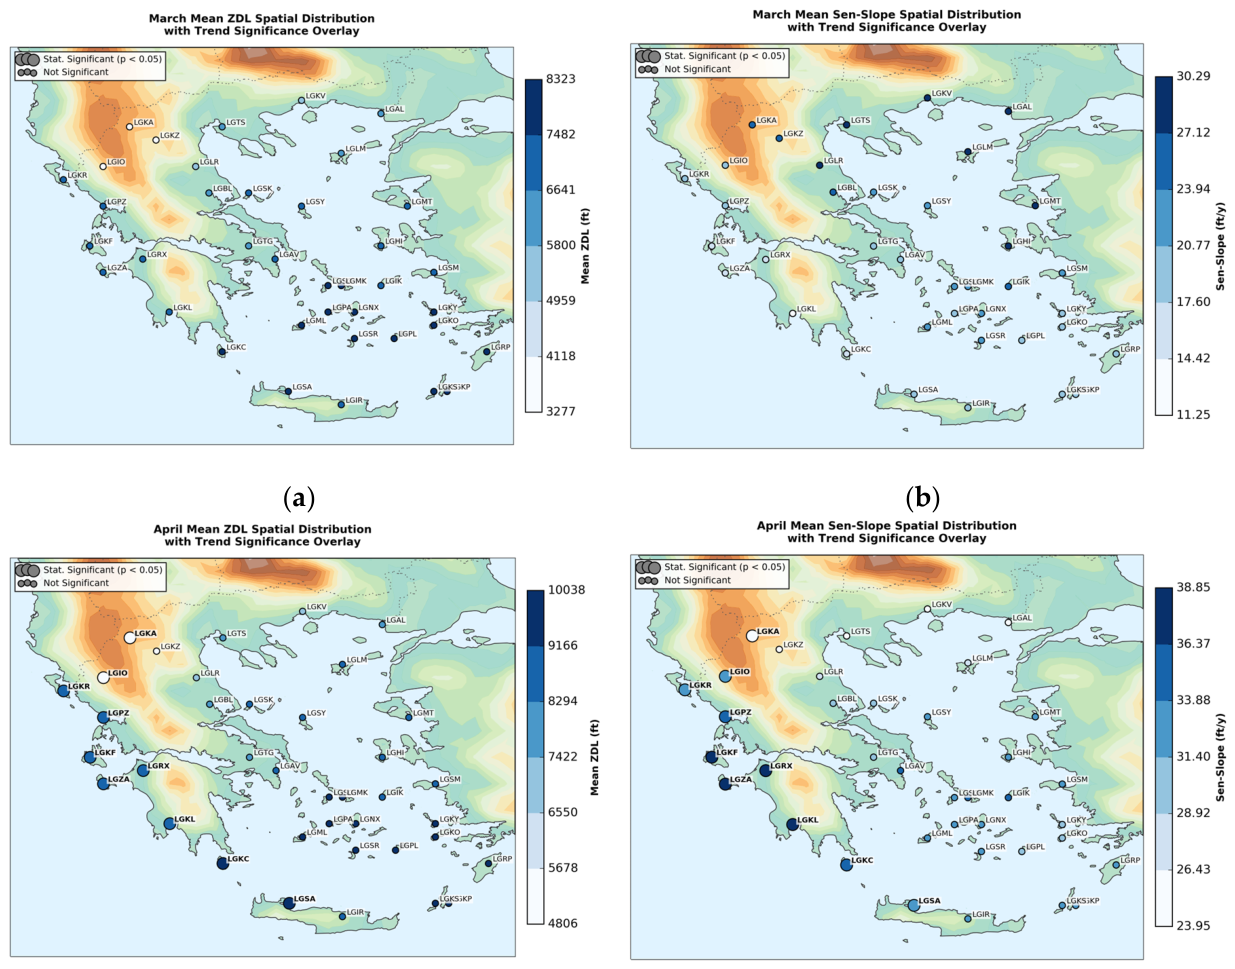
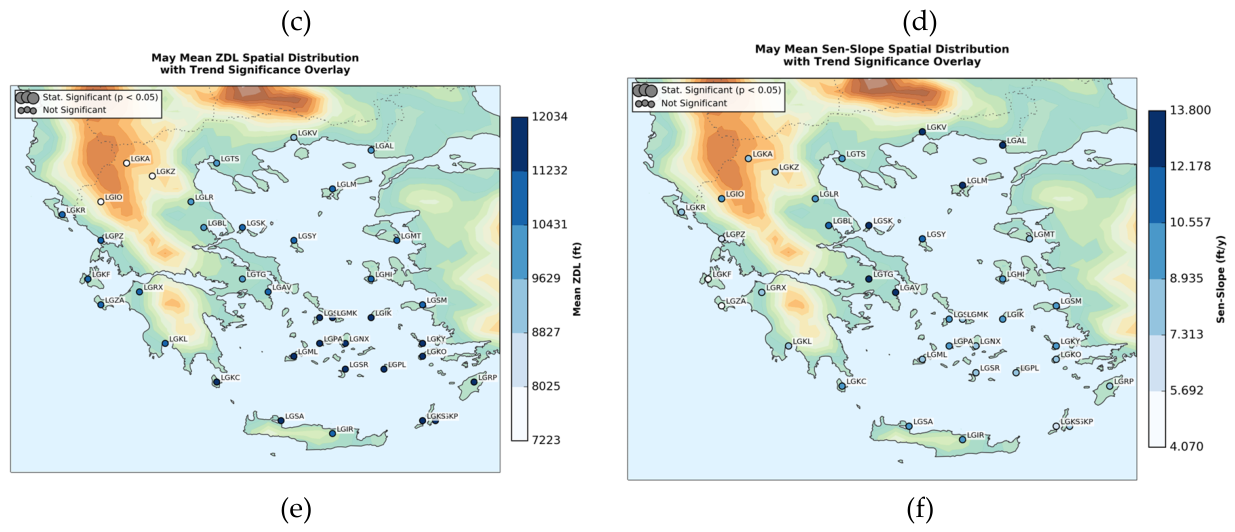
Figure 19.
Spatial distribution of the spring months Q25 ZDL (left) and Q25 Sen’s Slope (right) across Greece (1990--2024): (a) March Q25 ZDL, and (b) March Q25 Sen’s-Slope, (c) April Q25 ZDL, and (d) April Q25 Sen’s-Slope, (e) May Q25 ZDL, and (f) May Q25 Sen’s-Slope. Coloured markers depict station values over ERA5 model surface orography. Statistically significant trends (p < 0.05) are highlighted.
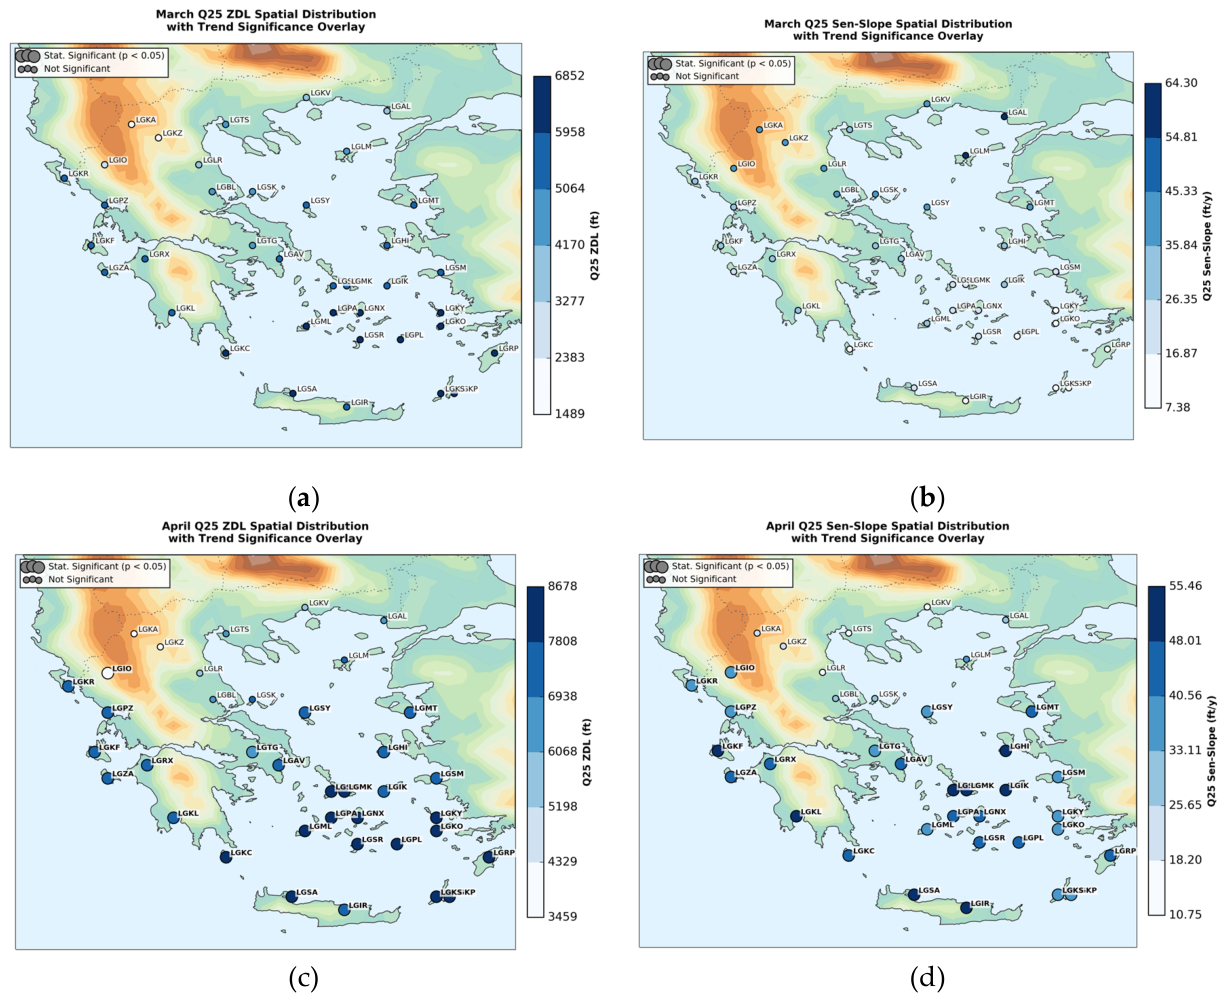
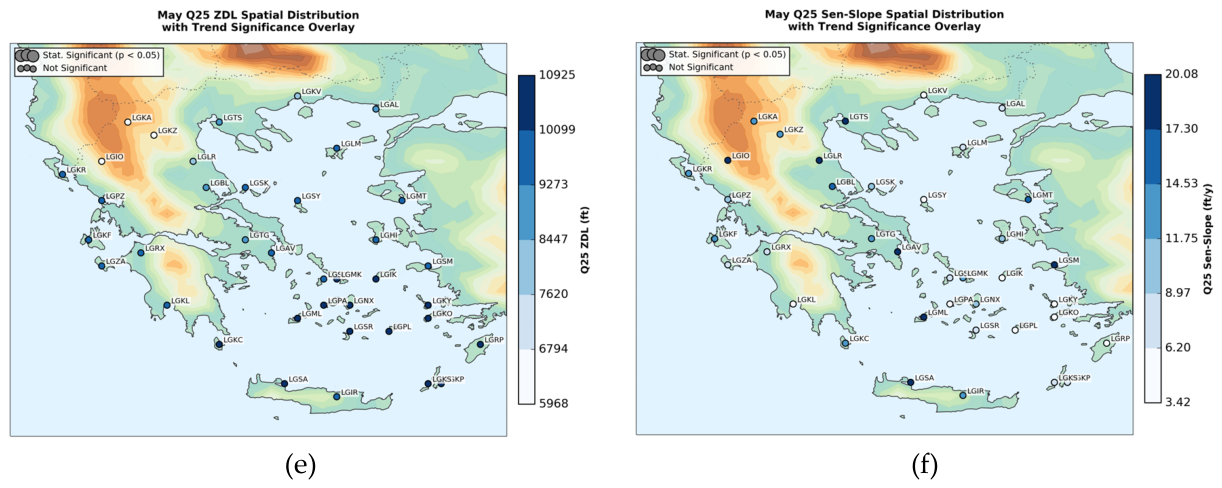
Figure 20.
Spatial distribution of the summer months Mean ZDL (left) and Sen’s Slope (right) across Greece (1990--2024): (a) June Mean ZDL, and (b) June Mean Sen’s-Slope, (c) July Mean ZDL, and (d) July Mean Sen’s-Slope, (e) August Mean ZDL, and (f) August Mean Sen’s-Slope. Coloured markers depict station values over ERA5 model surface orography. Statistically significant trends (p < 0.05) are highlighted.
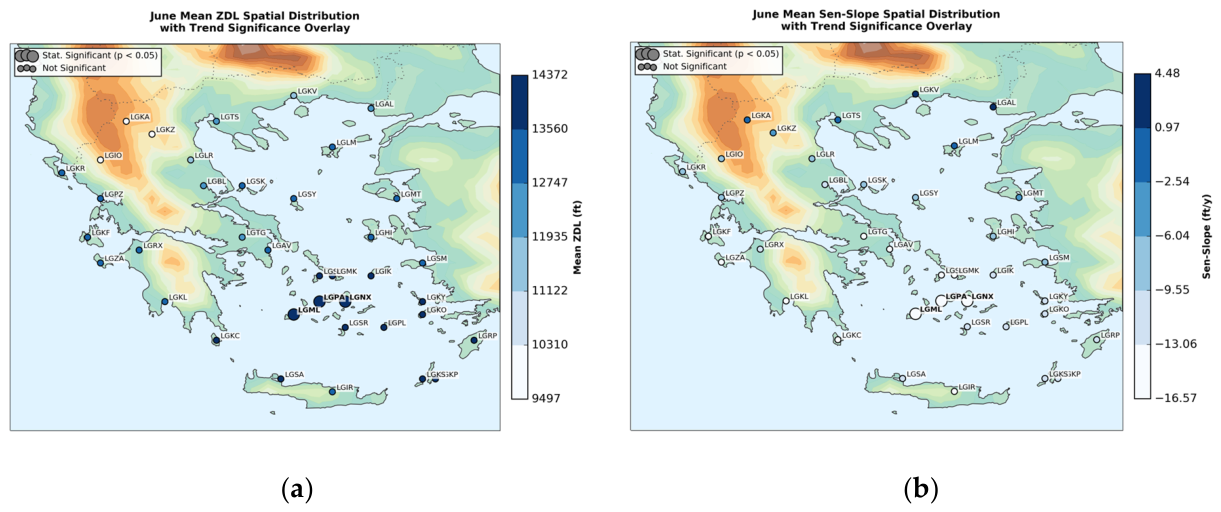
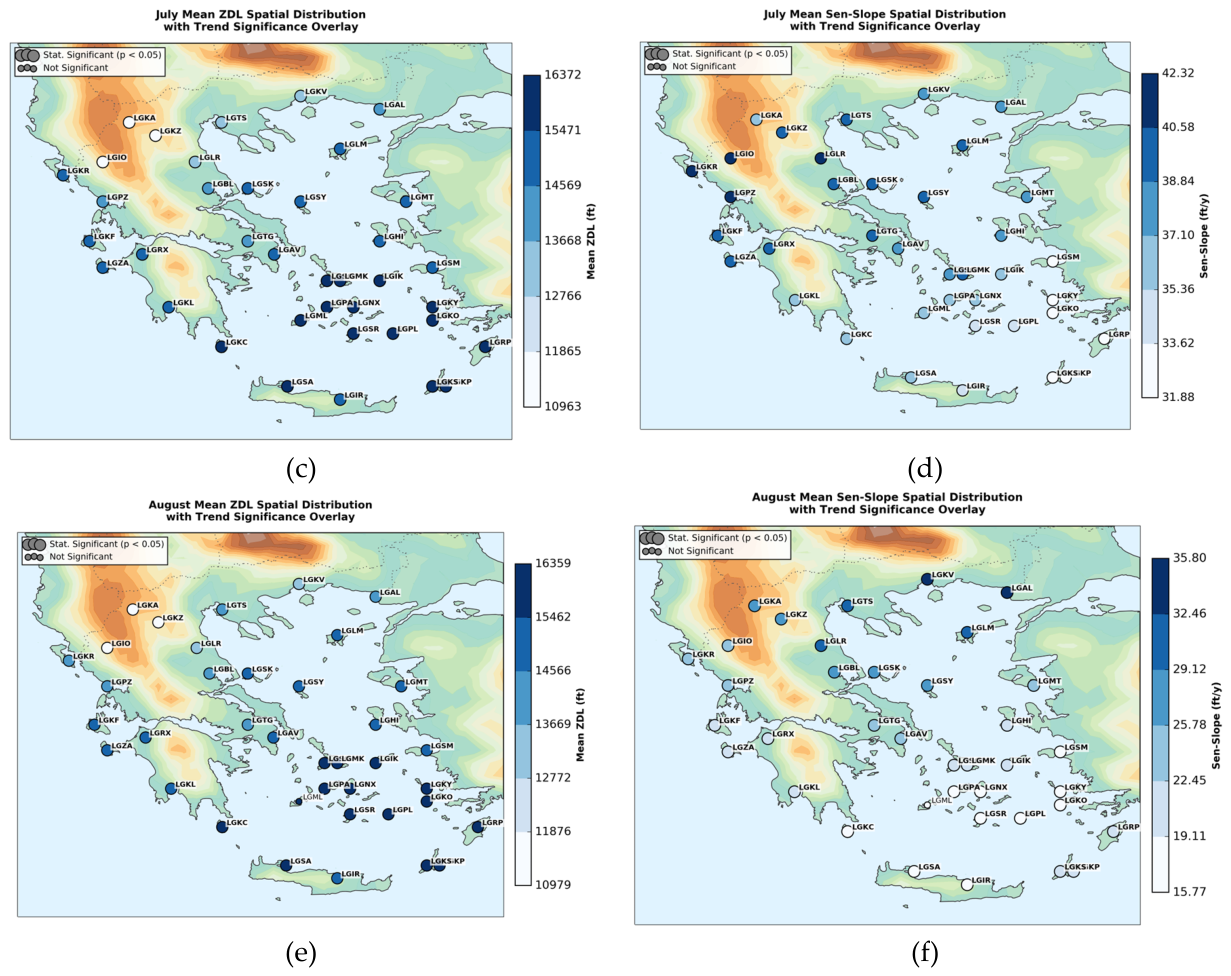
Figure 21.
Spatial distribution of the summer months Q25 ZDL (left) and Q25 Sen’s Slope (right) across Greece (1990--2024): (a) June Q25 ZDL, and (b) June Q25 Sen’s-Slope, (c) July Q25 ZDL, and (d) July Q25 Sen’s-Slope, (e) August Q25 ZDL, and (f) August Q25 Sen’s-Slope. Coloured markers depict station values over ERA5 model surface orography. Statistically significant trends (p < 0.05) are highlighted.
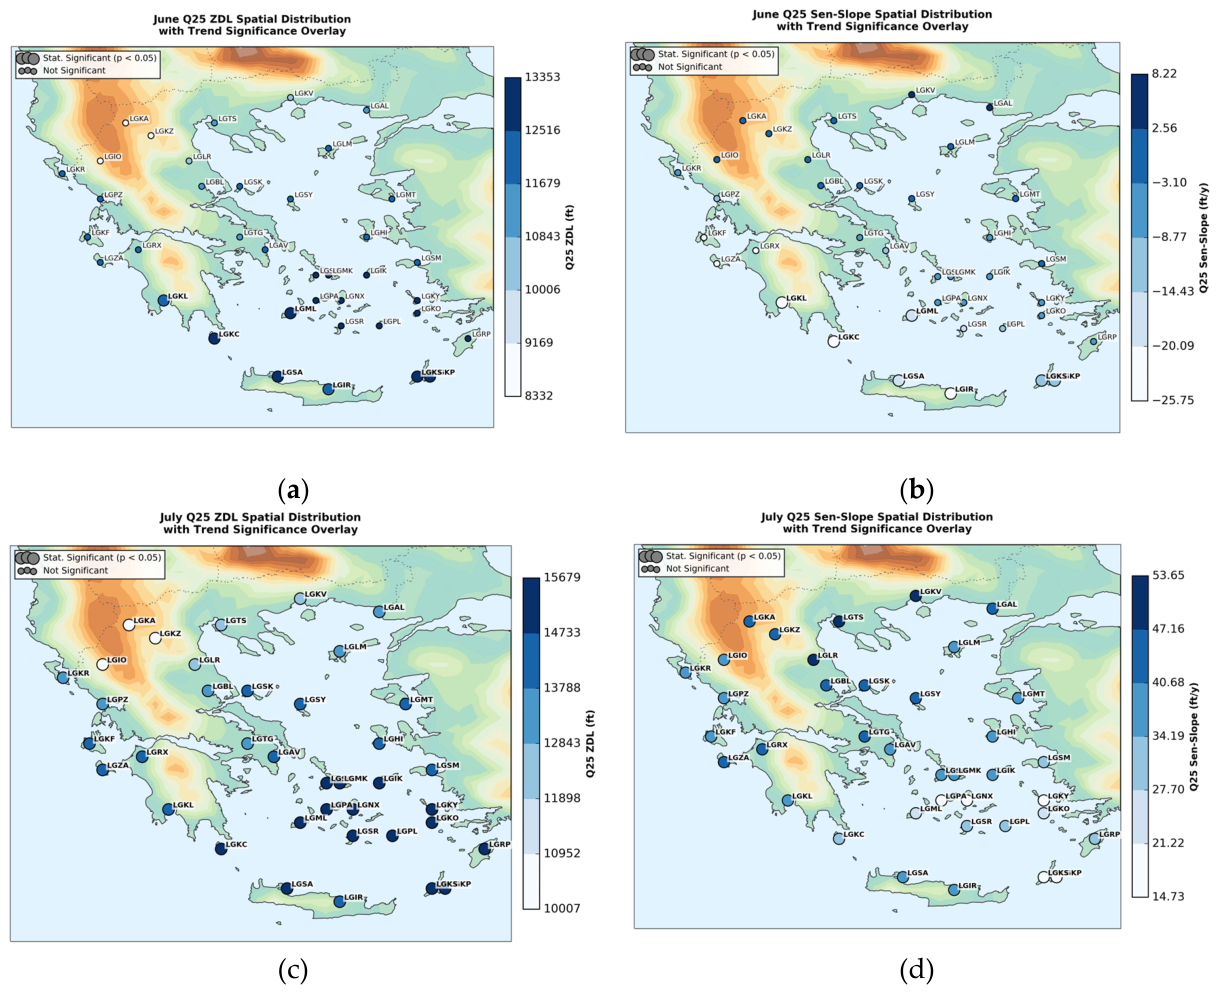
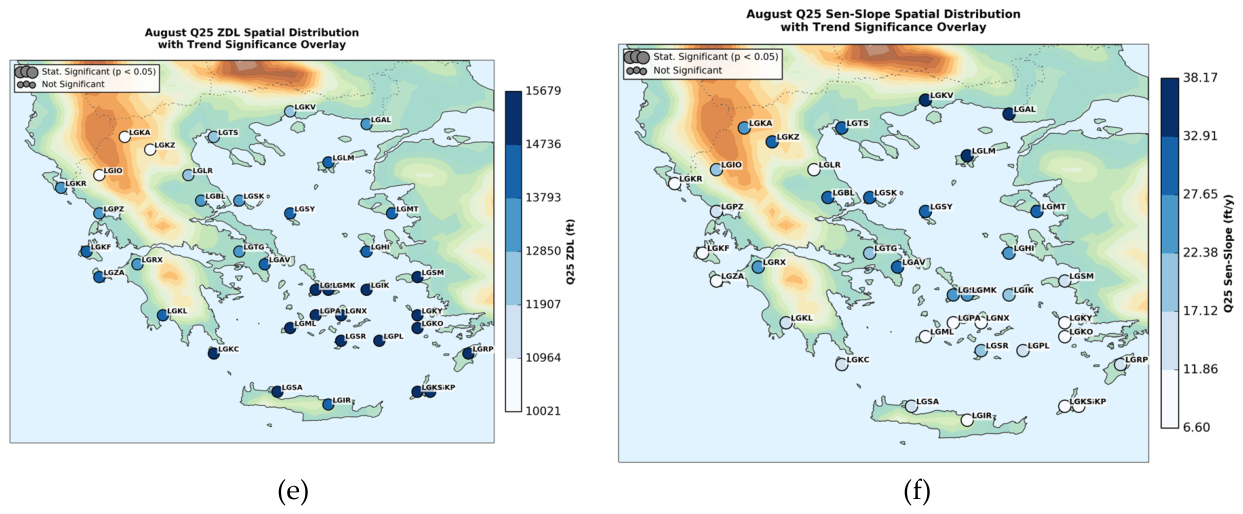
Figure 22.
Spatial distribution of the autumn months Mean ZDL (left) and Sen’s Slope (right) across Greece (1990--2024): (a) September Mean ZDL, and (b) September Mean Sen’s-Slope, (c) October Mean ZDL, and (d) October Mean Sen’s-Slope, (e) November Mean ZDL, and (f) November Mean Sen’s-Slope. Coloured markers depict station values over ERA5 model surface orography. Statistically significant trends (p < 0.05) are highlighted.
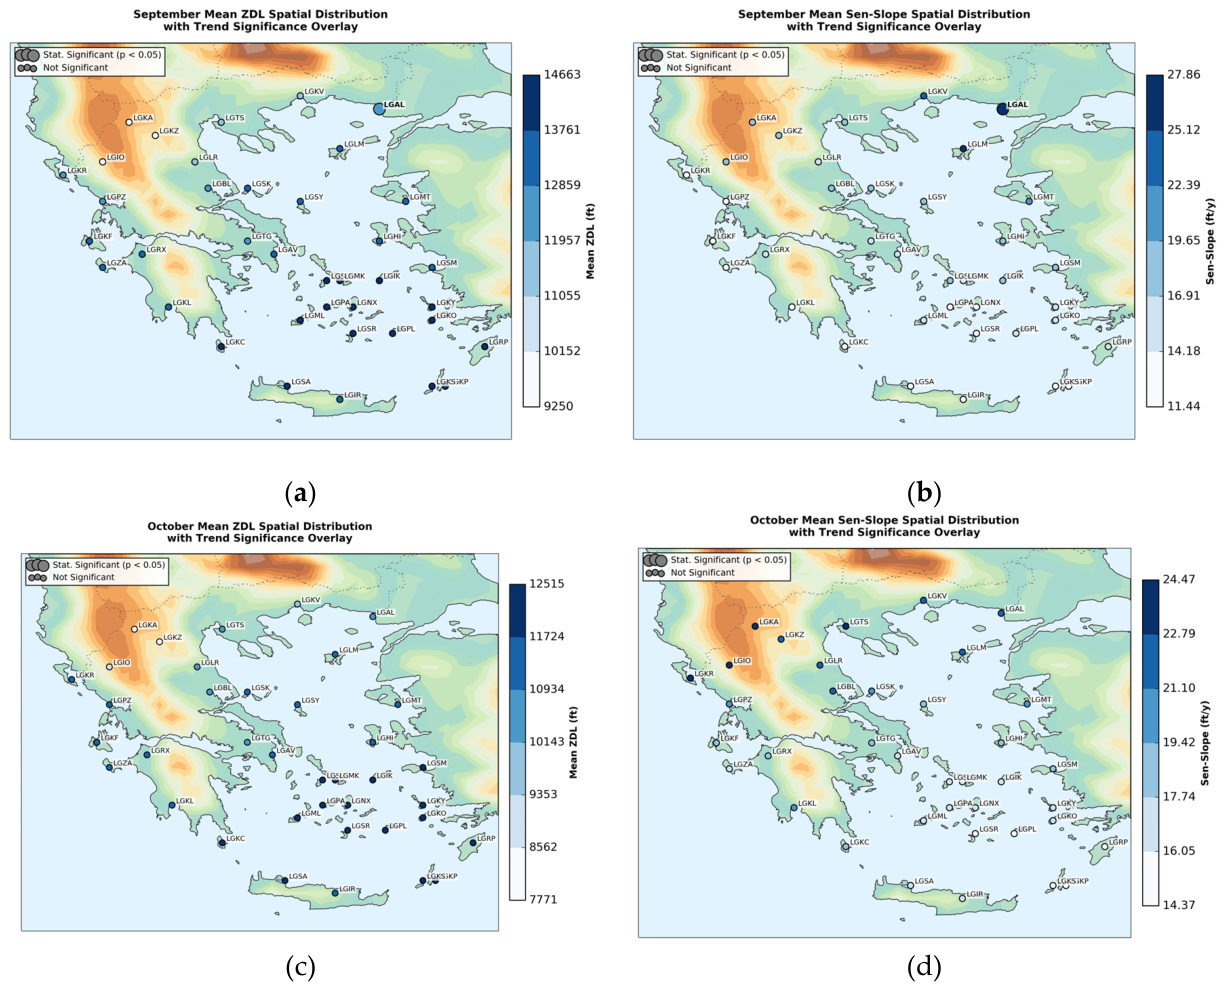
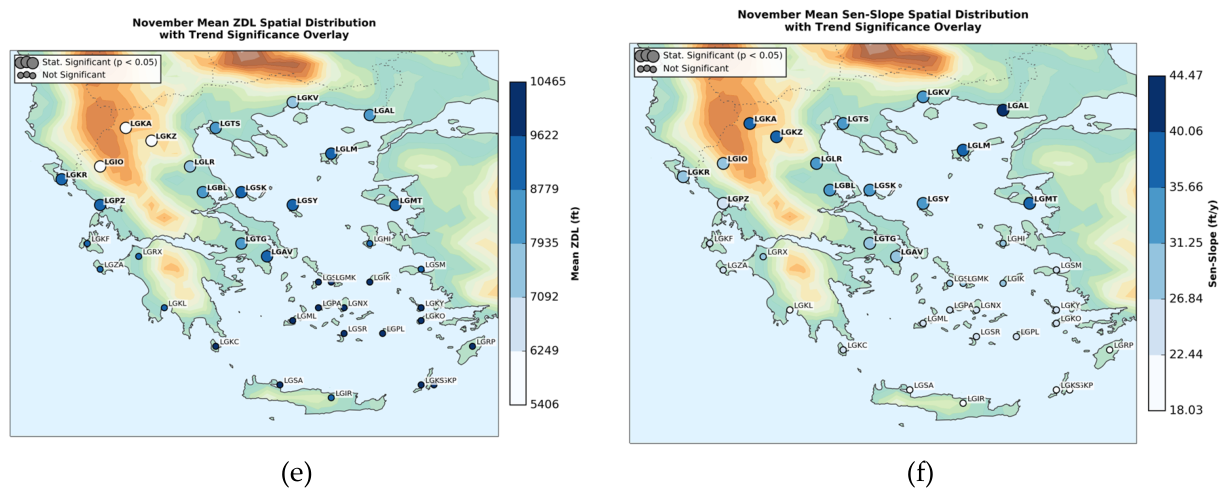
Figure 23.
Spatial distribution of the autumn months Q25 ZDL (left) and Q25 Sen’s Slope (right) across Greece (1990--2024): (a) September Q25 ZDL, and (b) September Q25 Sen’s-Slope, (c) October Q25 ZDL, and (d) October Q25 Sen’s-Slope, (e) November Q25 ZDL, and (f) November Q25 Sen’s-Slope. Coloured markers depict station values over ERA5 model surface orography. Statistically significant trends (p < 0.05) are highlighted.
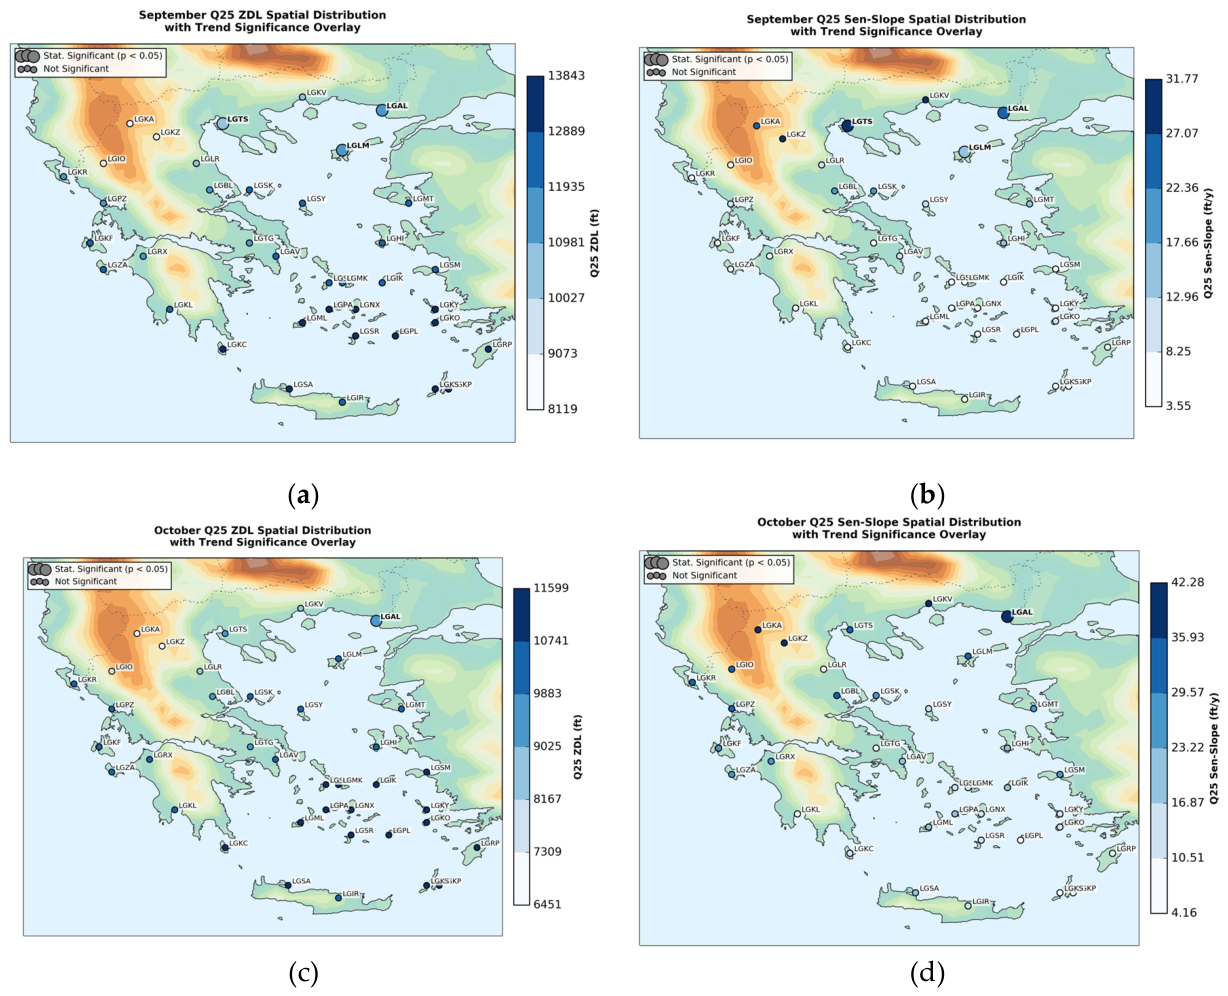
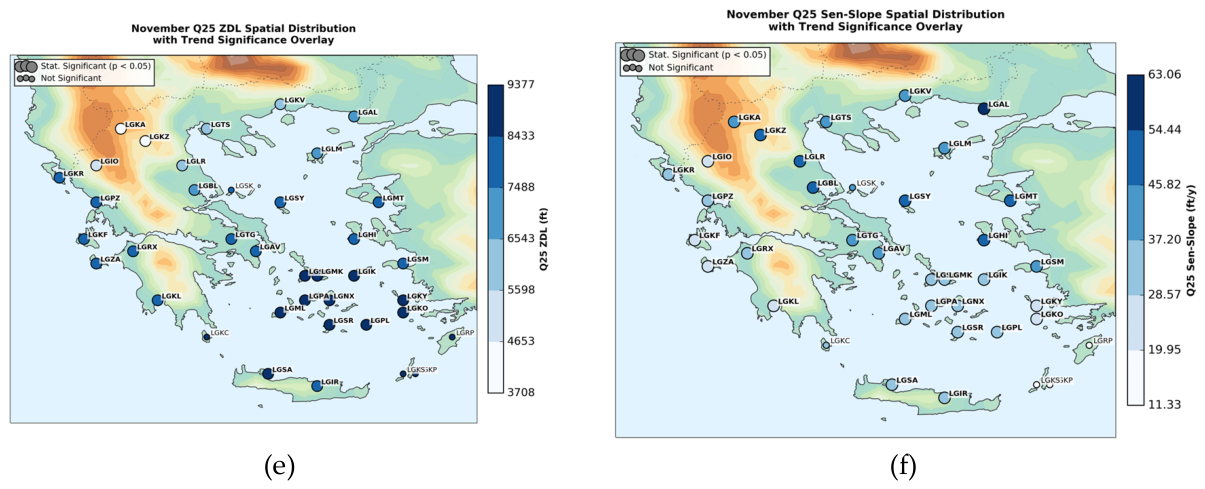
Figure 24.
Frequency distribution of the ZDL height binned at 500 ft intervals. The solid green line and shaded area represent the overall distribution of the 0°C isotherm across the entire dataset.
Figure 24.
Frequency distribution of the ZDL height binned at 500 ft intervals. The solid green line and shaded area represent the overall distribution of the 0°C isotherm across the entire dataset.
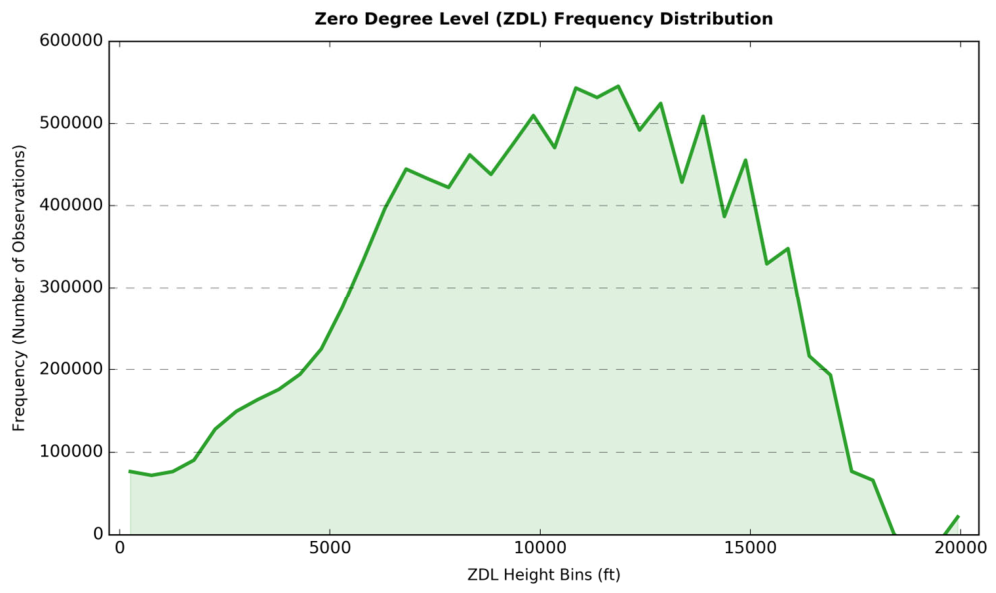

Table 1.
The 38 examined Greek aerodromes, their names, the corresponding ICAO codes and the geographical location over Greece.
Table 1.
The 38 examined Greek aerodromes, their names, the corresponding ICAO codes and the geographical location over Greece.
| Airport name | ICAO code | Geographical Location |
| Alexandroupoli | LGAL | North |
| Kavala | LGKV | |
| Kastoria | LGKA | |
| Kozani | LGKZ | |
| Thessaloniki | LGTS | |
| Limnos | LGLM | |
| Mitilini | LGMT | |
| Larissa | LGLR | Central-East |
| Nea Anchialos | LGBL | |
| Skiathos | LGSK | |
| Skyros | LGSY | |
| Tanagra | LGTG | |
| Eleftherios Venizelos | LGAV | |
| Hios (Chios) | LGHI | |
| Ioannina | LGIO | West |
| Kerkyra (Corfu) | LGKR | |
| Preveza (Aktion) | LGPZ | |
| Kefalonia | LGKF | |
| Araxos | LGRX | |
| Zakynthos | LGZA | |
| Kalamata | LGKL | |
| Syros | LGSO | South & Aegean Islands |
| Mykonos | LGMK | |
| Ikaria | LGIK | |
| Samos | LGSM | |
| Paros | LGPA | |
| Naxos | LGNX | |
| Kalymnos | LGKY | |
| Milos | LGML | |
| Santorini | LGSR | |
| Astypalaia | LGPL | |
| Kos | LGKO | |
| Kithira | LGKC | |
| Rhodes | LGRP | |
| Kasos | LGKS | |
| Karpathos | LGKP | |
| Souda (Chania) | LGSA | |
| Heraklion | LGIR |
Disclaimer/Publisher’s Note: The statements, opinions and data contained in all publications are solely those of the individual author(s) and contributor(s) and not of MDPI and/or the editor(s). MDPI and/or the editor(s) disclaim responsibility for any injury to people or property resulting from any ideas, methods, instructions or products referred to in the content. |
© 2026 by the author. Licensee MDPI, Basel, Switzerland. This article is an open access article distributed under the terms and conditions of the Creative Commons Attribution (CC BY) license.
Copyright: This open access article is published under a Creative Commons CC BY 4.0 license, which permit the free download, distribution, and reuse, provided that the author and preprint are cited in any reuse.