
Submitted:
01 October 2026
Posted:
05 October 2026
You are already at the latest version
Abstract
Opioid overdose deaths are an important public health issue in the United States. Illegally manufactured fentanyl has spread widely and overlaps with stimulants, which makes overdoses more complex. Differences in overdose patterns exist based on region, sex, age, and race/ethnicity. The objective of this study was to examine regional, demographic, and substance-specific differences in opioid overdose deaths reported through the Centers for Disease Control and Prevention State Unintentional Drug Overdose Reporting System (SUDORS). A cross-sectional study was conducted with de-identified publicly available SUDORS data on deaths involving drug overdose in 27 jurisdictions from 2021-2023. Data were aggregated by Midwest, Northeast, South, and West regions. Comparisons were made between regions on death counts from opioid, opioid-stimulant combinations, opioid-benzodiazepine combinations, prescribed opioid, methamphetamine, heroin, cocaine, and illegally manufactured fentanyl. Race/ethnicity, age, and sex were also compared between regions. Statistical analysis was performed using descriptive statistics and chi-square tests. A p-value of <0.05 was considered statistically significant. Deaths involving any opioid (37,171), illegally manufactured fentanyl (33,701), cocaine (17,688), heroin (3,631), prescribed opioids (6,716), and opioid-benzodiazepine combinations (5,832) were highest in the Northeast. Opioid-stimulant combinations (23,698) and methamphetamine (12,697) were highest in the South. Males had more deaths than females in all regions. White individuals had the largest absolute counts in all regions, while Black and Hispanic individuals varied significantly by region. All reported regional comparisons were statistically significant (p<0.0001). The results suggest that the opioid overdose death rate varied based on location, type of opioid, and population demographics. This indicates that fentanyl played an important role in some areas, but the demographics and involvement of stimulants are not consistent across the United States. The study supports prevention strategies that reflect local drug supplies and population needs.
Keywords:
opioid overdose
; fentanyl
; SUDORS
; regional disparities
; polysubstance use
; race and ethnicity
; sex
; mortality
1. Introduction
The drug overdose epidemic in the United States has evolved considerably in the last two decades. The early years of the opioid crisis were closely associated with prescription opioid exposure and heroin. Illegally manufactured fentanyl and other synthetic opioids are now driving the fatal overdose epidemic [1,2]. Fentanyl is highly potent and may be present in heroin, cocaine, methamphetamine, and counterfeit pills, exposing individuals who did not intend to take an opioid [1,3]. These patterns are also applicable to pharmacy practice because opioid-related harm includes prescribed opioids, opioid-benzodiazepine combinations, and exposure to fentanyl through counterfeit pills [1,3]. The unpredictability of the current overdose crisis makes it more challenging to combat using approaches targeting only one class of drugs.
The State Unintentional Drug Overdose Reporting System (SUDORS) provides detailed information about unintentional and undetermined-intent overdose deaths. The CDC developed SUDORS, which combines information from death certificates, medical examiner or coroner reports, and postmortem toxicology findings [4]. In addition to describing drugs involved in a death, SUDORS can describe demographic characteristics and circumstances that may point to opportunities for prevention. National totals are important but do not show how overdose patterns differ between communities, which is found in SUDORS.
During the fentanyl era, regional differences have often been observed. Research using national mortality data found that fentanyl-related mortality rose earlier and more sharply in the eastern United States, while methamphetamine-related mortality remained especially important in western states [5,6]. CDC surveillance later documented rapid increases in illegally manufactured fentanyl deaths in the Midwest, South, and West during 2019-2020, showing that fentanyl was no longer limited to eastern drug markets [1]. More recent SUDORS analyses have continued to show regional differences in fentanyl detection and have cautioned that raw death counts should not be compared without considering population size and jurisdictional coverage [7].
Polysubstance involvement is another important part of the current crisis. In a CDC analysis of 25 states, benzodiazepines, cocaine, or methamphetamine were present in nearly two-thirds of opioid-involved deaths during the first half of 2018 [2]. A separate SUDORS report found that opioids or stimulants, alone or in combination, were involved in most overdose deaths examined during the first half of 2019 [8]. More recent research has described growing overlap between fentanyl and cocaine or methamphetamine, with patterns differing across racial and ethnic groups [9]. These findings suggest that prevention efforts directed only toward people who identify as opioid users may miss individuals who are exposed to fentanyl while using stimulants or counterfeit pills. Understanding how opioid and polysubstance overdose patterns differ across regions may help inform medication-safety, prevention, and harm-reduction efforts involving prescription and nonprescription drug use [2,3,8].
Demographic disparities also require careful attention. Overdose death rates increased especially rapidly among non-Hispanic Black and American Indian or Alaska Native populations between 2019 and 2020 in a multistate SUDORS analysis [10]. Other studies have shown that the size and direction of racial disparities can differ by age, sex, and region [5,6]. Males generally have higher numbers of overdose deaths than females, though this differs between drug types and population subgroups [6,9]. The examples illustrate the importance of distinguishing between absolute numbers, percentages, and population-adjusted rates.
The aim of this study is to compare opioid overdose deaths in the four U.S. Census regions using SUDORS data and to examine the differences in opioid overdose deaths among various subgroups such as substance type, race/ethnicity, age, and sex. The study hypothesizes that there will be significant differences in opioid overdose death distributions among the regions and demographic subgroups. This study intended to identify broad trends that can inform more focused follow-up studies; it is not intended to provide evidence of individual-level factors leading to opioid overdose.
2. Materials and Methods
2.1. Study Design and Data Source
This cross-sectional study used publicly available and de-identified data from the CDC SUDORS dashboard for 2021-2023. SUDORS includes overdose deaths classified as unintentional or of undetermined intent and compiles information from death certificates, medical examiner or coroner records, and postmortem toxicology testing [4]. Because the study used aggregate public data and did not include identifiable private information, institutional review board approval was not sought.
2.2. Study Population and Geographic Classification
This cross-sectional analysis included SUDORS data from 27 jurisdictions for 2021-2023. The jurisdictions were grouped into four regions using U.S. Census definitions: Midwest (Iowa, Kansas, Minnesota, Nebraska, Ohio), Northeast (Connecticut, Maine, Massachusetts, New Hampshire, New Jersey, Pennsylvania, Rhode Island, Vermont), South (Delaware, District of Columbia, Georgia, Kentucky, Maryland, Oklahoma, Virginia, West Virginia), and West (Alaska, Arizona, Colorado, New Mexico, Oregon, Utah). Data were analyzed for trends and significant differences in opioid overdose deaths and demographic characteristics across regions. A p-value of <0.05 was considered statistically significant.
2.3. Measures
The primary measure was the number of overdose deaths recorded in each region. Substance categories included any opioid, an opioid-stimulant combination, an opioid-benzodiazepine combination, prescribed opioids, methamphetamine, heroin, cocaine, and illegally manufactured fentanyl, which were not necessarily mutually exclusive [2,8]. Demographic measures included race/ethnicity, age, and sex. Race/ethnicity categories included Asian, Black, White, and Hispanic. Age was categorized into groups as individuals younger than 24 years, 25-44 years, 45-64 years, and 65 years or older. Sex was reported as male or female. Individuals with missing values or belonging to other racial groups were excluded.
2.4. Statistical Analysis
Descriptive statistics were used to summarize regional death counts. Crude and weighted mortality rates were calculated and used for analysis. Chi-square tests were used to evaluate whether the distribution of deaths differed across the four regions for each substance category and for the grouped demographic variables. A p-value below 0.05 was considered statistically significant. The analysis was conducted using Microsoft Excel and the VassarStats online statistical calculator. The 2010 U.S. Census population estimates were used to calculate weighted mortality rates.
3. Results
3.1. Regional Distribution by Substance Category
Marked differences were observed in the number of overdose deaths across regions and substance categories (Table 1). The Northeast had the highest count for any opioid, with 37,171 deaths, followed by the South with 32,730. The Midwest and West had lower counts of 18,202 and 17,089, respectively. A similar pattern was seen for illegally manufactured fentanyl: 33,701 deaths were reported in the Northeast, 29,686 in the South, 16,811 in the Midwest, and 14,371 in the West (Figure 1).
The regional pattern was not similar for every drug category. The South had the largest number of opioid-stimulant deaths (23,698) and methamphetamine deaths (12,697). The West had a similarly high methamphetamine count of 12,102, while the Northeast and Midwest reported lower counts of 5,227 and 7,339. In contrast, cocaine deaths were concentrated in the Northeast (17,688) and South (11,556), compared with 6,489 in the Midwest and 2,791 in the West. The Northeast also had the highest counts for opioid-benzodiazepine combinations, prescribed opioids, and heroin. These differences in deaths across different regions were statistically significant (<0.0001). The Supplementary Figure S1 shows regional trends in deaths related to any opioid during 2021–2023.
3.2. Fentanyl Overdose Deaths Pattern over Time
Illegally manufactured fentanyl was one of the largest categories among opioids in every region. The trend figure showed that the Northeast remained the region with the largest fentanyl death count across the three displayed years, while the South also showed a high and increasing burden (Figure 2). The Midwest and West had lower death counts.
3.3. Race and Ethnicity
The distribution of deaths by race/ethnicity differed significantly across regions (chi-square = 12,007.6, df = 9, p<0.0001; Table 2). White individuals had the largest absolute count in every region shown, ranging from 13,497 in the West to 26,944 in the Northeast. Black individuals had the largest count in the South (11,482), followed by the Northeast (7,944), Midwest (4,541), and West (1,522). Hispanic individuals showed a different pattern: the West had the largest count (5,956), followed by the Northeast (3,757), South (1,662), and Midwest (1,074). Asian counts were lower in all regions, with the largest count in the Northeast (272). The Supplementary Figure S2 shows the distribution of opioid overdose deaths by race/ethnicity in the four regions.
3.4. Age
Age distributions also differed across regions (χ² = 7,493.7, df = 9, p<0.0001). The 25-44-year group accounted for the largest number of deaths in the Midwest, South, and West. In the Northeast, the 45-64-year group had the largest count (18,367), followed by the 25-44-year group (13,043). The Northeast also had a notably large count among adults aged 65 years or older (7,860) compared with the other regions.
3.5. Sex
Males had more deaths than females in every region. Male counts ranged from 15,683 in the Midwest to 29,777 in the Northeast, while female counts ranged from 6,387 in the West to 12,135 in the South. The regional distribution by sex was statistically significant (χ² = 96.53, df = 3, p<0.0001). The Supplementary Figure S3 shows the distribution of opioid overdose deaths by sex in the four regions.
4. Discussion
This study identified substantial regional differences in opioid overdose deaths reported in the SUDORS dataset. The Northeast had the largest counts for any opioid, illegally manufactured fentanyl, cocaine, heroin, prescribed opioids, and opioid-benzodiazepine combinations. The South had the largest counts for opioid-stimulant combinations and methamphetamine. Males had more deaths than females in all four regions, and the distributions by race/ethnicity and age also differed significantly. Together, these findings show that the overdose crisis did not follow one uniform pattern across the country. The findings of this study are generally consistent with published literature showing that overdose patterns vary by region, substance type, sex, and race/ethnicity [1,5,6,7,9,10,11,12]. An important apparent difference concerns race/ethnicity. White individuals had the largest absolute number of deaths in each region in the present analysis, whereas several population-adjusted studies have reported rapidly increasing or higher overdose mortality rates among Black populations in some settings [5,6,9,10]. This difference likely reflects the use of absolute death counts in the present study rather than population-adjusted mortality rates. Thus, the current findings do not necessarily conflict with previous research but highlight how the choice of measure can influence the interpretation of demographic disparities.
The large fentanyl count in the Northeast is consistent with earlier research describing the rapid spread of fentanyl through eastern U.S. drug markets [5,6]. Fentanyl was initially more concentrated in regions where white-powder heroin was common, because it could be mixed more easily into that supply. Over time, however, fentanyl spread more broadly. CDC data from 2019-2020 documented sharp increases in illegally manufactured fentanyl deaths in the Midwest, South, and West [1]. A later SUDORS analysis of 2021-2024 also showed widespread fentanyl detection across regions while emphasizing that regional death counts should not be compared without considering population size and jurisdiction coverage [7].
In this study, the Northeast also had the highest counts for heroin and prescribed opioids in the dataset. National research has shown that fentanyl increasingly appears alongside heroin, prescription-type pills obtained outside medical care, and other drugs [1,3]. The rise of counterfeit pills is especially concerning because a person may believe that a pill contains oxycodone or alprazolam when it actually contains fentanyl [3]. From a pharmacy and medication-safety perspective, the regional differences identified for prescribed opioids, opioid-benzodiazepine combinations, and illegally manufactured fentanyl highlight the need to consider both prescription-drug exposure and the rapidly changing illicit drug supply.
Our results indicated that the South had the largest opioid-stimulant and methamphetamine counts, while the West had a methamphetamine count close to that of the South. This pattern supports the importance of examining stimulants together with opioids. CDC studies have shown that cocaine and methamphetamine are frequently detected in opioid-involved deaths and that methamphetamine co-involvement increased during the early expansion of fentanyl [2,8]. Recent analyses have described a continuing shift toward polysubstance deaths, including fentanyl-cocaine and fentanyl-methamphetamine combinations [9].
Regional stimulant patterns may reflect differences in local drug supplies, routes of distribution, and patterns of use. Our findings suggest that overdose prevention programs should not assume that fentanyl risk is limited to people who knowingly use opioids. Education and harm-reduction services may also need to reach people who use cocaine, methamphetamine, or pills obtained outside a licensed pharmacy [2,3,8].
Males accounted for more deaths than females in all regions. Similar sex differences have been observed in national analyses of fentanyl and other overdose deaths [6,9]. Possible explanations for these differences may lie in drug-use patterns, frequency of use, exposure to high-risk drug supplies, and social circumstances. White individuals had the largest absolute number of deaths in each region, but counts alone do not identify which group had the highest mortality rate. Population-adjusted studies have shown that overdose disparities have changed over time. An earlier CDC SUDORS analysis reported especially rapid increases in overdose death rates among non-Hispanic Black and American Indian or Alaska Native populations from 2019 to 2020 [10]. Other national work found that fentanyl-related rates among Black populations increased sharply and that racial differences varied by age, sex, and region [5,6,9]. These studies show why a final analysis should use current population denominators and clearly defined, mutually exclusive race/ethnicity categories. The age also points to regional differences. Adults aged 25-44 years had the largest death count in three regions, while adults aged 45-64 years had the largest death count in the Northeast. Further examination is needed to explore why the number of deaths in the Northeast region among those aged 65 years or older was relatively high.
The findings support a regional prevention response to the overdose crisis. There is a need for broad availability of naloxone, education on the presence of fentanyl in multiple drug products, and rapid access to evidence-based treatment for opioid use disorder in areas where there is high involvement of fentanyl. Counterfeit pill education targeted toward younger individuals and others who do not believe they are at risk for opioid exposure is particularly critical [3]. Programs should educate individuals that pills obtained outside a licensed pharmacy may contain fentanyl even when they look similar to prescription medications. These findings may have practical relevance for pharmacy-based and community-based prevention efforts, specifically those focused on opioid safety, recognition of polysubstance risk, and education about counterfeit medications containing fentanyl [3].
The results further imply the need to include stimulant users in fentanyl prevention programs. Outreach should consider discussing the potential for fentanyl contamination or co-use in settings where cocaine or methamphetamine use is common. If drug checking is allowed and accessible, it can help individuals recognize unintentional fentanyl exposure, but it needs to be combined with naloxone, education, and access to care. CDC research identifies opportunities to intervene before many overdose deaths through things like previous treatment contact, recent release from an institution, or having bystanders present [8]. It is critical that strategies are evidence-based and trusted by the populations they seek to serve, taking into account demographic differences. The literature emphasizes culturally responsive prevention, reducing structural barriers to treatment, and considering social factors that may increase overdose risk [10]. Regional differences in overdose patterns may also help guide locally tailored education on opioid safety, medication misuse, and harm reduction rather than relying on a single national approach.
This use of SUDORS is a major strength of this research as it includes toxicology and medical examiner or coroner data not provided by death certificates alone [4]. Several drug types and demographics were compared in four large regions. This allowed finding different trends for fentanyl, cocaine, methamphetamine, and opioid/stimulant/benzodiazepine combinations. However, this study also has important limitations. First, our analysis included 27 jurisdictions rather than all U.S. states and territories for which data were available. Our analyses used aggregate data, and therefore we couldn't determine individual-level causes, behaviors, or exposures. The toxicology testing and the determination of which drugs contributed to death may have differed across jurisdictions. Finally, some race/ethnicity categories were not fully defined, and missing or unknown values were not reported.
A stronger follow-up study should begin with the original downloaded SUDORS files and a reproducible analysis script. Jurisdiction-level data should be matched with population estimates from the same year, and rates should be calculated per 100,000 population with confidence intervals. Poisson or negative binomial regression could be used to calculate rate ratios for regions controlling for year, age, sex, and race/ethnicity. Finally, sensitivity analyses could explore the effects of including only jurisdictions that have complete reporting for all three years.
The project could also be expanded to county-level or local-level analysis in South Florida. For example, geospatial mapping of Broward and Miami-Dade counties could highlight areas of overdose deaths and naloxone gaps (i.e., lack of naloxone distribution, limited access to treatment, or gaps in emergency response). This type of research would require appropriate local data, privacy protections, and close work between public health agencies. Qualitative research involving people affected by opioid use could add context that is not captured by surveillance counts alone. Future research should continue combining opioid overdose death data across U.S. regions for 2021-2023 and develop trendlines by substance type and demographic group. These trends could then be compared across regions to determine whether the observed patterns support the study’s hypotheses regarding geographic and demographic differences in opioid overdose mortality.
5. Conclusions
Opioid overdose deaths in the SUDORS dataset (2021-2023) differed across U.S. regions, drug categories, and demographic groups. The Northeast had the largest counts for fentanyl and several opioid-related categories, while the South and West showed a larger methamphetamine burden. Cocaine was especially prominent in the Northeast and South. Males had more deaths than females in every region, and race/ethnicity and age distributions also varied. Our results suggest that the fentanyl era has produced different regional and demographic patterns rather than a single national epidemic. Prevention efforts should therefore be informed by local drug supplies and local population needs. The findings also have implications for pharmacy and medication-safety practice because overdose prevention increasingly requires attention to prescription opioids, polysubstance use, and unintended fentanyl exposure. This research could also be extended to county-level or local analyses in specific regions. Furthermore, qualitative research involving people affected by opioid use could add context that is not captured by surveillance.
Supplementary Materials
The following supporting information can be downloaded at the website of this paper posted on Preprints.org.
Author Contributions
Conceptualization, P.S.; methodology, S.D. and P.S.; data curation and formal analysis, S.D. and P.S.; visualization, S.D. and P.S.; supervision, P.S.; writing-original draft preparation, S.D.; writing-review and editing, S.D. and P.S.
Funding
This research received no external funding.
Institutional Review Board Statement
Ethical review and approval were not required because this study used publicly available, de-identified aggregate data.
Informed Consent Statement
Not applicable.
Data Availability Statement
The source data are publicly available through the CDC SUDORS dashboard. https://www.cdc.gov/overdose-prevention/data-research/facts-stats/sudors-dashboard-fatal-overdose-data.html.
Acknowledgments
The student author (S.D.) thanks Dr. Prashant Sakharkar for mentorship and guidance, Dr. Shrestha for organizing the summer research activities, and Larkin University for providing the opportunity to participate in the Summer Research Program. The authors also acknowledge the CDC and participating SUDORS jurisdictions for making the data available.
Conflicts of Interest
The authors declare no conflict of interest.
References
- O’Donnell, J.; Tanz, L.J.; Gladden, R.M.; Davis, N.L.; Bitting, J. Trends in and Characteristics of Drug Overdose Deaths Involving Illicitly Manufactured Fentanyls—United States, 2019–2020. MMWR Morb. Mortal. Wkly. Rep. 2021, 70, 1740–1746. [Google Scholar] [CrossRef] [PubMed]
- Gladden, R.M.; O’Donnell, J.; Mattson, C.L.; Seth, P. Changes in Opioid-Involved Overdose Deaths by Opioid Type and Presence of Benzodiazepines, Cocaine, and Methamphetamine—25 States, July–December 2017 to January–June 2018. MMWR Morb. Mortal. Wkly. Rep. 2019, 68, 737–744. [Google Scholar] [CrossRef] [PubMed]
- O’Donnell, J.; Tanz, L.J.; Miller, K.D.; et al. Drug Overdose Deaths with Evidence of Counterfeit Pill Use—United States, July 2019–December 2021. MMWR Morb. Mortal. Wkly. Rep. 2023, 72, 949–956. [Google Scholar] [CrossRef] [PubMed]
- Centers for Disease Control and Prevention. State Unintentional Drug Overdose Reporting System (SUDORS): Fatal Drug Overdose Data. Available online: https://www.cdc.gov/overdose-prevention/data-research/facts-stats/sudors-dashboard-fatal-overdose-data.html (accessed on 25 July 2026).
- D’Orsogna, M.R.; Böttcher, L.; Chou, T. Fentanyl-driven acceleration of racial, gender and geographical disparities in drug overdose deaths in the United States. PLoS Glob. Public Health 2023, 3, e0000769. [Google Scholar] [CrossRef] [PubMed]
- Jones, A.A.; Waghmare, S.A.; Segel, J.E.; Harrison, E.D.; Apsley, H.B.; Santos-Lozada, A.R. Regional differences in fatal drug overdose deaths among Black and White individuals in the United States, 2012–2021. Am. J. Addict. 2024, 33, 534–542. [Google Scholar] [CrossRef] [PubMed]
- Tanz, L.J.; Stewart, A.; Gladden, R.M.; Ko, J.Y.; Owens, L.; O’Donnell, J. Detection of Illegally Manufactured Fentanyls and Carfentanil in Drug Overdose Deaths—United States, 2021–2024. MMWR Morb. Mortal. Wkly. Rep. 2024, 73, 1099–1105. [Google Scholar] [CrossRef] [PubMed]
- O’Donnell, J.; Gladden, R.M.; Mattson, C.L.; Hunter, C.T.; Davis, N.L. Vital Signs: Characteristics of Drug Overdose Deaths Involving Opioids and Stimulants—24 States and the District of Columbia, January–June 2019. MMWR Morb. Mortal. Wkly. Rep. 2020, 69, 1189–1197. [Google Scholar] [CrossRef] [PubMed]
- Zhu, D.T. Racial and Ethnic Disparities in Fentanyl and Polysubstance Overdose Deaths. JAMA Psychiatry 2025, 82, 99–100. [Google Scholar] [CrossRef] [PubMed]
- Kariisa, M.; Davis, N.L.; Kumar, S.; et al. Vital Signs: Drug Overdose Deaths, by Selected Sociodemographic and Social Determinants of Health Characteristics—25 States and the District of Columbia, 2019–2020. MMWR Morb. Mortal. Wkly. Rep. 2022, 71, 940–947. [Google Scholar] [CrossRef] [PubMed]
- Althoff, K.N.; Leifheit, K.M.; Park, J.N.; Chandran, A.; Sherman, S.G. Opioid-related overdose mortality in the era of fentanyl: Monitoring a shifting epidemic by person, place, and time. Drug Alcohol Depend. 2020, 216, 108321. [Google Scholar] [CrossRef] [PubMed]
- Stopka, T.J.; Larochelle, M.R.; Li, X.; et al. Opioid-related mortality: Dynamic temporal and spatial trends by drug type and demographic subpopulations, Massachusetts, 2005–2021. Drug Alcohol Depend. 2023, 246, 109836. [Google Scholar] [CrossRef] [PubMed]
Figure 1.
Opioid overdose deaths by substance category and U.S. region during 2021-2023.
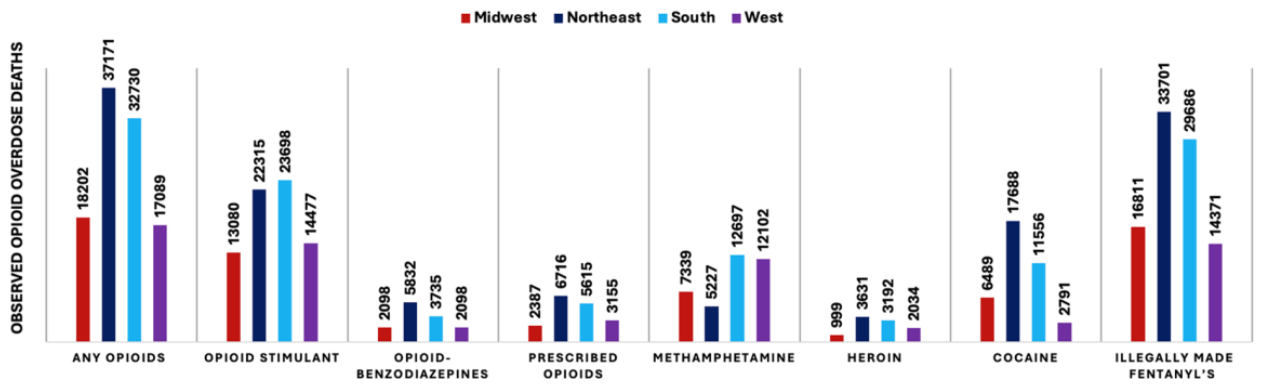
Figure 2.
Trend in illegally manufactured fentanyl-involved overdose deaths across U.S. regions during 2021-2023.
Figure 2.
Trend in illegally manufactured fentanyl-involved overdose deaths across U.S. regions during 2021-2023.
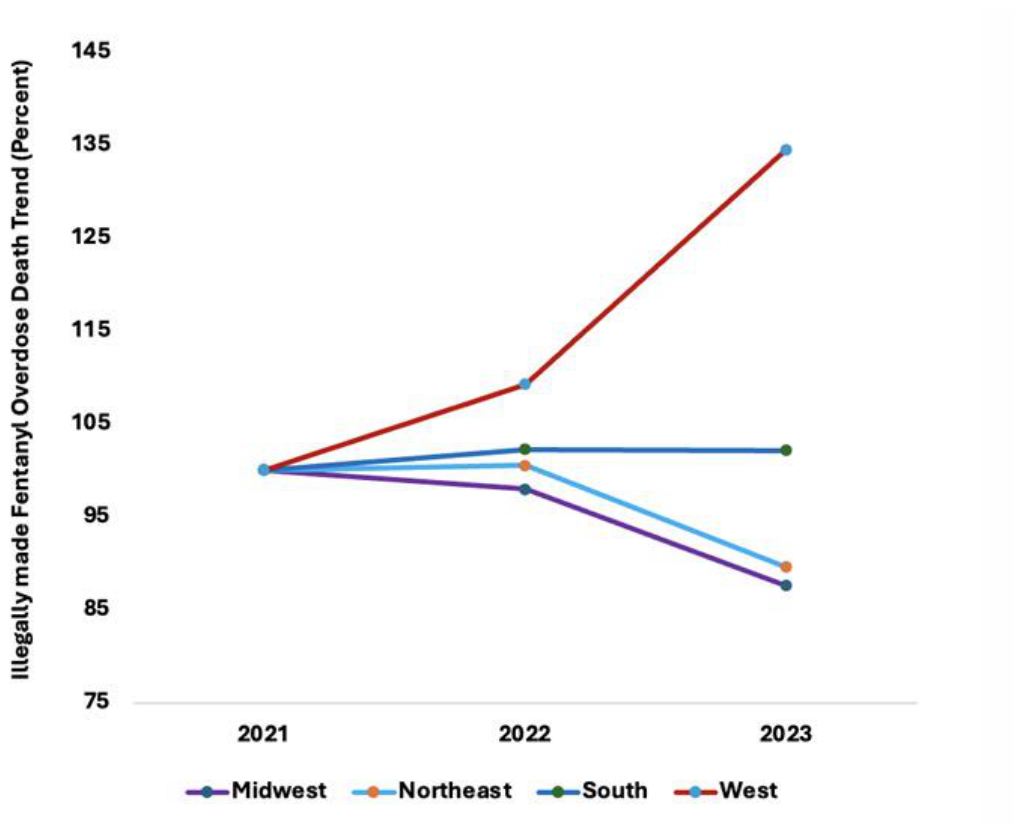

Table 1.
Association between overdose deaths and U.S. region by substance category during 2021-2023.
Table 1.
Association between overdose deaths and U.S. region by substance category during 2021-2023.
| Substance | Midwest | Northeast | South | West | Chi-square | df | p-value |
|---|---|---|---|---|---|---|---|
| Any opioids | 18,202 | 37,171* | 32,730 | 17,089 | 1,610.1 | 3 | <0.0001 |
| Opioid-stimulant | 13,080 | 22,315* | 23,698 | 14,477 | 636.8 | 3 | <0.0001 |
| Opioid-benzodiazepines | 2,098* | 5,832 | 3,735 | 2,098 | 905.7 | 3 | <0.0001 |
| Prescribed opioids | 2,387* | 6,716 | 5,615 | 3,155 | 780.8 | 3 | <0.0001 |
| Methamphetamine | 7,339 | 5,227 | 12,697 | 12,102* | 8,025.9 | 3 | <0.0001 |
| Heroin | 999 | 3,631 | 3,192 | 2,034* | 733.6 | 3 | <0.0001 |
| Cocaine | 6,489 | 17,688* | 11,556 | 2,791 | 5,605.5 | 3 | <0.0001 |
| Illegally made fentanyl | 16,811 | 33,701* | 29,686 | 14,371 | 1,648.9 | 3 | <0.0001 |
*indicates the highest highlighted regional count within that category.
Table 2.
Overdose deaths by race/ethnicity, age, sex, and U.S. region during 2021-2023.
| Characteristic | Midwest | Northeast | South | West | Chi-square | df | p-value |
|---|---|---|---|---|---|---|---|
| Race/ethnicity | |||||||
| Asian | 137 | 272 | 182 | 117 | 12,007.6 | 9 | <0.0001 |
| Black | 4,541 | 7,944 | 11,482* | 1,522 | |||
| White | 16,048 | 26,944 | 26,094 | 13,497 | |||
| Hispanic | 1,074 | 3,757 | 1,662 | 5,956* | |||
| Age | |||||||
| <24 | 1,560 | 1,198 | 2,351 | 1,867 | 7,493.7 | 9 | <0.0001 |
| 25-44 | 11,247* | 13,043 | 18,997 | 11,104 | |||
| 45-64 | 8,652 | 18,367 | 16,613 | 8,583 | |||
| 65+ | 1,235 | 7,860* | 2,539 | 1,490 | |||
| Sex | |||||||
| Male | 15,683 | 29,777 | 28,370 | 16,662 | 96.53 | 3 | <0.0001 |
| Female | 7,012* | 11,571 | 12,135 | 6,387 | |||
*indicates the highest highlighted regional count within that category.
Disclaimer/Publisher’s Note: The statements, opinions and data contained in all publications are solely those of the individual author(s) and contributor(s) and not of MDPI and/or the editor(s). MDPI and/or the editor(s) disclaim responsibility for any injury to people or property resulting from any ideas, methods, instructions or products referred to in the content. |
© 2026 by the authors. Licensee MDPI, Basel, Switzerland. This article is an open access article distributed under the terms and conditions of the Creative Commons Attribution (CC BY) license.
Copyright: This open access article is published under a Creative Commons CC BY 4.0 license, which permit the free download, distribution, and reuse, provided that the author and preprint are cited in any reuse.