

Submitted:
30 September 2026
Posted:
05 October 2026
You are already at the latest version
Abstract
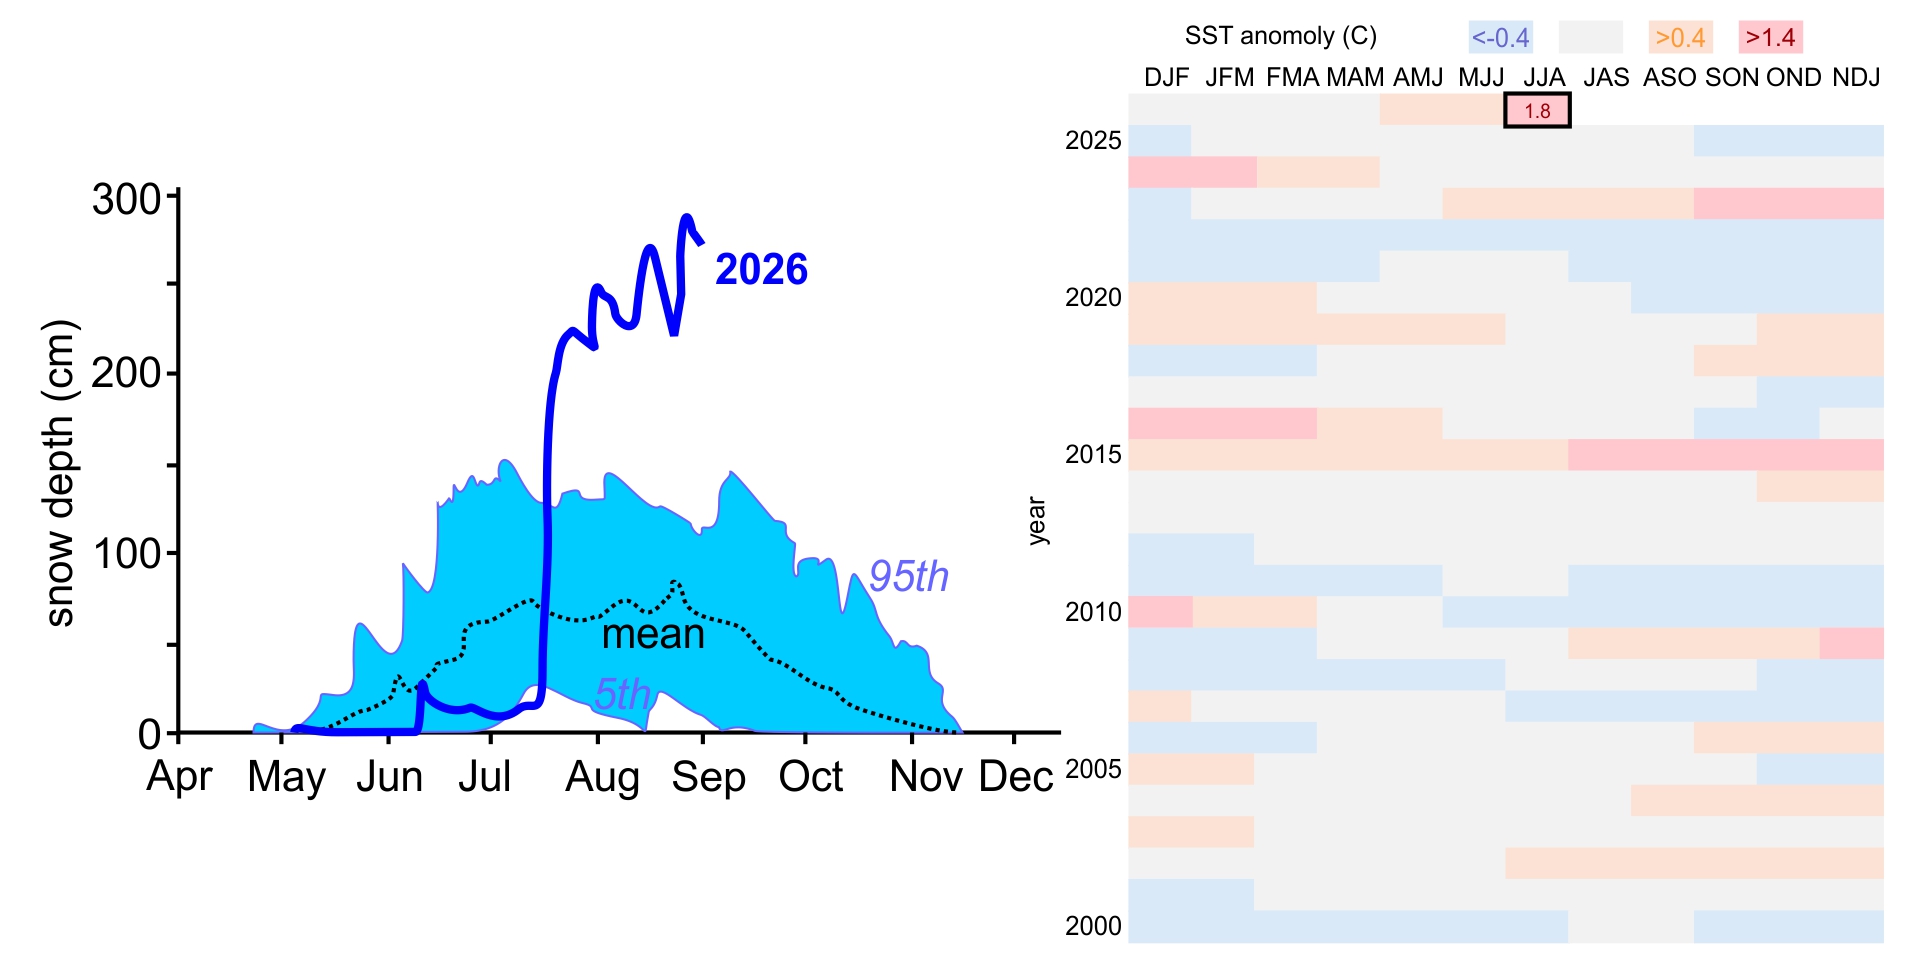
The 2026 Super El Niño is the strongest in a decade, and the June-July-August Sea Surface Temperature is the warmest on record. A series of large snowfall events hit the Central Chilean Andes in July 2026. We use a combination of shorter period-of-record automated daily snow depth (ds) and snow water equivalent (SWE) data with longer period-of-record manual monthly snowcourse (ds and SWE) data to assess how rare the July snowstorms were. The return period statistical analysis showed that the snow accumulation was relatively uncommon with an 8- to 40-year recurrence for the more northerly sites.
Keywords:
snowstorms
; snow climatology
; Oceanic Niño Index (ONI)
; megadrought
; frequency analysis
; Pearson Type III
1. Introduction
Seasonal snow in the Chilean Andes is a major source of water for central Chile. Winter accumulation in the mountains supplements spring-summer supply when demand is highest, supporting irrigation, hydropower, ecosystems and urban use [1; Masiokas et al. 2006, 2; Saavedra et al. 2020, 3; Cordero et al., 2024]. Between roughly 29°S and 36°S, many basins depend on snowmelt, so interannual snowpack variability strongly affects water availability [4; Condom et al. 2020; 5; Webb et al. 2021]. Since about 2010, central Chile has experienced a prolonged megadrought, with persistent precipitation deficits, reduced streamflow and lower storage [6; Garreaud et al. 2020]. Long-term reductions in Andean snow cover and snow persistence have also been documented over recent decades [3; Cordero et al. 2024, 7; Cordero et al. 2019, 8; Saavedra et al. 2026]. Large winter snow increases can therefore occur against a backdrop of chronic water stress and gradual snow losses. Most Andean snowfall is concentrated in April-September, and can be dominated by a few strong events, those linked to atmospheric rivers [3; Cordero et al. 2024, 9; Saavedra et al. 2017]. Automated station snow depth (ds) and snow water equivalent (SWE) measurements track the evolving snowpack, so short term increases and the totals reached after major episodes are complementary indicators of winter severity.
The El Niño–Southern Oscillation (ENSO) is a dominant mode of interannual climate variability in Central Chile. During El Niño (warm phase), positive sea surface temperature anomalies in the central and eastern equatorial Pacific alter large-scale circulation and are generally linked to above-average winter precipitation; La Niña tends toward the opposite [10; Rutllant and Fuenzalida 1991, 11; Montecinos et al. 2000, 12; Garreaud 2009, 13; Campos and Rondanelli 2023]. A related signal appears in Andean snowpack: peak SWE co-varies positively with the Oceanic Niño Index (ONI) in parts of the extratropical Andes, with a stronger influence near 33–35°S, although the relationship is uneven across years and amplified by a few high-SWE El Niño winters rather than every warm phase [14; Cortés and Margulis 2017]. Snowpack response therefore depends on elevation and storm timing as much as on ENSO phase, and ENSO sets climatic background rather than determining individual storms. During the austral winter of 2026, after the decay of the 2025/26 La Niña, El Niño strengthened while the season began dry; in mid-July a sequence of storms, including a prominent episode on 15–21 July with atmospheric-river moisture, produced large increases in high-elevation ds and SWE [15; Centro de Ciencia del Clima y la Resiliencia 2026]. However, the magnitude and historical rarity of the observed changes in ds and SWE, and of the snowpack that resulted from them, had not been quantified using long-term in situ snow observations.
Here, we quantify that winter using five automated stations with daily data: Quebrada Larga (QL), Portillo (P), Laguna Negra (LN), Termas del Flaco (TF) and Lo Aguirre (LA), along with manual snowcourse records at each of these stations, excluding TF. From the daily data, we compare 1) 2026 ds, snowfall (SF) and SWE increases to historical climatologies for several time periods (3, 5, and 7-days for all, plus 15-days for SWE). From the longer record snowcourse data, we compare 2) monthly ds and SWE to historical climatologies. We then 3) estimate return periods for five station-variables and 4) relate snowcourse ds and SWE to NOAA CPC ONI v6 by aligning each survey with the ONI season for its month [16; Climate Prediction Center, 2026].
2. Data and Methods
2.1. Snow Observations and Study Sites
We combined daily automated station snow observations with manual snowcourse surveys to characterize the austral winter of 2026 across five high-elevation sites in central Chile (Figure 1). The automated network spans five watersheds from north to south: Quebrada Larga (Río Elqui), Portillo (Río Aconcagua), Laguna Negra (Río Maipo), Termas del Flaco (Río Rapel), and Lo Aguirre (Río Maule). Four of these sites have long snowcourse records, Termas del Flaco is included only through the automated ds and SWE data (Table A1). Data availability is presented in Figure A1.
Daily ds data were taken from the Southern Andes Snow Depth Dataset [17; Caro et al. 2026], extended with Dirección General de Aguas (DGA) exports though 31 August 2026. Snow depth was measured initially with a sonic depth sensor [18; Sommer Messtechnik 2023] and later replaced with a laser sensor [19; Sommer Messtechnik 2023]. Daily SWE was measured with a snow scale [20; Sommer Messtechnik 2023] and data were obtained from the DGA SNIA portal [21; Ministerio de Obras Públicas DGASAT]. The automated SWE series were quality controlled for negative values, isolated spikes, which were treated with a Median Absolute Deviation (MAD) filter using station-specific thresholds, and short rolling-median smoothing. At Quebrada Larga, 2026 SWE was set to zero in the early winter when snow depth was zero. We are evaluating the amount of snow falling in 2026 due to El Nino; since the SWE data period of record was less than the ds period of record we evaluate both [22; Fassnacht et al., 2004],
Snowcourse data consist of irregular manual surveys (typically monthly to bimonthly during the snow season) collected with a Federal Sampler [23; Natural Resources Conservation Service, 24; López-Moreno et al. 2020]. Records extend from the 1950s and 1960s at most sites to 2026 (Table A1). There are only about 10 long-term snowcourse locations in Chile [25; Dirección General de Aguas 2015], so the paired automated and manual times series represent a more comprehensive view of central Chile snowpack variability.
2.2. Snowpack Metrics and Historical Characterization
To place the 2026 winter in context, we constructed day-of-year (DOY) climatologies for each automated station and variable (dS and SWE) using all complete pre-2026 years in each record. For every calendar day with observations, we calculated the mean as well as 5th percentile and 95th percentiles. These percentiles mark the expected historical range, avoiding distortion from sensor errors while accounting for the positive skewness inherent in daily snow data. The 2026 daily series is overlaid for comparison (Figure 2). The 2026 manual snowcourse measurements are presented with that time series (Figure 3).
2.3. Frequency Analysis and Return Periods
We quantified the historical rarity of 2026 using the two datasets in five complementary ways: short-window change from automated station data for 1) ds, 2) SWE and 3) snowfall (SF), the late-winter or peak manual snowcourse conditions for 4) ds and 5) SWE.
In automated station data, for each hydrological year and station we restricted analysis to the snow season (April-December). Within that window, for each day (t) we computed the change , with X being either ds or SWE and n = 3, 5 or 7 days. A 15-day increase was also used for SWE. The annual value for each metric is the maximum ΔX in that year (one value per year per window). The 2026 event is represented by the 2026 annual maximum for each window length. We did the same for snowfall (SF), which is the sum of snow depth increases (positive change) over the same window length (n = 3, 5, or 7 days) as ds.
From the snowcourse data, we selected the survey closest to 31 July for each year in a station record, to assess the large snowfall events observed in 2026 (Figure 2). Years with no survey within ± 21 days of 31 July were excluded. This retains all years at Quebada Larga, Portillo and Lo Aguirre, but removes about 20% of years at Laguna Negra, where surveys more often fell outside the window. We also used the peak annual snowcourse measurement for each year.
For each calculated metric, we fitted a Pearson Type III distribution by the method of moments [26; England et al. 2019]. From the non-exceedance probability (P) of the 2026 value, the return period was estimated [26; England et al. 2019]. The short-windows from the automated station data return periods and the late-July snowcourse return periods describe storm-scale accumulation rates for the different lengths of record, i.e., 10-17 years for automated station data and 60-75 years for the manual snowcourses. We also evaluated the return periods for the last 17 years of snowcourse data (2010 to 2026), to correspond to the length of record for the automated station data.
2.4. ENSO - Snowpack Correlation
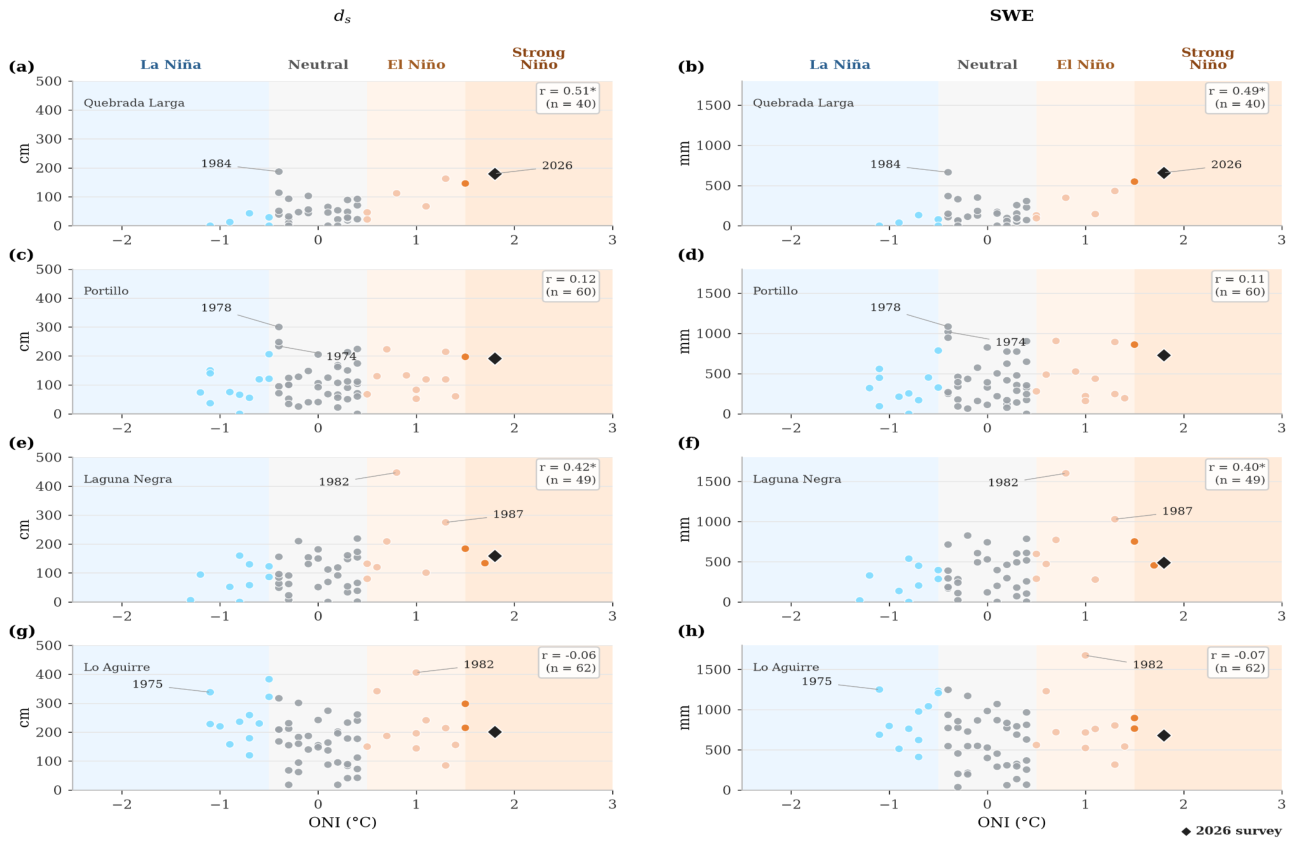
The ENSO phase was represented by the Oceanic Niño Index from NOAA’s Climate Prediction Center [16; 2026], defined as the 3-month running mean sea surface temperature anomaly in the Niño 3.4 region. Each seasonal label refers to the center month of that triplet (for example, JJA is the mean of June to August). Each snowcourse survey in the late-July series was paired with the ONI season whose center month matches the calendar month of the survey. If that ONI season was not available in the snowcourse data, we used the nearest overlapping season in a fallback list. Historical August surveys in complete years therefore remain on August centered ONI index, while 2026 August surveys are paired with July centered ONI index. For each snowcourse station we plotted late-July snowcourse ds and SWE against ONI for all eligible years and highlighted the 2026 point using the closest 2026 survey and its paired ONI value.
3. Results
3.1. Climatology and July 2026 Anomalies
During July 2026, daily ds and SWE at the five automated sites rose sharply after a dry start to the season, with the largest gains concentrated in mid-to late July (Figure 2). Compared with the day-of-year climatology, 2026 tracked above the historical range for extended periods at the higher-elevation sites (Quebrada Larga, Portillo, and Laguna Negra), whereas Termas del Flaco and Lo Aguirre showed smaller departures
Snowpack accumulation showed a high jump during the late-July episode before continuing its expansion throughout August. High elevation Portillo station recorded the largest regional totals, growing from 858 mm SWE at the end of July to a seasonal maximum of 1,191 mm SWE (285 cm ds) in late August (Figure 2). Lower elevation stations such as Termas del Flaco and Lo Aguirre also reached peak accumulation in late August (489 mm and 668 mm SWE), though their totals represented far less extreme historical departures compared to the high elevation stations.
Late-winter snowcourse conditions in 2026 were high at several routes but not uniformly record-breaking in the 31 July window series (Figure 3). Quebrada Larga reported 660 mm SWE and 180 cm ds and it was one of the highest values in the late-July snowcourse series. Laguna Negra had 491 mm SWE (159 cm ds), and Lo Aguirre 682 mm (201 cm ds), both above recent megadrought-era surveys but mid-ranked in their multi-decadal 31 July window records. Portillo’s closest 2026 survey fell on 22 August (22 days from 31 July), outside the ± 21-day rule, so 2026 is not included in the strict 31 SJuly snowcourse frequency sample, but the August route still measured 728 mm SWE (192 cm ds).
3.2. Return Periods for 2026
Window increases for automated stations were most unusual at Quebrada Larga, Portillo, and Laguna Negra (Figures 4a to 4c). At Portillo, the 2026 15-day SWE increase (798 mm) gives T ≈ 16 years (n = 8) and the 7-day increase (553 mm) T ≈ 18 years, while the 7-day ds increase (207 cm) implies T ≈ 33 yr. At Quebrada Larga and Laguna Negra, 7-day ds return periods (T ≈ 30–33 years) similarly exceeded 7-day SWE (T ≈ 11–23 years). Termas del Flaco and Lo Aguirre returned T ≈ 2–4 years (ds) and 1.5–2.5 yr (SWE), consistent with smaller gains and years of automated SWE. Daily SF over the same storm intervals (Figure 4c) showed a similar contrast, with T ≈ 20–40 years at the three high sites versus 2–5 years at Termas del Flaco and Lo Aguirre. Snowcourse results describe snowpack near peak winter, not storm rates. Quebrada Larga (660 mm SWE, 20 August) ranks 39/40 in the Jul-31 series, Laguna Negra and Lo Aguirre were high in 2026 but mid-ranked (31/48 and 29/62 by SWE).
3.3. Late-Winter Snowpack and ONI Co-Variability
Late-winter snowcourse ONI–snowpack varies strongly among snowcourses (Figure 5). Quebrada Larga and Laguna Negra exhibit positive Pearson correlations. Portillo and Lo Aguirre show weak, non-significant relationships, so ENSO co-variability with late-winter snowpack is not uniform along the study sites. Historical August surveys use JAS mean ONI when available, 2026 markers use JJA (1.8 °C) because JAS was not yet published in the CPC v6 release. In 2026, all snowcourses fell in the warm ENSO sector (El Niño). At Quebrada Larga and Laguna Negra, the 660 mm and 491 mm SWE points lie above much of the ONI–SWE cloud for comparable indices, consistent with the large July–August episode occurring during strengthening El Niño. Portillo (728 mm SWE) and Lo Aguirre (682 mm SWE) fall near the bulk of their long records despite ONI > 1.5 °C, in line with the weak local correlations.
4. Discussion
In the austral winter of 2026, the Central Chilean Andes transitioned from a dry initial season into a period of intense mid to late July snowfall (Figure 2) driven by a category 4 [27; Ralph et al., 2019] atmospheric river [15; Garreaud et al. 2026, 28; Salinas-Morales and Zambrano-Bigiarini, 2026]. Long term snowcourses show that while peak 2026 values reached levels higher than recent megadrought years, only Quebrada Larga reached near its historical maximum (Figure 3). High elevation stations like Portillo, Quebrada Larga and Laguna Negra recorded high short-window ds and SWE increases, with 7-day to 15-day return periods reaching 16 to 33 years (Figure 4). In contrast, lower elevation and southern stations like Termas del Flaco and Lo Aguirre showed lower gains, with return periods reaching 1.5 to 4 years. Furthermore, although the 2026 peak snowpack well exceeded recent drought years, only Quebrada Larga approached its historical record (Figure 3). Thus, the main feature of winter 2026 was not a uniformly record-breaking snowpack across Central Chile, but a spatially heterogeneous response to one or more intense accumulation periods.
This contrast also highlights the different information provided by ds and SWE (Figure 4) [22; Fassnacht et al., 2004]. Large increases in ds indicate rapid growth of the snowpack, whereas SWE more directly represents the amount of water stored in the snowpack. The Chilean snowpack is Maritime [29; Sturm and Liston 2021] and thus the fresh snow tends to be dense [30; Fassnacht and Soulis 2002]. Differences between their estimated return periods are therefore expected (Figure 4a versus 4b) since snow depth additionally represents snow density changes due to grain metamorphism, settling and compaction. As expected, ds and SF are quite similar (Figure 4a versus 4c). More importantly, the return periods estimated here characterize the rarity of the observed net snowpack increases. They should also be interpreted as indicators of historical rarity rather [22; Fassnacht et al., 2004] than literal recurrence intervals [26; England et al., 2019]. The automated records span only approximately 6–15 years at some stations, so fitted Pearson Type III distributions extrapolate well beyond relatively short samples for the largest events [31; Colpi 2019], a limitation in our approach. The longer period of record produces a lower return period from the snowcourse data (Figure A2), except for the 31 July evaluation at Quebrada Larga. However, these July 2026 snowfall events across Central Chile are still large for the past few decades (Figure 3 and Figure 4).
The spatial pattern observed in 2026 is broadly consistent with the heterogeneous influence of ENSO previously reported for the Central Andes [14; Cortés and Margulis 2017, 32; Poveda et al. 2020]. Positive relationships between ENSO and Andean SWE have been documented, with some of the strongest associations near 33–35°S, but substantial differences occur among locations and individual El Niño winters [14; Cortés and Margulis 2017]. Similarly, our snowcourse analysis shows positive ONI–snowpack correlations at some stations, including Quebrada Larga and Laguna Negra (Figure 5), but weak or none at others. ENSO should therefore be viewed as a large-scale climatic background that can favor wetter conditions in Central Chile rather than as a deterministic explanation for individual storms. Moisture transport, storm trajectories, atmospheric-river occurrence, freezing level, elevation, and local topographic exposure can all modulate how a given synoptic event is translated into snow accumulation [3; Cordero et al. 2024, 13; Campos and Rondanelli 2023]. The strong July 2026 increases consequently occurred during a developing El Niño, but their magnitude cannot be attributed to ENSO alone.
The importance of the 2026 accumulation is particularly apparent when placed within the recent hydroclimatic history of Central Chile. The region has experienced persistent drought conditions since approximately 2010 [6; Garreaud et al. 2020, 33; Fuentes et al. 2021, 34; Kim et al. 2022], while satellite observations show substantial decreases in Andean snow cover and persistence over recent decades [3; Cordero et al. 2024, 7; Cordero et al. 2024, 8; Saavedra et al. 2026]. A high-snow winter therefore represents an important positive anomaly within a longer-term period of reduced snow availability, but it does not by itself indicate reversal of the megadrought or recovery of regional water resources. Our observations document increased mountain snow storage relative to recent dry winters; assessing consequences for streamflow, reservoirs, groundwater, or drought recovery would require additional hydrological observations extending through the subsequent melt season.
The combination of continuous automated measurements and long-term manual snow surveys also highlights both the value and the current limitations of snow monitoring in the Central Andes. Automated ds and SWE records capture the timing and magnitude of short accumulation episodes but remain relatively short and are susceptible to sensor failures and data gaps. Snowcourses provide several decades of historical context, yet their monthly or bimonthly sampling can miss individual storm pulses and usually do not represent peak SWE [35; Bohr and Aguado 2001]. The timing of snowcourses is often not consistent [36; Pagano 2012]. The combination of the automated and manual data therefore allows the 2026 winter to be interpreted simultaneously at event and climatological scales. Expanding continuous high-elevation SWE and ds monitoring [37; Revuelto et al. 2025] would improve future estimates of extreme snow accumulation and provide a stronger basis for evaluating how events such as 2026 are evolving within a changing Andean snow regime.
Much of the globe has seen a decrease in snow cover [38; Notarnicola 2022]. This has been observed, in general, across Chile [8; Saavedra et al. 2026, 39; Dietz et al., 2025], and specifically in the northern [40; Jara et al. 2021], central [41; Carrasco-Aguilera et al. 2026], and southern [42; Pérez et al. 2018] regions. The increased snowpack across Central Chile in 2026 is particularly welcome, as this region relies on snow for agriculture [43; Clarvis and Allan 2014, 44; Valdés-Pineda et al. 2014]. The Western United States saw a record low snow year in 2026 [45; Marshall et al. 2026]; perhaps this Super El Niño [46; Witze 2026] will provide some relief to these drought conditions [47; NASA 2026, 48; Lakes Online 2026].
Plain Language Summary: El Niño means warmer sea temperature off the Pacific Coast of South America, and these can bring more precipitation to the Andes. The 2026 El Niño has seen large snowfalls across Central Chile. We used two sets of measurements with varying lengths of data to assess the rarity of the snowfall.
Author Contributions
Conceptualization, S.R.F., J.M.M., F.S.P., A.D.H.D; methodology, S.R.F., J.M.M., and F.S.P.; software, J.M.M., and J.B.T.; validation, J.M.M.; formal analysis, J.M.M., S.R.F., and J.B.T.; investigation, J.M.M., S.R.F., F.S.P., A.D.H.D., and A.W.H.; resources, J.M.M., F.S.P., and F.P.P.; data curation, J.M.M., F.P.P., and J.B.T.; writing—original draft preparation, J.M.M. S.R.F., F.S.P., and A.D.H.; writing—review and editing, J.M.M., S.R.F., F.S.P., A.D.H., J.B.T., F.P.P., A.D.H.D., and A.W.H; visualization, J.M.M., S.R.F., and J.B.T.; supervision, S.R.F., and F.S.P.; project administration, F.S.P., and S.R.F.; funding acquisition, F.S.P., and S.R.F. All authors have read and agreed to the published version of the manuscript.
Funding
This research was funded by the Chilean Agency of Research and Development (ANID), grant number ANID/IT24I0092. S.R.F. was partially funded as a Fulbright Global Scholar in October 2023 to Universidad de Playa Ancha.
Institutional Review Board Statement
Not applicable.
Informed Consent Statement
Not applicable.
Data Availability Statement
The snowcourse data are available from the Chilean Water Resources Directorate of the Ministry of Public Works [21; Ministerio de Obras Públicas]. The daily snow station data are archived online at Medina Mendoza and Caro [49; 2026]. The ONI data are available from the Climate Prediction Center [16; CPC 2026].
Conflicts of Interest
The authors declare no conflicts of interest. The funders had no role in the design of the study; in the collection, analyses, or interpretation of data; in the writing of the manuscript; or in the decision to publish the results.
Appendix A. Summary of Station Information
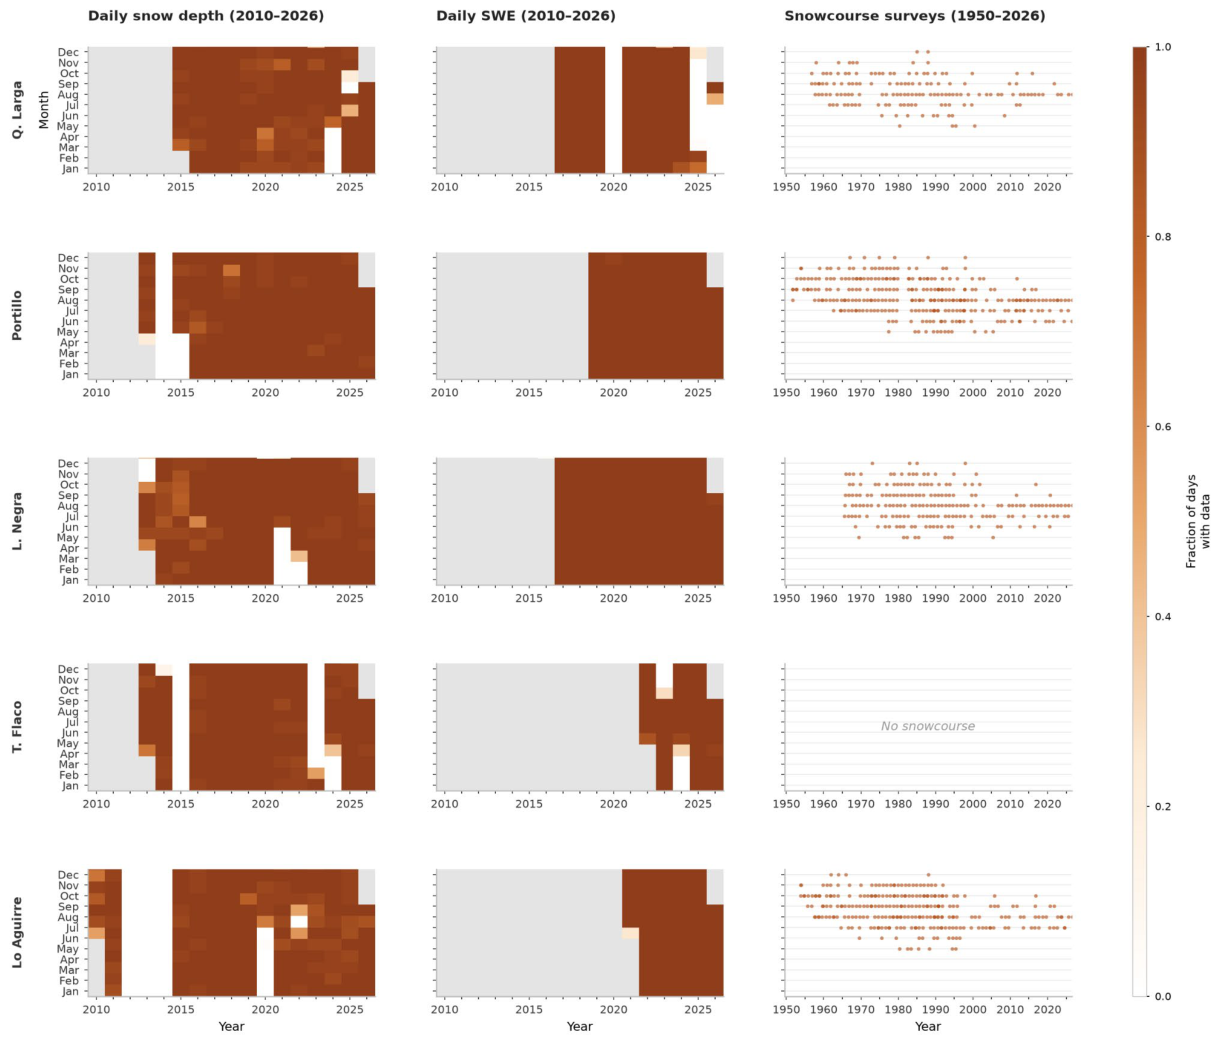
The metadata for the snowcourse and automated snow station data are summarized in Table A1. There were some missing automated snow station data (Figure A1 left and center) and also not each month had a manual snowcourse measurement (Figure A1 right).

Table A1.
Data summary of automated stations and snowcourse sites.
| Watershed | Snow Station Name | Code |
Snowcourse start |
Station ds start | Station SWE start | Latitude (deg S) | Longitude (deg W) | Elevation (m) |
| Río Limarí | Quebrada Larga (QL) | 04520006 | 1956 | 2015-03-07 | 2017-01-01 | -30.7252 | -70.2918 | 3,550 |
| Río Aconcagua | Portillo (P) | 05401007 | 1951 | 2013-04-24 | 2019-01-01 | -32.8424 | -70.0970 | 3,032 |
| Río Maipo | Laguna Negra (LN) | 05703009 | 1965 | 2013-04-10 | 2016-12-29 | -33.6659 | -70.1077 | 2,785 |
| Río Rapel | Termas del Flaco (TF) | 06020001 | - | 2013-04-09 | 2022-05-05 | -34.8930 | -70.3300 | 2,665 |
| Río Maule | Lo Aguirre (LA) | 07301000 | 1953 | 2010-06-11 | 2021-06-23 | -35.9713 | -70.5721 | 1,989 |
Figure A1.
Data availability along all analyzed stations and variables.
Appendix B. Impact of Period of Record and Distribution Function
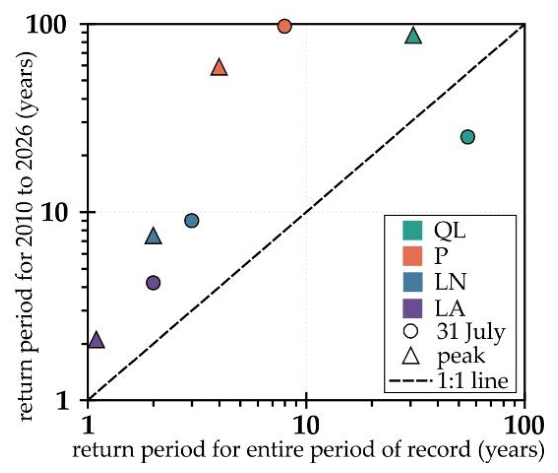
The impact of the period of record on the return interval is presented for the four snowcourse stations considering the 31 July and peak SWE (Figure A2).
Figure A2.
The return interval for the last 17 years period of record (2010 to 2026) versus the entire period of available record (see Figure A1) for the four snowcourse stations considering the 31 July and peak SWE.
Figure A2.
The return interval for the last 17 years period of record (2010 to 2026) versus the entire period of available record (see Figure A1) for the four snowcourse stations considering the 31 July and peak SWE.
References
- Masiokas, M. H.; Villalba, R.; Luckman, B. H.; Le Quesne, C.; Aravena, J. C. Snowpack variations in the central Andes of Argentina and Chile, 1951–2005: Large-scale atmospheric influences and implications for water resources in the region. J. Clim. 2006, 19(24), 6334–6352. [Google Scholar] [CrossRef]
- Saavedra, F.; Cortés, G.; Viale, M.; Margulis, S.; McPhee, J. Atmospheric rivers contribution to the snow accumulation over the southern andes (26.5 S–37.5 S). Front. Earth Sci. 2020, 8, 261. [Google Scholar] [CrossRef]
- Cordero, R.R.; Feron, S.; Damiani, A.; MacDonell, S.; Carrasco, J.; et al. Rapid decline in extratropical Andean snow cover driven by the poleward migration of the Southern Hemisphere westerlies. Sci. Rep. 2024, 14, 26365. [Google Scholar] [CrossRef]
- Condom, T.; Martínez, R.; Pabón, J.D.; Costa, F.; Pineda, L.; et al. Climatological and hydrological observations for the South American Andes: In situ stations, satellite, and reanalysis data sets. Front. Earth Sci. 2020, 8, 92. [Google Scholar] [CrossRef]
- Webb, M.J.; Winter, J.M.; Spera, S.A.; Chipman, J.W.; Osterberg, E.C. Water, agriculture, and climate dynamics in central Chile’s Aconcagua River Basin. Phys. Geogr. 2021, 42, 395–415. [Google Scholar] [CrossRef]
- Garreaud, R.D.; Boisier, J.P.; Rondanelli, R.; Montecinos, A.; Sepúlveda, H.H.; Veloso-Aguila, D. The Central Chile Mega Drought (2010–2018): A climate dynamics perspective. Int. J. Climatol. 2020, 40, 421–439. [Google Scholar] [CrossRef]
- Cordero, R.R.; Asencio, V.; Feron, S.; Damiani, A.; Llanillo, P.J.; et al. Dry-Season Snow Cover Losses in the Andes (18°–40°S) driven by Changes in Large-Scale Climate Modes. Sci. Rep. 2019, 9, 16945. [Google Scholar] [CrossRef]
- Saavedra, F.; Hernández-Duarte, A.; Caro, A.; Rabatel, A.; Fassnacht, S.R.; et al. Spatial and temporal variability of snow in the Andes using MODIS snow product 2000–2025. Front. Earth Sci. 2026, 14, 1564035. [Google Scholar] [CrossRef]
- Saavedra, F.; Kampf, S.K.; Fassnacht, S.R.; Sibold, J. A snow climatology of the Andes Mountains from MODIS snow cover data. Int. J. Climatol. 2017, 37(3), 1526–1539. [Google Scholar] [CrossRef]
- Rutllant, J.; Fuenzalida, H. Synoptic aspects of the central Chile rainfall variability associated with the Southern Oscillation. Int. J. Climatol. 1991, 11, 63–76. [Google Scholar] [CrossRef]
- Montecinos, A.; Díaz, A.; Aceituno, P. Seasonal diagnostic and predictability of rainfall in subtropical South America based on tropical Pacific SST. J. Clim. 2000, 13(4), 746–758. [Google Scholar] [CrossRef]
- Garreaud, R. D. The Andes climate and weather. Adv. Geosci. 2009, 22, 3–11. [Google Scholar] [CrossRef]
- Campos, D.; Rondanelli, R. ENSO-related precipitation variability in Central Chile: The role of large scale moisture transport. J. Geophys. Res. Atmos. 2023, 128, e2023JD038671. [Google Scholar] [CrossRef]
- Cortés, G.; Margulis, S. Impacts of El Niño and La Niña on interannual snow accumulation in the Andes: Results from a high-resolution 31 year reanalysis. Geophys. Res. Lett. 2017, 44(13), 6859–6867. [Google Scholar] [CrossRef]
- Garreaud, R.; Bozkurt, D.; Rondanelli, R. Análisis CR2 | El evento extremo 15-20 de julio 2026 en el marco de El Niño en Desarrollo. Centro de Ciencia del Clima y la Resiliencia (CR2) 2026, Universidad de Chile. Available online: https://www.cr2.cl/el-evento-extremo-15-20-de-julio-2026-en-el-marco-de-el-nino-en-desarrollo/ (accessed on 29 September 2026).
- Climate Prediction Center (CPC). Cold & Warm Episodes by Season (ERSSTv6) Oceanic Niño Index (ONI): Historical El Niño / La Niña episodes (1950–Present). Available online: https://www.cpc.ncep.noaa.gov/products/analysis_monitoring/enso/oni/v6/ (accessed on 22 September 2026).
- Caro, A.; Medina, J.; Saavedra, F.; Gimeno, F.; Huenante, J.; Masiokas, M.; ...; Romero, C. The Southern Andes Daily Snow Depth Dataset (2010–2024): Quality–Controlled Dataset from Chile and Argentina. Earth Syst. Sci. Data Discuss. 2026, 2026, 1–37. [Google Scholar] [CrossRef]
- Messtechnik, Sommer. Snow Depth Sensor USH-9. 2023. Available online: https://www.sommer.at/en/products/snow-ice/snow-depth-sensor-ush-9 (accessed on 23 September 2026).
- Messtechnik, Sommer. Laser Snow Depth Sensor LSH-10. 2023. Available online: https://www.sommer.at/en/products/snow-ice/laser-snow-depth-sensor-lsh-10 (accessed on 23 September 2026).
- Messtechnik, Sommer. Snow Scales SSG-2. 2023. Available online: https://www.sommer.at/en/products/snow-ice/snow-scales-ssg-2 (accessed on 23 September 2026).
- Gobierno de Chile; Ministerio de Obras Públicas; Dirección General de Aguas. DGASAT. Available online: https://snia.mop.gob.cl/dgasat/pages/dgasat_main/dgasat_main.htm (accessed on 23 September 2026).
- Fassnacht, S.R.; Yusuf, F.; Kouwen, N. Paralysing January 1999 snowstorms produced minimal streamflow for Southern Ontario. Can. Water Resour. J. 2004, 29(1), 1–12. [Google Scholar] [CrossRef]
- Natural Resources Conservation Service. Water and Climate Data Collection and Stewardship. U.S. Department of Agriculture. Available online: https://www.nrcs.usda.gov/resources/education-and-teaching-materials/water-and-climate-data-collection-and-stewardship (accessed on 23 September 2026).
- López-Moreno, J.I.; Leppänen, L.; Luks, B.; Holko, L.; Picard, G.; et al. Intercomparison of measurements of bulk snow density and water equivalent of snow cover with snow core samplers: instrumental bias and variability induced by observers. Hydrol. Process. 2020, 34(14), 3120–3133. [Google Scholar] [CrossRef]
- Gobierno de Chile Dirección General de Aguas. Atlas del Aqua - Chile 2016. Ministerio de Obras Públicas. 2015. Available online: https://bibliotecadigital.ciren.cl/items/5f46898c-f9e5-4d97-936b-a1e9f0dcecde (accessed on 4 September 2026).
- England, J. F., Jr.; Cohn, T. A.; Faber, B. A.; Stedinger, J. R.; Thomas, W. O., Jr.; et al. Guidelines for determining flood flow frequency—Bulletin 17C. (Techniques and Methods Book 4, Chapter B5, ver. 1.1); U.S. Geological Survey, 2019. [Google Scholar] [CrossRef]
- Ralph, F. M.; Rutz, J. J.; Cordeira, J. M.; Dettinger, M. D.; Anderson, M.; Reynolds, D.; Schick, L. J.; Smallcomb, C. A scale to characterize the strength and impacts of atmospheric rivers. Bull. Am. Meteorol. Soc. 2019, 100, 269–289. [Google Scholar] [CrossRef]
- Salinas-Morales, L.; Zambrano-Bigiarini, M. Atmospheric river over southern Chile: why the 6-9 July storm caused so much damage. Kimün-Ko (Water Resources Observatory of La Araucanía) 2026, Universidad de La Frontera, Temuco, Chile. Available online: https://kimunko.ufro.cl/en/posts/extreme-event-corral-06-09-july-2026/ (accessed on 29 September 2026).
- Sturm, M.; Liston, G.E. Revisiting the Global Seasonal Snow Classification: An Updated Dataset for Earth System Applications. J. Hydrometeor.. 2021, 22(11), 2917–2938. [Google Scholar] [CrossRef]
- Fassnacht, S.R.; Soulis, E.D. Implications during transitional periods of improvements to the snow processes in the Land Surface Scheme – Hydrological Model WATCLASS. Atmosphere-Ocean 2002, 40(4), 389–403. [Google Scholar] [CrossRef]
- Volpi, E. On return period and probability of failure in hydrology. Wiley Interdiscip. Rev. Water 2019, 6(3), e1340. [Google Scholar] [CrossRef]
- Poveda, G.; Espinoza, J.C.; Zuluaga, M.D.; Solman, S.A.; Garreaud, R.; et al. High impact weather events in the Andes. Front. Earth Sci. 2020, 8, 162. [Google Scholar] [CrossRef]
- Fuentes, I.; Fuster, R.; Avilés, D.; Vervoort, W. Water scarcity in central Chile: the effect of climate and land cover changes on hydrologic resources. Hydrol. Sci. J. 2021, 66(6), 1028–1044. [Google Scholar] [CrossRef]
- Kim, Y.; Kim, S.; Jeong, H.; An, H. Quantitatively defining megadrought based on drought events in central Chile. Geomat. Nat. Hazards Risk 2022, 13, 975–992. [Google Scholar] [CrossRef]
- Bohr, G. S.; Aguado, E. Use of April 1 SWE measurements as estimates of peak seasonal snowpack and total cold-season precipitation. Water Resour. Res. 2001, 37(1), 51–60. [Google Scholar] [CrossRef]
- Pagano, T. Quantification of the influence of snowcourse measurement date on climatic trends. Clim. Change 2012, 114, 549–565. [Google Scholar] [CrossRef]
- Revuelto, J.; Alonso-González, E.; Deschamps-Berger, C.; Gutmann, E. D.; López-Moreno, J. I. Recent Advances in Snow Monitoring from Local to Global Scales. Curr. Clim. Change Rep. 2025, 11(1), 10. [Google Scholar] [CrossRef]
- Notarnicola, C. Overall negative trends for snow cover extent and duration in global mountain regions over 1982–2020. Sci. Rep. 2022, 12, 13731. [Google Scholar] [CrossRef]
- Dietz, A.J.; Köhler, J.; Obrecht, L.; Rößler, S.; Baumhoer, C.A.; et al. Snow Cover Trends in the Chilean Andes Derived from 39 Years of Landsat Data and a Projection for the Year 2050. Remote Sens. 2025, 17, 1651. [Google Scholar] [CrossRef]
- Jara, F.; Lagos-Zúñiga, M.; Fuster, R.; Mattar, C.; McPhee, J. Snow processes and climate sensitivity in an Arid Mountain Region, Northern Chile. Atmosphere 2021, 12, 520. [Google Scholar] [CrossRef]
- Carrasco-Aguilera, V.; Mattar, C.; Fuster, R. Snow Trends in the Aconcagua River Basin Based on Remote Sensing and Reanalysis Data. Water 2026, 18, 1303. [Google Scholar] [CrossRef]
- Pérez, T.; Mattar, C.; Fuster, R. Decrease in Snow Cover over the Aysén River Catchment in Patagonia, Chile. Water 2018, 10, 619. [Google Scholar] [CrossRef]
- Clarvis, M. H.; Allan, A. Adaptive capacity in a Chilean context: A questionable model for Latin America. Environ. Sci. Policy 2014, 43(1), 78–90. [Google Scholar] [CrossRef]
- Valdés-Pineda, R.; Pizarro, R.; García-Chevesich, P.; Valdés, J. B.; Olivares, C.; et al. Water governance in Chile: Availability, management and climate change. J. Hydrol. 2014, 519 (Part C), 2538–2567. [Google Scholar] [CrossRef]
- Marshall, A. M.; Cowherd, M.; Rahimi, S.; Ye, Y. The 2026 western US snow drought was about four times more likely due to climate change. Proc. Natl. Acad. Sci. 2026, 123(30), e2612961123. [Google Scholar] [CrossRef]
- Witze, A. Are we really headed for a ‘super’ El Niño? What the science says. Nature 2026, 653, 28. Available online: https://www.nature.com/articles/d41586-026-01538-0. [CrossRef]
- NASA Earth Data. Low Water Levels in Lake Powell and Lake Mead in August 2026. Available online: https://www.earthdata.nasa.gov/news/worldview-image-archive/low-water-levels-lake-powell-lake-mead-august-2026 (accessed on 29 September 2026).
- Lakes Online. Lake Mead Water Level. Available online: https://mead.uslakes.info/Level/ (accessed on 29 September 2026).
- Medina Mendoza, J.; Caro, A. The Southern Andes Daily Snow Depth Dataset (2010–2024): Quality-Controlled Dataset from Chile and Argentina [Dataset]. Zenodo 2026. [Google Scholar] [CrossRef]
Figure 1.
Distribution of station measurements with its respective basin (see Table A1) using the same colour scheme throughout. From north to south these are: Río Limarí (station: Quebrada Larga, QL), Río Aconcagua (station: Portillo, P), Río Maipo (station: Laguna Negra, LN), Río Rapel (station: Termas del Flaco, TF), and Río Maule (station: Lo Aguirre, LA).
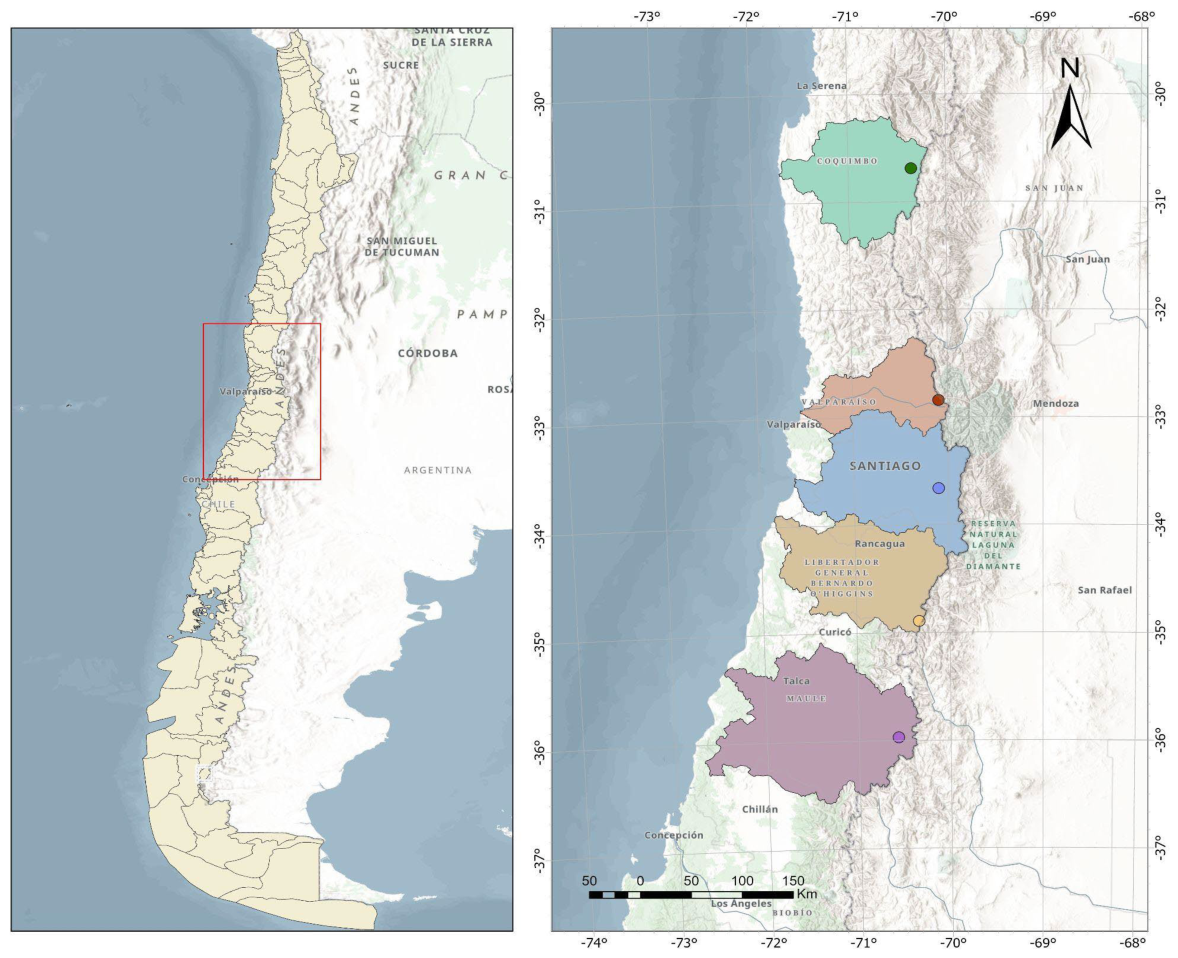
Figure 2.
Automated station daily ds and SWE climatology for the five study sites with the 5th and 95th percentiles highlighted. The left column presents ds, and the right column presents SWE. The 2026 year is denoted as the black line.
Figure 2.
Automated station daily ds and SWE climatology for the five study sites with the 5th and 95th percentiles highlighted. The left column presents ds, and the right column presents SWE. The 2026 year is denoted as the black line.
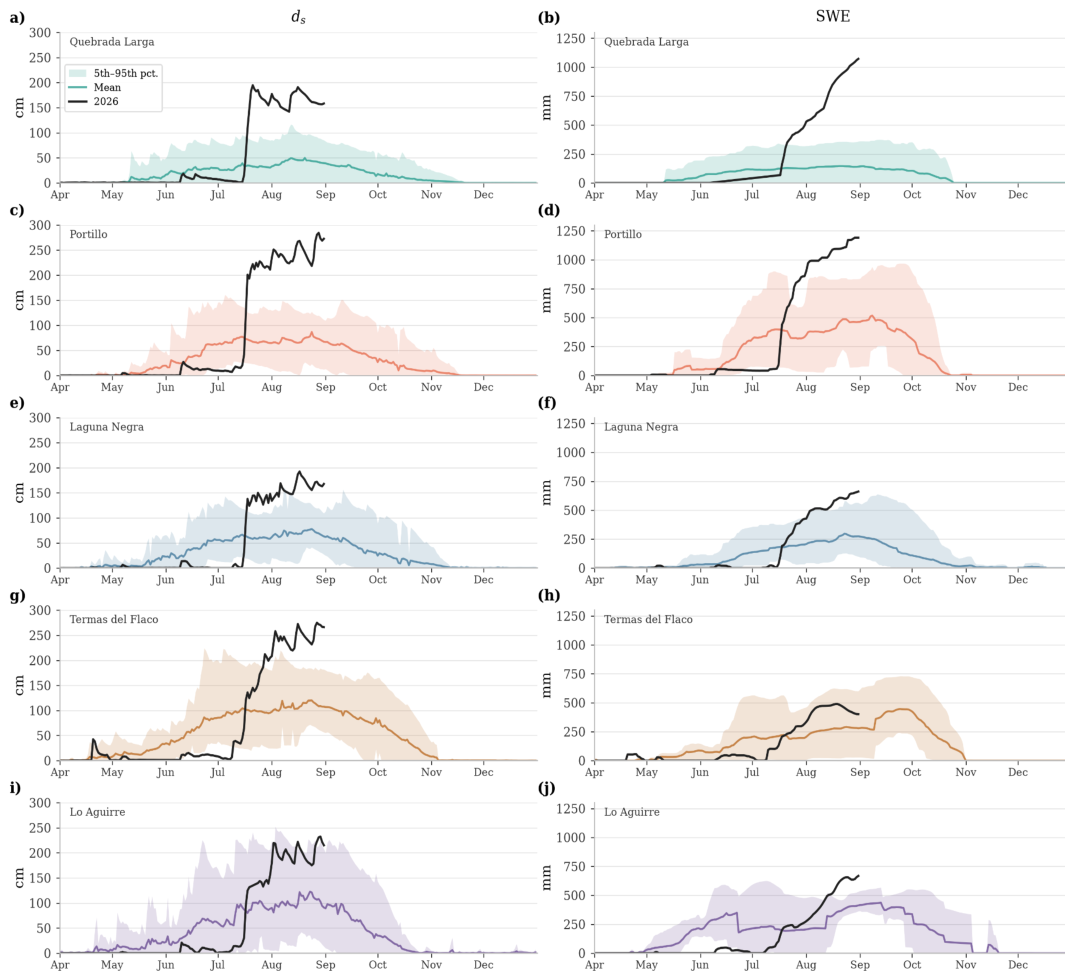
Figure 3.
Manual snowcourse ds (left column) and SWE (right column) record from 1950’s to date for this is 31 July +- 21 days (based on availability), with 2026 presented as a diamond symbol.
Figure 3.
Manual snowcourse ds (left column) and SWE (right column) record from 1950’s to date for this is 31 July +- 21 days (based on availability), with 2026 presented as a diamond symbol.
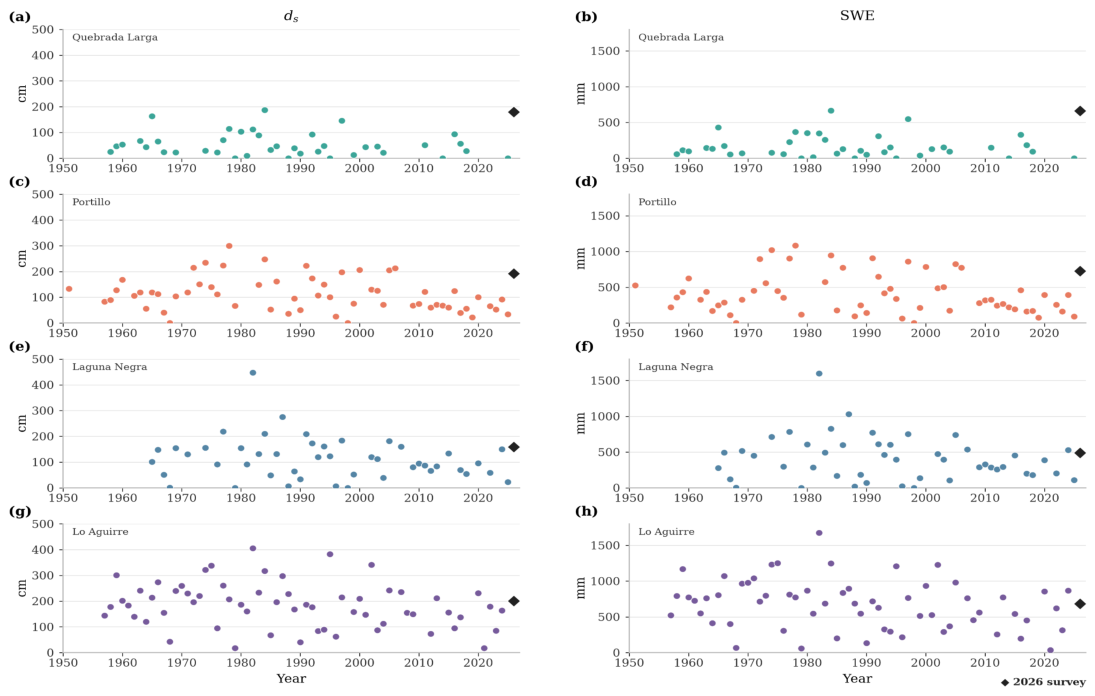
Figure 4.
Return periods using the Pearson Type III distribution from the (a) automated station snow depth for 3-day, 5-day and 7-day annual maxima, and SWE for 3-day, 5-day, 7-day and 15-day annual maxima, (b) snowcourses in late-winter with T years labeled for the analyzed stations.
Figure 4.
Return periods using the Pearson Type III distribution from the (a) automated station snow depth for 3-day, 5-day and 7-day annual maxima, and SWE for 3-day, 5-day, 7-day and 15-day annual maxima, (b) snowcourses in late-winter with T years labeled for the analyzed stations.
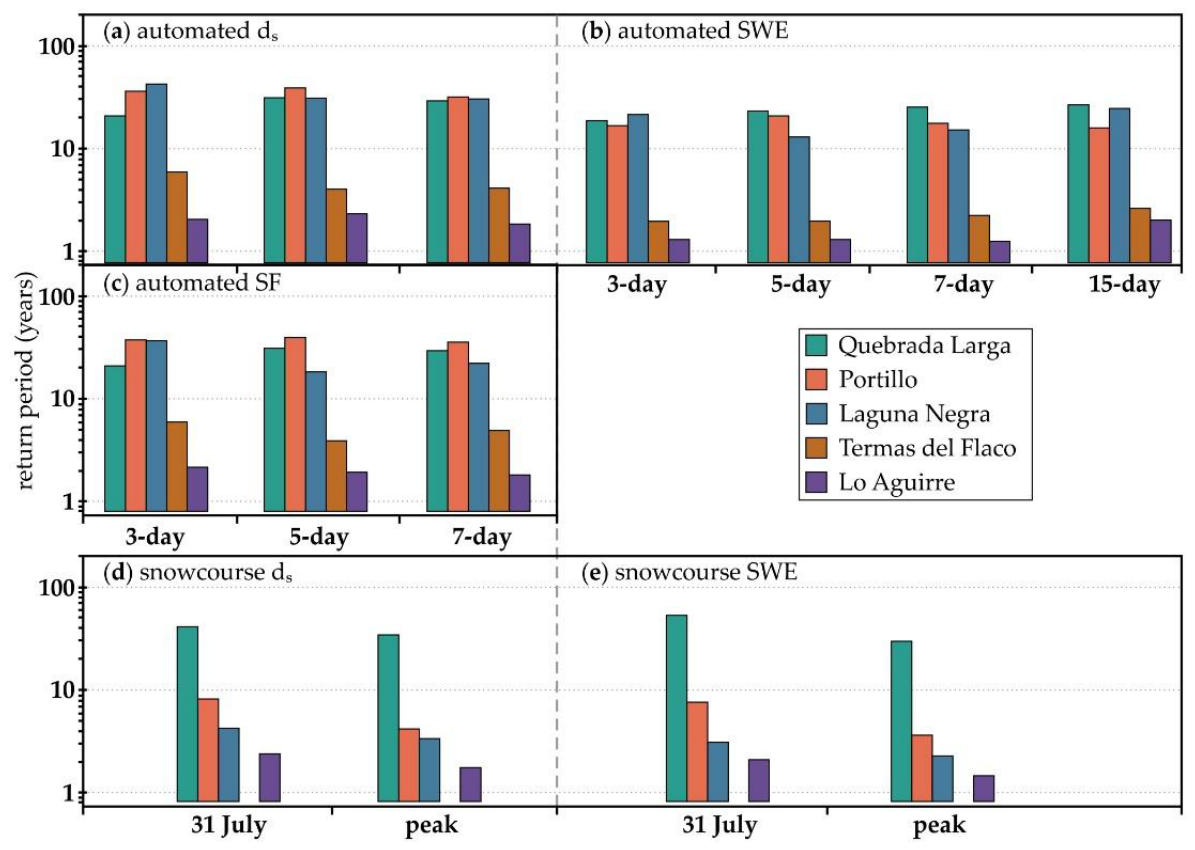
Figure 5.
Late July snowcourse depth (left column) and SWE (right column) versus ONI index for all stations, with 2026 marked as a diamond symbol and significant Pearson r values marked with *.
Figure 5.
Late July snowcourse depth (left column) and SWE (right column) versus ONI index for all stations, with 2026 marked as a diamond symbol and significant Pearson r values marked with *.
Disclaimer/Publisher’s Note: The statements, opinions and data contained in all publications are solely those of the individual author(s) and contributor(s) and not of MDPI and/or the editor(s). MDPI and/or the editor(s) disclaim responsibility for any injury to people or property resulting from any ideas, methods, instructions or products referred to in the content. |
© 2026 by the authors. Licensee MDPI, Basel, Switzerland. This article is an open access article distributed under the terms and conditions of the Creative Commons Attribution (CC BY) license.
Copyright: This open access article is published under a Creative Commons CC BY 4.0 license, which permit the free download, distribution, and reuse, provided that the author and preprint are cited in any reuse.