

Submitted:
01 October 2026
Posted:
05 October 2026
You are already at the latest version
Abstract
Prototyping is an important component of user interface development, during which key decisions are made regarding methods of information presentation and the organization of user interaction. Assessing inclusivity at this stage makes it possible to account for relevant factors before the final implementation of the interface and to adjust design decisions accordingly. The goal of the study is to develop a model for fuzzy multi-criteria assessment of the user interface inclusivity at the prototyping stage, taking into account the relative importance of factors and the preference degree of alternatives. The relative priority of factors is established by the pairwise comparison method using the Saaty scale. To demonstrate the application of the model, three different options for the interface solution at the prototyping stage are considered. For their comparison, fuzzy preference relations are formed for each factor, their intersection and weighted convolution are performed. Sets of non-dominated alternatives and the resulting membership function are determined. A structural-functional model and pseudocode of the assessment algorithm are developed. The proposed approach makes it possible to quantitatively compare prototypes based on a set of inclusivity factors and determine the optimal interface solution.
Keywords:
prototype
; user interface
; inclusivity
; multi-criteria assessment
; alternative
; factor
; fuzzy preference relation
; decision making
; model
1. Introduction
Interface prototyping is an important stage of the information systems development life cycle, which consists in transforming abstract business requirements into visual interaction models. The quality of this stage is decisive for the further success of the project. According to [1], investing in detailed prototyping allows one to identify and eliminate up to 80% of logical errors before the start of writing the code. This significantly optimizes the development budget. Errors made in the prototype architecture are scaled in the finished product and lead to rejection by users [2]. A separate challenge is the significant differentiation of the target audience of modern digital products. Users differ not only in the digital literacy level, but also in psychophysiological characteristics and the interaction context. In conditions of such heterogeneity, the basic implementation of the technical task does not guarantee the system efficiency. There is a need to apply a human-centred approach, where the priority is to adapt the interface to specific patterns of behaviour and characteristics of specific groups of people.
The modern software industry focuses not only on technological compliance with requirements, but also on the interface inclusivity, as one of the fundamental indicators of the developed product quality [3]. The United Nations Sustainable Development Goals [4] declare the need to expand opportunities for all segments of the population and promote inclusive economic growth, which is difficult to implement without creating a barrier-free digital environment. In particular, the implementation of Goal 4 (quality education) and Goal 10 (reduced inequalities) involves eliminating technical restrictions that block access to knowledge and services for vulnerable user groups.
The importance of digital product inclusivity is enshrined at the level of international law, in particular in the United Nations Convention on the Rights of Persons with Disabilities [5]. This document emphasizes the need to remove barriers to access information and communication technologies and services. That is, the accessibility of user interfaces is considered not as an additional quality characteristic, but as a prerequisite for the equal participation of people in social, educational and economic processes.
Within the framework of the Global Strategy for Digital Health [6], the World Health Organization defines digital technologies as a tool aimed at supporting equal and universal access to quality health services. At the same time, innovations must be adapted to the needs of all population groups, in particular vulnerable ones. This requires focusing the research attention on barriers that may limit access to digital services and information for certain categories of people. It should be noted that typical barriers are associated not only with technical shortcomings, but also with ignoring cognitive, sensory, and contextual principles of interaction [7].
However, the digital inequality is difficult to overcome, and currently, vulnerable groups continue to be partially excluded from digital activities [8,9]. For example, visually impaired users face significant barriers on educational or banking platforms that do not support screen readers [10,11]. Barriers for people with motor impairments are no less significant. They need the ability to navigate using a keyboard [12]. Overloaded interfaces and difficult navigation create excessive cognitive load for people with neuro-disabilities [13]. Despite the consolidation of the inclusivity principles in international standards and recommendations, in particular in [14,15,16], a significant part of modern information systems remains limitedly suitable for use by different groups of users. Studies published in recent years, for example [17,18,19,20,21], highlight significant violations of accessibility requirements. In particular, evaluations of web resources in the fields of education [17,18], finance [19,20], and e-services [21] indicate errors related to interface semantics, navigation, and interaction with assistive technologies, etc. This necessitates the transition from formal compliance with requirements to multi-criteria assessment of design solution alternatives at an early development stage, taking into account factors that determine inclusivity and the quality of user interaction with interfaces. In view of the above, the goal of the study is to develop a model for fuzzy multi-criteria assessment of the user interface inclusivity to select optimal prototypes. In this case, the importance of inclusivity factors and the preference degree of each alternative based on the set of specified factors are taken into account. Alternatives should be understood as prototypes of the user interface formed on the basis of different design solutions that are subject to comparison according to specified inclusivity factors. The main objectives of the study are: forming a system of factors that determine the user interface inclusivity; establishing the relative priority of factors based on their pairwise comparison; determining the optimal prototype based on a fuzzy preference relation; formalizing the proposed model and developing an algorithm for its implementation in the form of pseudocode.
2. Related Works
Modern research on the user interface inclusivity is aimed not only at considering individual technical requirements, but also at comprehensively taking into account the diversity of user needs, interaction methods and use context. In the work [22], a review of digital accessibility research is conducted. A bibliometric and quantitative content analysis of 410 publications is combined with a thematic analysis of 66 works. A steady increase in the number of studies is found, a significant part of which has an evaluative focus. At the same time, the results of the review indicate the thematic heterogeneity of studies covering different areas of digital interaction. The research [23] focuses on models of participatory and inclusive design for children with autism. Approaches in which users with special needs are involved in the process of designing digital solutions are analysed. The need to shift the emphasis from users’ limitations to their capabilities and needs is indicated. It is emphasized that it is advisable to consider inclusivity as a characteristic achieved during the design process, and not only as a result of the final verification of the finished software product. The work [24] is aimed at inclusive design of user interfaces taking into account the social and economic characteristics of the environment of their use. Design is considered as a multi-component and interconnected process of forming solutions. This emphasizes the need for comprehensive consideration of the conditions and needs of users during the prototype creation. In [25], a set of 13 recommendations for mobile applications focused on users who use sign language is developed and validated. The recommendations cover the integration of sign language, visual feedback, navigation, content presentation and interface characteristics. Thus, the works presented demonstrate several different approaches to the study of inclusivity. Their common feature is the consideration of the user diversity, but without taking into account the variability of design solutions.
Instead, many studies focus on selecting optimal system options, but without a direct focus on inclusivity. In particular, in [26] a model for assessing the visual design and usability of user interfaces of medical applications based on multi-criteria decision-making methods is developed. The attention is focused on the criteria of aesthetics, speed, and ease of learning. In the study [27], an approach to selecting the optimal interface using the fuzzy method of hierarchy analysis is presented. However, the proposed system of factors is focused exclusively on basic usability metrics. The studies presented indicate the development of approaches to multi-criteria selection of optimal design solutions and the possibility of using fuzzy methods to take into account the subjectivity of expert assessments. At the same time, they focus either on specific categories of users and the corresponding requirements, or on individual interface characteristics that are not related to inclusivity. In addition, despite the efficiency of machine learning for optimizing interaction [28], due to the lack of significant data sets at the prototyping stages, it is advisable to use multi-criteria assessment based on expert decisions. Thus, the development of a model for fuzzy multi-criteria assessment of the user interface inclusivity at the prototyping stage is a relevant scientific task.
3. Materials and Methods
At the prototyping stage, various options can be considered that differ in the way interface elements are implemented and how they interact with the user. In this case, there is a need to compare them according to the set of inclusivity factors. This enables informed decision-making regarding the selection of a prototype for further implementation.
To form a set of inclusivity factors for user interfaces S = {s1,s2,...,sn}, the expert assessment method is used [29,30]. Experts independently evaluated the proposed factors on a ten-point scale. The average value of the obtained scores is determined for each factor. The final set includes nine factors that receive the highest average expert scores.
It should be noted that the selection among several prototypes is difficult, because the assessment factors have different natures. Some of them can be measured quantitatively, others are assessed only qualitatively [31]. Under such conditions, it is advisable to use pairwise comparison of alternatives, which allows establishing the degree of superiority of one prototype over another for each factor. For quantitative representation of such degree of superiority, values from the interval [0;1] are used with subsequent presentation of the results in numerical form [32,33,34].
On the set of alternatives X, a weak preference relation Ris set. The study considers three alternative variants of prototypes, which is sufficient for making managerial decisions, since such iterations can be repeated. For any alternatives x,y ∈ X, one of the following conditions is met: the alternative x is not inferior to y; the alternative y is not inferior to x; or the alternatives are incomparable.
One can distinguish between weak and strict preference. A weak preference relation R means that one alternative is not worse than the other. A strict preference R occurs when x > y, but the condition y > x is false. If both alternatives have the same preference level according to all criteria, they are considered equivalent. A clear distinction between these types of relations is necessary for the correct operation of the decision-making algorithm [35,36,37].
To formalize the procedure for selecting alternatives, it is advisable to use utility functions [34,38]. They allow one to quantitatively assess the preference level of each option. Let a utility function rj(x) be defined for each factor, which characterizes the compliance degree of the alternative with the established requirements. In this case, the alternative with a higher value of the utility function is considered to be more prioritized according to the corresponding factor. If there is a strict preference between the alternatives, then the condition is fulfilled under which one alternative outperforms the other according to the specified efficiency indicators. Formally, this means that for alternatives x and y the values of the utility function satisfy the relation rj(x) > rj(y). Based on this, a clear preference relation is formed on the set of alternatives:
Rj = {(x,y):rj(x) ≥ rj(y),x,y ∈ X}
The above relation shows that the alternative x is not worse than the alternative y by the factor j. If the inequality is strict, then one can indicate the dominance of one alternative over the other.
When selecting the optimal solution, special attention is paid to alternatives for which it is impossible to improve at least one criterion without simultaneously worsening the other. In other words, it is the most balanced one among all permissible solutions. To determine such an alternative, it is necessary to find the element x0 ∈ X, which has the highest utility scores for the entire set of factors:
rj(x0) ≥ rj(y), ∀j = 1,n; ∀y ∈ X
For further analysis of the formed set, the criteria convolution is performed into a single scalar indicator. This procedure is necessary to obtain a generalized assessment of each alternative and to ensure the possibility of their final ranking. The study uses the intersection method [39,40,41] for this purpose, which allows taking into account the influence of all factors. The intersection method is based on determining the common area of permissible values. Preference is given to alternatives that demonstrate the best consistency across the entire set of factors. Unlike methods in which the dominance of one criterion can compensate for the low values of others, the intersection method is focused on achieving a compromise and balanced result. As a result, the multi-criteria problem is reduced to a single-criteria model, where each alternative corresponds to an integral assessment.
Suppose the preference relation is . Then the set of isolated options X = {x1, ..., xn} is described by the preference relation G1, formed on the basis of a set of partial relations Rj, which correspond to separate assessment criteria and utility functions rj(x).
The construction of a set of non-dominated alternatives by a fuzzy preference relation G1 is performed by intersection of the relations Rj, where (j = 1,n). The result takes into account only those alternatives that simultaneously satisfy the preference conditions. To formalize the procedure, the membership function μj(x,y) is used, which characterizes the preference degree of the alternative x over the alternative y within rj. The function takes on the value 1 if the alternative x is not inferior to the alternative y, and the value 0 in the opposite case. The condition can be written as follows:
Based on the membership functions of individual factors, a convolution membership function G1 is formed. Its value is determined as a minimum among all membership functions corresponding to individual assessment factors:
If at least one factor does not satisfy the preference condition, the integral score is also reduced. This avoids the situation where high values of some factors compensate for critically low scores of others. To take into account the different importance of the inclusivity factors of user interfaces, weight coefficients wj are introduced. Based on these weights, a generalized indicator of the criteria convolution is formed:
That is, factors with larger weight coefficients have a stronger influence on the final assessment result. In addition to the intersection, a convolution of the original relations G2 is also formed, which is based on the weight values of the factors and the corresponding utility functions:
The final value is formed as the sum of weighted estimates for each factor. Normalization of weight coefficients ensures the correctness of calculations and preservation of the proportional influence of factors on the final result.
Membership functions for the convolution G2 are defined in a similar way:
Summarizing the above, one can see that the assessment of alternatives is carried out on the basis of fuzzy preference relations formed for each of the identified factors. For the set of alternatives X = {x1,x2,x3}, relations Rj are given that characterize the preference level of alternatives for individual factors.
To determine non-dominated alternatives, the membership function is used:
The above expression allows one to assess the non-domination degree for each alternative. The larger the value of the membership function is, the higher the efficiency of the corresponding option is within the set of permissible solutions.
Based on the formed relation G2, the set of non-dominated alternatives is determined:
To finally select the optimal solution, the intersection of the sets of non-dominated alternatives formed for the relations and is performed:
The membership function of the joint set is defined as the minimum value of the membership functions for both convolutions:
Therefore, the final selection of the optimal alternative is made according to the maximum value of the membership function . This allows combining the preferences of the intersection of criteria and additive convolution, ensuring objective and mathematically justified decision-making in multi-criteria assessment.
4. Experiment, Results and Discussion
At the first stage of the experimental study, a set of factors is formed that determine the user interface inclusivity. The set of factors has the form: S = {s1,s2,s3,s4,s5,s6,s7,s8,s9}, where s1is compliance with standards; s2is language simplicity; s3 is no time pressure; s4 is display settings; s5is mouse-free control; s6 is multimodal content; s7 is voice control support; s8 is resistance to unintentional user actions; s9 is support for screen readers.
To further compare alternatives, it is necessary to formalize the relationship between the set of user interface inclusivity factors and their corresponding fuzzy preference relations. Each of the nine identified factors will be directly associated with a fuzzy preference relation, which is denoted as Ri, where (i = 1,2,...,9). The main mathematical requirement when assessing alternatives is that the total percentage value of one factor for all alternatives together cannot be greater than 100%. The main combinations of share distribution are shown in Figure 1.
The results of assessing alternatives based on user interface inclusivity factors are presented in Table 2.
Based on Table 1, fuzzy preference relations are formed for each of the analysed alternatives X = {x1,x2,x3}:
- (compliance with standards) — x1 > x3, x3 > x2;
- (language simplicity ) — x1 > x2, x2 = x3;
- (no time pressure) — x1 > x3, x2 > x1;
- (display settings) — x1 = x2, x2 > x3;
- (mouse-free control) — x1 < x2, x3 < x1;
- (multimodal content) — x1 > x2, x3 > x1;
- (voice control support) — x1 > x2, x2 = x3;
- (resistance to unintentional user actions) — x1 > x2, x3 > x1;
- (support for screen readers) — x1 > x2, x2 = x3.
For further assessment of alternatives, a system of matrices of preference relations for the studied factors is formed. Each matrix represents the results of a pairwise comparison of alternatives for a separate factor and allows determining the dominance degree of one option over another. The preference relation is presented in binary form. The value 1 means the presence of preference of one alternative over another for the corresponding factor. The value 0, on the contrary, indicates the absence of preference or failure to fulfil the dominance condition [37,42]. Matrices that show the preference relations for the analysed factors are presented in the form of a table for convenience (Table 2).

Table 2.
Matrixes of preference relations of alternatives by factors.
| Membership functions | xi/xj | x1 | x2 | x3 |
|---|---|---|---|---|
| x1 | 1 | 1 | 1 | |
| x2 | 0 | 1 | 0 | |
| x3 | 0 | 1 | 1 | |
| x1 | 1 | 1 | 1 | |
| x2 | 0 | 1 | 1 | |
| x3 | 0 | 1 | 1 | |
| x1 | 1 | 0 | 1 | |
| x2 | 1 | 1 | 1 | |
| x3 | 0 | 0 | 1 | |
| x1 | 1 | 1 | 1 | |
| x2 | 1 | 1 | 1 | |
| x3 | 0 | 0 | 1 | |
| x1 | 1 | 0 | 1 | |
| x2 | 1 | 1 | 1 | |
| x3 | 0 | 0 | 1 | |
| x1 | 1 | 1 | 0 | |
| x2 | 0 | 1 | 0 | |
| x3 | 1 | 1 | 1 | |
| x1 | 1 | 1 | 1 | |
| x2 | 0 | 1 | 1 | |
| x3 | 0 | 1 | 1 | |
| x1 | 1 | 1 | 0 | |
| x2 | 0 | 1 | 0 | |
| x3 | 1 | 1 | 1 | |
| x1 | 1 | 1 | 1 | |
| x2 | 0 | 1 | 1 | |
| x3 | 0 | 1 | 1 |
After forming matrices of fuzzy preference relations for each of the studied factors, their combination into a single integral relation G1 is performed. The convolution is formed by intersection of partial preference relations (Table 3). This allows taking into account the simultaneous influence of all factors on the result of assessing alternatives. That is, only those options that are not inferior to others in terms of the totality of factors are singled out. Thus, G1 = R1 ∩ R2 ∩ R3 ∩ R4 ∩ R5 ∩ R6 ∩ R7 ∩ R8.
Based on the constructed matrix of the convolution of relations (Table 3) and in accordance with expression (8), the membership functions of non-dominated alternatives are determined. For each alternative, its dominance degree relative to other options of the set X is assessed:
To take into account the weight coefficients of factors, a convolution of relations G2 is additionally formed. In this case, the membership functions are defined as the sum of the weight values of the partial preference relations for each pair of alternatives. For this, the expression (7) is used:
- Determining the membership function for a pair of alternatives (x1,x2):
- For a pair of alternatives (x1,x3):
- For a pair of alternatives (x2,x1):
- For a pair of alternatives (x2,x3):
- For a pair of alternatives (x3,x1):
- For a pair of alternatives (x3,x2):
The obtained membership functions for the convolution G2 are used to further determine the set of non-dominated alternatives according to expression (9) and to isolate the optimal solution:
After substituting the obtained values of the membership functions into the expression for determining non-dominated alternatives (12), the membership degree of each alternative to the set is calculated. For each option, the maximum difference between the direct and inverse preference relations is assessed:
Therefore, the final values of the membership functions for the set have the following form:
For further calculations, it is necessary to determine the weight values of the factors based on the matrix of their pairwise comparisons. For this purpose, a pairwise comparison matrix is formed. That is, each factor is sequentially compared with the others in terms of importance. The Saaty relative importance scale is used to conduct pairwise comparisons [43]. This scale allows one to determine the dominance degree of one factor over another using a nine-point assessment system. Value 1 corresponds to the equal importance of two factors. Value 3 characterizes a moderate preference of one factor, 5 shows a significant preference, 7 is a strong preference, and 9 is an absolute dominance of one factor over another. The paired values 2, 4, 6 and 8 are used as intermediate estimates between the main importance levels. The inverse values are used for inverse comparisons. The developed pairwise comparison matrix is presented in the form of a table (Table 4).
The components of the vector V(v1,v2,...,vn)characterize the relative importance of each factor within the formed system. The value of each component is determined as the geometric mean of the elements in the corresponding row of the pairwise comparison matrix [44,45]:
where n is a number of matrix elements; aij denotes an element of the pairwise comparison matrix that characterizes the preference degree of the factor i over the factor j.
The obtained values of the components of the main eigenvector are further used to calculate the normalized weight coefficients of the factors. The normalized vector Vn is formed by dividing each component by the sum of all the obtained values. As a result, the weight coefficients acquire a relative form, and their sum is equal to one. In this case, each value of the vector Vn represents the influence degree of the corresponding factor on the overall result of selecting an alternative.
To further check the consistency of expert assessments, an auxiliary vector is formed by multiplying the pairwise comparison matrix by the normalized weight vector. The obtained components are used to determine the approximate value of the main eigenvalue of the matrix λmax. The value λmax is calculated as the arithmetic mean of the elements of the corresponding vector. The consistency of the pairwise comparison matrix is assessed by the consistency index IU and the consistency ratio VU. The consistency index characterizes the deviation level of expert assessments from a fully consistent state. The smaller the value IU is, the higher the consistency level of the formed pairwise comparison matrix is. This index is determined as follows [46,47]:
The reference value of the random index VI depends on the number of factors used in the pairwise comparison matrix. For the matrix of the ninth order, the reference value of the random index is 1.45 [47].
The consistency checking is performed by comparing the calculated consistency index IU with the corresponding value of the random index VI. The pairwise comparison matrix is considered consistent if the condition IU < 0,1 × VI is met. Additionally, the consistency ratio VU is determined [46,47]:
VU = IU/VI.
The obtained results of pairwise comparisons can be considered acceptable under the following condition: VU ≤ 0,1. Fulfilment of the above condition indicates the correctness of expert assessments and an acceptable consistency level of the formed pairwise comparison matrix.
As a result of calculating the vectors of the pairwise comparison matrix, the following factor weights are obtained:
After checking the pairwise comparison matrix, the value of the principal eigenvalue λmax = 9,4, the consistency index IU = 0,05 and the consistency ratio VU = 0,035 are obtained. The consistency condition is checked, taking into account that the reference value of the random index for nine factors is VI = 1,45: 0,1 × VI = 0,1 × 1,45 = 0,145. The consistency condition is met, as long as IU = 0,05 < 0,145. Additionally, the value of the consistency ratio is checked: VU = 0,035 < 0,1. The obtained value also does not exceed the permissible threshold level. This indicates a sufficient level of consistency of expert assessments and the correctness of the formed pairwise comparison matrix. Next, the values of the factor weights are substituted into the expressions for calculating the membership functions of the pairs of analysed alternatives based on the matrices presented in Table 2. It is obtained: The obtained values of the convolution membership functions G2 are presented in the form of a matrix of relations (Table 5). The elements of the matrix represent the preference degree of one alternative over another, taking into account the weight coefficients of the factors under study.
Based on the formed matrix of membership functions, subsets of non-dominated alternatives for the relation G2 are determined. For each alternative, the degree of its superiority over other options is assessed, taking into account the weighted convolution of the factors under study.
According to expressions (10), (11) the resulting function is as follows: The obtained values of the membership functions show that the highest level of dominance is possessed by the alternative x1. The value of the membership function for this alternative is equal to 1, which indicates the absence of dominance by other options according to the integral assessment. The alternative x2 received an average membership level, while for the alternative x3 the value of the membership function is the smallest.
Based on the proposed approach, a model for fuzzy multi-criteria assessment of the user interface inclusivity at the prototyping stage is developed. The model combines the formation of a set of inclusivity factors, determination of their relative priority, construction of fuzzy preference relations for prototypes and integral assessment of the obtained alternatives. The sequence of interconnected stages of the model is shown in Figure 2.
To formalize the sequence of operations and ensure the reproducibility of the proposed approach, a pseudocode of the fuzzy multi-criteria assessment algorithm (Algorithm 1) is developed.
| Algorithm 1: Fuzzy multi-criteria assessment of user interface inclusivity |
| Input: A set of inclusivity factors S, a set of alternatives (prototypes) XOutput: The value of the resulting membership function |
| 1: Start 2: To assess the alternatives xi for each factor sj 3: To form fuzzy preference relations Rj for each alternative xi 4: for each factor j from 1 to n do 5: To construct a matrix of preference relations of alternatives 6: if one alternative is not worse than the other then 7: To set the value of the preference relation in the matrix equal to 1 8: else 9: To set the value of the preference relation in the matrix equal to 0 10: end if 11: end for 12: To construct a pairwise comparison matrix of factors Aon a scale of relative importance 13: To determine the weight coefficients of factors wj based on the matrix of their pairwise comparisons A 14: To check the consistency of expert assessments by the index IU and the ratio VU 15: To aggregate the ratio and perform integral assessment 16: for each pair of alternatives do 17: To calculate the convolution of relations G1 by the method of intersection of partial relations 18: To calculate the weighted convolution of relations G2 taking into account the weight coefficients wj 19: end for 20: To determine the membership function of non-dominated alternatives based on the convolution of relations G1 21: To determine the membership function of non-dominated alternatives based on weighted convolution of relations G2 22: To find the intersection of sets of non-dominated alternatives Gnd 23: To calculate the membership function of the joint set for each alternative 24: To select the optimal prototype by the maximum value of the membership function of the joint set 25: End |
The conducted research makes it possible to form an approach to assessing the user interface inclusivity at the prototyping stage, taking into account a set of main factors. At the same time, the main factors of the user interface quality based on expert assessment include the following: compliance with standards, language simplicity, no time pressure, display settings, mouse-free control, multimodal content, voice control support, resistance to unintentional user actions, support for screen readers. The formed set of factors covers the main interface characteristics, which determine the capabilities of different user groups to perceive information and interact with the system. Compliance with standards is associated with compliance with formalized interface requirements [48], language simplicity deals with the use of understandable vocabulary and a clear text structure [25], no time pressure is connected with ensuring sufficient time to perform operations [49], and display settings deals with the ability to adapt the visual parameters of the interface to the individual needs of the user [11]. Mouse-free control provides an alternative way of interaction, in particular keyboard navigation [50], while multimodal content and voice control expand the available channels of input and perception of information [51,52]. Resistance to unintentional user actions is associated with the prevention of errors, confirmation of potentially dangerous actions and the possibility of their cancellation [53], and support for screen readers is associated with the correct presentation of the structure and elements of the interface for users with visual impairments [54]. The combined consideration of factors makes it possible to present the interface inclusivity as a multifactorial characteristic. In this case, individual factors may have a different role in forming the final result, which is taken into account when determining their weight coefficients. Checking the consistency of the pairwise comparison matrix (Table 4) confirms the acceptability of the obtained weight values. For the ninth-order matrix λmax = 9,4, the consistency index IU = 0,05and consistency ratio VU = 0,035 are determined. Verification of the obtained values provides grounds for using the determined weights at the next stage of calculations.
To demonstrate the operation of the proposed model, three alternative user interface prototypes are considered X = {x1,x2,x3}. The need to compare them arises in cases where several options for interface solutions are formed at the prototyping stage and it is necessary to determine the best option in terms of inclusivity. These options are used as an example for calculations, so their specific content may vary depending on the project task.
For each of the three prototypes, an assessment is carried out for all the formed inclusivity factors (Table 1). Based on the obtained assessment, a pairwise comparison of the prototypes for each factor is performed and the corresponding fuzzy preference relations are formed. The values of these relations are presented in the form of binary matrices (Table 2). The formed relations for individual factors are combined by the intersection method in the convolution G1. Then, to take into account the different relative importance of the factors, the determined weight coefficients are used and a weighted convolution G2 is formed. The membership degrees of the prototypes to the set of non-dominated alternatives are determined by expressions (8) and (9). The final assessment is obtained by intersection G1 and G2 according to (10). According to the results of the calculations, the prototype x1 receives the highest value of the resulting membership function 1, while for x2 and x3 the corresponding values are 0.741 and 0.123. Therefore, x1 is optimal among the three prototypes considered in terms of inclusivity. That is, the proposed model not only provides an orderly result, but also quantitatively reflects the difference between the alternatives.
In addition to obtaining quantitative assessment of alternatives, the work presents a developed structural-functional model (Figure 2). It represents the sequence of the main stages of assessment: construction of the preference relations of alternatives, their aggregation and integral assessment and selection of the prototype by the resulting values of the membership function. To ensure the reproducibility of the sequence of calculations, an algorithm is developed in the form of pseudocode. It formalizes the order of operations from assessing alternatives by individual factors to determining the prototype with the maximum value of the resulting membership function.
5. Conclusions
A set of nine factors characterizing the interface inclusivity is defined in the work. Their relative priority is determined based on pairwise comparison and the corresponding weight coefficients are calculated. Fuzzy preference relations of prototypes for each factor are constructed, their aggregation is performed taking into account the cumulative influence of factors and their relative priority. The membership degrees of prototypes in sets of non-dominated alternatives are determined and the resulting values of the membership function for the three prototypes considered are obtained: 1, 0.741 and 0.123, respectively. This makes it possible to determine the optimal option of the interface solution based on the set of inclusivity factors.
A structural-functional model for fuzzy multi-criteria assessment is developed and the sequence of its implementation is formalized in the form of pseudocode. The proposed approach can be applied at the prototyping stage in cases where several variants of the interface solution are formed and it is necessary to compare them according to a set of inclusivity factors. This makes it possible to take into account inclusivity when selecting a design solution even before the final implementation of the interface.
The practical significance of the obtained results lies in the possibility of applying the proposed approach when selecting an interface option even before its final implementation. The comparison of prototypes makes it possible to take into account inclusivity when forming an interface solution and compare alternatives according to a single system of factors. This can be useful in situations where several prototypes have a similar functional basis, but differ in the ways of presenting information and organizing interaction.
At the same time, the proposed approach has certain limitations. The assessment of the user interface inclusivity is carried out using nine predefined factors. In addition, the proposed model compares only three alternative prototypes. The determination of the relative importance of factors is based on expert judgments, which determines the dependence of the obtained weight values on expert assessments.
It is advisable to direct further research to testing the model on a larger number of prototypes with the possibility of dynamically modifying factors. It is also promising to compare the assessments obtained at the prototyping stage with the results of the assessment of the corresponding implemented interfaces. This will make it possible to determine to what extent the results of early assessment represent the characteristics of the interface at the subsequent stages of its development.
Author Contributions
Conceptualization, A.K. and I.P.; methodology, I.P.; software, U.M. and A.K.; validation, L.S., N.L. and M.V.; formal analysis, L.S.; investigation, M.V.; resources, N.L.; data curation, I.P.; writing—original draft preparation, A.K.; writing—review and editing, I.P. and N.L.; visualization, U.M.; supervision, L.S.; project administration, U.M. and M.V.; funding acquisition, I.P., N.L., L.S. and A.K. All authors have read and agreed to the published version of the manuscript.
Funding
This research received no external funding.
Data Availability Statement
The raw data supporting the conclusions of this article will be made available by the authors on request.
Conflicts of Interest
The authors declare no conflicts of interest.
References
- Alshamari, M. Usability factors assessment in health information system. Intell. Inf. Manag. 2016, 8, 170–180. [Google Scholar] [CrossRef]
- Parente da Costa, R.; Dias Canedo, E. A set of usability heuristics for mobile applications. Lect. Notes Comput. Sci. 2019, 11566, 180–193. [Google Scholar] [CrossRef]
- Kristić, M.; Zakarija, I.; Škopljanac-Mačina, F.; Car, Ž. Machine learning for adaptive accessible user interfaces: overview and applications. Appl. Sci. 2025, 15(23), 12538. [Google Scholar] [CrossRef]
- Take action for the sustainable development goals. URL: https://www.un.org/sustainabledevelopment/sustainable-development-goals.
- Convention on the rights of persons with disabilities and optional protocol. URL: https://www.un.org/disabilities/documents/convention/convoptprot-e.pdf.
- Global strategy on digital health 2020–2027. URL: https://www.who.int/publications/i/item/9789240116870.
- Pascual Almenara, A.; Sayago Barrantes, S. Towards designing a set of usability and accessibility heuristics focused on cognitive diversity: an exploratory case study with generative artificial intelligence. Information 2024, 15(12), 769. [Google Scholar] [CrossRef]
- Pérez-Escolar, M.; Canet, F. Research on vulnerable people and digital inclusion: toward a consolidated taxonomical framework. Univers. Access Inf. Soc. 2023, 22(3), 1059–1072. [Google Scholar] [CrossRef] [PubMed]
- Longoria, I. A.-I.; Bustamante-Bello, R.; Ramírez-Montoya, M. S.; Molina, A. Systematic mapping of digital gap and gender, age, ethnicity, or disability. Sustainability 2022, 14(3), 1297. [Google Scholar] [CrossRef]
- Sunitha, R.; Supreeth, D. E-learning accessibility: barriers and solutions for inclusive online education. J. Inform. Educ. Res. 2024, 4(3), 3835–3842. [Google Scholar] [CrossRef]
- Peixoto, S.; Martins, N.; Miranda, D.; Matos, D.; Carvalho, V. The design process in the development of an online platform for personalizing wearable prostheses: a preliminary approach. Designs 2025, 9(2), 39. [Google Scholar] [CrossRef]
- Serra, P.; Oliveira, Â.; Fidalgo, F.; Serra, B.; Infante, T.; Baião, L. Empirical evidence of AI-enabled accessibility in digital gastronomy: development and evaluation of the receitas +power platform. Gastronomy 2026, 4(1), 2. [Google Scholar] [CrossRef]
- ISO/IEC 25010:2023. Systems and software engineering. Software quality requirements and evaluation (SQuaRE). Quality model. International Organization for Standardization, 2023. 22 p.
- ISO 9241-110:2020. Ergonomics of human-system interaction. Part 110: Interaction principles. International Organization for Standardization. 2020. 32 p. 32 p.
- Web content accessibility guidelines (WCAG) 2.1. URL: https://www.w3.org/Translations/WCAG21-ua/.
- Alayed, A. Are Saudi Arabian banks’ mobile applications accessible for blind or partially sighted users?: a customers’ perspective and evaluation. Univers. Access Inf. Soc. 2025, 24, 585–606. [Google Scholar] [CrossRef]
- Singh, U.; Divya Venkatesh, J.; Muraleedharan, A.; Saluja, K. S. J.H. A.; Biswas, P. Accessibility analysis of educational websites using WCAG 2.0. Digit. Gov. Res. Pract. 2024, 5(3), 1–28. [Google Scholar] [CrossRef]
- Ogbuju, E.; Ihinkalu, O.; Ajulo, E.; Jaiyeoba, O.; Yemi-Peters, V. Evaluation of university websites in Nigeria using the web content accessibility guidelines. J. Comput. Theor. Appl. 2023, 1(2), 174–187. [Google Scholar] [CrossRef]
- Hassan, A.; Abd El Aziz, R.; Hamza, M. Internet banking accessibility: the social and financial exclusion of people with visual disability. 31st International Conference on Computer Theory and Applications (ICCTA) 2021, 59–65. [Google Scholar] [CrossRef]
- Nour, R. An assessment of accessibility and usability of Saudi Online FinTech services for people with disabilities. Comput. Math. Methods Med. 2022, 1, 8610844. [Google Scholar] [CrossRef] [PubMed]
- Ma, L.; Zheng, Y. National e-government performance and citizen satisfaction: a multilevel analysis across European countries. Int. Rev. Adm. Sci. 2019, 85(3), 506–526. [Google Scholar] [CrossRef]
- Ha, S.; Kim, S. Digital accessibility research from 1997 to 2024: A triangulated review and conceptual framework. Telemat. Inform. 2026, 102394. [Google Scholar] [CrossRef]
- Ferreira, R.d.S.; Castro, T.H.C.d. Participatory and inclusive design models from the perspective of universal design for children with autism: A systematic review. Educ. Sci. 2024, 14, 613. [Google Scholar] [CrossRef]
- Méhat, Y.; Sagot, S.; Ostrosi, E.; Deuff, D. A multi-process system for investigating inclusive design in user interfaces for low-income countries. Algorithms 2024, 17, 232. [Google Scholar] [CrossRef]
- Fuentes-Cortázar, A.E.; Rojano-Cáceres, J.R. A validated design guideline for mobile applications grounded in the participation of deaf users for accessible development. Computers 2026, 15, 278. [Google Scholar] [CrossRef]
- Gupta, K.; Roy, S.; Poonia, R.C.; Kumar, R.; Nayak, S.R.; Altameem, A.; Saudagar, A.K.J. Multi-criteria usability evaluation of mHealth applications on type 2 diabetes mellitus using two hybrid MCDM models: CODAS-FAHP and MOORA-FAHP. Appl. Sci. 2022, 12, 4156. [Google Scholar] [CrossRef]
- Muhammad, A.; Siddique, A.; Naveed, Q.N.; Khaliq, U.; Aseere, A.M.; Hasan, M.A.; Qureshi, M.R.N.; Shahzad, B. Evaluating usability of academic websites through a fuzzy analytical hierarchical process. Sustainability 2021, 13, 2040. [Google Scholar] [CrossRef]
- Nazarkevych, M.; Lotoshynska, N.; Hrytsyk, V.; Havrysh, B.; Vozna, O.; Palamarchuk, O. Design of biometric system and modeling of machine learning for entering the information system. 2021 IEEE 16th International Conference on Computer Sciences and Information Technologies (CSIT), Lviv, Ukraine, 2021, 225–230. [CrossRef]
- Göktürk, M. An interface evaluation model for usability and perceived security. IEEE Access 2025, 13, 91989–92007. [Google Scholar] [CrossRef]
- Cadham, C. J.; Knoll, M.; Sánchez-Romero, L. M.; et al. The use of expert elicitation among computational modeling studies in health research: A systematic review. Med. Decis. Mak. 2022, 42(5), 684–703. [Google Scholar] [CrossRef] [PubMed]
- Senkivskyy, V.; Babichev, S.; Pikh, I.; Kudriashova, A.; Senkivska, N.; Kalynii, I. Forecasting the reader’s demand level based on factors of interest in the book. In Proceedings of the CIT-Risk’2021: 2nd International Workshop on Computational & Information Technologies for Risk-Informed Systems, Kherson, Ukraine, 16–17 September 2021; pp. 176–191. Available online: https://ceur-ws.org/Vol-3101/Paper12.pdf.
- Fan, Z. P.; Hu, G. F.; Xiao, S. H. A method for multiple attribute decision-making with the fuzzy preference relation on alternatives. Comput. Ind. Eng. 2004, 46(2), 321–327. [Google Scholar] [CrossRef]
- Xu, Z.; Liao, H. A survey of approaches to decision making with intuitionistic fuzzy preference relations. Knowl.-Based Syst. 2015, 80, 131–142. [Google Scholar] [CrossRef]
- Kudriashova, A.; Pikh, I.; Senkivskyy, V.; Merenych, Y. Evaluation of prototyping methods for interactive virtual systems based on fuzzy preference relation. East.-Eur. J. Enterp. Technol. 2024, 5(4(131), 71–81. [Google Scholar] [CrossRef]
- Campión, M.J.; Induráin, E.; Raventós-Pujol, A. Decomposition of Fuzzy Relations: An Application to the Definition, Construction and Analysis of Fuzzy Preferences. Axioms 2023, 12, 1077. [Google Scholar] [CrossRef]
- Liu, F.; Zou, S. C.; You, Q. R. Transitivity measurements of fuzzy preference relations. Fuzzy Sets Syst. 2021, 422, 27–47. [Google Scholar] [CrossRef]
- Pikh, I.; Senkivskyy, V.; Kudriashova, A.; Senkivska, N. Prognostic assessment of COVID-19 vaccination levels. Lect. Notes Data Eng. Comput. Intell. Decis. Mak. 2022, 149, 246–265. [Google Scholar] [CrossRef]
- Patiniotakis, I.; Apostolou, D.; Mentzas, G. Fuzzy UTASTAR: A method for discovering utility functions from fuzzy data. Expert Syst. With Appl. 2011, 38(12), 15463–15474. [Google Scholar] [CrossRef]
- Borzęcka, H. Multi-criteria decision making using fuzzy preference relations. Oper. Res. Decis. 2012, 22(3), 5–21. [Google Scholar] [CrossRef]
- Ferreira, M.A.D.d.O.; Ribeiro, L.C.; Schuffner, H.S.; Libório, M.P.; Ekel, P.I. Fuzzy-Set-Based Multi-Attribute Decision-Making, Its Computing Implementation, and Applications. Axioms 2024, 13, 142. [Google Scholar] [CrossRef]
- Zimmermann, H.-J.; Zysno, P. Latent connectives in human decision making. Fuzzy Sets Syst. 1980, 4(1), 37–51. [Google Scholar] [CrossRef]
- Aghazadeh Ardebili, A.; Sadeghpour Roshany, A.; Pourmadadkar, M.; Ghodsi, M.; Padoano, E.; Boscolo, M. Enhancing risk-based engineering design: A hybrid fuzzy failure analysis with empirical validation. Front. Mech. Eng. 2026, 11, 1732819. [Google Scholar] [CrossRef]
- Ramalho, F. D.; Silva, I. S.; Ekel, P. Y.; Martins, C. A. P. D. S.; Bernardes, P.; Libório, M. P. Multimethod to prioritize projects evaluated in different formats. MethodsX 2021, 1(8), 101371. [Google Scholar] [CrossRef] [PubMed]
- Dijkstra, T. K. On the extraction of weights from pairwise comparison matrices. Cent. Eur. J. Oper. Res. 2013, 21(1), 103–123. [Google Scholar] [CrossRef]
- Mazurek, J.; Perzina, R.; Ramík, J.; Bartl, D. A Numerical Comparison of the Sensitivity of the Geometric Mean Method, Eigenvalue Method, and Best–Worst Method. Mathematics 2021, 9, 554. [Google Scholar] [CrossRef]
- Senkivskyy, V.; Pikh, I.; Kudriashova, A.; Senkivska, N.; Tupychak, L. Models of factors of the design process of reference and encyclopedic book editions. Lecture Notes in Computational Intelligence and Decision Making. ISDMCI 2021. Lecture Notes on Data Engineering and Communications Technologies 2022, 77, 217–229. [Google Scholar] [CrossRef]
- Salomon, V.A.P.; Gomes, L. F. A. M. Consistency improvement in the analytic hierarchy process. Mathematics 2024, 12, 828. [Google Scholar] [CrossRef]
- Bogdanova, G.; Todorov, T.; Dochkova-Todorova, J.; Noev, N.; Sabev, N. Design and development model of a web accessibility ecosystem. Information 2024, 15, 613. [Google Scholar] [CrossRef]
- Furnell, S.; Helkala, K.; Woods, N. Accessible authentication: Assessing the applicability for users with disabilities. Comput. Secur. 2022, 113, 102561. [Google Scholar] [CrossRef]
- Hamideh Kerdar, S.; Bächler, L.; Kirchhoff, B. M. The accessibility of digital technologies for people with visual impairment and blindness: a scoping review. Discov. Comput. 2024, 27(1), 24. [Google Scholar] [CrossRef]
- Thushara, B.; Adithya, V.; NS, S. Multimodal human–computer interaction: A panoptic view. Eng. Appl. Artif. Intell. 2026, 179, 115233. [Google Scholar] [CrossRef]
- Deshmukh, A. M.; Chalmeta, R. User experience and usability of voice user interfaces: A systematic literature review. Information 2024, 15, 579. [Google Scholar] [CrossRef]
- Batool, A.; Hussain, W. Evaluating the usability and ethical implications of graphical user interfaces in generative AI systems. Computers 2025, 14, 418. [Google Scholar] [CrossRef]
- Xie, I.; Choi, W.; Wang, S.; Lee, H.S.; Hong, B.H.; Wang, N.-C.; Cudjoe, E.K. Help-seeking situations related to visual interactions on mobile platforms and recommended designs for blind and visually impaired users. J. Imaging 2024, 10, 205. [Google Scholar] [CrossRef] [PubMed]
Figure 1.
Combinations of percentage distribution of the influence of factors according to three alternatives.
Figure 1.
Combinations of percentage distribution of the influence of factors according to three alternatives.
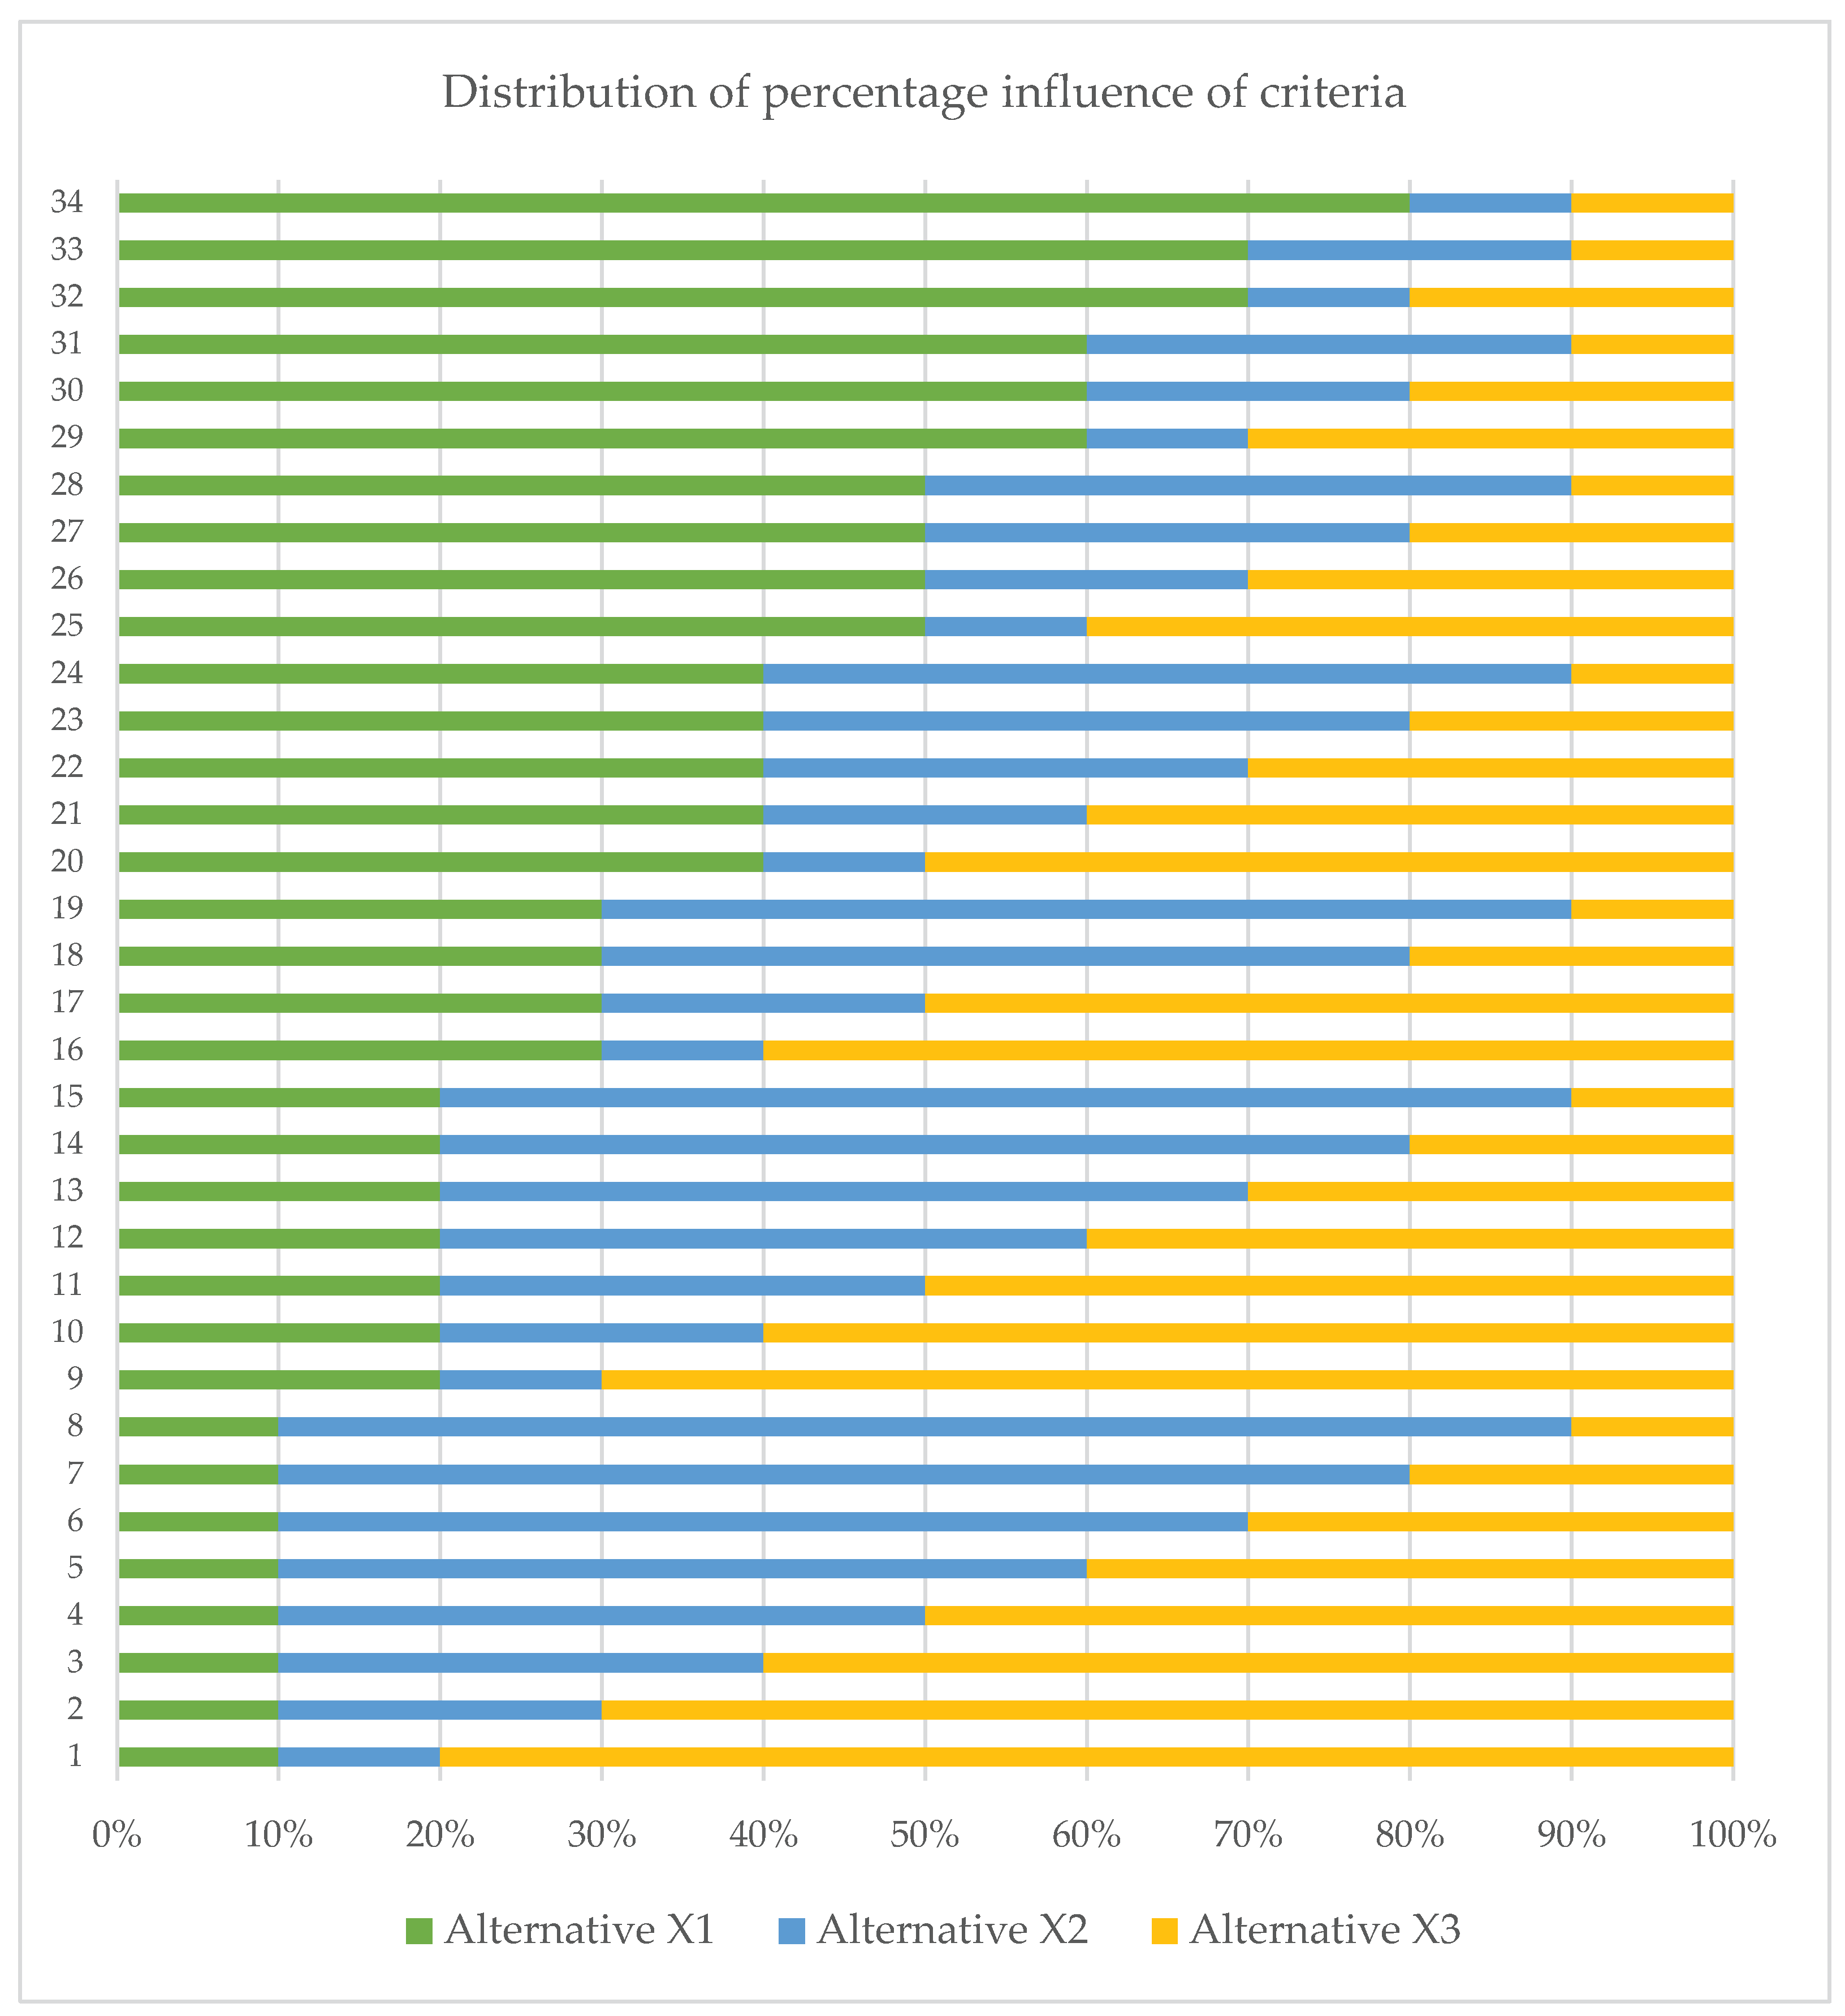
Figure 2.
Structural-functional model for fuzzy multi-criteria assessment of user interface inclusivity.
Figure 2.
Structural-functional model for fuzzy multi-criteria assessment of user interface inclusivity.
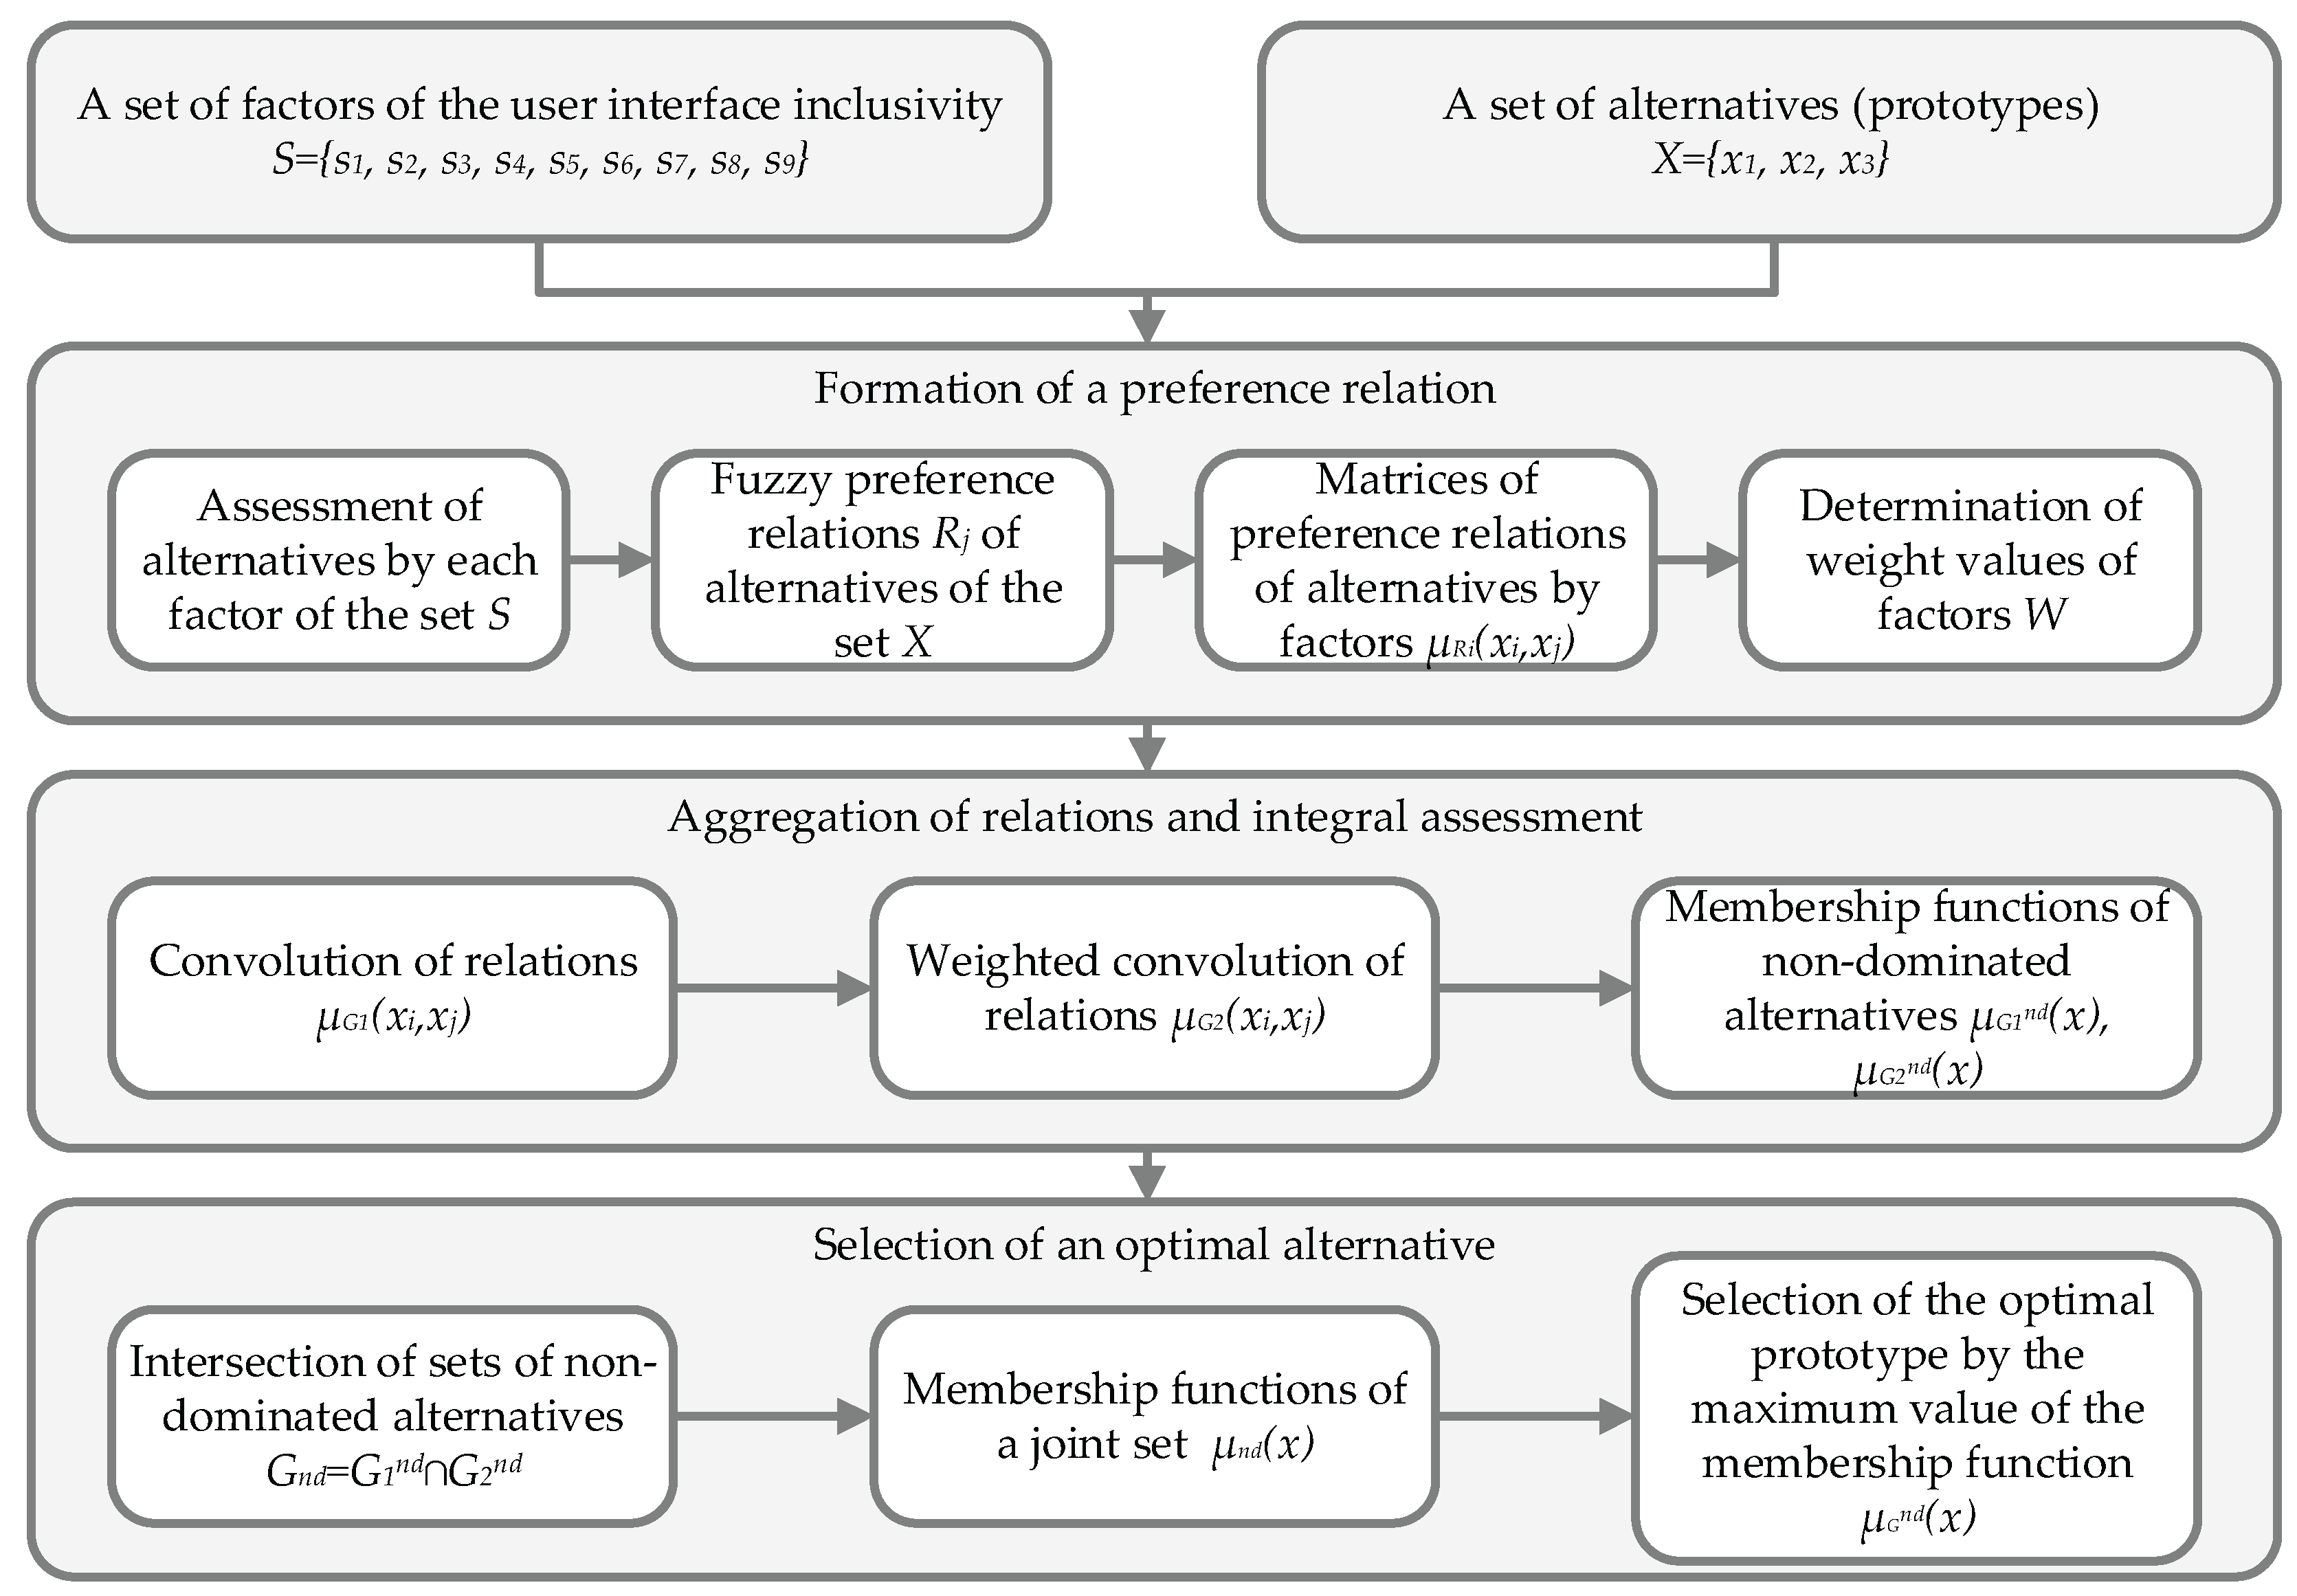
Table 1.
Assessment of alternatives by factors.
| Factors | x1 | x2 | x3 |
|---|---|---|---|
| Compliance with standards | 50% | 20% | 30% |
| Language simplicity | 40% | 30% | 30% |
| No time pressure | 30% | 50% | 20% |
| Display settings | 40% | 40% | 20% |
| Mouse-free control | 30% | 60% | 10% |
| Multimodal content | 20% | 10% | 70% |
| Voice control support | 40% | 30% | 30% |
| Resistance to unintentional user actions | 30% | 20% | 50% |
| Support for screen readers | 40% | 30% | 30% |
Table 3.
Convolution of relations G1.
| Membership function | xi/xj | x1 | x2 | x3 |
|---|---|---|---|---|
| x1 | 1 | 0 | 0 | |
| x2 | 0 | 1 | 0 | |
| x3 | 0 | 0 | 1 |
Table 4.
Pairwise comparisons of priority factors.
| Ri | R1 | R2 | R3 | R4 | R5 | R6 | R7 | R8 | R9 |
| R1 | 1 | 3 | 4 | 5 | 2 | 8 | 6 | 7 | 9 |
| R2 | 1/3 | 1 | 2 | 3 | 1/2 | 6 | 4 | 5 | 7 |
| R3 | 1/4 | 1/2 | 1 | 2 | 1/3 | 5 | 3 | 4 | 6 |
| R4 | 1/5 | 1/3 | 1/2 | 1 | 1/4 | 4 | 2 | 3 | 5 |
| R5 | 1/2 | 2 | 3 | 4 | 1 | 7 | 5 | 6 | 8 |
| R6 | 1/8 | 1/6 | 1/5 | 1/4 | 1/7 | 1 | 1/3 | 1/2 | 2 |
| R7 | 1/6 | 1/4 | 1/3 | 1/2 | 1/5 | 3 | 1 | 2 | 4 |
| R8 | 1/7 | 1/5 | 1/4 | 1/3 | 1/6 | 2 | 1/2 | 1 | 3 |
| R9 | 1/9 | 1/7 | 1/6 | 1/5 | 1/8 | 1/2 | 1/4 | 1/3 | 1 |
Table 5.
Membership function matrix of the convolution of relations G2.
| Membership function | xi/xj | x1 | x2 | x3 |
|---|---|---|---|---|
| x1 | 1 | 0,664 | 0,936 | |
| x2 | 0,405 | 1 | 0,628 | |
| x3 | 0,059 | 0,59 | 1 |
Disclaimer/Publisher’s Note: The statements, opinions and data contained in all publications are solely those of the individual author(s) and contributor(s) and not of MDPI and/or the editor(s). MDPI and/or the editor(s) disclaim responsibility for any injury to people or property resulting from any ideas, methods, instructions or products referred to in the content. |
© 2026 by the authors. Licensee MDPI, Basel, Switzerland. This article is an open access article distributed under the terms and conditions of the Creative Commons Attribution (CC BY) license (http://creativecommons.org/licenses/by/4.0/).
Copyright: This open access article is published under a Creative Commons CC BY 4.0 license, which permit the free download, distribution, and reuse, provided that the author and preprint are cited in any reuse.