Preprint
Article

This version is not peer-reviewed.

Surface Water Quality Deterioration in Tien Giang Province, Vietnamese Mekong Delta (2019–2023): Insights from Water Quality Index and Multivariate Statistical Analysis

Submitted:

02 October 2026

Posted:

05 October 2026

You are already at the latest version

Abstract

This study assessed surface water quality changes in Tien Giang province, Vietnam, during 2019–2023 using the water quality index (WQI), principal component analysis (PCA), and cluster analysis (CA). Researchers measured eleven parameters (temperature, pH, TSS, DO, BOD, COD, NH4+-N, NO3--N, PO43--P, Cl-, and coliform) at 34 monitoring stations. Results indicated a marked decline in water quality over time, especially severe organic and microbial pollution during 2022–2023. During 2019–2020, water quality was mainly good to very good, with over 85% of stations stable; this temporarily improved in 2021 (44.12% very good). From 2022, VN_WQI ranged from 9–94, with poor, heavily polluted, and very heavily polluted stations increasing sharply; by 2023, 91.18% of stations recorded poor water quality. This decline was driven primarily by a more than fourteen-fold increase in mean coliform density between 2021 and 2023, together with persistently elevated BOD and COD, despite a concurrent improvement in dissolved oxygen. CA identified four groups with distinct pollution levels: Group I (S17, S19, S20) was most severely polluted; Groups II and IV showed large fluctuations; Group III (S34, Ly Quan canal) had the best water quality. PCA extracted four principal components explaining 77% of the total variance. The main factors affecting water quality included agricultural activities (cultivation, livestock, aquaculture), domestic and industrial wastewater, and saltwater intrusion. These findings provide a scientific basis for spatially prioritized pollution control and for rationalizing the provincial monitoring network, which is particularly relevant following the 2025 merger of Tien Giang into Dong Thap province.

Keywords: 
;  ;  ;  ;  ;  ;  

1. Introduction

Surface water plays an important role in natural ecosystems, agriculture and industry, and human activities [1,2]. It is not only a primary source of water for daily use and economic activities but also helps maintain ecological balance, support biodiversity, and regulate climate. However, many natural factors, such as climate, atmospheric conditions, hydrodynamics, and topography, can affect surface water quality [3]. In addition, human activities, including farming, manufacturing, land use change, and urbanization, also significantly affect water quality [1]. Pollutants in surface water originate from various sources, classified as point-source and non-point-source pollution [2]. Point source pollution comes from clearly identifiable origins, such as industrial facilities, wastewater treatment plants, and direct discharge systems [4]. Meanwhile, non-point source pollution results from agricultural runoff containing fertilizers and pesticides, stormwater, and soil erosion [5]. These sources of pollution degrade surface water quality, causing serious impacts on ecosystems, human health, and economic activities [6].
Tien Giang is one of the localities directly influenced by the Tien River system and its inland canal network. Surface water quality in the province is affected not only by natural factors but also by various anthropogenic pressures in the region. A major challenge is saltwater intrusion, which significantly impairs water quality and local livelihoods. During 2019–2020, saltwater intrusion intensified, with the 4 g/L salinity boundary penetrating deeper into inland fields, exceeding the severity observed during the extreme drought and salinity events of 2016. Consequently, approximately 6,300 ha of rice and 5,343 ha of fruit trees were damaged, resulting in estimated losses of up to 140.5 billion VND [7]. The 2019–2020 dry season was among the most severe salinity events recorded in the Vietnamese Mekong Delta (VMD) in the past century [8], and multi-decadal records show that drought and salinity intrusion have increasingly constrained agricultural production across the delta [9]. Along the Co Chien River, a distributary of the Tien River, long-term monitoring further indicates a pronounced landward shift of the salinity boundary over 2000–2024 [10]. Furthermore, Tien Giang faces water pollution risks from agricultural, industrial, and urban expansion. Several studies have indicated increasing concentrations of organic contaminants, nutrients, and microbial populations in water in certain areas of the province. These pollutants primarily originate from daily human activities, aquaculture, seafood processing, and waste discharge from humans and warm-blooded animals, adversely impacting aquatic ecosystems and public health [11,12]. Additionally, wastewater from fish markets and urban zones further contributes to elevated levels of organic and microbial pollution in adjacent water bodies [13].
Assessing surface water quality is essential to protect water resources and promote ecosystem and socio-economic sustainability. One commonly used approach is the water quality index (WQI), which integrates multiple physical, chemical, and biological parameters into a single value. This index offers a comprehensive assessment of water pollution, ranging from very good (suitable for direct use) to severely polluted (unsuitable for use) [14,15]. However, WQI provides only an overall pollution status and does not specify the primary contributing factors. To gain deeper insight into pollutant sources and impacts, environmental studies increasingly use multivariate statistical techniques such as principal component analysis (PCA) and cluster analysis (CA) [16,17]. PCA identifies the key variables driving water-quality variation, providing valuable insight into pollution origins, whether natural or anthropogenic [14,18,19]. Conversely, CA groups sampling sites with similar pollution characteristics, enabling targeted and efficient monitoring [20,21,22].
Although this integrated WQI–PCA–CA approach has been widely applied to assess surface water quality across the VMD - including Vinh Long [23], Hau Giang [24,25], Dong Thap [26], Ben Tre [27], Can Tho [28], and Ca Mau Peninsula [29,30]. Process-based models have also been applied to simulate organic pollution dynamics in the delta's aquaculture-dominated canal networks [31], but these approaches require detailed hydrodynamic and pollutant-load data that are rarely available at the provincial scale. By contrast, routinely collected provincial monitoring data remain underused for systematic, multi-year assessment. A comparable, systematic assessment remains lacking for Tien Giang province. Existing studies on Tien Giang’s water bodies have either examined water quality at a broader, multi-province regional scale without province-specific spatial resolution [11] or focused on a narrower ecological question, such as the relationship between water quality and zooplankton diversity in coastal areas [12], rather than providing a comprehensive, multi-year evaluation that jointly captures temporal trends, spatial pollution clustering, and pollution source identification across the province’s river and canal network. This gap is particularly critical given that Tien Giang experienced an exceptionally severe saltwater intrusion event in 2019–2020 and has since faced escalating organic and microbial pollution [7,11,12], yet the extent to which these compounding pressures have reshaped surface water quality across both time and space in the province has not been systematically quantified. Addressing this gap requires an integrated, multi-year approach that can simultaneously track temporal degradation trends, spatial heterogeneity among monitoring stations, and the relative contribution of natural versus anthropogenic pollution sources. The 2019–2023 period is particularly informative because it spans the extreme 2019–2020 drought–salinity event and the subsequent years, allowing the effects of an exceptional hydrological year to be distinguished from more persistent anthropogenic degradation.
Accordingly, this study applies an integrated approach combining water quality indices and multivariate analyses to (1) evaluate temporal changes in surface water quality in Tien Giang province during 2019–2023, (2) cluster areas with comparable pollution levels to enhance monitoring efficiency, and (3) determine the main factors influencing surface water conditions. The findings are expected to provide a scientific basis for effective water resource management in Tien Giang, supporting strategies to improve water quality under sustainable development goals.

2. Materials and Methods

2.1. Description of the Study Area

Tien Giang province is strategically located at the entrance to the VMD and forms part of the Southern key economic region. It plays a crucial role in regional socio-economic growth, serving as a major hub for agricultural and aquaculture production. Covering approximately 2,556.36 km², the province has a population of over 1.7 million residents. Its administrative structure includes 2 cities (My Tho and Go Cong), 1 town (Cai Lay), and 8 districts, comprising 164 commune-level units. Following the re-organization of provincial administrative units under Resolution No. 202/2025/QH15 [32], Tien Giang was merged with Dong Thap to form the new Dong Thap province. This study refers to the former Tien Giang province and its pre-merger administrative boundaries, which correspond to the monitoring network and period analyzed. Geographically, Tien Giang borders Long An and Ho Chi Minh City to the north and northeast, Dong Thap province to the west, Ben Tre and Vinh Long provinces to the south and southwest, and the South China Sea to the east.
Tien Giang’s waterways are highly diverse, directly influenced by the Mekong River system. The Tien River, the Mekong's main branch, flows through Tien Giang for about 120 km and plays a crucial role in providing fresh water for daily life, agriculture, and aquaculture. The province also has numerous tributaries and a dense canal network, including the Go Cong River, Cho Gao Canal, Nguyen Tan Thanh Canal, and Ba Ray Canal, which regulate water and support waterway transport. However, climate change and economic development are affecting this hydrological network. The province frequently experiences saltwater intrusion during the dry season (December to April), when saltwater from the South China Sea penetrates deep inland and severely affects agricultural productivity and people’s livelihoods. To mitigate salinity intrusion, parts of the province, particularly the Go Cong area, are protected by sluice and dyke systems. This water-control infrastructure restricts water exchange and may affect surface water quality, with potential consequences for pollutant dilution and residence time in inland canals. Additionally, Tien Giang faces water pollution issues due to farming, industrial activities, and urbanization.

2.2. Sample Collection and Analysis Methods

This study used secondary data on surface water quality collected by the Department of Natural Resources and Environment of Tien Giang province from 2019 to 2023 at 34 sampling sites (coded S1–S34), representing key water bodies in the province (Figure 1). Specifically, the Tien, Ba Ray, Cai Be rivers, and Nguyen Van Tiep canal had four, four, two, and five monitoring sites, respectively. The remaining water bodies, including the Nam Thon, Xoai Hot, Bao Dinh, Tra, Binh Phan, Go Cong, and Long Uong rivers, as well as the Co Co, Truong Van Sanh, Dong Bac, Tram Mu, Xang Cut, Ong Dao, Cho Gao, Vam Giong, Nhiem, Can Loc, Vam Thap, and Ly Quan canals, each had one monitoring site. Data collection was conducted three times annually, in March, June, and November. The monitoring dataset for 2019–2023 was complete, with no missing records across the 34 stations, three annual sampling occasions, and eleven monitored parameters; therefore, no data imputation or station/year exclusion was required before statistical analysis.
The study focused on evaluating 11 parameters of water quality, including key physical, chemical, and microbiological indicators, such as temperature, pH, total suspended solids (TSS), dissolved oxygen (DO), biochemical oxygen demand (BOD), chemical oxygen demand (COD), ammonium (NH4+-N), nitrate (NO3--N), orthophosphate (PO43--P), chloride (Cl-), and coliform. The water samples were collected according to current technical standards to ensure spatial and temporal representativeness, while complying with preservation and laboratory analysis requirements. Sample collection, preservation, and laboratory analysis were carried out under the quality assurance and quality control procedures stipulated in Circular No. 10/2021/TT-BTNMT [33], which regulates environmental monitoring and the management of environmental monitoring quality data in Vietnam, thereby ensuring the reliability and comparability of the secondary dataset used in this study. Table 1 presents the methods for measuring and analyzing these parameters in detail.
Sampling and laboratory analysis followed the same standard methods throughout 2019–2023, ensuring comparability between years. Because QCVN 08:2023/BTNMT [34] superseded the previous national regulation during the study period, all observations were compared against the 2023 regulation to provide a consistent benchmark.

2.3. Data Processing Method

2.3.1. Statistical Methods

Water quality data in Tien Giang province from 2019 to 2023 were compiled and processed using SPSS software version 20.0. First, the data were presented in box plots to describe the distribution of each parameter, including the mean, range of variation, and the presence of outliers. This chart visually represented parameter fluctuations at each location over the five-year period and helped identify unusual trends in the data series. In addition, to test for statistically significant differences in water quality variations between years, the study conducted a one-way ANOVA analysis. Statistically significant differences among years (p<0.05) were further examined using Duncan’s multiple range test as the post-hoc multiple comparison procedure; the results are indicated by different superscript letters (a, b, c, d) assigned to the mean values in Table 3, with means sharing at least one common letter not being significantly different (p>0.05). The Duncan test was selected for post-hoc comparison because it provides sufficient statistical power to detect meaningful differences among the five annual groups (2019–2023) despite the relatively large and comparable sample size per year (34 stations × 3 sampling occasions), which was considered appropriate for the exploratory, trend-oriented objective of identifying year-to-year shifts in water quality across the monitoring network. Furthermore, the observed values were compared with QCVN 08:2023/BTNMT, the National Technical Regulation on Surface Water Quality.

2.3.2. Calculating Water Quality Index

Since 2011, the Vietnam Environment Administration has proposed the first version of WQI to assess surface water conditions [35]. Then, the updated version of WQI (called VN_WQI) was released in 2019 [36]. The water quality index applied in this study was the VN_WQI with 5 groups of water quality parameters (I to V) proposed by the VEA [36].
WQI = WQI I 100 × ∏ i = 1 n WQI II 1 / n 100 × ∏ i = 1 m WQI III 1 / m 100 × [ 1 k ∑ i = 1 k WQI IV × 1 l ∑ i = 1 l WQI V ] 1 / 2
In this study, we calculated the VN_WQI at monitoring stations in Tien Giang province from 2019 to 2023 based on eight parameters: pH (group I), DO, BOD, COD, NH4+-N, NO3--N, PO43--P (group IV), and Coliform (group V). So, the formula for calculating the VN_WQI was shortened by the equation (2):
WQI = WQI I 100 × [ 1 k ∑ i = 1 k WQI IV × 1 l ∑ i = 1 l WQI V ] 1 / 2
The VN_WQI index divided surface water quality assessment into six levels, as shown in Table 2.

2.3.3. Cluster Analysis Method

CA is a multivariate statistical method to group research objects into clusters with similar characteristics [22]. In this study, CA was performed based on WQI analysis results to classify sampling sites in Tien Giang province from 2019 to 2023. Ward’s method and squared Euclidean distance were used to determine the similarity between these sites. The analysis results were presented as dendrograms, providing a visual representation of clustering among monitoring stations [20,21,22]. Sites with similar pollution levels were classified into the same cluster, while those with different pollution levels were placed in separate clusters. CA was performed using Primer 5.2 for Windows software (PRIMER-E Ltd, Plymouth, UK)

2.3.4. Principal Component Analysis Method

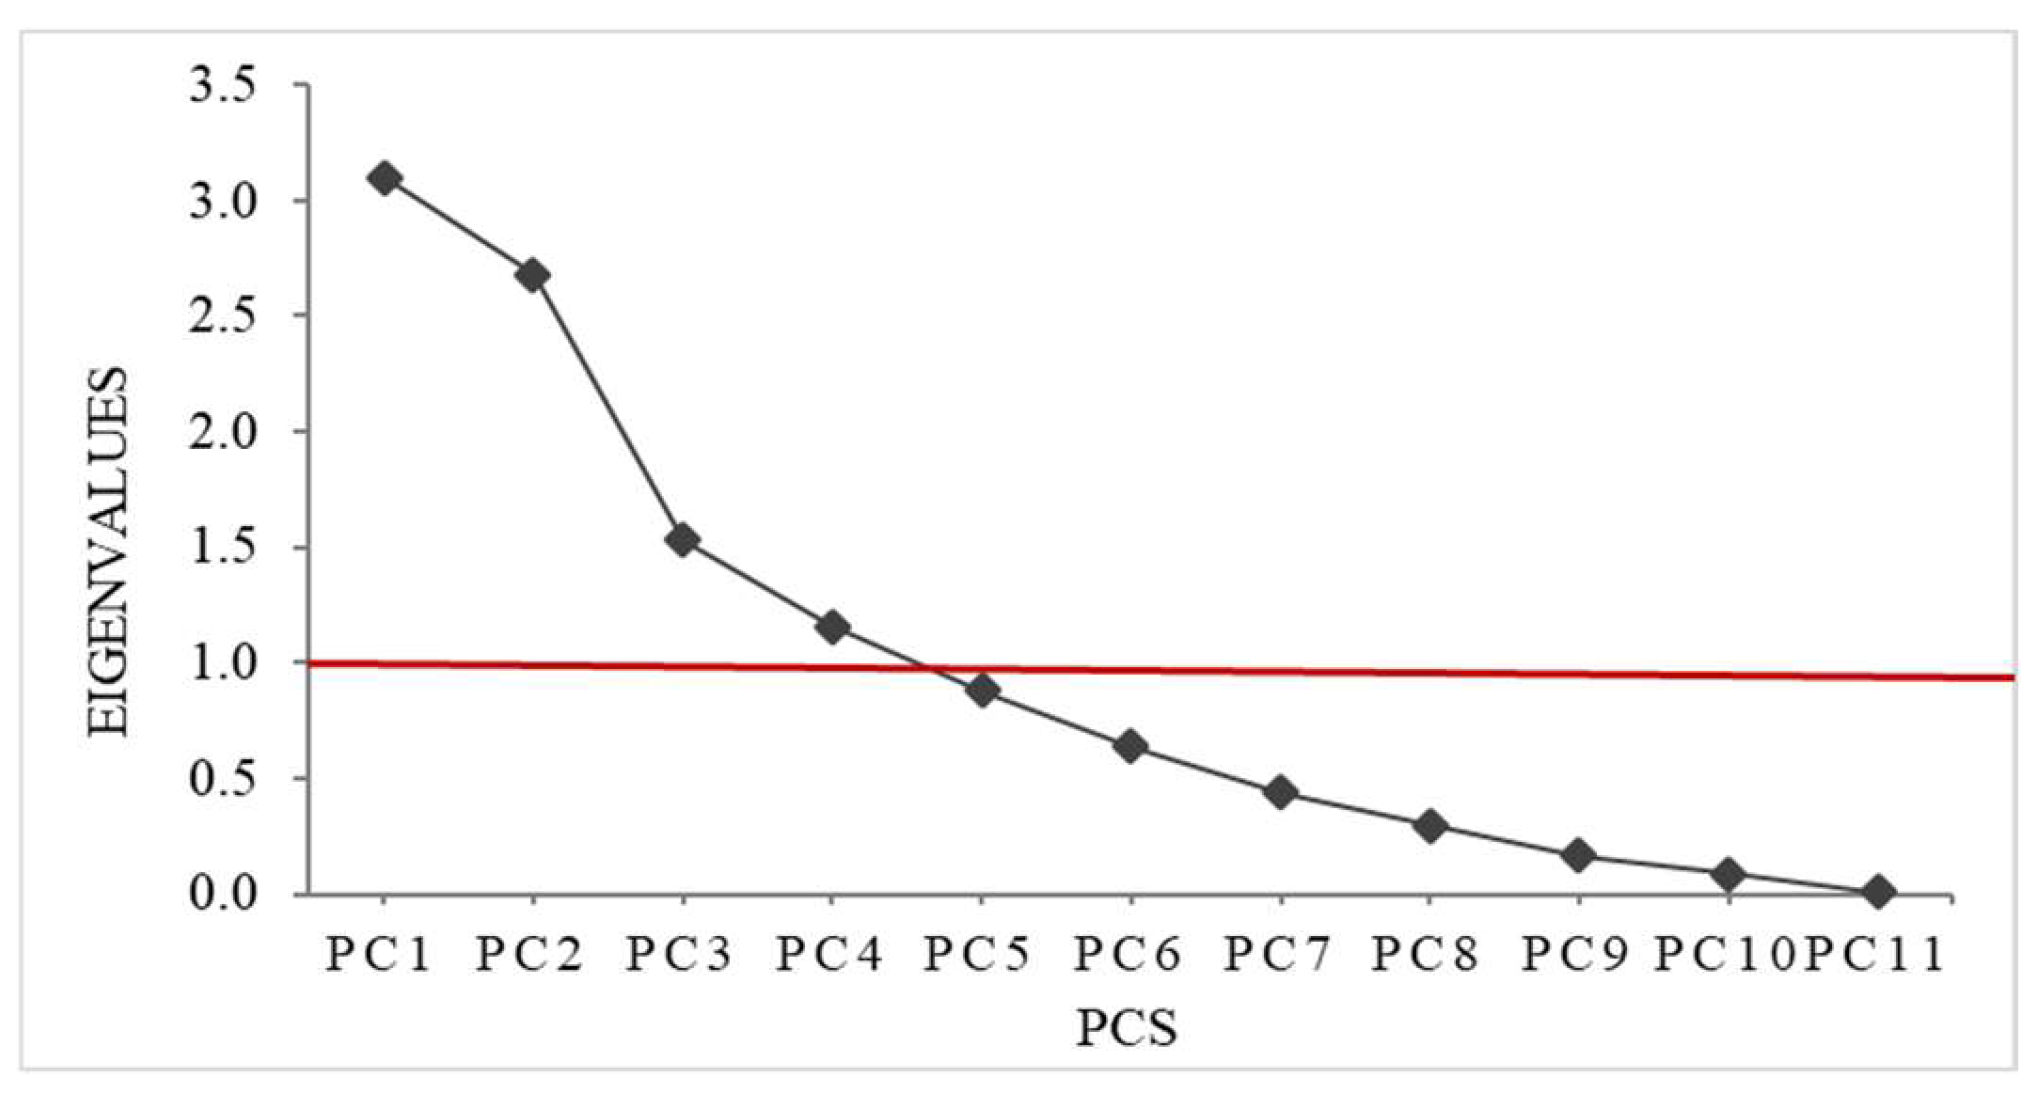
PCA is a multivariate statistical method used to extract the most important indicator parameters and identify the main factors affecting water quality in the study area [14,18,19]. PCA results generate principal components (PCs), and the degree of correlation between PCs and environmental variables is determined through factor loadings, including strong (>0.75), moderate (0.75–0.5), and weak (0.5–0.3) [22]. PCs are arranged in decreasing order of their contribution to explaining the data based on their Eigenvalues. Typically, PCs with Eigenvalues greater than 1 are retained because they contain most of the key information in the original dataset and contribute most to overall data variation [18,22]. In this study, PCA was applied to a dataset of 11 monitored environmental parameters, including pH, temperature, TSS, DO, BOD, COD, NH4+-N, NO3--N, PO43--P, Cl- and coliform. The analysis results help identify natural or anthropogenic pollution factors in water bodies in Tien Giang province, thereby supporting the proposal of effective risk control measures for managing related pollution. PCA was conducted using Primer 5.2 for Windows software (PRIMER-E Ltd, Plymouth, UK).

3. Results

3.1. Physicochemical and Microbiological Water Quality Parameters (2019–2023)

3.1.1. Temperature and pH

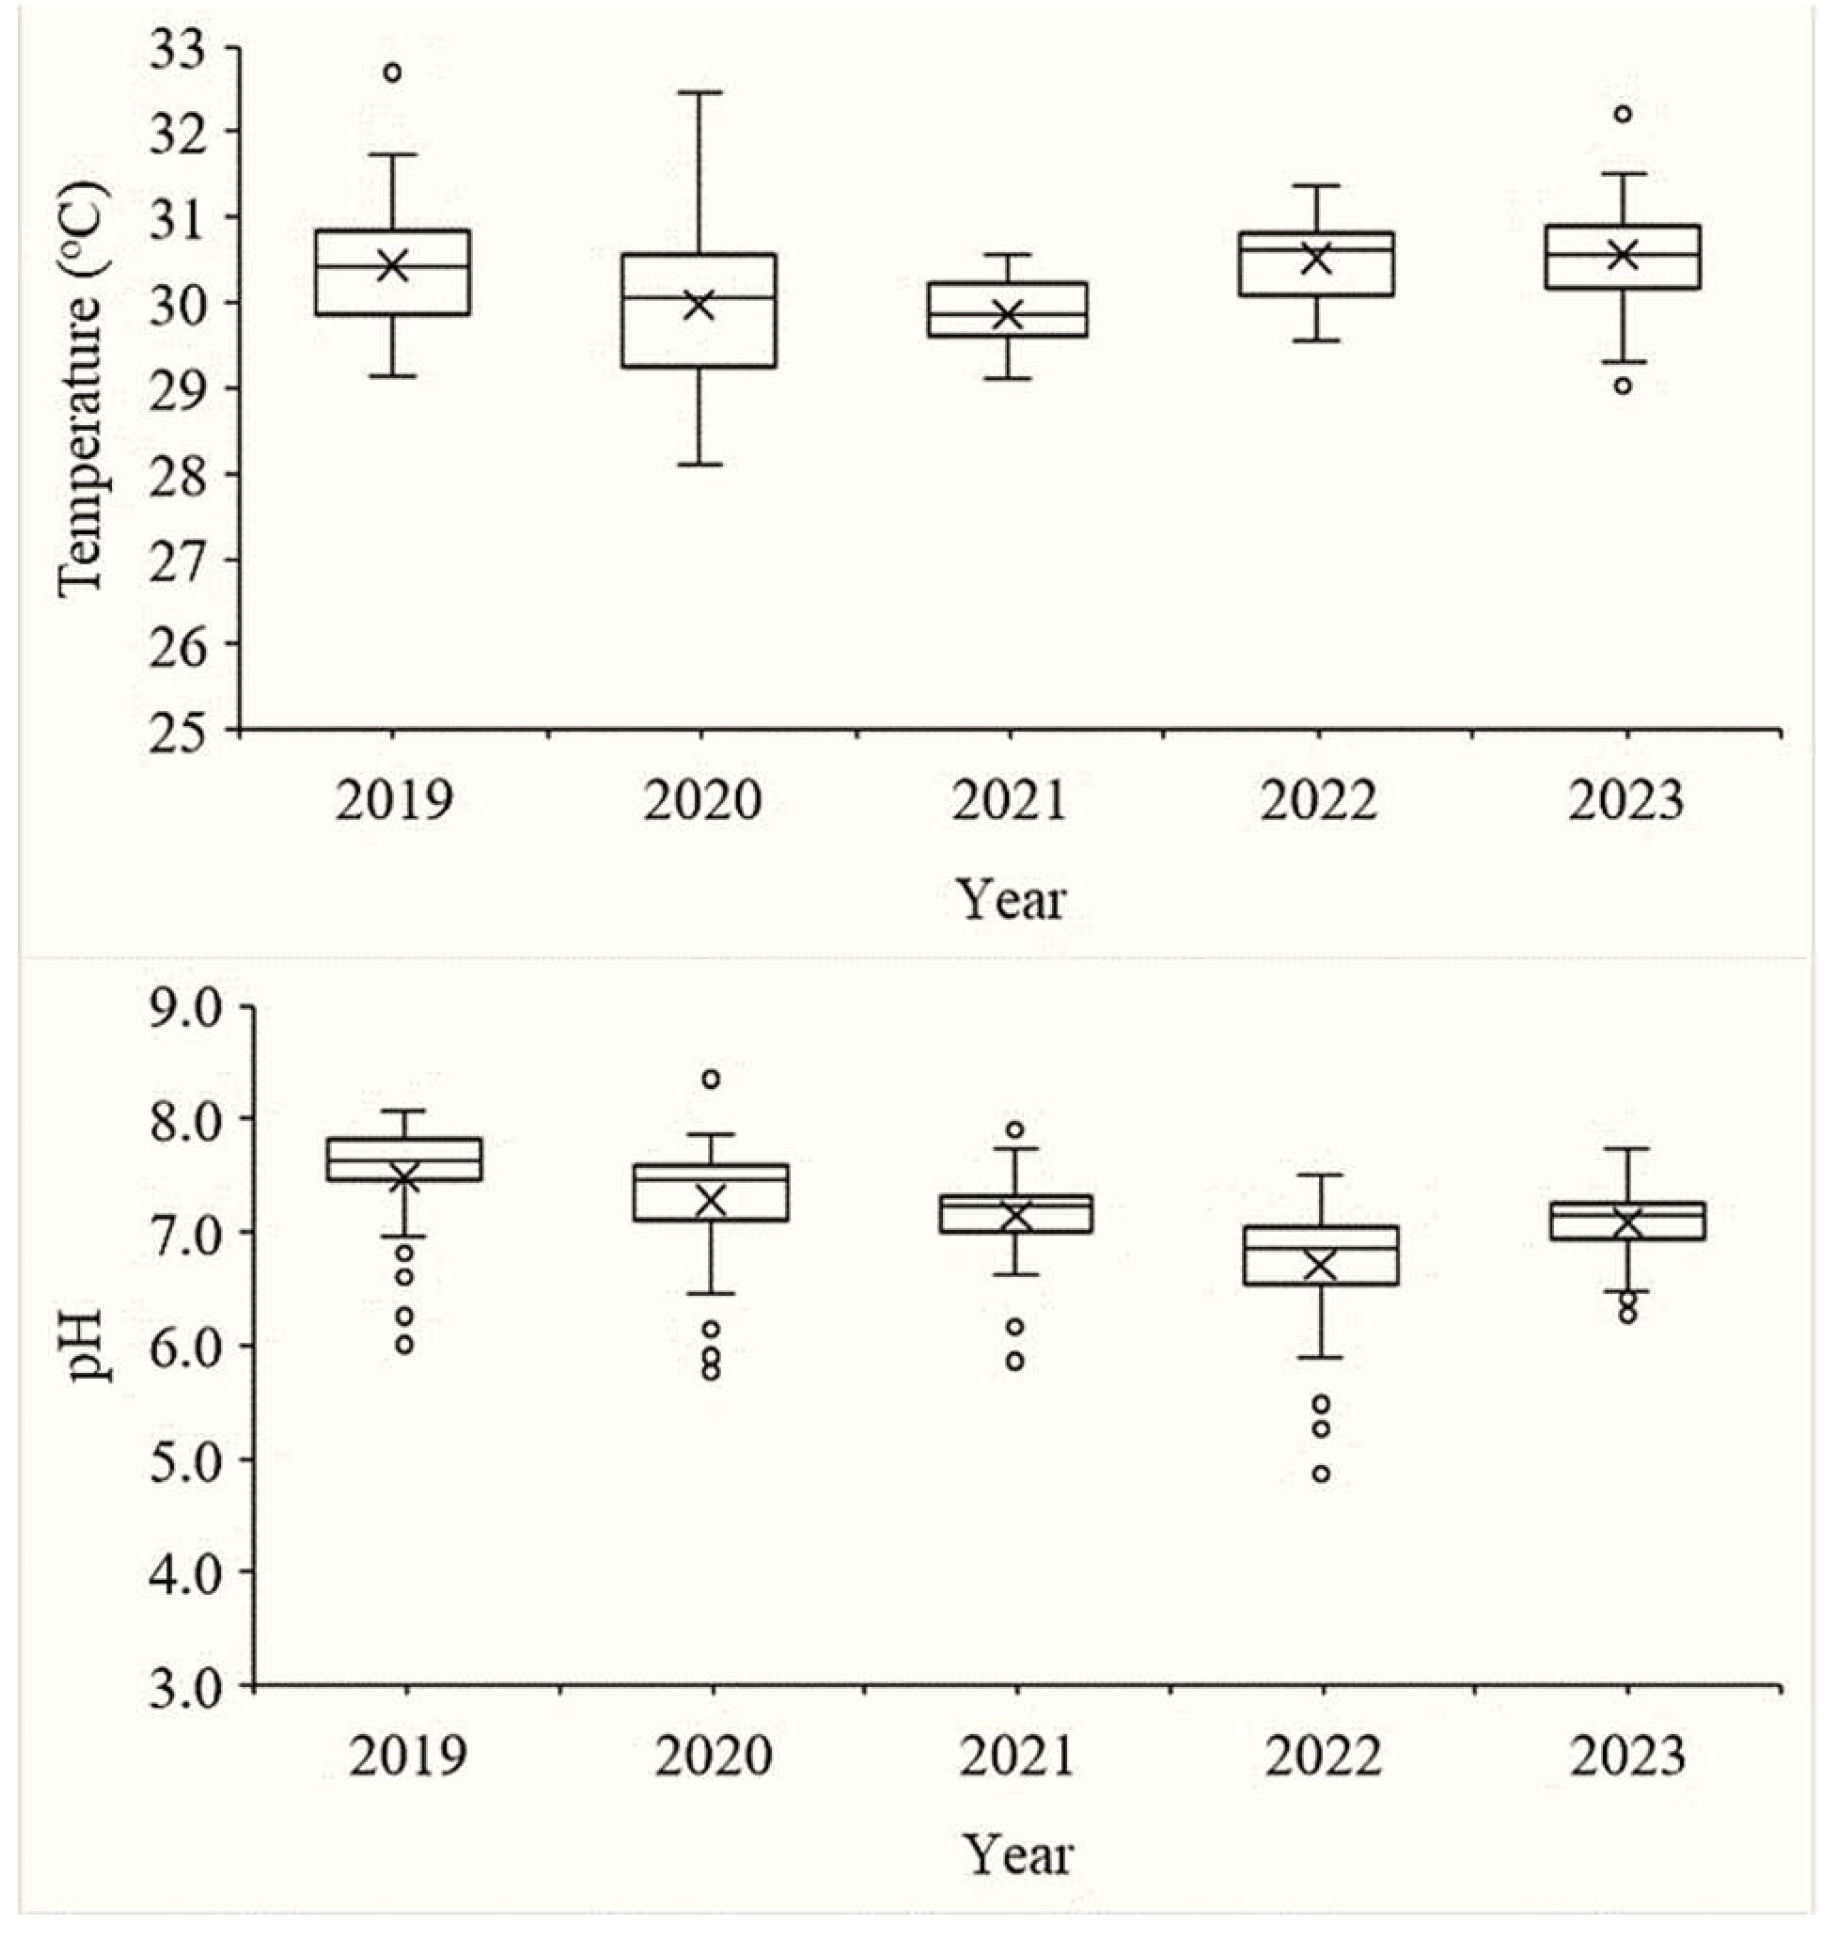
During the period 2019–2023, surface water temperature in Tien Giang province's water bodies ranged from 28.10°C to 32.70°C, with annual averages of 30.44±0.71°C (2019), 29.98±1.23°C (2020), 29.86±0.41°C (2021), 30.51±0.46°C (2022), and 30.57±0.69°C (2023) (Table 3, Figure 2). One-way ANOVA showed that surface water temperature in 2019, 2022, and 2023 did not differ significantly (p>0.05) but differed significantly from 2020 and 2021 (p<0.05).
pH values ranged from 4.87 to 8.35 over the study period, with annual averages of 7.48±0.54 (2019), 7.28±0.53 (2020), 7.15±0.39 (2021), 6.70±0.56 (2022), and 7.08±0.29 (2023) (Table 3, Figure 2). Statistical analysis showed that the average pH in 2022 differed significantly from all other years (p<0.05); the average pH in 2019 differed significantly from 2021 and 2023 (p<0.05) but not from 2020 (p>0.05). Compared with QCVN 08:2023/BTNMT allowable range of 6.0–8.5, the average annual pH values remained within the permissible limit; however, individual sampling sites recorded pH values below this threshold in 2020 (2 sites, 5.88%), 2021 (1 site, 2.94%), and 2022 (4 sites, 11.76%).

3.1.2. Total Suspended Solids

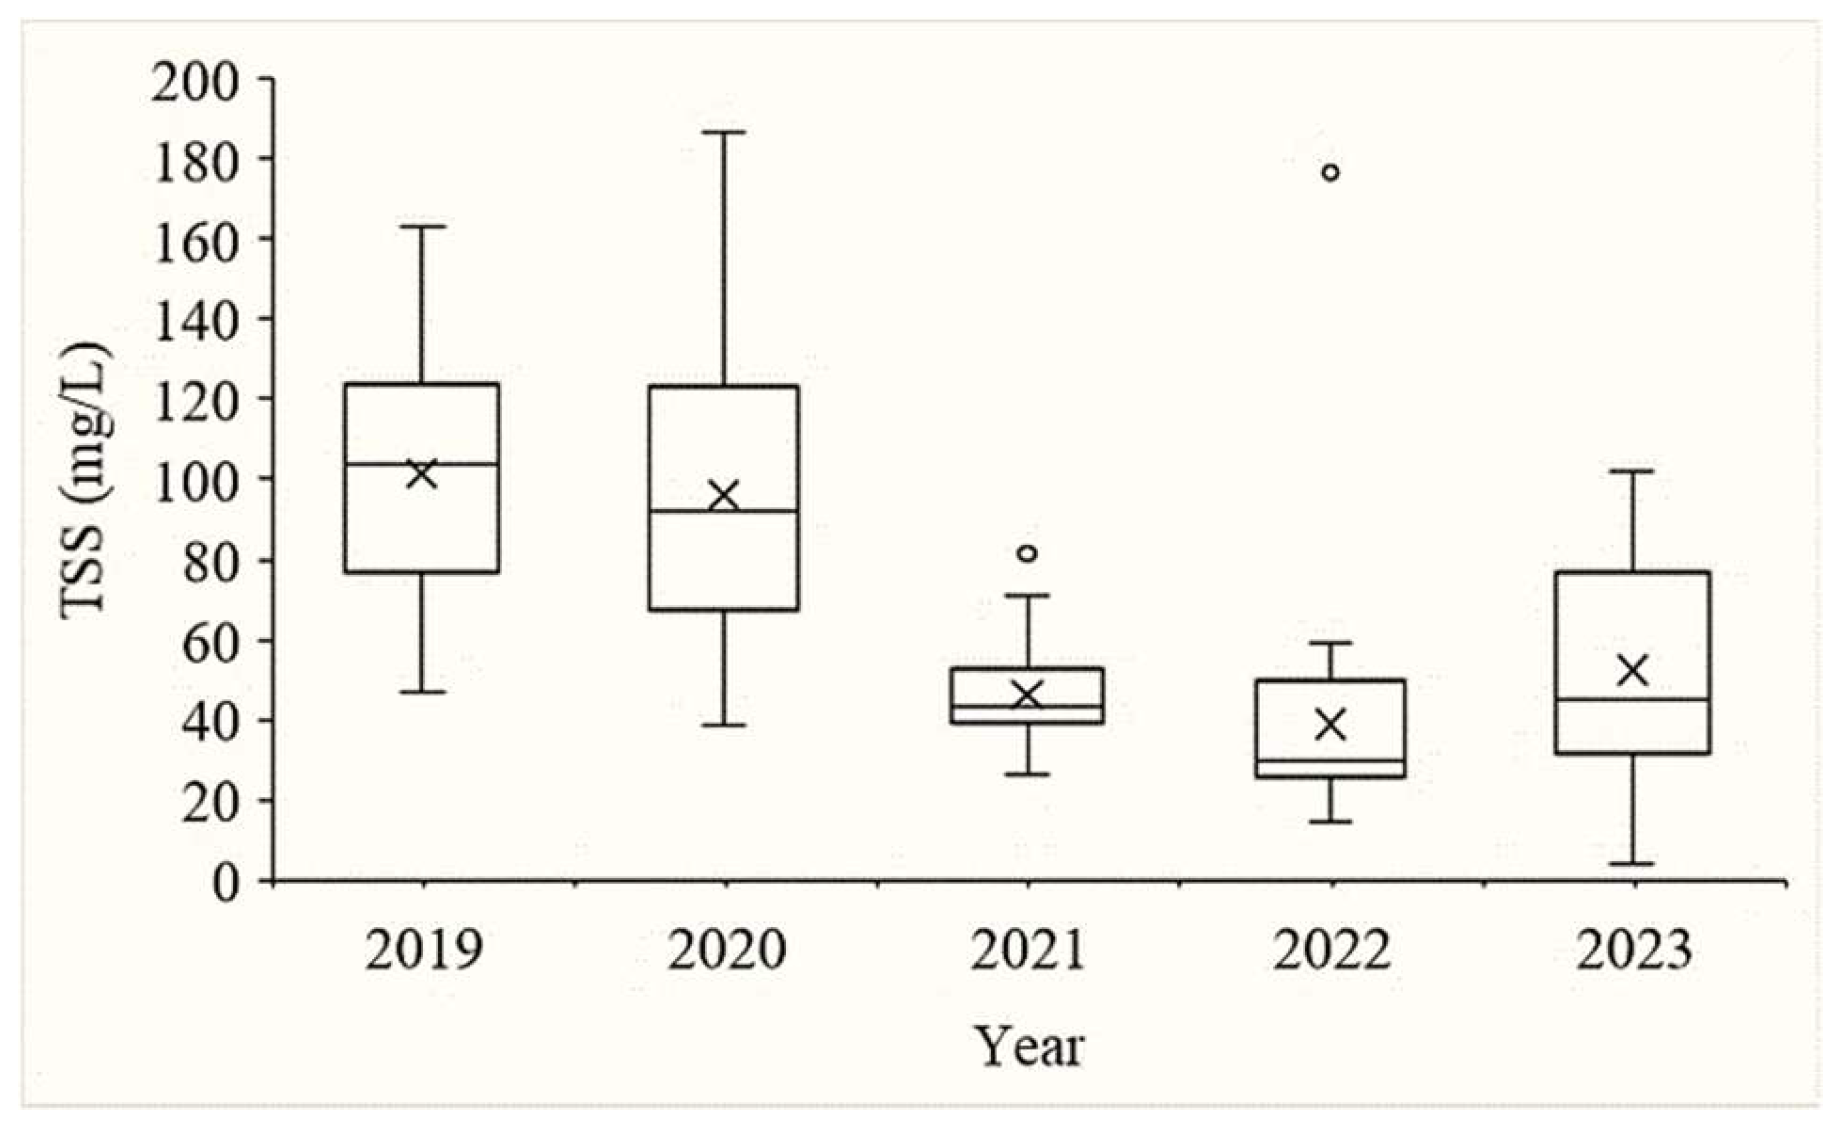
In 2019 and 2020, TSS ranged from 46.67–163.00 mg/L (101.44±30.35 mg/L) and 38.67–186.67 mg/L (96.05±36.02 mg/L), with 18 sites (52.94%) and 13 sites (38.24%) exceeding the QCVN 08:2023/BTNMT limit (>100 mg/L), respectively (Table 3, Figure 3). High TSS values were concentrated along the Tien River, in fishing port areas, and in areas affected by seafood processing activities. From 2021, TSS decreased significantly to an average of 46.31±11.80 mg/L (26–81.33 mg/L), fully compliant with the current standard. This downward trend continued in 2022, averaging 38.92±27.63 mg/L, with one site exceeding the threshold. In 2023, TSS increased slightly to an average of 52.47±28.15 mg/L (3.90–101.83 mg/L), with two sites exceeding the limit. Statistical analysis showed no significant difference between 2019 and 2020 (p>0.05), but a significant difference between these two years and 2021–2023 (p<0.05).

3.1.3. Organic Pollutants

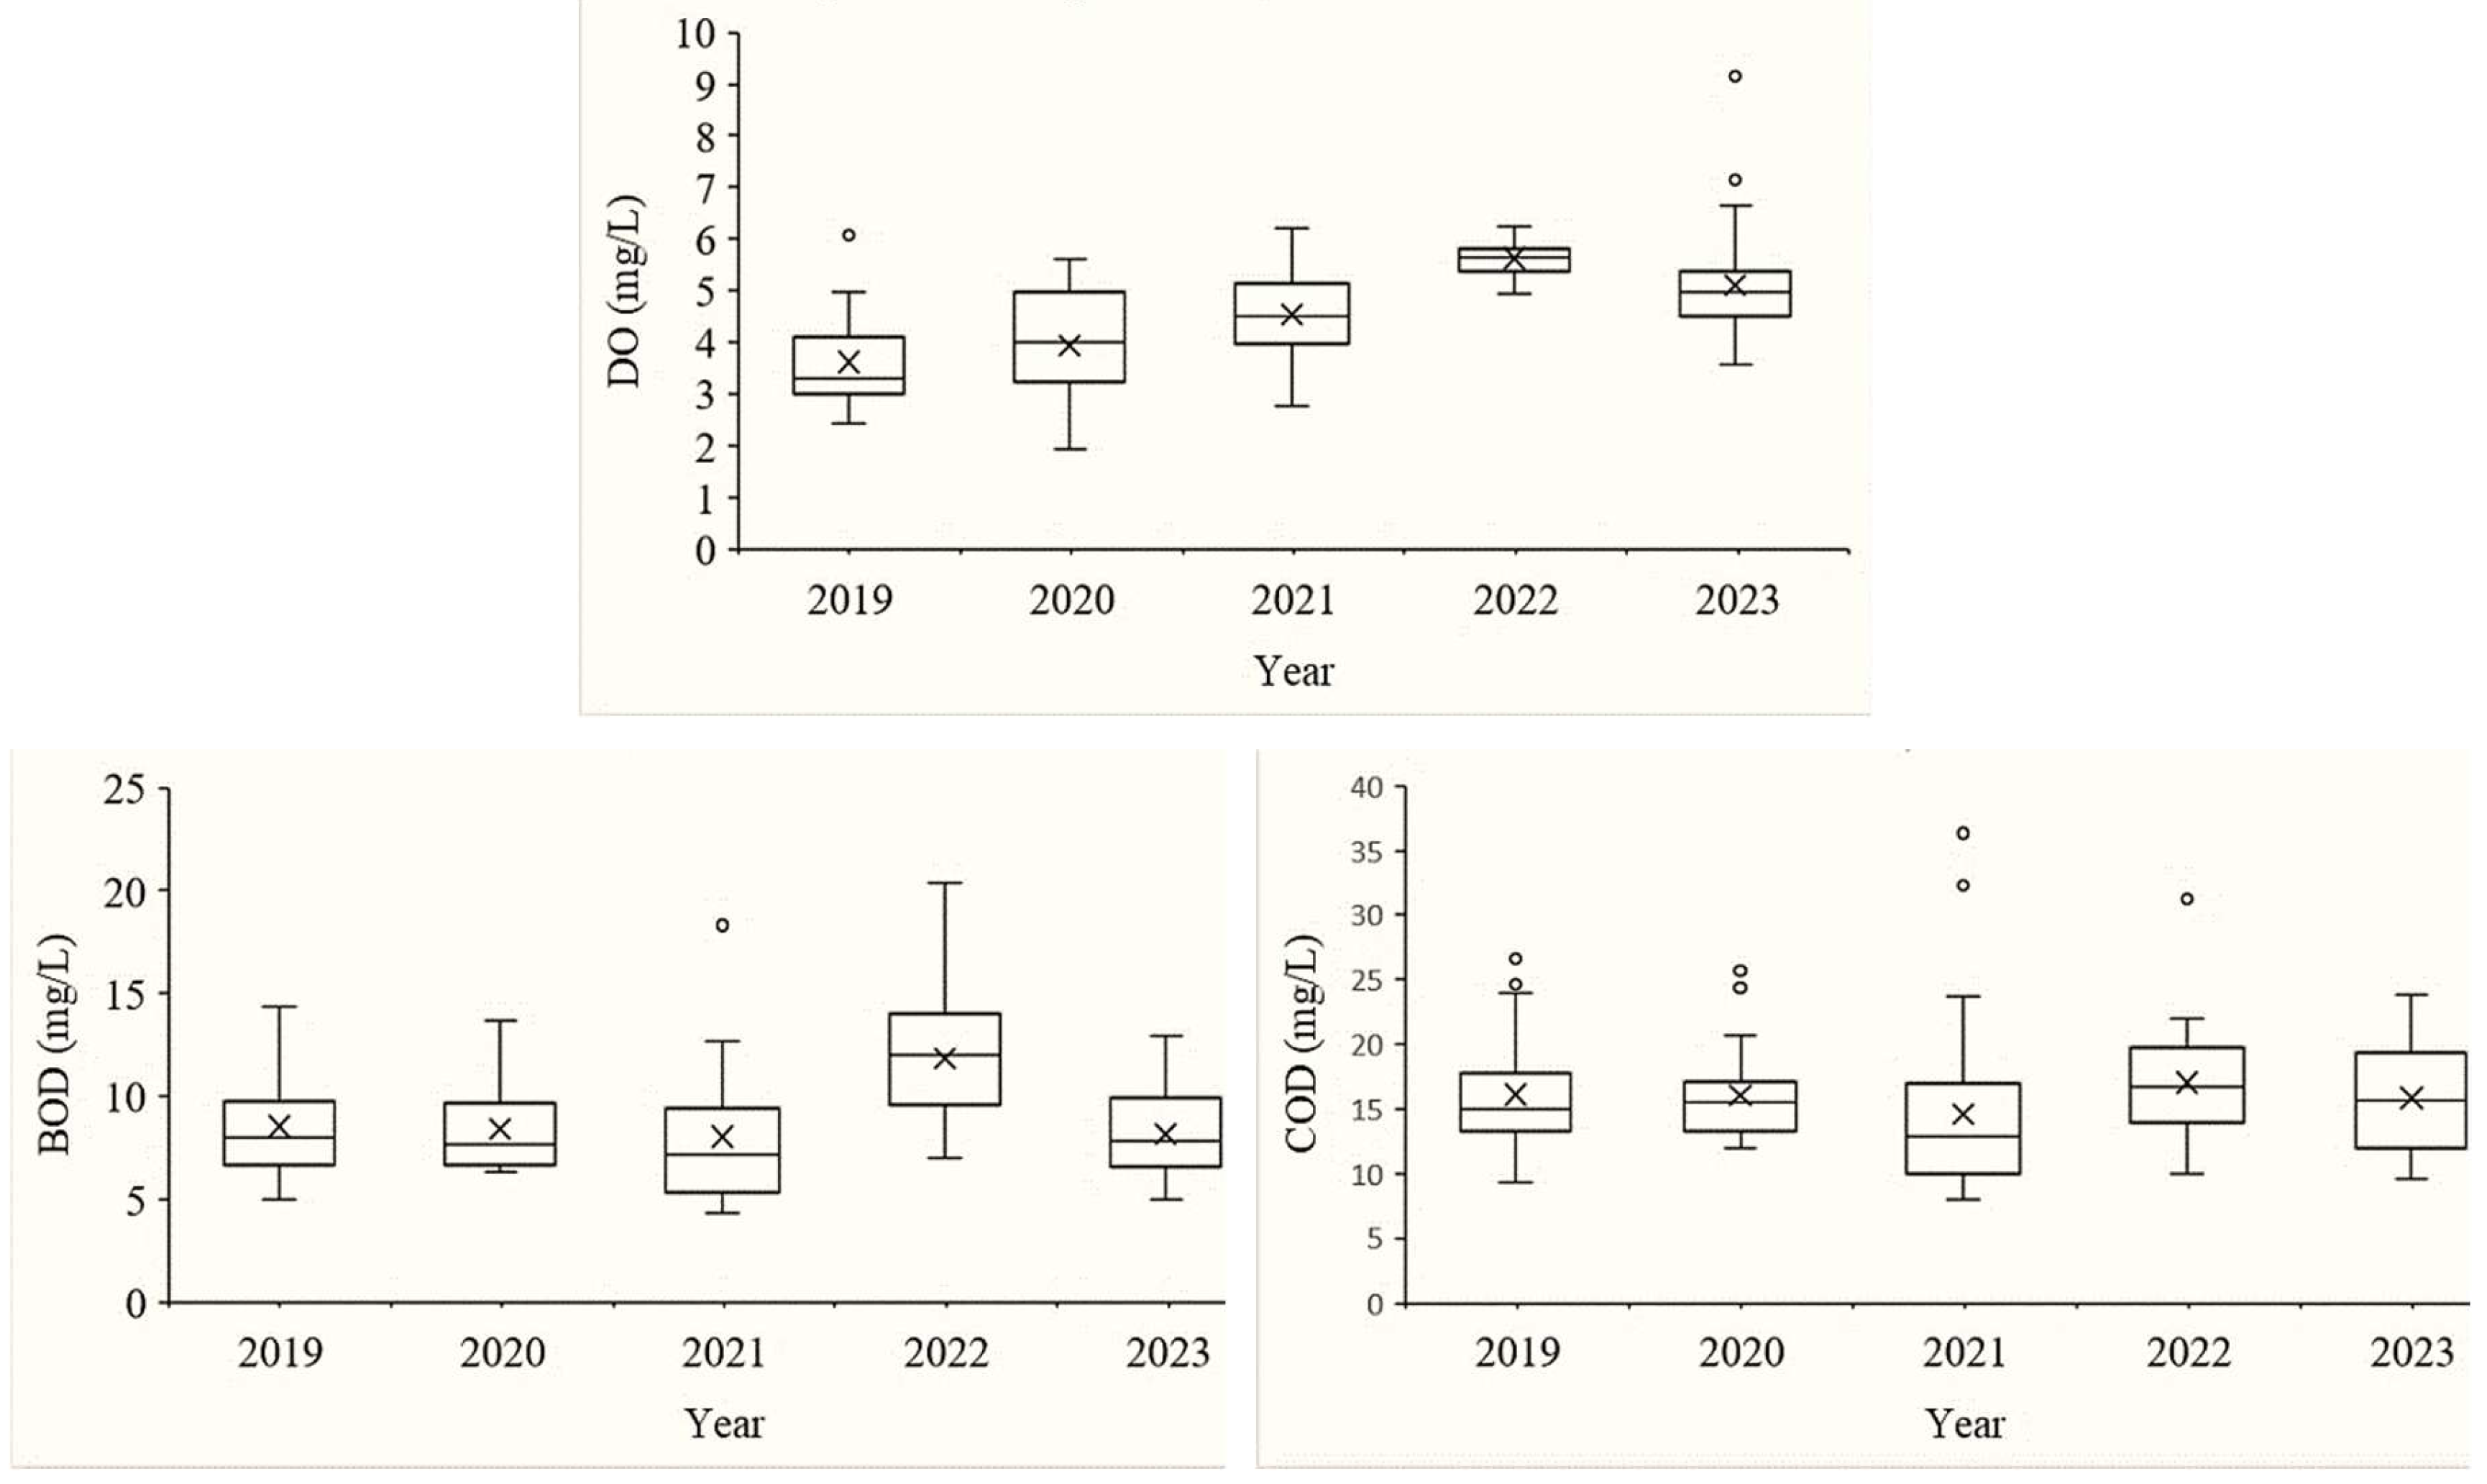
DO concentration ranged from 1.91–9.16 mg/L throughout the study period (Table 3, Figure 4). In 2019, DO ranged from 2.42–6.26 mg/L, averaging 3.61±0.93 mg/L, with 32 locations below the QCVN threshold (≥5 mg/L). In 2020, DO averaged 3.93±1.05 mg/L, with locations below the standard decreasing to 28. In 2021, DO averaged 4.54±0.83 mg/L, with locations below QCVN decreasing to 22. In 2022, DO averaged 5.62±0.34 mg/L, with only 1 location below the standard. In 2023, DO ranged from 3.57–9.16 mg/L, averaging 5.11±1.02 mg/L, with locations below QCVN rising again to 17. Statistical analysis showed that DO varied significantly between years (p<0.05), while the difference between 2019 and 2020 was not significant (p>0.05).
BOD ranged from 4.33–20.33 mg/L across the study period, with annual averages of 8.53±2.29 mg/L (2019), 8.42±2.07 mg/L (2020), 8.05±3.58 mg/L (2021), 11.86±2.89 mg/L (2022), and 8.15±2.16 mg/L (2023) (Table 3, Figure 4). In 2019, BOD ranged from 5.00–14.33 mg/L, with 31 locations exceeding QCVN 08:2023/BTNMT (>6 mg/L); this decreased to 21 locations in 2021. In 2022, BOD ranged from 7.00–20.33 mg/L, with all 34 monitoring locations exceeding the standard. In 2023, BOD ranged from 5.00–12.90 mg/L, with 27 locations exceeding the limit. Statistical analysis showed that BOD in 2022 was significantly different from the other years (p<0.05) (Table 3).
COD also varied during the study period (Figure 4). In 2019, COD ranged from 9.33–26.67 mg/L (16.12±4.18 mg/L), with 16 locations exceeding QCVN 08:2023/ BTNMT (>15 mg/L). In 2020, COD averaged 16.05±3.32 mg/L, with locations exceeding the threshold rising to 18. In 2021, COD averaged 14.62±6.73 mg/L, with exceeding locations decreasing to 10. In 2022, COD averaged 17.03±4.21 mg/L (10.02–31.23 mg/L), with 23 locations exceeding the standard. In 2023, COD averaged 15.84±4.36 mg/L (9.57–23.87 mg/L), with 19 locations exceeding the limit. Statistical analysis showed that COD in 2022 was significantly different from the other years (p<0.05) (Table 3).

3.1.4. Nutrient Pollutants

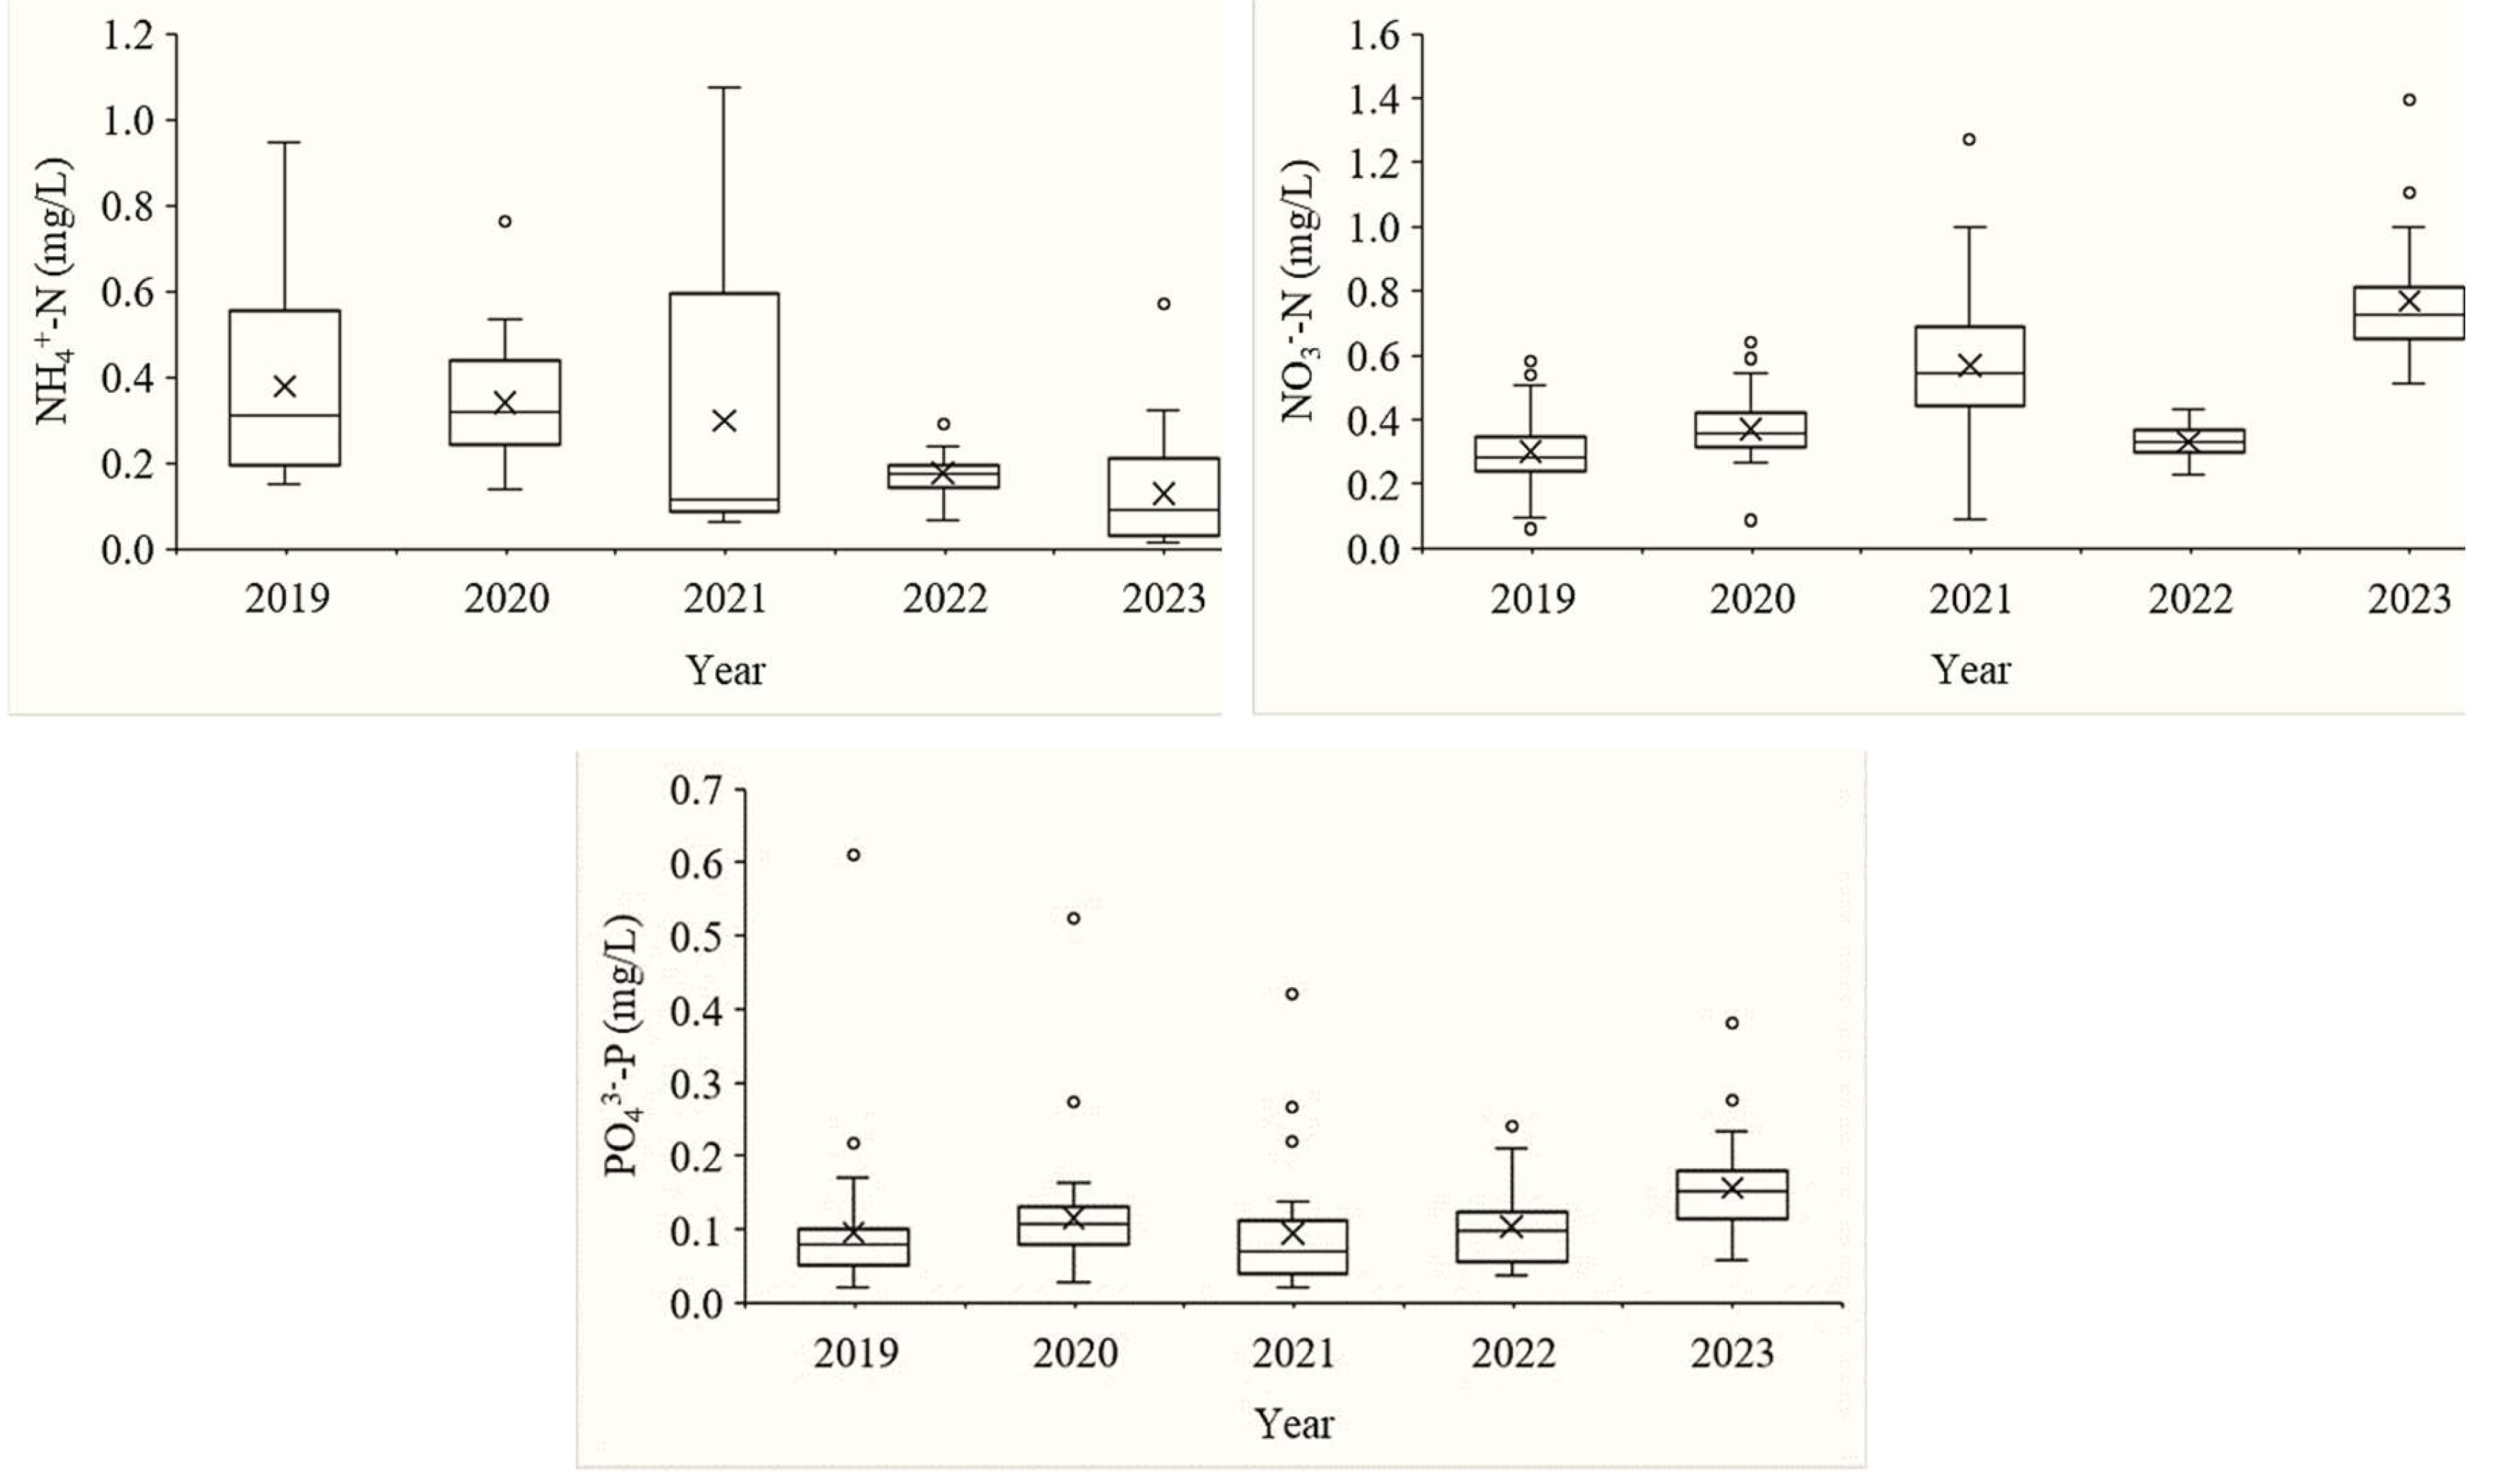
Nutrient pollutant concentrations (NH4+-N, NO3—N, PO43—P) were monitored within the study period (Figure 5).
NH4+-N concentration ranged from 0.15–0.95 mg/L in 2019 (0.38±0.22 mg/L). In 2020 and 2021, the average was 0.34±0.13 mg/L and 0.30±0.33 mg/L, respectively. From 2022, the average decreased to 0.18±0.04 mg/L (2022) and 0.13±0.12 mg/L (2023) (Table 3, Figure 5). Statistical analysis showed that NH4+-N concentrations in 2019, 2020, and 2021 did not differ significantly from each other (p>0.05) but were significantly higher than in 2022 and 2023 (p<0.05); no significant difference was found between 2022 and 2023 (p>0.05).
NO3—N concentration ranged from 0.06–0.58 mg/L in 2019 (0.30±0.11 mg/L). In 2020, the average was 0.37±0.11 mg/L (0.09–0.64 mg/L). In 2021, the average reached 0.57±0.22 mg/L (0.09–1.27 mg/L). In 2022, the average decreased to 0.33±0.04 mg/L (0.23–0.43 mg/L). In 2023, the average reached its highest value, 0.77±0.21 mg/L (0.51–1.40 mg/L), statistically significantly different from all other years (p<0.05) (Table 3, Figure 5).
PO43—P concentration ranged from 0.02–0.61 mg/L in 2019 (0.10±0.09 mg/L). In 2020, the average was 0.12±0.08 mg/L (0.03–0.52 mg/L). In 2021, the average decreased to 0.09±0.08 mg/L. In 2022, the average was 0.10±0.05 mg/L. In 2023, the average increased to 0.16±0.05 mg/L (0.06–0.38 mg/L), statistically different from all other years (p<0.05) (Table 3, Figure 5).

3.1.5. Chloride

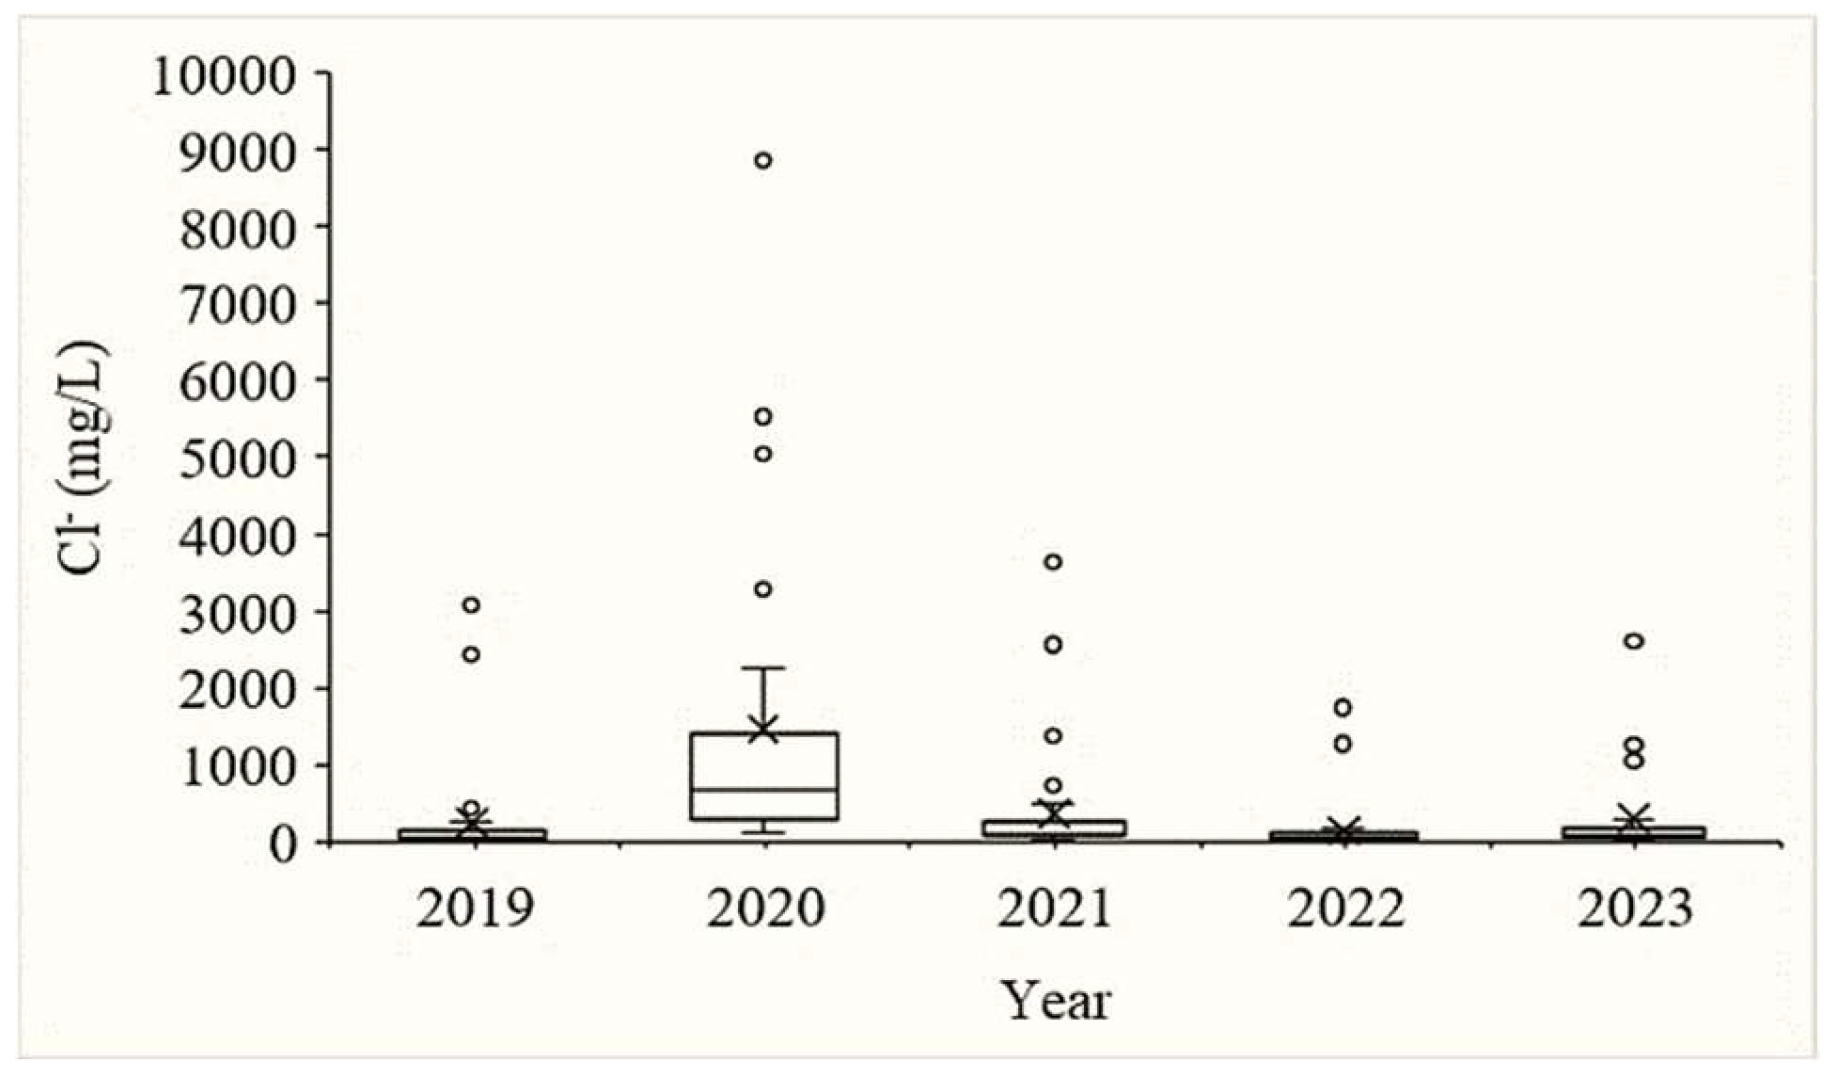
Cl- concentration in 2019 ranged from 13.73–3,088.33 mg/L (235.52±650.79 mg/L). In 2020, Cl- increased sharply to 108.27–8,871.07 mg/L (1,454.38±1,977.46 mg/L). In 2021, Cl- declined to 28.87–3,635.90 mg/L (361.29±753.65 mg/L). This downward trend continued in 2022 from 17.40–1,739.87 mg/L (143.11±353.04 mg/L) and in 2023 from 23.11–2,637.00 mg/L (298.62±643.85 mg/L) (Table 3, Figure 6). Statistical analysis showed that Cl- content in 2020 was significantly different from all other years (p<0.05).

3.1.6. Coliform

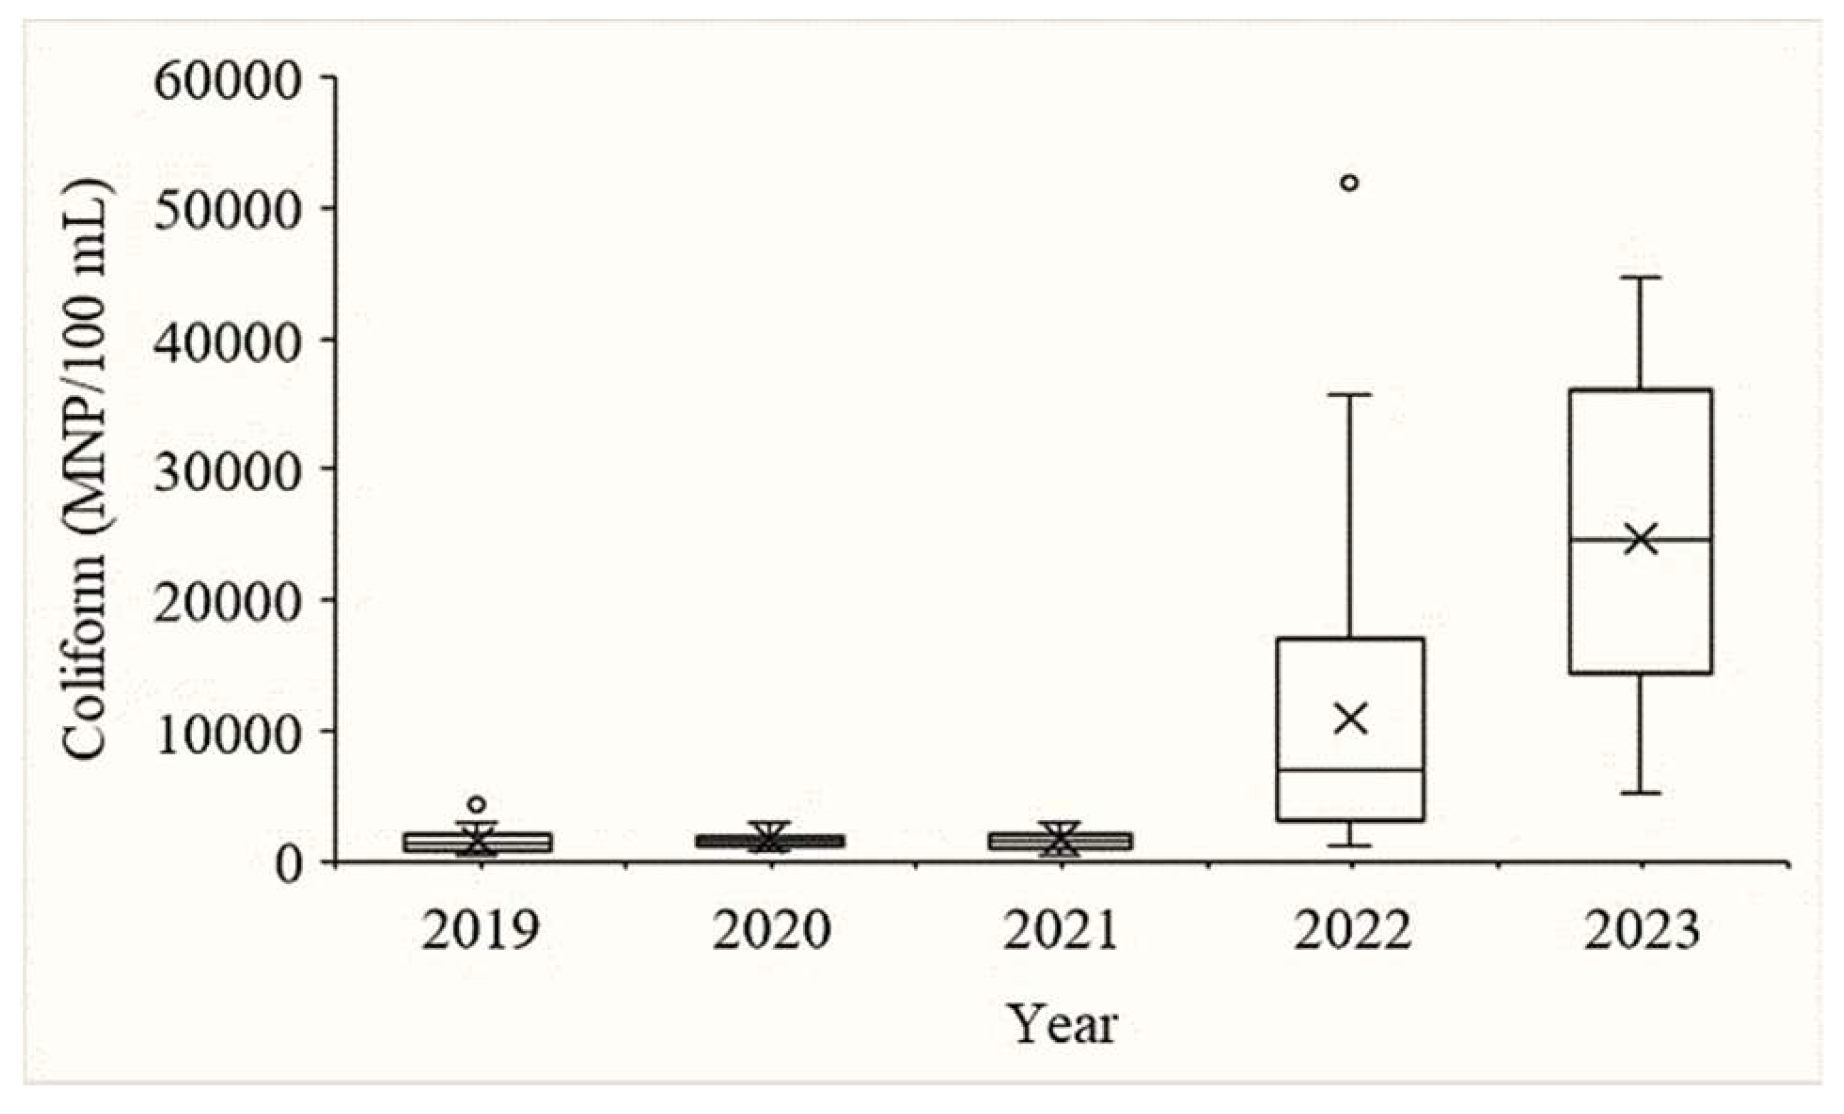
Coliform density in 2019 ranged from 550–4,333.33 MPN/100 mL (1,537.49±855.02 MPN/100 mL), within the QCVN 08:2023/BTNMT limit of <5,000 MPN/100 mL. In 2020 and 2021, coliform ranged from 753.33–4,200 MPN/100 mL and 645.67–4,933.33 MPN/100 mL, with averages of 1,697.94±797.83 and 1,695.29±982.44 MPN/100 mL, respectively, still within the standard. In 2022, coliform density rose sharply to 1,230–51,966.67 MPN/100 mL (10,921.18±10,997.51 MPN/100 mL), with 22 locations exceeding the QCVN 08:2023/BTNMT limit; the highest recorded value exceeded the standard by approximately tenfold. In 2023, coliform density ranged from 5,233.33–44,666.67 MPN/100 mL (24,684.31±11,087.57 MPN/100 mL), with all 34 monitoring locations exceeding the allowable limit (Table 3, Figure 7). Statistical analysis showed that coliform density did not differ significantly among 2019, 2020, 2021, and 2023 (p>0.05), but all these years differed significantly from 2022 (p<0.05).

3.2. Water Quality Index (2019–2023)

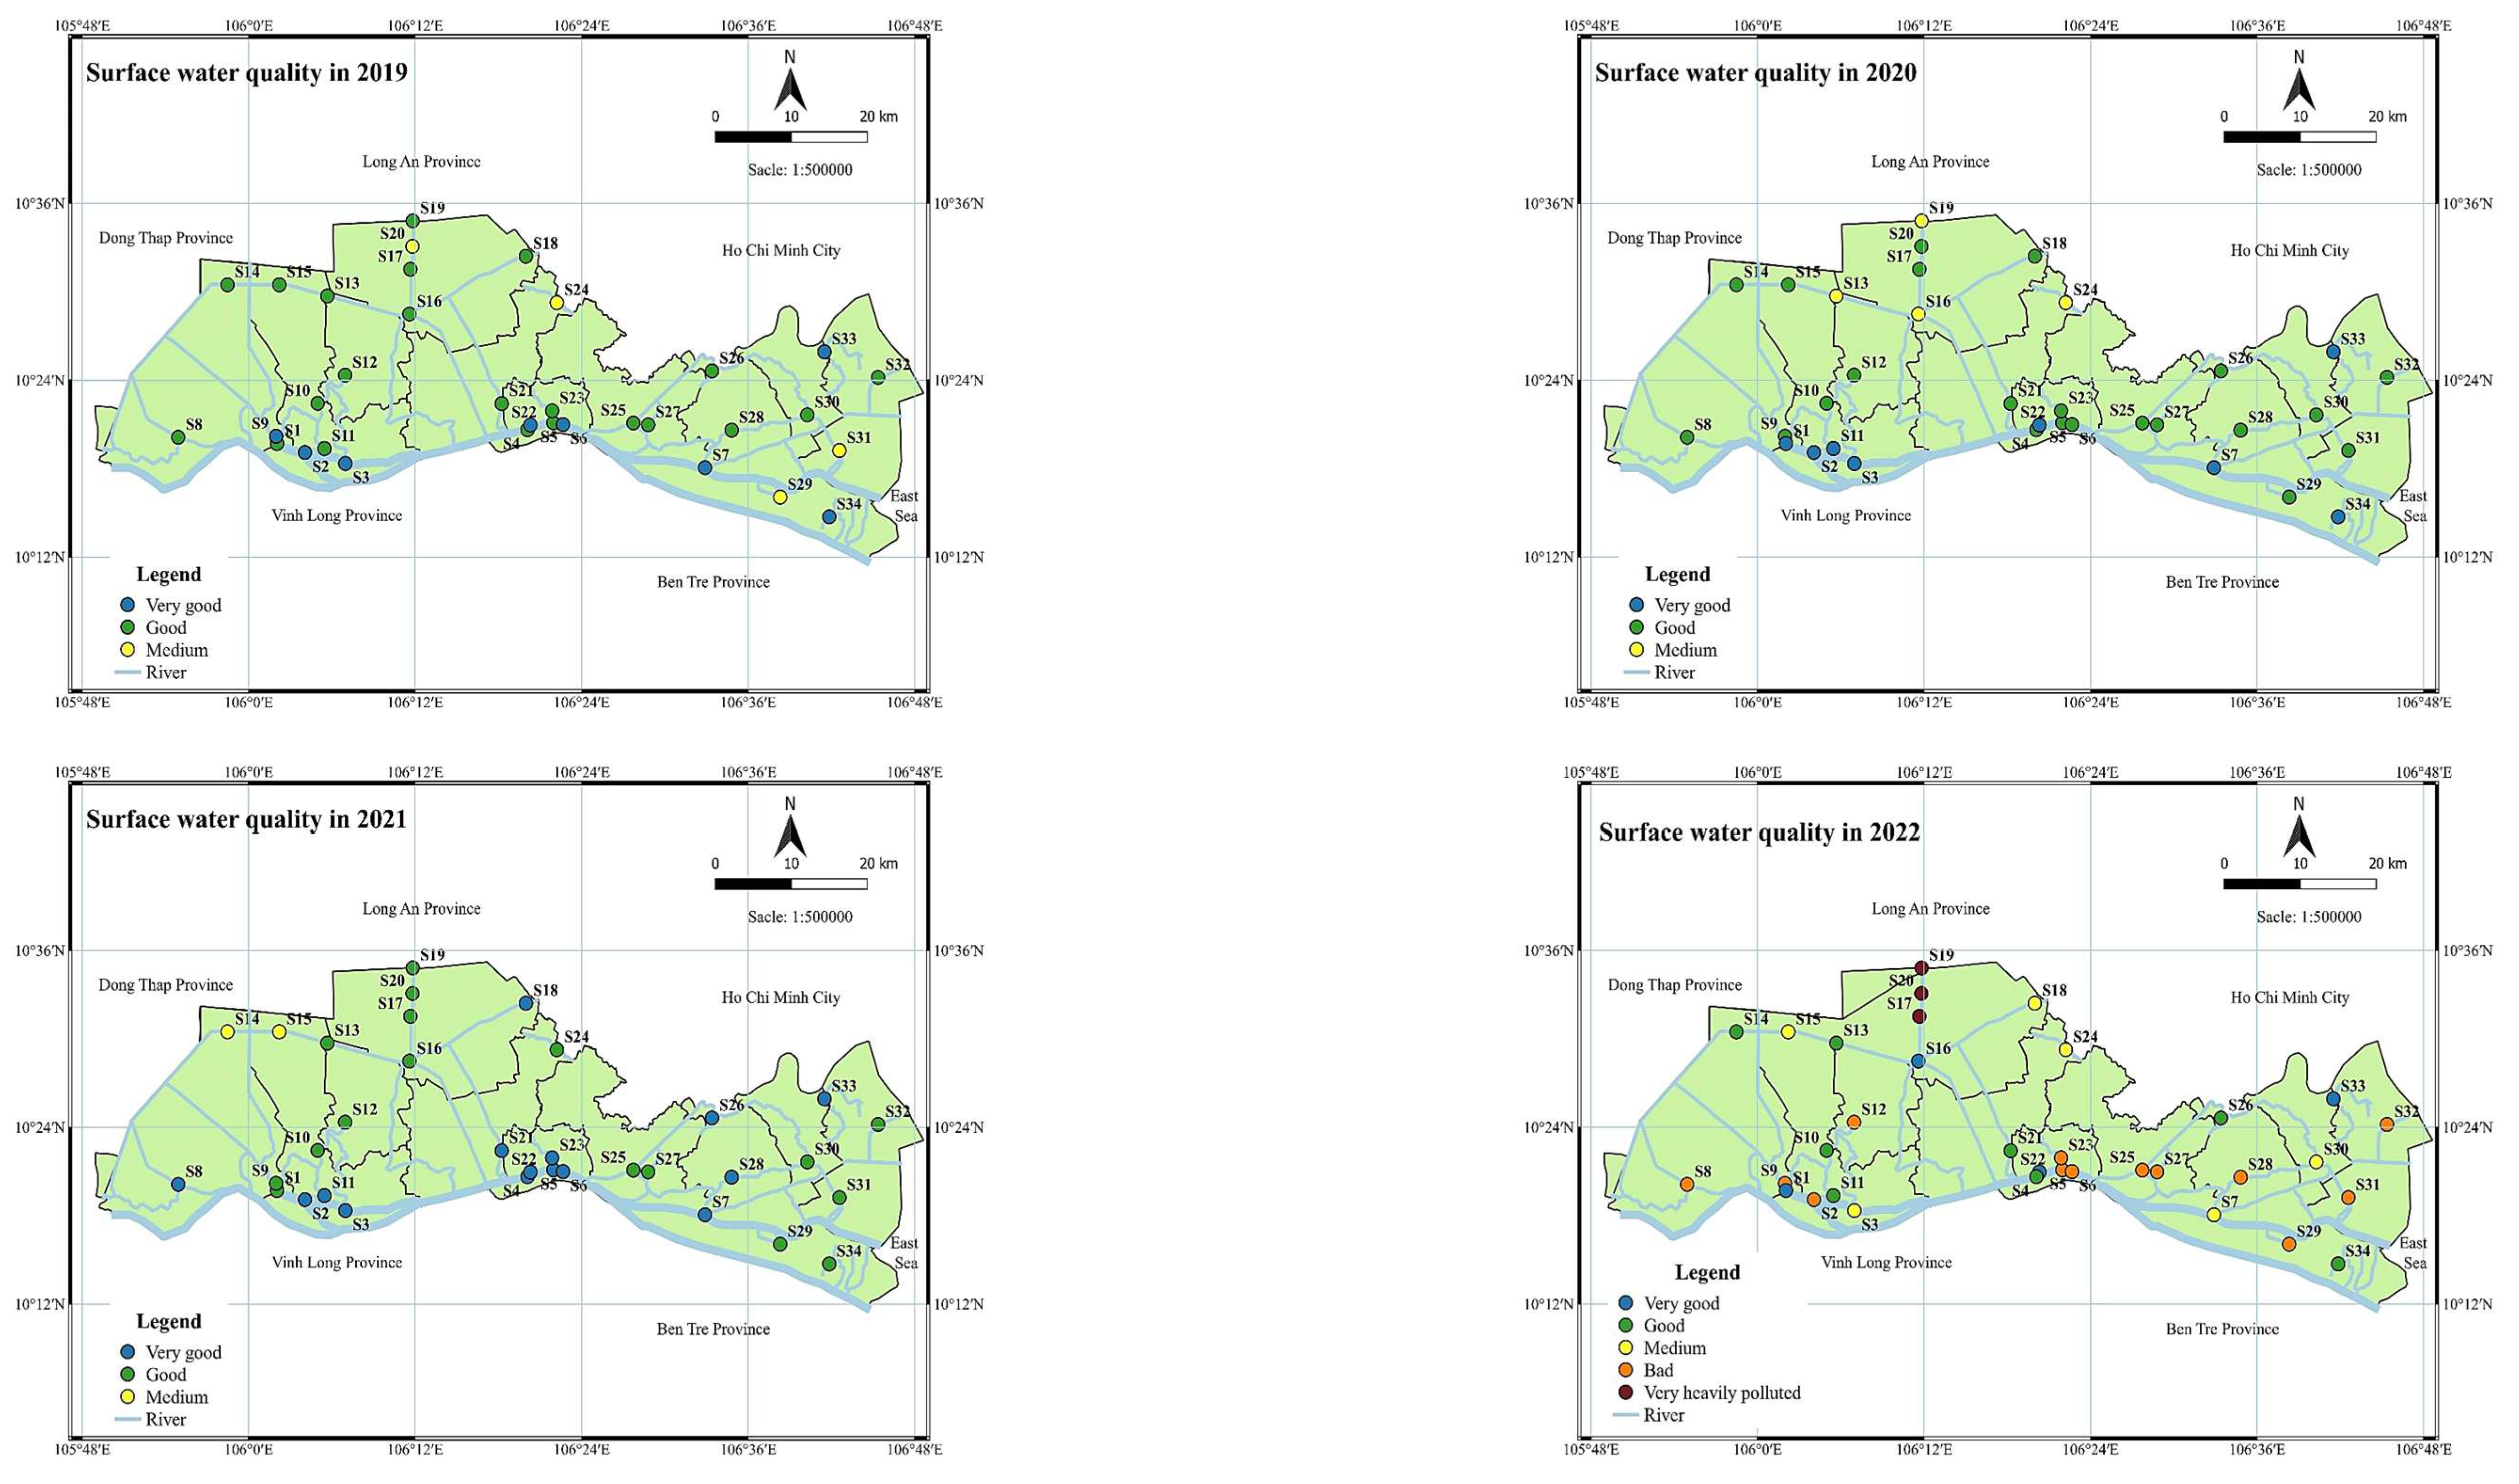
In 2019, VN_WQI at 34 monitoring stations ranged from 69 to 96, classifying water quality into three levels: very good, good, and average (Figure 8). Very good water quality was recorded at 8 locations (23.53%): S2, S3, S6, S7, S9, S22, S33, and S34. Good water quality accounted for the largest proportion (64.71%; 22 locations), including S1, S4, S5, S8, S10–S19, S21, S23, S25–S28, S30, and S32. Average water quality was recorded at 4 locations (11.76%): S20, S24, S29, and S31, concentrated in inland canals such as Tram Mu canal, Ong Dao canal, and Nhiem canal.
In 2020, VN_WQI ranged from 68 to 95. Very good water quality was recorded at 8 locations (23.53%): S1, S2, S3, S7, S11, S22, S33, and S34. Good water quality accounted for the highest proportion (64.71%; 22 locations): S4–S6, S8–S10, S12, S14, S15, S17, S18, S20, S21, S23, and S25–S32. Average water quality was recorded at 4 locations (11.76%): S13, S16, S19, and S24. Compared with 2019, the minimum VN_WQI decreased slightly (from 69 to 68) and the maximum from 96 to 95, while the number of stations in each class was unchanged (8 very good, 22 good, 4 average), although individual stations shifted between classes.
In 2021, VN_WQI ranged from 65 to 97, across three levels: very good, good, and average. Very good water quality was recorded at 15 stations (44.12%): S2–S8, S11, S18, S21–S23, S26, S28, and S33. Good water quality was recorded at 17 stations (50%): S1, S9, S10, S12, S13, S16, S17, S19, S20, S24, S25, S27, S29–S32, and S34. Stations S14 and S15 recorded average water quality; at these two stations, DO was <4 mg/L and COD and BOD exceeded the standard by 1.8 times. Compared with 2020, the number of stations with very good water quality increased from 8 to 15, stations with average water quality decreased from 4 to 2, the maximum VN_WQI increased from 95 to 97, and the minimum decreased from 68 to 65.
In 2022, VN_WQI ranged from 9 to 94, across five levels: very good, good, average, poor, and very heavily polluted. Very good water quality was recorded at 4 stations (11.76%): S1, S16, S22, and S33. Good water quality was recorded at 8 stations (23.53%): S4, S10, S11, S13, S14, S21, S26, and S34. Average water quality was recorded at 6 stations (17.65%): S3, S7, S15, S18, S24, and S30. Poor water quality was recorded at 13 stations (38.24%): S2, S5, S6, S8, S9, S12, S23, S25, S27–S29, S31, and S32. Very heavily polluted water quality (VN_WQI <10) was recorded at 3 stations (8.82%): S17, S19, and S20; at these stations, pH was low, and NH4+-N, BOD, COD, and coliform exceeded the QCVN 08:2023/BTNMT limit. Compared with 2021, the number of stations with very good water quality decreased from 15 to 4, very heavily polluted stations appeared for the first time since 2019, and the minimum VN_WQI dropped from 65 to 9.
In 2023, VN_WQI ranged from 23 to 71, across three levels: average, poor, and heavily polluted. Station S34 recorded average water quality (VN_WQI = 71; 2.94%). Stations S20 and S24 recorded heavily polluted water quality (5.88%). The remaining 31 stations (91.18%) recorded poor water quality. Compared with 2022, the maximum VN_WQI decreased from 94 to 71, stations with poor water quality increased from 13 to 31, and no stations retained very good or good water quality (compared with 4 and 8 stations, respectively, in 2022).
Across the 2019–2023 period, VN_WQI at the 34 monitoring stations showed the following trend: in 2019–2020, water quality was mainly at good to very good levels (VN_WQI 68–96), with more than 85% of stations maintaining stable quality; in 2021, the proportion of stations with very good water quality temporarily increased to 44.12%; from 2022, VN_WQI values ranged from 9 to 94, with a marked increase in the number of stations at poor, heavily polluted, and very heavily polluted levels; by 2023, 91.18% of stations recorded poor water quality (VN_WQI 23–71).

3.3. Spatial Clustering of Monitoring Stations

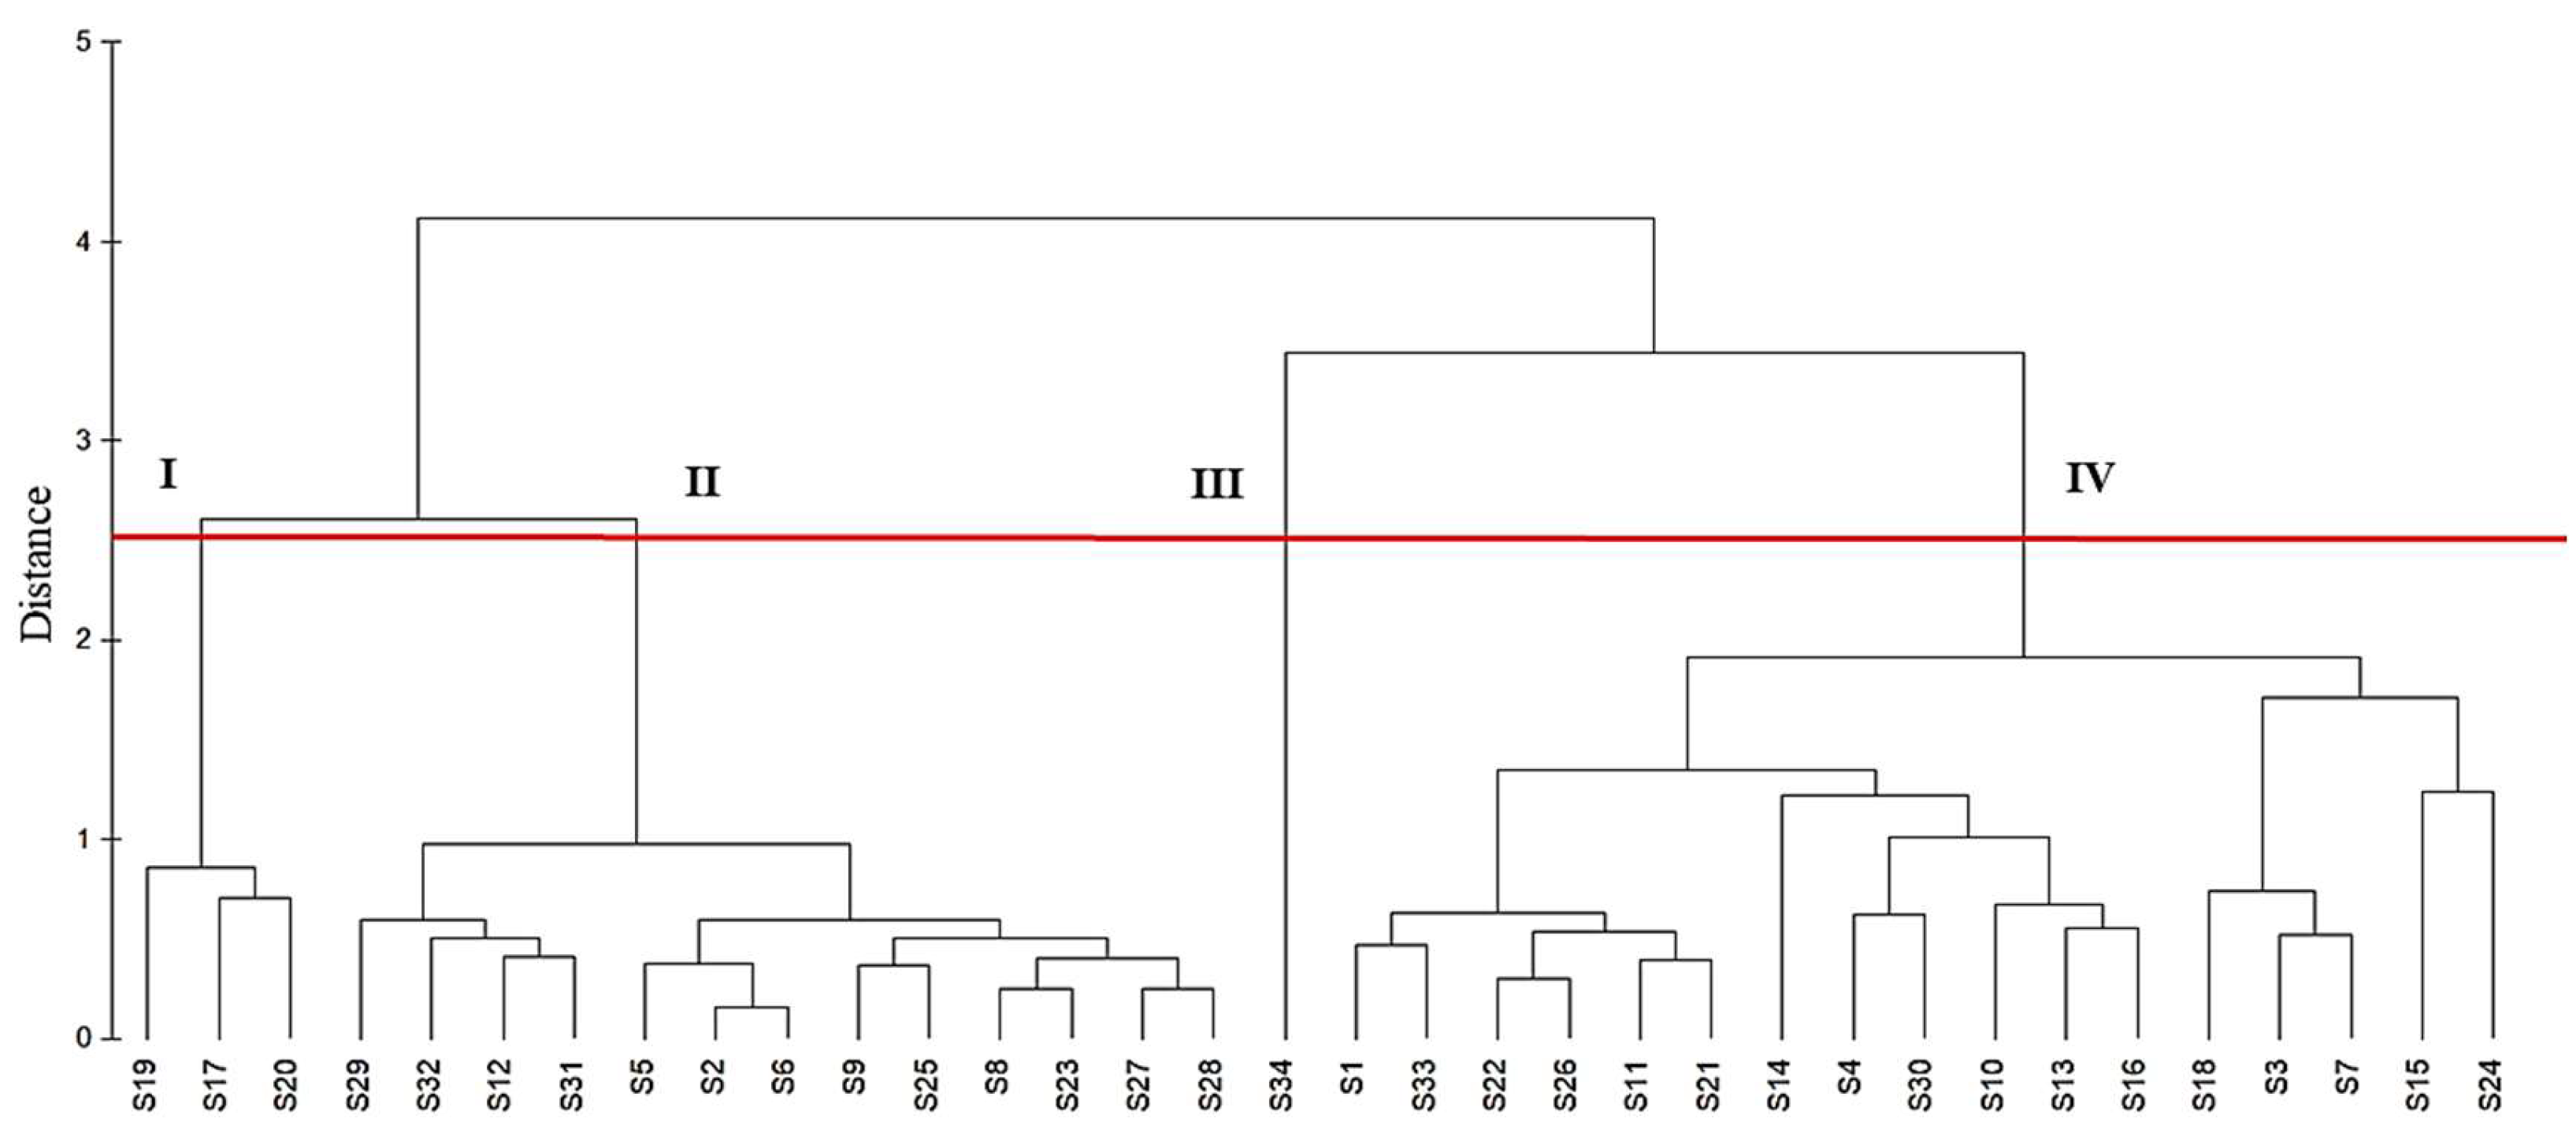
Based on the VN_WQI results at 34 monitoring stations in Tien Giang province during 2019–2023, CA identified four groups of stations with distinct water quality characteristics (Figure 9).
Group I comprised three monitoring stations: S17 (Truong Van Sanh canal), S19 (Dong Bac canal), and S20 (Tram Mu canal). The VN_WQI at these stations ranged from 9 to 90 over the study period, corresponding to water quality levels from good to very heavily polluted — the widest range and the lowest minimum value among the four groups.
Group II comprised 13 monitoring stations: S2, S5, S6, S8, S9, S12, S23, S25, S27, S28, S29, S31, and S32. The VN_WQI at these stations ranged from very good to poor.
Group III comprised a single station, S34 (Ly Quan canal). The VN_WQI at this station ranged from 71 to 95, corresponding to water quality from very good to average — the highest values among the four groups.
Group IV comprised 17 monitoring stations: S1, S3, S4, S7, S10, S11, S13–S16, S18, S21, S22, S24, S26, S30, and S33. The VN_WQI at these stations ranged from very good to heavily polluted, similar to Group II, but with narrower fluctuation between stations and across years.

3.4. Principal Component Analysis

PCA extracted four principal components (PCs) with eigenvalues greater than 1, together explaining 77% of the total variance in the dataset (Figure 10).
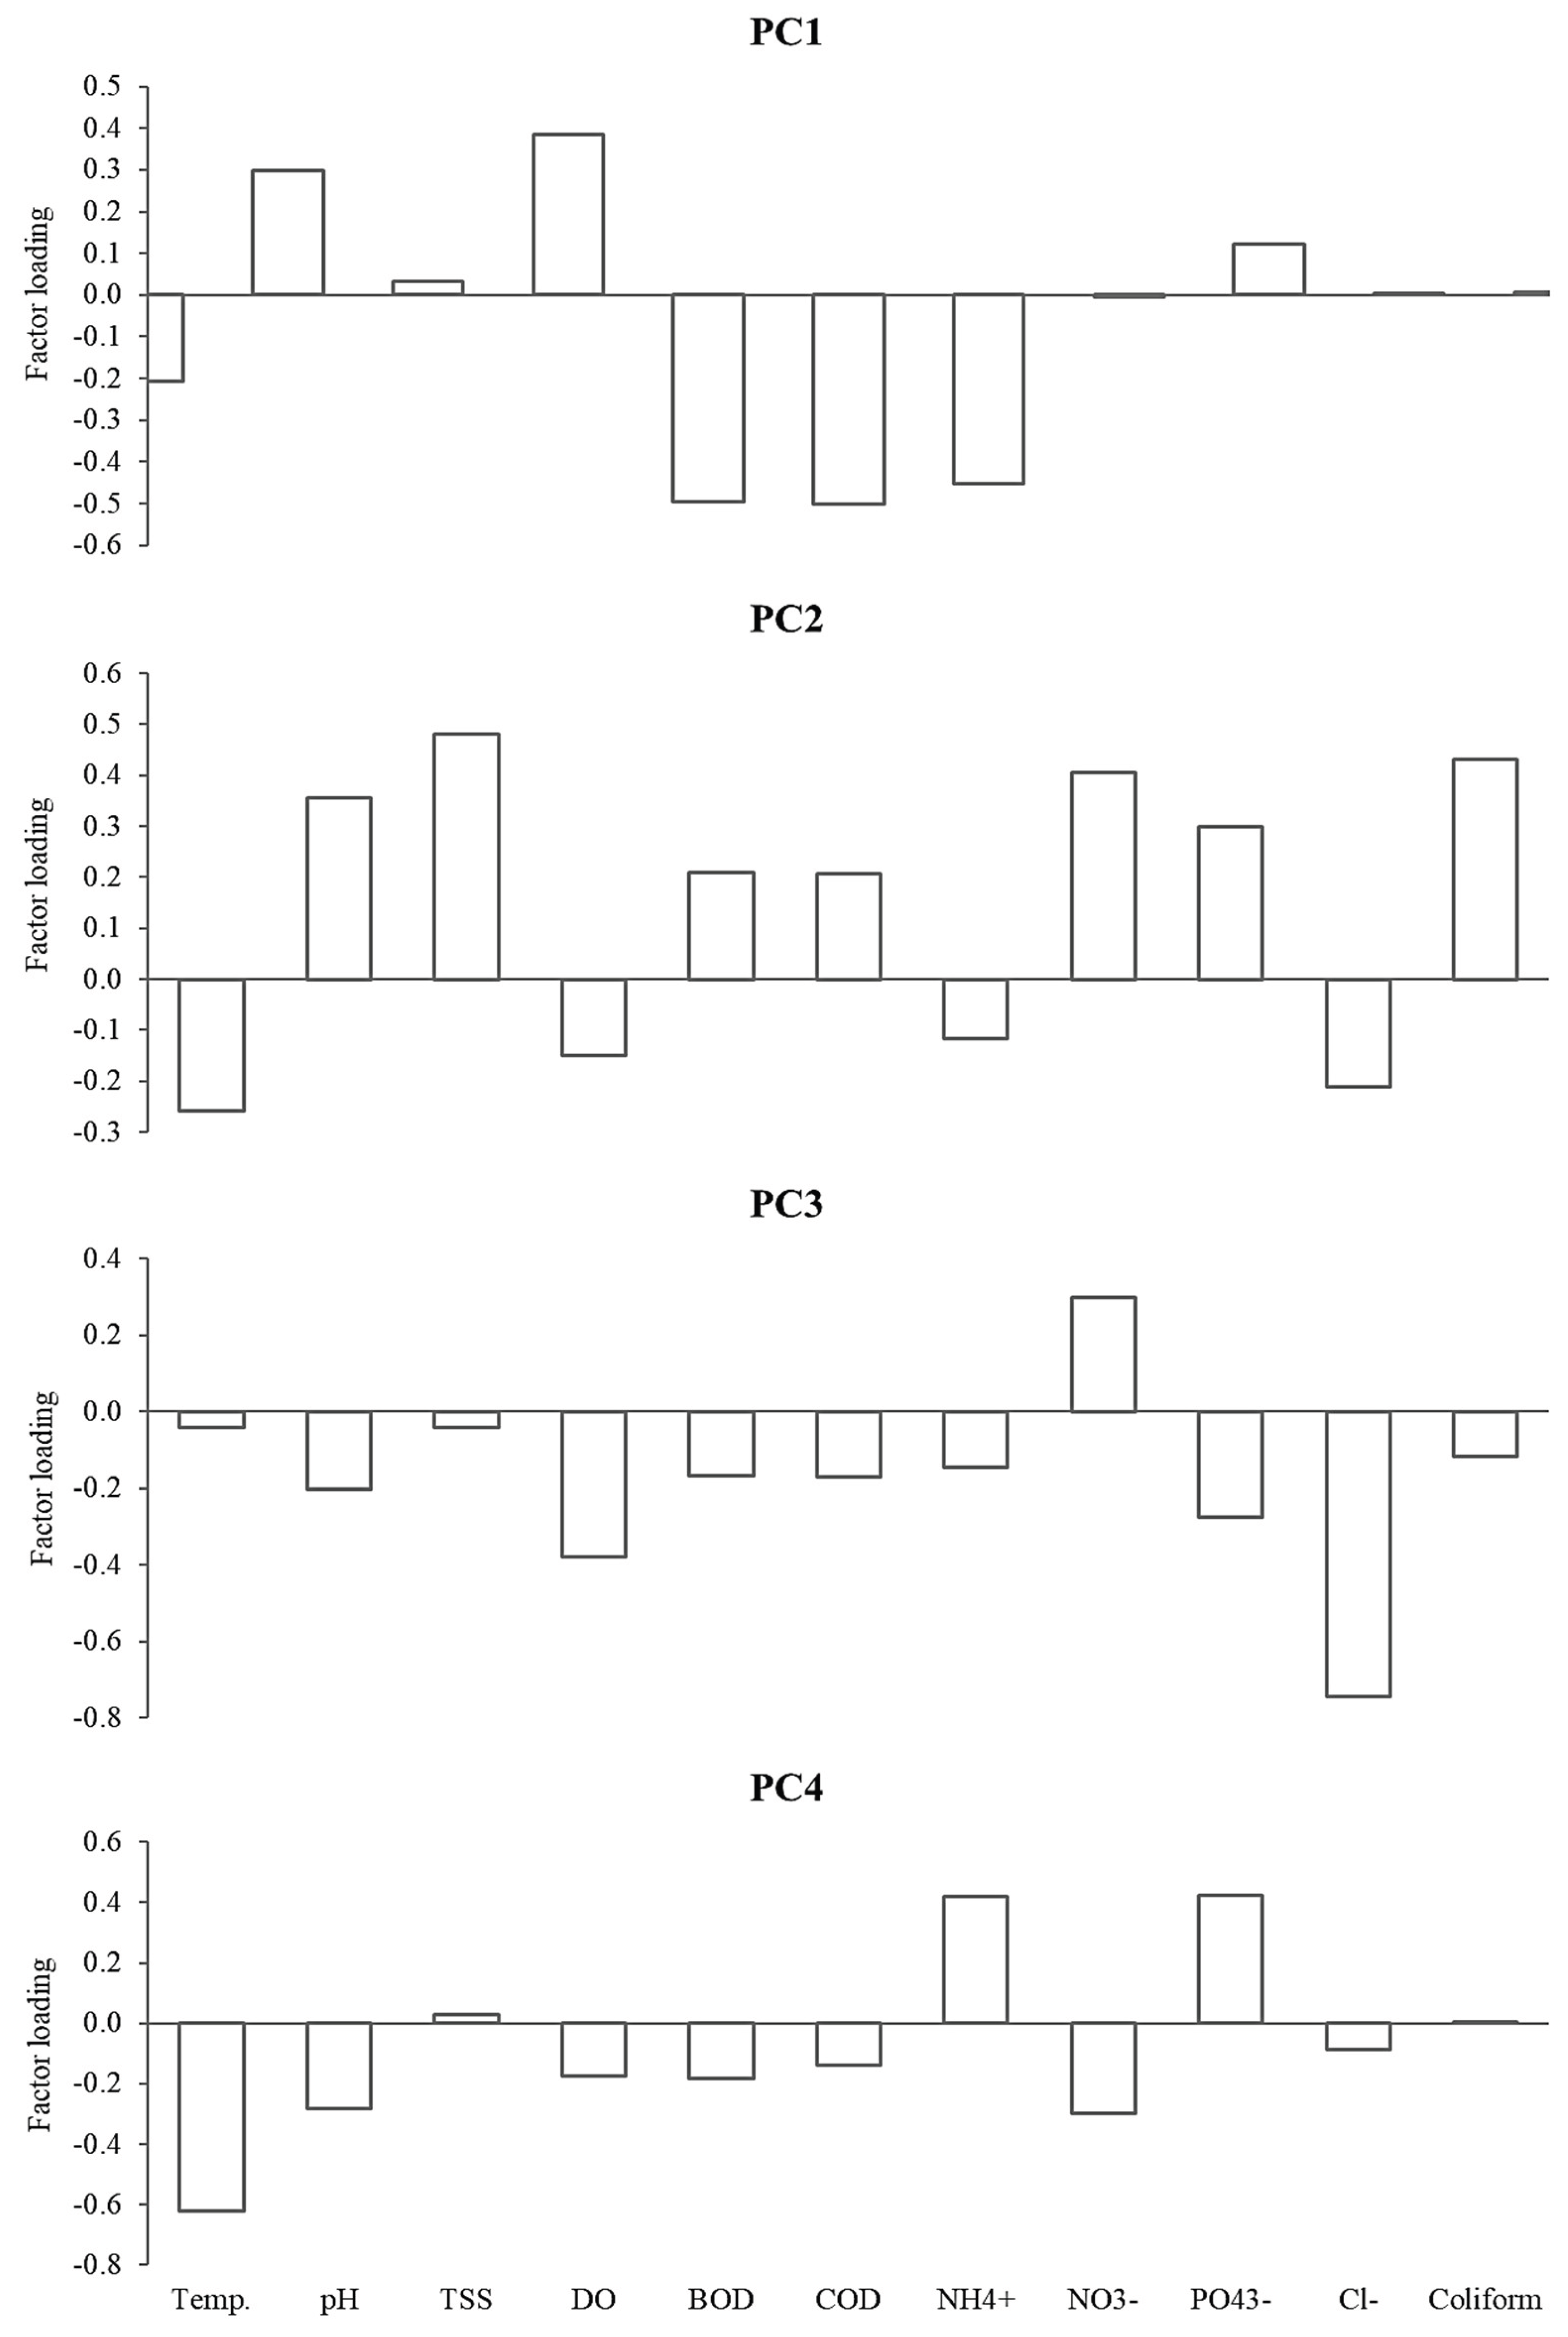
PC1 explained 28.2% of the total variance. PC1 showed a weak positive correlation with DO (r = 0.385) and weak-to-moderate negative correlations with BOD (r = −0.497), COD (r = −0.502), and NH4+-N (r = −0.452) (Figure 11).
PC2 explained 24.3% of the total variance. PC2 showed weak positive correlations with pH (r = 0.355), TSS (r = 0.480), NO3--N (r = 0.406), and coliform (r = 0.432) (Figure 11).
PC3 explained 13.9% of the total variance. PC3 showed a weak negative correlation with DO (r = −0.379) and a moderate negative correlation with Cl- (r = −0.744) (Figure 11).
PC4 explained 10.5% of the total variance. PC4 showed a moderate negative correlation with temperature (r = −0.621) and moderate positive correlations with NH4+-N (r = 0.418) and PO43--P (r = 0.424) (Figure 11).
Together, PC1 and PC2 accounted for 52.5% of the total variance explained by the four-component solution.

4. Discussion

4.1. Trends and Drivers of Physicochemical and Microbiological Water Quality

The significant interannual variation in surface water temperature, with 2020 and 2021 differing from the other years, may be related to differences in solar radiation intensity, rainfall, and surface runoff between years [37,38]. The temperature range recorded in Tien Giang was similar to that reported by Muoi et al. [30] in the Ca Mau Peninsula (28.73–34.10°C) and Giao & Minh [27] in Ben Tre province (26.3–32.9°C), but higher than the average recorded by Giao [39] in the Hau river basin (26.85±3.61°C to 29.84±1.11°C); this difference may stem from geographical factors, urbanization level, agricultural activity, and hydrological conditions typical of each region. Overall, the recorded temperature range remained within limits generally suitable for aquatic life.
The marked interannual variation in pH, particularly the decrease observed in 2022, may reflect the combined influence of dry- and rainy-season cycles, changes in water supply from the Tien River and inland canals, and impacts from production activities. Low pH can increase the dissolution of heavy metals such as aluminum, copper, and zinc, raising their toxicity in water [40], while high pH can favor the formation of free ammonia, which is toxic to aquatic organisms [41]. Compared with other areas of the VMD, pH in Tien Giang fluctuated more widely than in An Giang (6.4–7.3) [42], Dong Thap (7.15–7.36) [26], Hau Giang (6.76–6.89) [24], Ben Tre (6.53–8.02) [27], and Vinh Long (7.22–7.77) [23].
The elevated TSS recorded in 2019–2020, concentrated at sites along the Tien River, fishing port areas, and areas affected by seafood processing, is consistent with the Tien River's naturally high alluvial content. Seafood processing wastewater typically contains elevated suspended solids (70–400 mg/L [43]), and the strong saltwater intrusion recorded during this period may have further raised TSS, since increased salinity tends to elevate suspended solids in water [44]. Elevated TSS can reduce light transmission and affect aquatic life, as well as increase water treatment costs [45]. The decline in TSS after 2020 may reflect changes in flow regimes and reduced agricultural and industrial impacts.
DO concentrations below 5 mg/L can adversely affect the activity and survival of aquatic organisms, and concentrations below 2 mg/L can cause the death of most fish species [46], consistent with the persistence of locations recording DO below the standard throughout the study period, particularly the renewed increase observed in 2023. The sharp rise in BOD recorded in 2022 may have resulted from discharge activities associated with agricultural, industrial, and domestic production, combined with unfavorable hydrological conditions that intensified the pollution load; COD followed a broadly similar pattern. This pattern is consistent with organic pollution being widespread across the VMD, particularly in areas affected by multiple pollution sources such as Vinh Long, Dong Thap, Kien Giang, and Hau Giang [23,24,26,47].
The declining trend in NH4+-N from 2019 to 2023 may reflect a change in waste sources or the transformation of ammonium in water, potentially through oxidation to nitrate, consistent with the concurrent increase in NO3--N over the same period. The sharp increases in NO3--N recorded in 2021 and 2023 may be related to increased nitrate fertilizer use in agriculture, nutrient leaching from soil during the rainy season, or changes in hydrological conditions; even so, NO3--N levels in Tien Giang during 2019–2023 remained far lower than in areas affected by unsustainable intensive agriculture, such as the Mures river (7.5–27.3 mg/L) [48], and Gowienica Miedwiańska river (0.3–89.7 mg/L) [49]. The decrease in PO43--P recorded in 2021 may reflect phosphate adsorption and deposition into sediments or reduced discharge loads, while the sharp increase in 2023 may relate to phosphate leaching from cultivated land, domestic wastewater discharge, or sediment resuspension linked to changing hydrological conditions. PO43--P concentrations during 2019–2022 were lower than in some high-intensity agricultural areas, such as the Itchen River (up to 0.7 mg/L) [50] and the Mures River (1.2 mg/L) [48], but by 2023 exceeded levels reported in some other water bodies [51,52,53]. The concurrent rise in NO3--N and PO43--P toward the end of the study period raises the risk of eutrophication, which can promote excessive algal growth, limit light penetration into deeper water layers, suppress photosynthesis, and ultimately cause hypoxia and death of aquatic plants [54].
Chloride is a common ion in natural water, typically present at 10–20 mg/L in river water and up to approximately 19,000 mg/L in seawater [55]. The sharp increase in Cl- recorded in 2020 may be related to the severe drought that occurred that year in the VMD, when reduced rainfall and diminished flow from the upper Mekong River allowed deeper saline intrusion inland, particularly in the Tien River area; according to Hong et al. [55], water sources infiltrated by 1% seawater can show Cl- concentrations rising to around 190 mg/L. Saltwater intrusion during this period was not unique to Tien Giang and was also recorded in coastal provinces such as Soc Trang, Ca Mau, and Kien Giang [47,56]. Elevated Cl- concentrations can harm the agricultural sector by degrading irrigation water sources, reducing crop yields, and limiting plant growth, and can also harm aquatic ecosystems and biodiversity.
Coliform bacteria mainly originate in the intestinal systems of humans and animals and are excreted through body waste into the aquatic environment [1]. The unusual increase in coliform density recorded in 2022, which remained elevated in 2023, is consistent with the prevalence of coliform pollution across the VMD, particularly in areas with high population density, ineffective wastewater treatment systems, and impacts from agricultural production, livestock, and aquaculture [23,29]. Although coliform bacteria do not directly cause disease, they serve as a warning sign of potential pathogenic microorganisms [57]; according to WHO statistics, approximately 80% of infectious diseases and 50% of child deaths worldwide are linked to contaminated water sources [58].

4.2. Water Quality Index Trends and the Divergence Between Improving DO and Declining Overall Water Quality

Although DO exhibited a clear improving trend, from an average of 3.61±0.93 mg/L in 2019 to 5.62±0.34 mg/L in 2022, this improvement was not sufficient to offset the overall decline in surface water quality reflected in the VN_WQI. The composite VN_WQI is strongly shaped by other sub-indices - particularly coliform, which increased more than six-fold between 2021 (1,695.29±982.44 MPN/100 mL) and 2022 (10,921.18±10,997.51 MPN/100 mL) and continued to rise through 2023 (24,684.31±11,087.57 MPN/100 mL) - together with persistently elevated BOD and COD levels in 2022–2023. This divergence explains why the overall VN_WQI trend showed marked deterioration despite the improving oxygen regime.
The progressive decline in VN_WQI from 2022 onward reflects the cumulative impact of organic pollution, nutrients, and microbial contamination from agricultural and industrial activities and untreated domestic wastewater, compounded by climate change and altered flow regimes. Stations with low VN_WQI were mainly concentrated in economic centers, industrial parks and clusters, residential areas, livestock production areas, and areas where salinity-prevention projects were under construction.
Compared with neighboring provinces, VN_WQI in Tien Giang during the study period (9–97) fluctuated more widely and reached lower minimum values than in Vinh Long (WQI = 65–91) [23], Hau Giang (WQI = 23–96) [24], and Bung Binh Thien (WQI = 67–94) [15], indicating that surface water quality in Tien Giang deteriorated more severely than in these neighboring areas of the VMD during the same period.
Notably, VN_WQI does not incorporate chloride or salinity (Equation 2), so the 2020 salinity peak, the most significant hydrological stress of the study period, is not reflected in the index: VN_WQI remained within the good-to-very-good range in 2020 even though mean Cl− concentrations increased more than six-fold relative to 2019. For coastal provinces where salinity is a primary constraint on irrigation and domestic water use [9,10,59], VN_WQI should therefore be complemented by salinity-specific thresholds when assessing water suitability.

4.3. Spatial Pollution Patterns and Probable Causes

The clear differences in water quality among the four CA-identified groups likely reflect the combined influence of socio-economic development activities, hydrological conditions, natural self-purification processes, and pollution control efforts specific to each area. Group I (S17, S19, S20), which recorded the widest VN_WQI range and the lowest minimum values among the four groups, was likely affected by multiple untreated or inadequately treated wastewater sources, including domestic wastewater, industrial wastewater, and residual agricultural chemicals. Groups II and IV, both of which showed wide fluctuations in water quality, may be influenced by unstable or intermittent pollution sources, or by changing environmental conditions over time; some locations in these groups may be affected by wastewater from urban and industrial areas but retain some capacity for recovery through dilution and water circulation within the drainage network, although pollution levels at locations approaching the poor end of this range suggest the potential for pollutant accumulation in the aquatic environment. Group III (S34), which maintained the highest VN_WQI values throughout the study period, may be located in an area less affected by point-source pollution, or may benefit from more effective self-cleaning mechanisms associated with favorable hydrological conditions.
Cluster analysis based on water quality indices has been applied successfully in numerous other regions to classify river, lake, and coastal monitoring stations according to the influence of industrial, agricultural, and domestic activities on water quality [60,61]. Applying this approach in Tien Giang helps optimize environmental monitoring strategies, reduce monitoring costs, and support a more accurate, spatially targeted assessment of water quality trends across the province's monitoring stations.

4.4. Main Pollution Sources Identified by PCA, and Integration with the Spatial Clusters

The negative correlation of PC1 with BOD, COD, and NH4+-N, alongside its positive correlation with DO, is consistent with oxygen-consuming biodegradation, in which increasing concentrations of organic substances and nutrients draw down dissolved oxygen. The main sources of these pollutants are likely domestic wastewater from residential and urban areas, industrial wastewater, and wastewater from livestock, aquaculture, and agricultural production, where direct discharge or minimal treatment substantially raises organic pollutant and nutrient levels in surface water; domestic, agricultural, and industrial waste sources have been widely shown to strongly influence the concentrations of these parameters in aquatic environments [14,17,18,20,22]. Untreated domestic wastewater in Vietnam typically contains COD, BOD, and NH4+-N at 120–200 mg/L, 70–115 mg/L, and 33–39 mg/L, respectively, while livestock wastewater can reach 480–640 mg/L BOD and 780–1,200 mg/L COD [62]; at the regional scale, an estimated 80% of nitrogen present in water originates from agricultural activities [63].
The positive correlations of PC2 with pH, TSS, NO3--N, and coliform may reflect soil erosion, surface runoff from agricultural land carrying chemical fertilizers, and microbial pollution from domestic and livestock waste. The co-loading of TSS and coliform on this component suggests that the affected water sources may have been influenced by untreated wastewater discharges or inefficient drainage systems, since elevated suspended solids are often linked to organic or inorganic pollution and can also act as a carrier of microbial contamination [64]; coliform bacteria present in water contaminated by human and warm-blooded animal faces are known to vary geographically and seasonally, particularly in riverine areas [65]. The co-loading with NO3--N is consistent with agricultural nitrogen fertilizer use, of which only about 50% is typically absorbed by plants, with the remainder undergoing mineralization and leaching into water [66]; ammonium or urea nitrogen are generally the primary sources of this nitrate [67].
The moderate negative correlation of PC3 with Cl-, along with its negative correlation with DO, may reflect saline intrusion, particularly during the dry season, when elevated Cl- concentrations can coincide with reduced dissolved oxygen. Saline intrusion can also alter the chemical composition of water, with negative effects on aquatic ecosystems and on its suitability for production and domestic use; more than 50% of the VMD, including Tien Giang, Long An, Ben Tre, Tra Vinh, Soc Trang, Bac Lieu, Ca Mau, and Kien Giang provinces, is affected by saline intrusion [68], consistent with the approximately two million hectares of agricultural land across the VMD reported to be prone to saline intrusion risk annually [8]. Beyond natural intrusion, Cl- in water can also originate from human activities such as agricultural runoff and urban wastewater [69], as well as industrial wastewater from soap, pigment, and food production [55].
The negative correlation of PC4 with temperature and its positive correlation with NH4+-N and PO43--P suggest that temperature may influence the rate of nitrogen and phosphorus transformation and cycling in water; as temperature decreases, the transformation of these compounds may slow, favoring their accumulation, which can promote eutrophication if not controlled. The association with ammonium and orthophosphate may reflect agricultural activities, particularly in intensive farming areas where excessive or poorly timed fertilizer and pesticide use increases nutrient loading to aquatic systems [54,70]; globally, nitrogen fertilizer consumption rose from 18.66 million tons in 1965 to 109.17 million tons in 2022, and phosphate fertilizer consumption rose from 16.02 to 44.09 million tons over the same period [71].
Notably, PC1 and PC2—reflecting organic/nutrient pollutants (DO, BOD, COD, NH4+-N) and physical–microbiological factors (TSS, NO3--N, coliform), respectively—together accounted for 52.5% of the total variance and closely correspond to the parameters that primarily determine the VN_WQI score. This mechanistic link is consistent with the CA results: Group I (S17, S19, S20), which recorded the lowest VN_WQI values and the most severe pollution, is most plausibly driven by high loadings on these two components, whereas Group III (S34), which maintained the highest VN_WQI values throughout the study period, likely reflects comparatively low pressure from these same organic, nutrient, and microbiological sources. The wider VN_WQI fluctuations observed in Groups II and IV may additionally reflect the more episodic influence of PC3 (chloride/salinity intrusion) and PC4 (temperature-driven nutrient accumulation), which vary more strongly by season than by location.

4.5. Management Implications

From a management perspective, monitoring and pollution control measures should be spatially prioritized according to the identified water quality clusters. Particular attention should be given to Group I stations (S17, S19, and S20), where management should focus on identifying and reducing untreated or inadequately treated domestic, industrial, and agricultural wastewater discharges, along with strengthened monitoring of BOD, COD, NH4+-N, and coliform. For Groups II and IV, which showed substantial temporal fluctuations, monitoring frequency should increase during periods of intensive agricultural activity, high surface runoff, and dry-season salinity intrusion to better distinguish anthropogenic impacts from hydrological effects. In addition, strengthen microbiological and organic pollution surveillance in areas influenced by residential settlements, livestock production, and aquaculture. Station S34, which maintained the best water quality throughout the study period, may serve as a reference site for evaluating long-term changes and the effectiveness of pollution control measures. These targeted actions can support more efficient allocation of monitoring and treatment resources and improve the long-term sustainability of surface water management in Tien Giang province. Following the 2025 merger, the former Tien Giang monitoring network now forms part of an enlarged Dong Thap province spanning both upstream freshwater and coastal salinity-affected zones. Harmonizing monitoring protocols across the merged network and integrating water quality monitoring with salinity and flow management offers an opportunity to shift from sectoral to integrated water management, a shift identified as central to resilient and sustainable water governance in the VMD [72].

4.6. Limitations of the Study

Several limitations should be considered when interpreting this study's findings. First, the monitoring data were collected only three times per year, in March, June, and November. Although this sampling frequency allowed the assessment of interannual water quality trends, it may not fully capture short-term and seasonal extremes, particularly during the dry-season salinity intrusion period from December to April. Higher-frequency monitoring during this period would provide a more detailed characterization of salinity dynamics and associated water quality changes. Coupling routine monitoring with continuous salinity observations and short-term forecasting tools [73] may help capture these dynamics.
Second, we performed cluster analysis using integrated VN_WQI values rather than the full set of original water quality variables. Consequently, the resulting clusters primarily represent similarities in overall water quality status and may not fully capture differences in pollution composition among monitoring sites. Future studies should compare WQI-based clustering with clustering based on standardized original parameters. Finally, the available dataset was limited to 11 conventional physicochemical and microbiological parameters and did not include other potentially important contaminants, such as pesticide residues, heavy metals, and emerging pollutants. Inclusion of these parameters would provide a more comprehensive assessment of pollution sources and ecological and human health risks.

5. Conclusions

Surface water quality in Tien Giang province deteriorated clearly during 2019–2023, particularly from 2022 onward. The VN_WQI results indicated that water quality was predominantly good to very good in 2019–2020 and temporarily improved in 2021 but declined markedly in 2022 and became widely degraded in 2023, when 91.18% of monitoring stations were classified as having poor water quality. This deterioration was mainly associated with increasing organic, nutrient, and microbial pollution, as reflected by elevated BOD, COD, NH₄⁺-N, and coliform concentrations at several monitoring locations. These findings indicate that the surface water environment in Tien Giang has become increasingly vulnerable to the combined effects of anthropogenic pressures and hydrological variability.
The multivariate analyses further clarified the spatial patterns and major factors influencing water quality. Cluster analysis identified four distinct groups of monitoring stations, with Group I, consisting of S17 (Truong Van Sanh canal), S19 (Dong Bac canal), and S20 (Tram Mu canal), exhibiting the most severe pollution, whereas S34 (Ly Quan canal) in Group III maintained the best overall water quality. Principal component analysis extracted four principal components explaining 77% of the total variance and indicated that the main factors affecting surface water quality were associated with organic and nutrient pollution, agricultural activities, domestic and industrial wastewater, microbial contamination, and saltwater intrusion. Together, the WQI, CA, and PCA results demonstrate that water quality degradation in Tien Giang is spatially heterogeneous and results from the combined influence of both anthropogenic and natural processes.
From a management perspective, pollution control and monitoring efforts should be spatially prioritized according to the identified water quality clusters, with the most urgent attention directed to Group I stations (S17, S19, S20) and increased monitoring frequency for Groups II and IV during periods of elevated pollution risk. These targeted actions can support more efficient allocation of monitoring and treatment resources and improve the long-term sustainability of surface water management in Tien Giang province.

Author Contributions

Conceptualization, L.V.D. and N.V.C.N.; methodology, L.V.D., N.K.D and N.V.C.N.; resources, L.V.D.; data curation, L.V.D., N.K.D and H.V.T.M.; software, N.K.D and H.V.T.M.; formal analysis, L.V.D., N.K.D and H.V.T.M.; visualization, L.V.D. and N.K.D; writing–original draft preparation, L.V.D. and N.V.C.N.; writing–review and editing, N.V.C.N., N.K.D and H.V.T.M.; supervision, N.V.C.N.; project administration, L.V.D. All authors have read and agreed to the published version of the manuscript.

Funding

This research received no external funding.

Data Availability Statement

The data presented in this study are available on request from the corresponding author. The data are not publicly available because the Department of Natural Resources and Environment of Tien Giang province owns the original surface water quality monitoring records.

Acknowledgments

The authors would like to thank the Department of Natural Resources and Environment of Tien Giang province for providing the surface water quality monitoring data used in this study.

Conflicts of Interest

The authors declare no conflicts of interest.

Abbreviations

The following abbreviations are used in this manuscript:
BOD Biochemical Oxygen Demand
BTNMT Ministry of Natural Resources and Environment (Bộ Tài nguyên và Môi trường)
CA Cluster Analysis
Cl− Chloride
COD Chemical Oxygen Demand
DO Dissolved Oxygen
MoNRE Ministry of Natural Resources and Environment
MPN Most Probable Number
NH4+-N Ammonium (ammonium nitrogen)
NO3−-N Nitrate (nitrate nitrogen)
PC Principal Component
PCA Principal Component Analysis
PO43−-P Orthophosphate (orthophosphate phosphorus)
QCVN National Technical Regulation (Quy chuẩn kỹ thuật quốc gia)
SMEWW Standard Methods for the Examination of Water and Wastewater
SPSS Statistical Package for the Social Sciences
TCVN Vietnam Standard (Tiêu chuẩn Việt Nam)
TSS Total Suspended Solids
US EPA United States Environmental Protection Agency
VEA Vietnam Environment Administration
VND Vietnamese Dong
VN_WQI Vietnam Water Quality Index (2019 updated version)
WHO World Health Organization
WQI Water Quality Index

References

  1. Syeed, M. M. M, Hossain, S., Karim, R., Uddin, M. F., Hasan, M., & Khan, R. H. (2023). Surface water quality profiling using the water quality index, pollution index and statistical methods: A critical review. Environmental and Sustainability Indicators, 18, 100247. [CrossRef]
  2. Singh, P. K., Kumar, U., Kumar, I., Dwivedi, A., Singh, P., Mishra, S., Seth, C. S., & Sharma, R. K. (2024). Critical review on toxic contaminants in surface water ecosystem: sources, monitoring, and its impact on human health. Environmental Science and Pollution Research, 31, 56428-56462. [CrossRef]
  3. Uddin, M. G., Nash, S., & Olbert, A. I. (2021). A review of water quality index models and their use for assessing surface water quality. Ecological Indicators, 122, 107218. [CrossRef]
  4. Singh, P. K., & Sharma, R. K. (2021). Wastewater reuse in peri-urban agriculture ecosystem: Current scenario, consequences, and control measures. In: Water Pollution and Management Practices (pp. 121-146). Springer.
  5. Park, M., Choi, Y. S., Shin, H. J., Song, I., Yoon, C. G., Choi, J. D., & Yu, S. J. (2019). A comparison study of runoff characteristics of non-point source pollution from three watersheds in South Korea. Water, 11(5), 966. [CrossRef]
  6. Igwe, P. U., Chukwudi, C. C., Ifenatuorah, F. C., Fagbeja, I. F., & Okeke, C. A. (2017). A review of environmental effects of surface water pollution. International Journal of Advanced Engineering Research and Science, 4(12), 128-137. [CrossRef]
  7. Tran, T. D., Ngo, T. H. T., Dinh, D. H., Trinh, T. N., & Thai, V. N. (2022). Assessing of salinity intrusion on livelihoods at Tan Phu Dong and Go Cong Dong districts of Tien Giang province and proposal solutions. Journal of Military Science and Technology, VITTEP Special Issue, 79-90 (in Vietnamese). [CrossRef]
  8. Park, E., Loc, H. H., Binh, D. V., & Kantoush, S. (2021). The worst 2020 saline water intrusion disaster of the past century in the Mekong Delta: Impacts, causes, and management implications. Ambio, 51(3), 691–699. [CrossRef]
  9. Minh, H. V. T., Lavane, K., Ty, T. V., Downes, N. K., Hong, T. T. K., & Kumar, P. (2022). Evaluation of the impact of drought and saline water intrusion on rice yields in the Mekong Delta, Vietnam. Water, 14(21), 3499. [CrossRef]
  10. Minh, H. V. T., Ngoc, D. T. H., Lien, B. T. B., Diep, N. T. H., Nguyen, P. C., Thanh, N. T., Lavane, K., Downes, N. K., & Kumar, P. (2026). Freshwater–salinity regime shifts in the Vietnamese Mekong Delta: multi-decadal trends and emerging risks (2000–2024). Environmental Geochemistry and Health, 48(3), 139. [CrossRef]
  11. Hong, T. T. K., Viet, L. H., & Giao, N. T. (2022). Analysis of spatial-temporal variations of surface water quality in the Southern province of Vietnamese Mekong Delta using multivariate statistical analysis. Journal of Ecological Engineering, 23(7), 1-9. [CrossRef]
  12. Giao, N. T., Dien, N. T. C., Nguyen, H. T., Nhu, T. N., Mi, L. T. D, & Nhien, H. T. H. (2024). Evaluating the relationship between surface water quality and zooplankton diversity in coastal areas of Tien Giang province, Vietnam. Journal of Applied Sciences and Environmental Management, 28(3), 841-851. [CrossRef]
  13. VOV (2024). Fish market in the heart of My Tho urban area pollutes residential areas. https://vov.vn/xa-hoi/cho-ca-trong-long-do-thi-my-tho-gay-o-nhiem-khu-dan-cu-post1071773.vov (in Vietnamese).
  14. Benkov, I., Varbanov, M., Venelinov, T., & Tsakovski, S. (2023). Principal component analysis and the water quality index - A powerful tool for surface water quality assessment: A case study on Struma River Catchment, Bulgaria. Water, 15, 1961. [CrossRef]
  15. Phan, T. K., Nguyen, V. T. V., & Tran, T. H. N. (2023). Assessment of water quality in Bung Binh Thien using WQI index integrated with GIS and Remote Sensing. Journal of Hydrometeorology, 745, 51-64 (in Vietnamese). [CrossRef]
  16. Roy, B., & Manna, A. K. (2021). The status of surface water in West Tripura District, India: An approach by using water quality index and multivariate statistical technique. Asian Journal of Water, Environment and Pollution, 18(2), 27-36. [CrossRef]
  17. Zhang, Z. M., Zhang, F., Du, J. L., & Chen, D. C. (2022). Surface water quality assessment and contamination source identification using multivariate statistical techniques: A case study of the Nanxi River in the Taihu Watershed, China. Water, 14(5), 778. [CrossRef]
  18. Kumar, A., Mishra, S., Taxak, A. K., Pandey, R., & Yu, Z. (2022). Nature rejuvenation: Long-term (1989-2016) vs short-term memory approach based appraisal of water quality of the upper part of Ganga River, India. Environmental Technology & Innovation, 20, 101164. [CrossRef]
  19. Subramanian, A., & Baskar, S. (2022). Water quality assessment of Noyyal river using water quality index (WQI) and multivariate statistical techniques. Water Science, 36(1), 85-98. [CrossRef]
  20. Desa, M. S. M., Sulaiman, M. A., & Rajan, S. (2022). Water quality assessment and characterization of rivers in Pasir Gudang, Johor via multivariate statistical techniques. Pertanika Journal of Science & Technology, 31(1), 495-510. [CrossRef]
  21. Iwegbue, C. M. A., Faran, T. K., Iniaghe, P. O., Ikpefan, J. O., Tesi, G. O., Nwajei, G. E., & Martincigh, B. S. (2023). Water quality of Bomadi Creek in the Niger Delta of Nigeria: Assessment of some physicochemical properties, metal concentrations, and water quality index. Applied Water Science, 13, 36. [CrossRef]
  22. Yang, Y., Huang, X., Wu, X., Liu, C., Zhao, S., & Zhu, X. (2023). The spatiotemporal variations characteristic and pollution evaluation of water in Qujiang River, China. Applied Water Science, 13, 32. [CrossRef]
  23. Bao, V. Q., Toan, P. V., Tuyen, N. V., Hoang, H. M., Du, L. V., Downes, N. K., Tri, V. P. D. (2024). Understanding watershed sources of pollution in Vinh Long Province, Vietnamese Mekong Delta. Discover Applied Sciences, 6, 310. [CrossRef]
  24. Thuan, N. C. (2022). Assessment of surface water quality in the Hau Giang province using GIS and statistical approaches. Journal of Ecological Engineering, 23(9), 265-276. [CrossRef]
  25. Tuyen, N. T. M., Giao, N. T., Minh, H. V. T., & Ngan, N. V. C. (2025). Pollution-based clustering of surface water quality: Case study in Hau Giang province, Vietnam. Journal of Ecological Engineering, 26(11), 100–113. [CrossRef]
  26. Giao, N. T., Anh, P. K., & Nhien, H. T. H. (2021). Spatiotemporal analysis of surface water quality in Dong Thap province, Vietnam using water quality index and statistical approaches. Water, 13(3), 336. [CrossRef]
  27. Giao, N. T., & Minh, V. Q. (2022). The categorized of surface water quality variation using multivariate statistical approaches: A case study of Ben Tre Province, Vietnam. Trends in Sciences, 19(8), 3468. [CrossRef]
  28. Giao, N. T., Nhien, H. T. H., Anh, P. K., & Thuptimdang, P. (2022). Combination of water quality, pollution indices, and multivariate statistical techniques for evaluating the surface water quality variation in Can Tho City, Vietnam. Environmental Monitoring and Assessment, 194(11), 844. [CrossRef]
  29. Giao, N. T. (2022). Analysis of surface water quality using multivariate statistical approaches: a case study in Ca Mau Peninsula, Vietnam. Pollution, 8(2), 463-477. [CrossRef]
  30. Muoi, L. V., Srilert, C., Tri, V. P. D., & Toan, P. V. (2022). Spatial and temporal variabilities of surface water and sediment pollution at the main tidal-influenced river in Ca Mau Peninsular, Vietnamese Mekong Delta. Journal of Hydrology: Regional Studies, 41, 101082. [CrossRef]
  31. Minh, H. V. T., Tri, V. P. D., Ut, V. N., Avtar, R., Kumar, P., Dang, T. T. T., Hoa, A. V., Ty, T. V., & Downes, N. K. (2022). A model-based approach for improving surface water quality management in aquaculture using MIKE 11: A case of the Long Xuyen Quadangle, Mekong Delta, Vietnam. Water, 14(3), 412. [CrossRef]
  32. National Assembly (2025). Resolution No. 202/2025/QH15 dated June 12, 2025, on the arrangement of provincial-level administrative units.
  33. Ministry of Natural Resources and Environment (MoNRE). (2021). Circular No. 10/2021/TT-BTNMT on Technical regulations on environmental monitoring and management of information and data on environmental quality monitoring (in Vietnamese).
  34. Ministry of Natural Resources and Environment (MoNRE). (2023). Circular No. 01/2023/TT-BTNMT promulgating the National Technical Regulation on Surface Water Quality (QCVN 08:2023/BTNMT) (in Vietnamese).
  35. Vietnam Environment Administration (VEA). (2011). Decision No. 879/QD-TCMT promulgating the technical guidance handbook for computing the water quality index (in Vietnamese).
  36. The Vietnam Environment Administration (2019). Decision No. 1460/QD-TCMT on promulgating technical instructions for calculating and publishing the Vietnam water quality index (VN_WQI) (in Vietnamese).
  37. Gu, R. R., & Li, Y. (2002). River temperature sensitivity to hydraulic and meteorological parameters. Journal of Environ-mental Management, 66(1), 43-56. [CrossRef]
  38. Shinohara, R., Tanaka, Y., Kanno, A., & Matsushige, K. (2021). Relative impacts of increases of solar radiation and air temperature on the temperature of surface water in a shallow, eutrophic lake. Hydrology Research, 52(4), 916. [CrossRef]
  39. Giao, N. T. (2020). Evaluating current water quality monitoring system on Hau River, Mekong Delta, Vietnam using multivariate statistical technique. Applied Environmental Research, 42(1), 14-25. [CrossRef]
  40. US EPA (n.d. b). pH. https://www.epa.gov/caddis/ph.
  41. US EPA (n.d. a). Ammonia. https://www.epa.gov/caddis/ammonia.
  42. Truc, D. T., Pham, H. P., Nguyen, D. G. N., Pham, V. T., & Van. P. D. T. (2019). Surface water quality of Tien River flowing through Tan Chau, An Giang province. Can Tho University Journal of Science, 55(Special Issue: Environment), 53-60 (in Vietnamese). [CrossRef]
  43. Tran, T. T., Nguyen, T. S., Chau, B. T., & Ngo, T. H. D. (2023). Survey results of seafood processing wastewater treatment systems at some enterprises in Khanh Hoa and Kien Giang provinces. Journal of Fisheries Science and Technology, 4(4), 12-18. [CrossRef]
  44. Ta, V. P., Nguyen, V. B., & Nguyen, V. H. (2014). Study on white leg shrimp culture applying biofloc technology with different stocking density and salinity. Can Tho University Journal of Science, Aquaculture Special Issue, 44-53 (in Vietnamese).
  45. Islam, M. S., Nakagawa, K., Abdullah-Al-Mamun, M., Khan, A. S., Goni, M. A., & Berndtsson, R. (2022). Spatial distribution and source identification of water quality parameters of an Industrial Seaport Riverbank Area in Bangladesh. Water, 14(9), 1356. [CrossRef]
  46. Fonteh, M. L., Fonkou, T., Fonteh, M. F., Njoyim, E. B. T., & Lambi, C. M. (2017). Spatial variability and contamination levels of freshwater resources by saline intrusion in the coastal low-lying areas of the Douala Metropolis-Cameroon. Journal of Water Resource and Protection, 9(2) 215-237. [CrossRef]
  47. Thang, V. L., Dung, D. D., & Binh, T. N. (2023). Spatiotemporal assessment and pollution-source identification and quantification of the surface water system in a coastal region of Vietnam. Hydrological Sciences Journal, 68(6), 1–12. [CrossRef]
  48. Berbecea, A., Radulov, I., Nita, L., Vogyvolgyi, C., Lato, A., Okros, A., Crista, F., & Lato, K. I. (2014). The quality of Maros River water in Romania Hungary cross border area. Research Journal of Agricultural Science, 46(2), 3-13.
  49. Kuczynska, A., Jarnuszewski, G., Nowakowska, M., Wexler, S., Wisniowski, Z., Burczyk, P., Durkowski, T., & Woznicka, M. (2021). Identifying causes of poor water quality in a Polish agricultural catchment for designing effective and targeted mitigation measures. Science of the Total Environment, 765, 144125. [CrossRef]
  50. Fones, G., Bakir, A., Gray, J., Mattingley, L., Measham, N., Knight, P., Bowes, M., Greenwood, R., & Mills, G. (2020). Using high-frequency phosphorus monitoring for water quality management: A case study of the upper River Itchen, UK. Environmental Monitoring and Assessment, 192(3), 184. [CrossRef]
  51. Leoni, B., Patelli, M., Soler, V., & Nava, V. (2018). Ammonium transformation in 14 lakes along a trophic gradient. Water, 10(3), 265. [CrossRef]
  52. Gikas, G. D., Sylaios, G. K., Tsihrintzis, V. A., Konstantinou, I. K., Albanis, T., & Boskidis, I. (2020). Comparative evaluation of river chemical status based on WFD methodology and CCME water quality index. Science of The Total Environment, 745, 140849. [CrossRef]
  53. Seymenov, K. (2022). Assessment of water pollution with nitrogen and phosphorus along the course of a river: A case study from Northern Bulgaria. Journal of the Bulgarian Geographical Society, 47, 35-44. [CrossRef]
  54. Madjar, R. M., Scaeteanu, G. V., & Sandu, M. A. (2024). Nutrient water pollution from unsustainable patterns of agricultural systems, effects and measures of integrated farming. Water, 16(21), 3146. [CrossRef]
  55. Hong, Y., Zhu, Z., Liao, W., Yan, Z., Feng, C., & Xu, D. (2023). Freshwater water-quality criteria for chloride and guidance for the revision of the water-quality standard in China. International Journal of Environmental Research and Public Health, 20(4), 2875. [CrossRef]
  56. Tuan, D. D. A., Thu, B. A. & Trung, N. H. (2019). Assessment of the current status of surface water for water exploitation and supply in Soc Trang city. Can Tho University Journal of Science, 55(4A), 61-70 (in Vietnamese). [CrossRef]
  57. Pal, P. (2014). Detection of coliforms in drinking water and its effect on human health - A review. International Letters of Natural Sciences, 17, 122-131. [CrossRef]
  58. Lin, L., Yang, H., & Xu, X. (2022). Effects of water pollution on human health and disease heterogeneity: A review. Frontiers in Environmental Science, 10, 880246. [CrossRef]
  59. Cong, N. P., Ty, T. V., Duy, D. V., Ngoc, D. T. H., Downes, N. K., Minh, H. V. T., Chatterjee, A., Chakraborty, S., & Kumar, P. (2026). Deep learning-based salinity forecasting in the Vietnamese Mekong Delta: A Cung Hau Estuary case study. Water, 18(10), 1240. [CrossRef]
  60. Hajigholizadeh, M., & Melesse, A. M. (2017). Assortment and spatiotemporal analysis of surface water quality using cluster and discriminant analyses. Catena, 151, 247-258. [CrossRef]
  61. Varol, M., Karakaya, G., & Alpaslan, K. (2022). Water quality assessment of the Karasu River (Turkey) using various in-dices, multivariate statistics and APCS-MLR model. Chemosphere, 308(2), 136415. [CrossRef]
  62. Nguyen, T. T. H., Ho, T. T. H., Do, P. C., Dinh, T. D., & Trinh, Q. H. (2019). Treatment of domestic wastewater and livestock wastewater using algae attached to filter materials. Vietnam Journal of Agricultural Science, 17(10), 826-834. https://vie.vjas.vn/index.php/vjasvn/article/view/614 (in Vietnamese).
  63. European Environment Agency (2025). Nitrate in groundwater. https://www.eea.europa.eu/en/analysis/indicators/nitrate-in-groundwater-8th-eap.
  64. Wehrheim, C., Lübken, M., Stolpe, H., & Wichern, M. (2023). Identifying key influences on surface water quality in freshwater areas of the Vietnamese Mekong Delta from 2018 to 2020. Water, 15(7), 1295. [CrossRef]
  65. Mishra, M., Arukha, A. P., Patel, A. K., Behera, N., Mohanta, T. K., & Yadav, D. (2018). Multi-drug resistant coliform: Water sanitary standards and health hazards. Frontiers in Pharmacology, 9, 311. [CrossRef]
  66. Bijay-Singh, & Craswell, E. T. (2021). Fertilizers and nitrate pollution of surface and ground water: An increasingly pervasive global problem. SN Applied Sciences, 3, 518. [CrossRef]
  67. Wang, Z., Ji, W., Zhang, F., Liu, Y., & Li, Z. (2024). Identifying the nitrate transport and transformations under apple orchards in the loess deposit using stable isotopes of water and nitrate. Agriculture, Ecosystems & Environment, 364, 108885. [CrossRef]
  68. Ministry of Science and Technology (2016). Saltwater intrusion in the Mekong Delta: Causes, impacts and response solutions (in Vietnamese).
  69. Hammoumi, D., Al-Aizari, H. S., Alaraidh, I. A., Okla, M. K., Assal, M. E., Al-Aizari, A. R., Moshab, M. S., Chakiri, S., & Bejjaji, Z. (2024). Seasonal variations and assessment of surface water quality using water quality index (WQI) and principal component analysis (PCA): A case study. Sustainability, 16(13), 5644. [CrossRef]
  70. Bechmann, M. & Stalnacke, P. (2019). Agricultural nitrogen and phosphorus pollution in surface water. In: Oxford Re-search Encyclopedia of Environmental Science. [CrossRef]
  71. Statista (n.d.). Global consumption of agricultural fertilizer from 1965 to 2022, by nutrient. https://www.statista.com/statistics/438967/fertilizer-consumption-globally-by-nutrient/.
  72. Tri, V. P. D., Yarina, L., Nguyen, H. Q., & Downes, N. K. (2023). Progress toward resilient and sustainable water management in the Vietnamese Mekong Delta. WIREs Water, 10(6), e1670. [CrossRef]
  73. Cong, N. P., Downes, N. K., Minh, H. V. T., & Kumar, P. (2026). Multi-day salinity forecasting in the Vietnamese Mekong Delta: Horizon-dependent performance and interpretation of XGBoost, LSTM, and a weighted hybrid. Water, 18, 2379. [CrossRef]
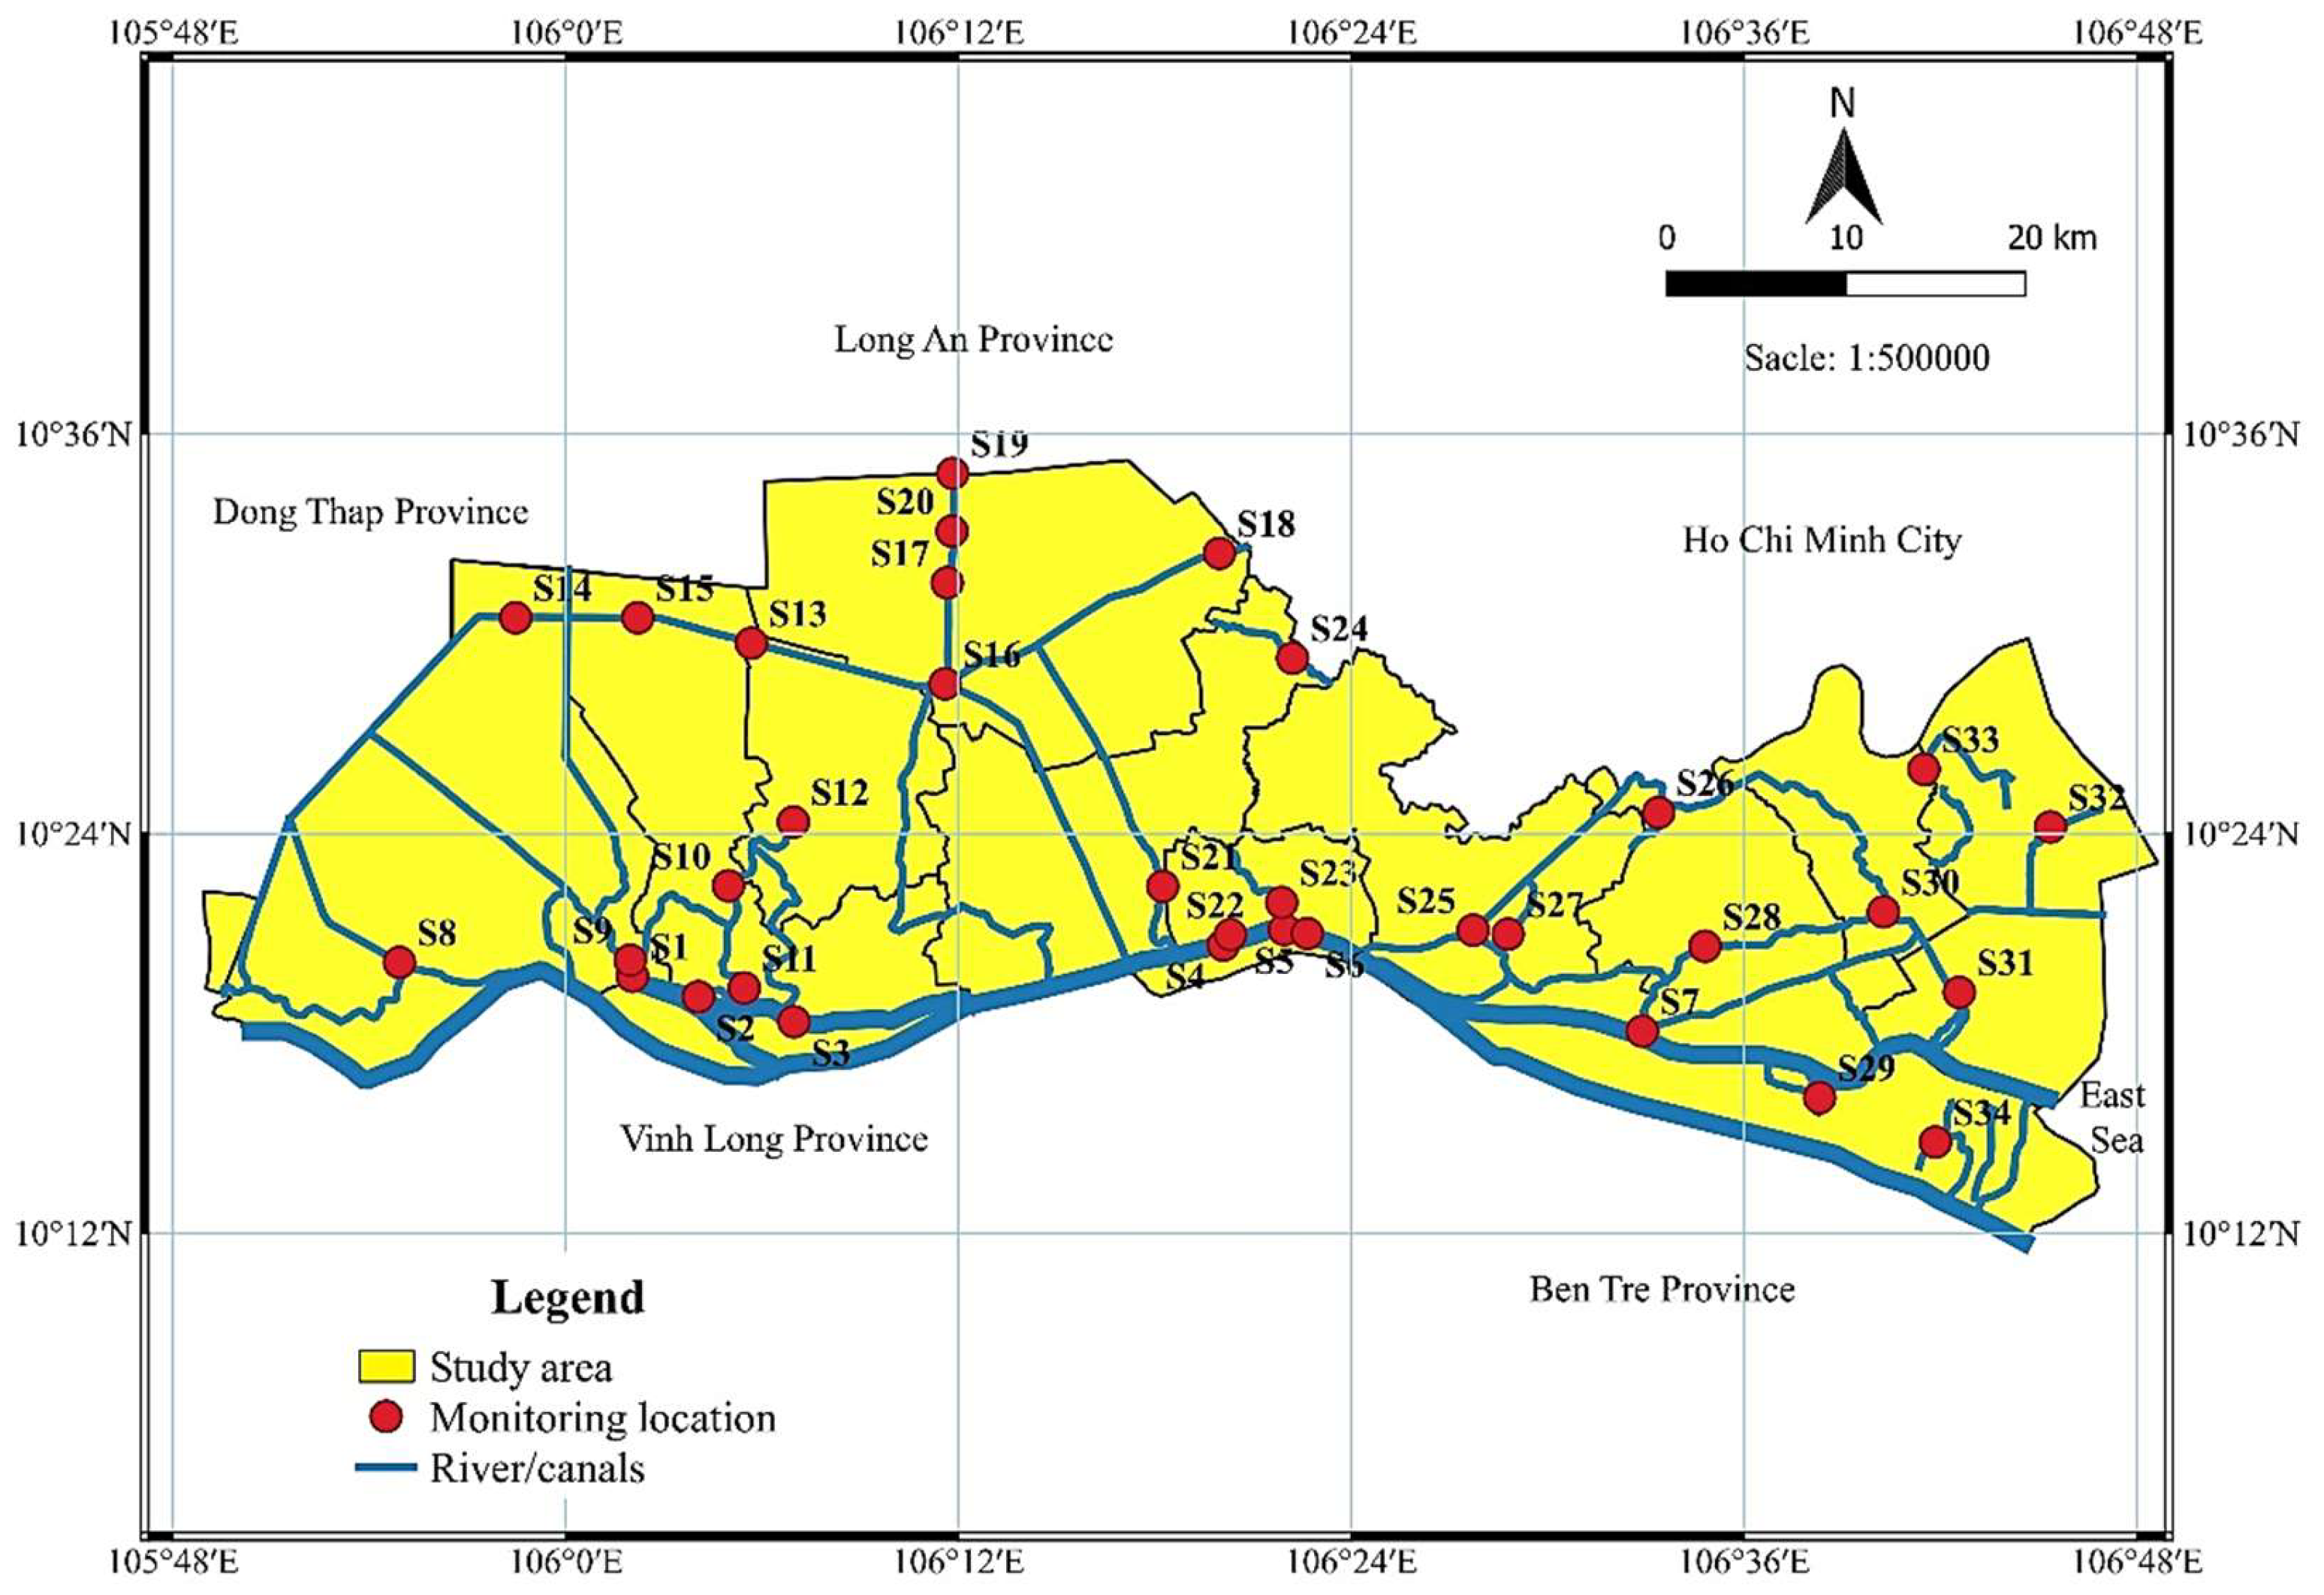
Figure 1. Surface water quality monitoring locations in Tien Giang province during the period 2019–2023.
Preprints 236254 g001
Figure 2. Temperature and pH in water bodies of Tien Giang province in the period 2019–2023.
Preprints 236254 g002
Figure 3. TSS in water bodies of Tien Giang province in the period 2019–2023.
Preprints 236254 g003
Figure 4. DO, BOD and COD content in water bodies of Tien Giang province in the period 2019–2023.
Preprints 236254 g004
Figure 5. NH4+-N, NO3—N and PO43—P content in water bodies of Tien Giang province in the period 2019–2023.
Preprints 236254 g005
Figure 6. Cl- content in water bodies of Tien Giang province in the period 2019–2023.
Preprints 236254 g006
Figure 7. Coliform density in water bodies of Tien Giang province in the period 2019–2023.
Preprints 236254 g007
Figure 8. The VN_WQI index at monitoring locations during the period 2019–2023.
Preprints 236254 g008aPreprints 236254 g008b
Figure 9. The results of grouping areas with similar pollution levels.
Preprints 236254 g009
Figure 10. The scree plot of eigenvalues.
Preprints 236254 g010
Figure 11. Factor loading of PCA on 11 water quality parameters.
Preprints 236254 g011
Table 1. The analysis methods and allowable limits of surface water quality parameters.
No. Parameter Unit Analysis method Limited value of QCVN 08:2023/BTNMT
1 Temperature °C SMEWW 2550B:2017 -
2 pH - TCVN 6492:2011 6.0–8.5
3 TSS mg/L TCVN 6625:2000 ≤100
4 DO mg/L TCVN 7325:2016 ≥5
5 BOD mg/L TCVN 6001-1:2008 ≤6
6 COD mg/L SMEWW 5220.C:2017 ≤15
7 NH4+-N mg/L SMEWW 4500 NH3.B&F:2017 -
8 NO3--N mg/L SMEWW 4500-NO3-.E:2017 -
9 PO43-- P mg/L SMEWW 4500-PE:2017 -
10 Cl- mg/L TCVN 6194:1996 -
11 Coliform MPN/100 mL TCVN 6187-2:1996 ≤5,000
Note: QCVN 08:2023/BTNMT Table 2 - Column B - Limit values of parameters in water that can be used for industrial and agricultural activities after applying appropriate treatment measures.
Table 2. Classification of surface water quality according to VN_WQI index.
No. Range Surface water quality Suitable usage purpose
1 91–100 Very good Suitable for domestic water supply
2 76–90 Good Usable for domestic water supply but requires appropriate treatment
3 51–75 Average Suitable for irrigation and similar purposes
4 26–50 Poor Suitable for waterway transportation and similar purposes
5 10–25 Heavily polluted Heavily polluted water, requires treatment in the future
6 <10 Very heavily polluted Toxic water, requires remediation and treatment
Source: The Vietnam Environment Administration [36].
Table 3. The average values of surface water quality parameters for the period 2019–2023.
Parameters Unit 2019 2020 2021 2022 2023
Temp. oC 30.44±0.71a 29.98±1.23b 29.86±0.41b 30.51±0.46a 30.57±0.69a
pH - 7.48±0.54a 7.28±0.53ab 7.15±0.39b 6.70±0.56c 7.08±0.29b
TSS mg/L 101.44±30.35a 96.05±36.02a 46.31±11.80b 38.92±27.63b 52.47±28.15b
DO mg/L 3.61±0.93d 3.93±1.05d 4.54±0.83c 5.62±0.34a 5.11±1.02b
BOD mg/L 8.53±2.29b 8.42±2.07b 8.05±3.58b 11.86±2.89a 8.15±2.16b
COD mg/L 16.12±4.18b 16.05±3.32b 14.62±6.73b 17.03±4.21a 15.84±4.36b
NH4+ -N mg/L 0.38±0.22a 0.34±0.13a 0.3±0.33a 0.18±0.04b 0.13±0.12b
NO3--N mg/L 0.30±0.11c 0.37±0.11c 0.57±0.22b 0.33±0.04c 0.77±0.21a
PO43--P mg/L 0.1±0.09b 0.12±0.08b 0.09±0.08b 0.10±0.05b 0.16±0.05a
Cl- mg/L 235.52±650.79b 1,454.38±1,977.46a 361.29±753.65b 143.11±353.04b 298.62±643.85b
Coliform MPN/100 mL 1,537.49±855.02a 1,697.94±797.83a 1,695.29±982.44a 10,921.18±10,997.51b 24,684.31±11,087.57a
Note: Different superscript letters (a, b, c, d) within the same row indicate a statistically significant difference between years according to Duncan's multiple range test (p<0.05); values sharing the same letter are not significantly different (p>0.05).
Disclaimer/Publisher’s Note: The statements, opinions and data contained in all publications are solely those of the individual author(s) and contributor(s) and not of MDPI and/or the editor(s). MDPI and/or the editor(s) disclaim responsibility for any injury to people or property resulting from any ideas, methods, instructions or products referred to in the content.
Copyright: This open access article is published under a Creative Commons CC BY 4.0 license, which permit the free download, distribution, and reuse, provided that the author and preprint are cited in any reuse.