

Submitted:
30 September 2026
Posted:
02 October 2026
You are already at the latest version
Abstract
Background: Short sleep and depression frequently co-occur in older adults, but whether they share a gut microbiota signature or carry largely phenotype-specific features remains unresolved. We therefore characterized fecal microbiota features shared by or specific to short sleep and depression using American Gut Project 16S rRNA data. Methods: Using American Gut Project (AGP) V4 16S rRNA data (PRJEB11419), we assigned older adults to four mutually exclusive groups: healthy controls (HC; 7-8 h sleep, no depression), short-sleep only (SSD), depression only (DP), and short-sleep plus depression (SSD + DP; exploratory). Complete age, sex, and BMI data with at least 1,000 reads yielded 1,056 participants (HC 617; SSD 255; DP 148; SSD + DP 36). We examined diversity, taxonomy, covariate-adjusted genus-level associations, and cross-validated discrimination. Scale-upgraded sensitivity analyses included 1,307 participants, 146 genera, and 20 multiply imputed data sets. Results: Richness (q = 0.001; adjusted q = 0.007), Shannon diversity (q = 0.031; adjusted q = 0.111), and Faith's diversity (q = 0.001; adjusted q = 0.007) differed across groups; adjusted richness and Faith's diversity also differed among depression-only participants (both q = 0.003). PERMANOVA showed no global separation (minimum P = 0.065). Significant genera numbered 3 in SSD, 3 in DP, and 0 in SSD + DP: SSD was associated with UCG-002 (log2FC = -1.01), UCG-003 (-0.76), and Erysipelatoclostridium (+0.69), and DP with UCG-003 (-1.21), [Ruminococcus] gnavus group (+1.06), and Lachnospiraceae UCG-010 (-0.71). Core clinical AUCs were 0.554 (95% CI 0.514-0.596) and 0.623 (0.579-0.668), rising to 0.599 (0.559-0.640) and 0.654 (0.611-0.695) with extended clinical variables; adding microbiota features lowered these to 0.566 (0.524-0.608) and 0.637 (0.593-0.680), providing no gain. Sensitivity AUCs were 0.575-0.610 and 0.643-0.675. Scale-upgraded OLS/limma confirmed 17 genera and 8 interaction genera, with AUCs of 0.585 and 0.645; additional models reached 0.622 and 0.687. A phenotype-matched constipation contrast (78 cases, 695 controls) yielded AUCs of 0.771 and 0.798. Conclusion: Short sleep and depression showed modest, largely non-overlapping microbiota signals, whereas constipation showed a clearer but still non-diagnostic signal. These findings are hypothesis-generating and do not support clinical or causal interpretation.
Keywords:
gut microbiota
; 16S rRNA
; sleep duration
; depression
; older adults
; American Gut Project
1. Introduction
Short sleep and depression are common in later life and frequently co-occur. Many older adults report insufficient or fragmented sleep, and short sleep is associated with impaired quality of life, cognitive decline, and psychiatric symptoms. Depression is likewise prevalent among older adults and contributes substantially to disability and mortality. Because the two conditions often overlap, they may share biological correlates, although a cross-sectional design cannot resolve the direction of such associations.
The gut microbiota forms a key interface between the host and its environment and has been linked to immune, metabolic, and neurobehavioral phenotypes through the microbiota-gut-brain axis (Mayer et al., 2014; O’Toole and Jeffery, 2015; Fang et al., 2019; Valles-Colomer et al., 2019). Sleep and circadian disruption are associated with altered microbial composition in animal and human studies (Bao and Swaab, 2017; Matenchuk et al., 2020; Wang et al., 2022; Supasitdikul et al., 2026; Tilves et al., 2026), and depression has been linked to shifts in the abundance of several genera in clinical and population cohorts (Gao et al., 2023; Liang et al., 2022). Proposed mechanisms connecting the gut microbiota to these phenotypes include microbial production of short-chain fatty acids (SCFAs), tryptophan and kynurenine metabolism, bile-acid signaling, and microbiota-driven low-grade inflammation (Dalile et al., 2019; Kennedy et al., 2017; O’Mahony et al., 2015; Jia et al., 2024). Most existing studies, however, have examined sleep or depression in isolation, relied on small clinical samples, or failed to separate mutually exclusive phenotype groups, and reported taxonomic associations vary widely across cohorts, phenotype definitions, and analytical pipelines (Gao et al., 2023; Liang et al., 2022).
Aging itself remodels the gut microbiota, reducing ecological resilience while increasing between-individual variability and chronic low-grade inflammation, all of which may modify host-microbiota relationships (Claesson et al., 2012; Xu et al., 2021; Bradley and Haran, 2024). Older adults are therefore a relevant population in which sleep and mood phenotypes may coincide with measurable, if modest, compositional differences in the gut ecosystem. Because short sleep and depression frequently co-occur, mutually exclusive phenotype groups are needed to separate features shared by both conditions from those associated primarily with one; a mixed case definition would otherwise risk conflating the two exposures.
The American Gut Project (AGP) offers a large public resource for addressing these questions. A 2024 study used AGP to examine short sleep in adults (Gao et al., 2024), and a 2026 study described shared and condition-associated microbiota alterations in older adults with depression and constipation (Li et al., 2026). The latter study drew on the same source cohort and a comparable shared-versus-condition-associated framework but did not evaluate short sleep. The present analysis addresses a different phenotype pairing within the same public cohort: older adults with short sleep, depression, or both, compared with older adults reporting normal sleep of 7-8 h and no depression. We prespecified mutually exclusive groups and treated the 36-participant comorbidity group as exploratory only. Our aims were threefold: to determine whether short sleep, depression, or their combination is associated with differences in alpha and beta diversity; to identify genus-level taxa shared by, or specific to, each condition after adjustment for age, sex, and BMI; and to test whether these microbial features improve out-of-sample discrimination beyond clinical covariates in a leakage-free nested cross-validation design.
2. Materials and Methods
2.1. Study Design and Source Data
This study was a cross-sectional secondary analysis of de-identified, publicly available AGP data accessed through ENA project PRJEB11419. The analysis followed a frozen protocol specifying the study population, phenotype definitions, comparison groups, and claim boundaries before formal testing. Because the source data were public and de-identified, no additional ethics approval or informed consent was required for this secondary analysis.
Eligible participants were aged 60 years or older and had at least one V4 stool amplicon sample. For participants with multiple eligible stool samples, one primary sample was selected according to the pre-specified hierarchy of complete age, sex, and BMI data; complete group-defining fields; earlier collection time; and sample accession. Only one sample per participant was retained. Sequencing runs were linked through ENA, and samples with fewer than 1,000 reads were excluded from the final analysis set.
2.2. Phenotype Groups
Short sleep was defined from the self-reported sleep-duration field as less than 5 h or 5-6 h per day, whereas normal sleep was defined as 7-8 h per day. Depression was classified as present when the depression-specific questionnaire field was positive and as absent when that field was negative or the general mental-illness field explicitly indicated no mental illness; all other responses were treated as missing. Participants were assigned to one of four mutually exclusive groups: HC (normal sleep, no depression), SSD only (short sleep, no depression), DP only (depression without short sleep), and SSD + DP (short sleep plus depression). Because of its smaller sample size, the SSD + DP group was designated as exploratory.
2.3. Sequencing and Bioinformatics
Public paired-end FASTQ files from the selected runs were processed with DADA2 (Callahan et al., 2016) after quality filtering using a maximum expected error of 2 and a minimum read length of 100 bp. Amplicon sequence variants (ASVs) were reconstructed, chimeras were removed, and taxonomy was assigned against SILVA version 138 (Quast et al., 2013). A neighbor-joining phylogenetic tree was constructed from the ASV sequences using DECIPHER and APE implementations in R. The QIIME 2 ecosystem was used for sequence-data handling and reproducibility (Bolyen et al., 2019).
2.4. Diversity and Composition
ASV-level diversity analyses used a pre-specified abundance filter retaining ASVs present in at least 5% of retained samples and with a total count of at least 10, leaving 718 of 19,369 ASVs. Alpha diversity was quantified using observed ASV richness, Shannon diversity, Simpson diversity, Faith’s phylogenetic diversity, and Pielou evenness. Overall group differences were assessed using Kruskal-Wallis tests and rank-based linear models adjusted for age, sex, and BMI. Pairwise comparisons with HC used Mann-Whitney tests and covariate-adjusted rank models. Benjamini-Hochberg false discovery rate (FDR) correction was applied within metric families (Benjamini and Hochberg, 1995).
Beta diversity was evaluated using Bray-Curtis, Jaccard, Aitchison, weighted UniFrac, and unweighted UniFrac distances. Group separation was assessed using PERMANOVA, ANOSIM, and PERMDISP with 999 permutations (Anderson, 2001). Pairwise PERMANOVA comparisons with HC were FDR-corrected within each distance metric. Principal-coordinate analyses were used for visualization.
2.5. Differential Abundance and Shared/Condition-Associated Taxa
Genus-level counts were filtered to retain taxa present in at least 10% of samples and with a total count of at least 20. Counts were then centered log-ratio transformed. Adjusted associations were estimated by ordinary least squares using HC as the reference group, with age, sex, and BMI included as covariates and HC3 heteroscedasticity-robust standard errors. Effects were expressed as log2 fold changes, and statistical significance required q < 0.05 after Benjamini-Hochberg correction and |log2 fold change| >= 0.5.
For each genus, SSD-only and DP-only coefficients were used to classify taxa as shared enriched, shared depleted, SSD-only specific, DP-only specific, or opposite-direction. The SSD + DP coefficient was retained as an exploratory estimate of comorbidity. A separate LEfSe analysis across taxonomic ranks followed the conventional implementation logic (Segata et al., 2011). Counts were collapsed at each taxonomic rank from order to genus, and each rank was evaluated using Kruskal-Wallis tests across groups, pairwise Wilcoxon tests between contrasted groups, and linear discriminant analysis effect sizes estimated from 30 bootstrap iterations at 67% subsampling with a fixed seed. A taxon was considered significant only when the raw Kruskal-Wallis p, pairwise Wilcoxon p, and LDA effect size all met their respective thresholds (p < 0.05 and LDA >= 2.0). Because LEfSe uses raw p values, Benjamini-Hochberg q values were calculated in parallel and reported as secondary annotations rather than as inclusion criteria. This analysis was performed in the scale-up set (n = 1,307) and was treated as a sensitivity analysis.
2.6. Machine Learning and Sensitivity Analyses
Penalized logistic-regression models were evaluated using nested cross-validation, with all preprocessing and tuning confined to the training data. The outer loop used repeated stratified five-fold cross-validation with five repeats, while an inner three-fold loop selected the L1 or L2 penalty, regularization strength (C between 0.03 and 3.0), and class-weight setting by maximizing the inner-fold area under the receiver-operating-characteristic curve (AUC). Four feature sets were compared: core clinical variables (age, sex, and BMI); core clinical variables plus genus-level microbiota features; an extended clinical set additionally including country of residence, diet type, exercise, alcohol, and smoking frequency, antibiotic use in the prior year, number of stool samples contributed, type 2 diabetes, constipation, migraine, probiotic and fermented-food frequency, acid reflux, irritable bowel syndrome, inflammatory bowel disease, and small-intestinal bacterial overgrowth; and the extended clinical set plus microbiota features. Median imputation, one-hot encoding, scaling, and model fitting were performed within each training fold. Discrimination was summarized as the AUC with 2,000 bootstrap resamples.
Sensitivity analyses repeated the extended clinical model using strict single-condition definitions (SSD only or DP only), strict controls (no antibiotic use in the prior year and BMI 18.5-35.0 kg/m2), and restriction to the overlapping BMI range of cases and controls. These analyses used the same cross-validation scheme with a fixed L1 penalty at C = 0.1.
2.7. Scale-Upgraded Sensitivity Analysis
The frozen primary analysis retained participants with complete age, sex, and BMI data (n = 1,056), ensuring that all primary models used the same complete-case set. To incorporate the full eligible sample meeting the sequencing-depth criterion, we additionally analyzed all 1,307 participants with at least 1,000 reads. Missing covariates were addressed using multiple imputation by chained equations with the mice algorithm (van Buuren and Groothuis-Oudshoorn, 2011), generating 20 completed data sets with 20 iterations per set and a fixed seed (20260925). The imputation model included phenotypes, country, lifestyle, medication and comorbidity fields, sequencing instrument, library size, and stool-sample count.
Genus-level associations were estimated separately using covariate-adjusted OLS with HC3 robust standard errors and limma moderated t statistics applied to centered log-ratio abundances (Ritchie et al., 2015). Imputation-specific estimates were pooled using Rubin’s rules (Rubin, 1987), and FDR correction was applied within each method. A taxon was considered a consensus finding only when both methods reached q < 0.05 in the same direction. A factorial model estimated the main effects of short sleep and depression and their interaction, while an ordinal sleep-duration model tested the prespecified 7-8 h, 5-6 h, and <5 h dose-response. Beta-diversity group effects were evaluated using covariate-adjusted vegan::adonis2 with 999 permutations in each imputed data set, with PERMDISP used to assess dispersion. Predictive models repeated the leakage-safe nested cross-validation in the expanded set, compared logistic regression with histogram gradient boosting, estimated paired bootstrap AUC changes, and assessed calibration, Brier score, and decision-curve net benefit (Vickers and Elkin, 2006). This expanded analysis was prespecified as a sensitivity and scale-up analysis and does not replace the frozen primary estimates.
For the phenotype-matched analysis, constipation was defined as a positive constipation field among participants without depression, and controls were healthy participants without constipation, depression, or short sleep; participants in the depression-only and short-sleep-plus-depression groups were excluded. The constipation variable itself was removed from all predictor sets to avoid circularity. This analysis used the same leakage-free framework, with an outer repeated stratified five-fold split repeated three times and an inner three-fold split. Microbiota-only models included all 16S feature blocks (genus-level centered log-ratio features, alpha and beta diversity, higher-rank taxonomy, and prevalent ASVs) together with a reduced 146-genus feature set. Model families comprised elastic-net logistic regression, RBF support vector classification, random forests, extremely randomized trees, histogram gradient boosting, and regularized logistic regression. A fixed ensemble was defined a priori as the mean within-fold percentile rank across model families; neither individual model families nor the ensemble were selected using the outer test folds.
2.8. Statistical Reporting
Continuous variables are summarized as median (IQR), categorical variables as n (%), and discrimination as AUC (95% CI). All tests were two-sided. P values and q values are reported to three decimal places unless smaller than 0.001. The 36-participant SSD + DP group was not used to support confirmatory claims.
3. Results
3.1. Participant Flow and Baseline Characteristics
The source query identified 26,547 non-blank V4 sample records, including 18,283 stool samples from 15,550 unique participants. Among 3,885 participants aged 60 years or older, 1,321 remained after selection of a primary sample and assignment to non-overlapping phenotype groups. Complete age, sex, and BMI data were available for 1,066 participants. After applying the minimum library-size threshold of 1,000 reads, the primary analysis included 1,056 participants: HC n = 617, SSD only n = 255, DP only n = 148, and exploratory SSD + DP n = 36. In total, 19,369 ASVs were reconstructed, of which 718 remained after the pre-specified ASV filter (Supplementary Figure S1).

Table 1.
Participant characteristics by phenotype group. Continuous variables are shown as median (IQR) and categorical variables as n (%). P values are from Kruskal-Wallis or chi-square tests as appropriate. The exploratory SSD + DP group should be interpreted with caution.
Table 1.
Participant characteristics by phenotype group. Continuous variables are shown as median (IQR) and categorical variables as n (%). P values are from Kruskal-Wallis or chi-square tests as appropriate. The exploratory SSD + DP group should be interpreted with caution.
| Characteristic | Overall (n = 1056) |
HC | SSD only | DP only | SSD + DP | P |
|---|---|---|---|---|---|---|
| Age, years | 66.0 (63.0-69.0) |
66.0 (63.0-69.0) | 66.0 (63.0-70.0) | 66.0 (62.8-68.0) | 65.0 (62.0-68.2) | 0.303 |
| BMI, kg/m2 | 24.4 (22.1-27.7) |
24.1 (22.0-27.0) | 25.3 (22.4-29.1) | 25.1 (22.3-28.3) | 25.5 (22.7-29.7) | 0.017 |
| Female sex | 527 (49.9%) | 273 (44.2%) | 131 (51.4%) | 99 (66.9%) | 24 (66.7%) | 1.98e-06 |
| Antibiotic use in the past year | 426 (40.3%) | 237 (38.4%) | 105 (41.2%) | 63 (42.6%) | 21 (58.3%) | 0.103 |
| Country of residence: United States | 595 (56.3%) | 339 (54.9%) | 148 (58.0%) | 93 (62.8%) | 15 (41.7%) | 0.988 |
| Diet type: Omnivore | 800 (75.8%) | 463 (75.0%) | 194 (76.1%) | 114 (77.0%) | 29 (80.6%) | 0.998 |
| Exercise frequency: Regularly (3-5 Times/Week) | 451 (42.7%) | 276 (44.7%) | 97 (38.0%) | 69 (46.6%) | 9 (25.0%) | 1.41e-05 |
| Alcohol frequency: Never | 174 (16.5%) | 88 (14.3%) | 51 (20.0%) | 28 (18.9%) | 7 (19.4%) | |
| Smoking frequency: Never | 1016 (96.2%) | 599 (97.1%) | 248 (97.3%) | 136 (91.9%) | 33 (91.7%) | 0.0002 |
| Reported sleep duration: 5-6 hours | 252 (23.9%) | 0 (0.0%) | 222 (87.1%) | 0 (0.0%) | 30 (83.3%) | |
| Reported sleep duration: 6-7 hours | 47 (4.5%) | 0 (0.0%) | 0 (0.0%) | 47 (31.8%) | 0 (0.0%) | |
| Reported sleep duration: 7-8 hours | 679 (64.3%) | 617 (100.0%) | 0 (0.0%) | 62 (41.9%) | 0 (0.0%) | 0.00e+00 |
| Reported sleep duration: 8 or more hours | 39 (3.7%) | 0 (0.0%) | 0 (0.0%) | 39 (26.4%) | 0 (0.0%) |
3.2. Alpha and Beta Diversity
Alpha diversity differed modestly across phenotype groups. Faith’s phylogenetic diversity showed the strongest overall difference (Kruskal-Wallis q = 0.001), followed by Shannon diversity (q = 0.031), whereas Simpson diversity (q = 0.062) and Pielou evenness (q = 0.168) did not reach significance after correction across the four metrics. In pairwise comparisons within each metric, both short-sleep-only and depression-only participants differed from healthy controls for Shannon diversity (Benjamini-Hochberg q = 0.019 for both) and for Faith’s phylogenetic diversity (q = 0.009 and q < 0.001, respectively); no pairwise contrast survived correction for Pielou evenness or Simpson diversity, and short sleep and depression did not differ from each other for any metric (minimum q = 0.799) (Figure 1A-D). Within-group Bray-Curtis distances differed between groups (SSD vs HC q < 0.001; DP vs HC q = 0.008; SSD vs DP q = 0.047; Figure 1E), indicating heterogeneous within-group dispersion. PERMANOVA detected no global group effect on community composition for any distance metric (minimum P = 0.065), and no pairwise comparison with healthy controls retained FDR significance (Figure 1F).
3.3. Taxonomic Composition and Differential Abundance
The most abundant phyla were Unclassified (35.9%), Firmicutes (34.9%), and Bacteroidota (21.7%). At the genus level, the highest mean relative abundances were Unclassified (35.9%), Bacteroides (15.8%), and Faecalibacterium (4.0%) (Figure 2). After adjustment for age, sex, and BMI and FDR control, 3 significant genera were identified in short-sleep-only participants, 3 in depression-only participants, and 0 in the exploratory short-sleep-plus-depression group. In short-sleep-only participants, the leading adjusted associations were lower UCG-002 (log2FC = -1.01, q = 0.005), lower UCG-003 (log2FC = -0.76, q = 0.026), and higher Erysipelatoclostridium (log2FC = 0.69, q = 0.028). In depression-only participants, the leading adjusted associations were lower UCG-003 (log2FC = -1.21, q = 0.001), higher [Ruminococcus] gnavus group (log2FC = 1.06, q = 0.031), and lower Lachnospiraceae UCG-010 (log2FC = -0.71, q = 0.031) (Figure 3).
A standard LEfSe analysis across all taxonomic ranks (raw Kruskal-Wallis p < 0.05, pairwise Wilcoxon p < 0.05, LDA effect size >= 2.0, 30 bootstrap iterations at 67% subsampling) identified 96 significant taxon-contrast pairs representing 56 unique taxa (SSD vs HC 35, DP vs HC 50, SSD vs DP 11). The largest effect sizes were observed for Oscillospirales (Order, SSD vs HC, depleted, LDA = 3.95), Oscillospiraceae (Family, SSD vs HC, depleted, LDA = 3.58), Faecalibacterium (Genus, SSD vs HC, depleted, LDA = 3.51), UCG-002 (Genus, SSD vs HC, depleted, LDA = 3.44), Faecalibacterium (Genus, DP vs HC, depleted, LDA = 3.42), and Roseburia (Genus, SSD vs DP, enriched, LDA = 3.40). Because LEfSe uses raw p values rather than Benjamini-Hochberg FDR, corresponding q values are reported as secondary annotations, and several taxa meeting the raw criteria do not survive FDR correction. This analysis used the scale-up set (n = 1,307) and is presented as a sensitivity analysis rather than as the frozen primary result. The LDA bar chart and radial cladogram are shown in Figure 4, and the complete per-contrast result is listed in Table S15.
3.4. Machine-Learning Discrimination
Discrimination of the phenotype contrasts was summarized by the area under the receiver-operating-characteristic curve within the same leakage-free nested cross-validation framework (Figure 5). For the phenotype contrast used in the reference study, constipation versus healthy controls (78 cases and 695 controls), the microbiota-only model reached an AUC of 0.771 (95% CI 0.714-0.826), and the model combining microbiota with the other attributes reached 0.798 (95% CI 0.753-0.844), compared with the AUC of 0.694 reported by Li et al. (2026) for the same contrast (Figure 5A). Discrimination was lower for the two phenotypes examined in the primary analysis: microbiota-only and microbiota-with-other-attributes AUCs were 0.567 and 0.686 for depression and 0.549 and 0.613 for short sleep, respectively (Figure 5B, C). For the depression model, the leading genus coefficients were UCG-003, [Ruminococcus] gnavus group, Senegalimassilia, and Negativibacillus (Figure 5D), and the mean relative abundances of these genera differed only slightly across the healthy-control, short-sleep, and depression groups (Figure 5E). Despite the higher constipation AUC, the marked class imbalance was associated with very low sensitivity in the highest-AUC tree models; the prespecified rank-mean ensemble was more balanced, with sensitivity 0.83 and specificity 0.56. None of these estimates supports clinical use, and the constipation contrast is retained only as a phenotype-matched benchmark against the reference study.
3.5. Shared and Condition-Associated Taxa
Across the five FDR-significant genera identified in the primary complete-case analysis, the adjusted short-sleep-only and depression-only coefficients classified one genus (UCG-003) as shared depleted, two genera (Erysipelatoclostridium and UCG-002) as short-sleep-only specific, and two genera (Lachnospiraceae UCG-010 and [Ruminococcus] gnavus group) as depression-only specific; no genus was shared enriched or classified as opposite-direction, and none of the exploratory short-sleep-plus-depression estimates was significant (Figure 6A). The corresponding adjusted log2 centered-log-ratio effects are shown across the short-sleep-only, depression-only, and comorbid contrasts (Figure 6B). The classification therefore indicates that the primary complete-case signal was dominated by condition-associated genera rather than by a single shared enrichment pattern.
3.6. Model Comparison and Sensitivity Analyses
In the primary complete-case set, nested cross-validated discrimination for short sleep was 0.554 (95% CI 0.514-0.596) for the core clinical model and 0.599 (95% CI 0.559-0.640) for the extended clinical model; adding genus-level microbiota features produced AUCs of 0.555 (95% CI 0.515-0.596) and 0.566 (95% CI 0.524-0.608), respectively, so neither addition improved discrimination (Figure 7A, C). For depression, the corresponding AUCs were 0.623 (95% CI 0.579-0.668) for the core clinical model and 0.654 (95% CI 0.611-0.695) for the extended clinical model, and 0.607 (95% CI 0.561-0.653) and 0.637 (95% CI 0.593-0.680) after adding microbiota (Figure 7B, C). The microbiota features most consistently retained across cross-validation folds were, for short sleep, UCG-002 (100% of folds), Streptococcus (84% of folds), LD-RB-34 (80% of folds), and Erysipelatoclostridium (92% of folds); for depression, they were UCG-003 (100% of folds), Senegalimassilia (80% of folds), Negativibacillus (76% of folds), and [Ruminococcus] gnavus group (84% of folds) (Table S4). Across strict-diagnosis, strict-control, and BMI-overlap sensitivity analyses, discrimination ranged from 0.575 to 0.610 for short sleep and from 0.643 to 0.675 for depression, overlapping the corresponding primary estimates (Figure 8).
3.7. Scale-Upgraded Sensitivity and Statistical Design
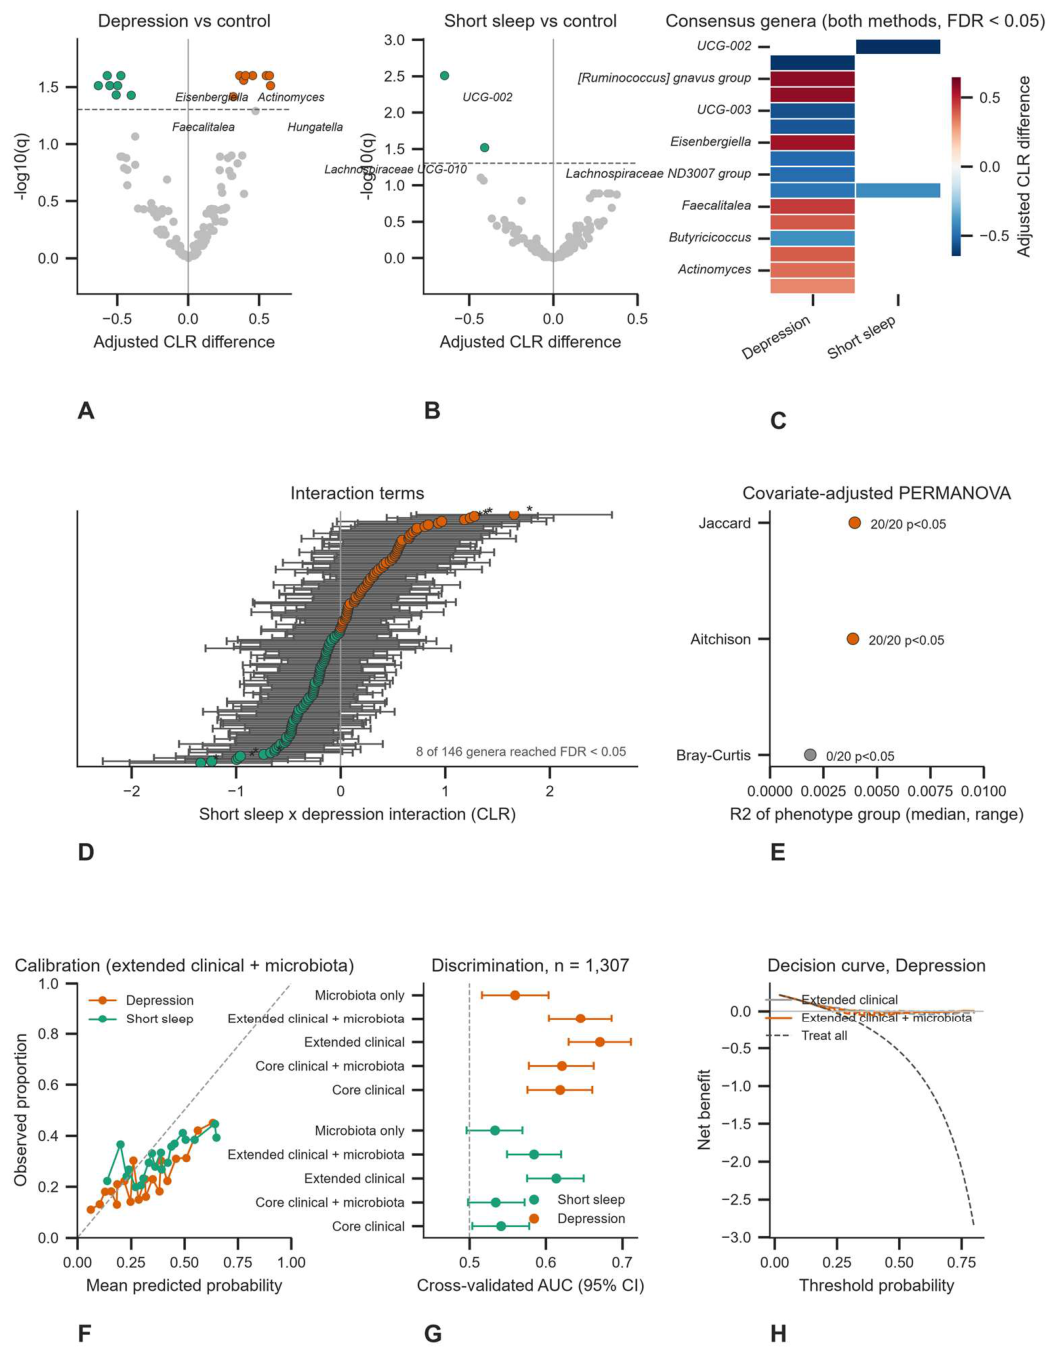
The scale-upgraded sensitivity analysis included all 1,307 eligible participants with at least 1,000 reads and 146 genera, analyzed across 20 multiply imputed data sets. FDR-controlled differential abundance was concordantly identified by OLS and limma for 17 genera (15 depression-associated and 2 short-sleep-associated), and 8 genera showed a short-sleep-by-depression interaction. Logistic-model AUCs in the expanded set were 0.585 for short sleep and 0.645 for depression. For depression, the paired change in discrimination after adding microbiota was -0.025 (95% CI -0.055 to +0.005; paired bootstrap P = 0.095), providing no evidence of incremental predictive value. Covariate-adjusted PERMANOVA across the 20 multiply imputed data sets yielded a median phenotype-group R2 of 0.004; 2 of 3 distance metrics reached P < 0.05 in every imputation (Aitchison, Jaccard). Under the same nested protocol, adding further model families (elastic-net logistic regression, an RBF support vector classifier and extremely randomized trees) increased the best observed discrimination to 0.622 for short sleep and 0.687 for depression (Table S14). These expanded analyses identified additional modest genus-level associations but remained directionally consistent with the primary analysis; discrimination for both phenotypes remained below a level suitable for clinical use (Figure 9; Tables S7-S15).
4. Discussion
In this prespecified AGP analysis, older adults with short sleep and those with depression showed weak, largely condition-associated microbiota signals rather than a consistent shared taxonomic signature. Alpha-diversity differences were small, beta-diversity separation was limited, and only a few genera remained significant after covariate adjustment and FDR control in the primary complete-case analysis. Expanding the sample and pooling estimates across multiply imputed covariate sets increased the number of consensus genera but did not change this overall pattern. Together, these results are more consistent with a partially overlapping, phenotype-dependent relationship between sleep duration, depression, and the fecal microbiome than with a single microbial profile common to both conditions. This interpretation must remain cautious because the design was cross-sectional and relied on self-reported phenotypes and 16S relative-abundance data.
The present study extends two closely related AGP analyses. Gao et al. (2024) examined short sleep across the all-adult AGP cohort, whereas we restricted the analysis to adults aged 60 years or older and evaluated short sleep alongside depression. Li et al. (2026) used the same older-adult AGP cohort and a shared-versus-condition-specific framework for depression and constipation but did not examine short sleep or define a normal-sleep control group. In our primary models, broader clinical covariate adjustment improved discrimination, whereas adding genus-level microbiota features did not improve it for either short sleep or depression, arguing against a strong incremental predictive contribution from individual genera for these phenotypes. By contrast, when we reproduced the reference phenotype contrast under the same leakage-free design, microbiota-only discrimination for constipation versus healthy controls reached an AUC of 0.771 and the extended clinical-plus-microbiota model reached 0.798, compared with 0.694 reported by Li et al. (2026). This suggests that microbiota signal strength in this cohort is phenotype-dependent rather than uniformly weak: constipation showed a detectable, though still non-diagnostic, signal, whereas short sleep and depression showed weaker discrimination. The present analysis is therefore best viewed as an extension to a different phenotype pairing rather than as independent validation of either prior study, particularly because both draw on the same public data source. The higher constipation AUC should not be read as evidence of clinical utility, given the small number of cases and the marked class imbalance; the informative observation is the reproducibility and direction of the phenotype contrast, not the absolute AUC.
The small effect sizes observed here are consistent with the broader literature on sleep and mood phenotypes in large population cohorts. Aging brings reduced ecological resilience, greater between-individual variability, and persistent low-grade inflammation, all of which may diminish the marginal contribution of any single genus to a complex behavioral phenotype (Claesson et al., 2012; Xu et al., 2021; Bradley and Haran, 2024). Self-reported sleep and depression measures in a citizen-science cohort are also likely to be less precise than clinician-adjudicated diagnoses, which would tend to attenuate observed associations. The consistently weak discrimination for short sleep and depression should therefore be read in the context of phenotype measurement and the cross-sectional design, rather than as evidence that the gut microbiota is biologically irrelevant to these conditions.
For short sleep, the leading adjusted associations were depletion of UCG-002 and UCG-003 and enrichment of Erysipelatoclostridium; the scale-upgraded analysis additionally identified Roseburia and Faecalibacterium among depleted butyrate-associated taxa, and the multi-rank LEfSe analysis recovered a related set of Lachnospiraceae and Oscillospiraceae features. Depletion of Faecalibacterium and other butyrate-producing commensals has been reported in conditions characterized by mucosal inflammation, and butyrate contributes to epithelial energy metabolism, tight-junction integrity, and mucosal immune regulation (Sokol et al., 2008; Miquel et al., 2013; Peng et al., 2009; Quévrain et al., 2016; Ferreira-Halder et al., 2017; Breyner et al., 2017). SCFAs also influence enteroendocrine signaling, enteric neural activity, and systemic inflammatory tone, providing plausible links between microbial metabolism, sleep disruption, and host physiology (Canfora et al., 2015; Nøhr et al., 2013; Dalile et al., 2019; Silva et al., 2020). Experimental sleep restriction alters microbial composition and SCFA availability in rodents, and circadian disruption can shift the timing of microbial metabolic output, which supports a possible bidirectional relationship between short sleep and butyrate-producing taxa (Matenchuk et al., 2020; Wang et al., 2022). Erysipelatoclostridium has been reported as enriched in inflammatory and metabolic dysbiosis, but its functional role remains uncertain, so we refrain from assigning a directional mechanistic interpretation.
For depression, the leading associations were depletion of UCG-003 and Lachnospiraceae UCG-010 and enrichment of [Ruminococcus] gnavus group, with Erysipelatoclostridium again among the enriched taxa. This pattern overlaps only partially with taxa reported in meta-analyses of depression-associated gut bacteria, in which depletion of butyrate-producing genera and enrichment of mucin- or inflammation-associated taxa are among the more reproducible signals (Gao et al., 2023; Liang et al., 2022). [Ruminococcus] gnavus group is a mucin-degrading taxon that can expand in inflammatory dysbiosis and has been linked to altered mucus-layer dynamics, whereas members of Lachnospiraceae and Oscillospiraceae contribute substantially to butyrate and other SCFAs in the colonic ecosystem (Miquel et al., 2013; Dalile et al., 2019). Potential mechanisms linking such compositional differences to mood-related phenotypes include SCFA-dependent regulation of microglia and neuroinflammation, microbially influenced tryptophan and kynurenine metabolism, and modulation of bile-acid signaling (Caetano-Silva et al., 2023; Cheng et al., 2024; Shen et al., 2024; Kennedy et al., 2017; O’Mahony et al., 2015; Jia et al., 2024). Insomnia and depression have both been associated with altered gut microbiota-bile acid crosstalk, offering a biologically coherent but untested framework for relating the observed taxa to the phenotypes examined here (Jiang et al., 2022). A similar pattern of enrichment of mucin-associated taxa and depletion of butyrate producers was also evident in the phenotype-matched constipation contrast, suggesting that related ecological features may occur across gut-motility and mood phenotypes despite differences in the specific taxa involved.
The overlap between short sleep and depression in our data was more evident in selected genus-level features than in a common disease-specific community structure. Both phenotypes were associated with taxa previously linked to SCFA production, mucin utilization, inflammatory activity, or gut ecosystem stability, and the factorial model identified a small number of genera showing statistical interaction between short sleep and depression. These findings do not support a single uniform microbial signature shared by the two phenotypes, but they are compatible with partial convergence on related ecological and metabolic features. SCFAs are relevant here because they influence epithelial barrier integrity, mucosal immune regulation, enteroendocrine signaling, and enteric nervous system activity, while microbiota-related variation in tryptophan-serotonin metabolism, bile-acid signaling, neuroimmune activation, and hypothalamic-pituitary-adrenal axis activity provides additional plausible links with sleep- and mood-related pathways (Silva et al., 2020; Dalile et al., 2019; Mayer et al., 2014; O’Mahony et al., 2015; Kennedy et al., 2017; Jia et al., 2024). Given the cross-sectional design, these mechanisms should be regarded as hypotheses rather than explanations of the observed associations. Population-level 16S rRNA profiling may nevertheless help generate candidate hypotheses for subsequent longitudinal, metagenomic, metabolomic, and mechanistic investigation.
Several methodological features strengthen the analysis, although they do not remove the limitations inherent to an observational, cross-sectional study. The analysis was prespecified, used leakage-free nested cross-validation with all preprocessing and tuning confined to the training folds, and compared multiple model families, reducing dependence on any single algorithm. Differential abundance findings were cross-checked with two independent modeling approaches in the multiply imputed scale-up set, and beta-diversity group effects were re-evaluated with covariate-adjusted PERMANOVA across imputations, reducing reliance on a single specification. Finally, reproducing the reference-study phenotype contrast within the same cohort provided an internal benchmark: the pipeline recovered a stronger signal for the phenotype with the more pronounced microbiota association. This supports the interpretation that the weak findings for short sleep and depression are phenotype-dependent rather than an artifact of the analytical pipeline.
5. Strengths and Limitations
This study has several limitations that temper interpretation. First, phenotype classification relied on self-reported questionnaire fields rather than clinician-adjudicated diagnoses, and information on symptom severity, duration, and treatment was unavailable; exposure misclassification is therefore likely and would tend to attenuate the associations observed. Second, although covariate-adjusted analyses accounted for age, sex, and BMI, several potentially important host and environmental factors, including detailed diet composition, physical activity, antidepressant and sedative use, laxative use, and recent antibiotic exposure, were unavailable or only coarsely measured, so residual confounding cannot be excluded. Third, the primary complete-case analysis required complete age, sex, and BMI data and therefore excluded participants with missing covariates. The scale-upgraded analysis mitigated this restriction by including all 1,307 eligible participants across 20 multiply imputed data sets and increased the number of FDR-confirmed consensus genera from six to 17, but multiple imputation does not add sequencing samples and cannot recover variables that were never measured. Fourth, the short-sleep-plus-depression group was small, so comorbidity-specific findings remain exploratory and cannot support confirmatory claims. Fifth, 16S rRNA amplicon sequencing has limited taxonomic and functional resolution: it cannot establish species- or strain-level effects and does not directly measure microbial genes, metabolites, inflammatory markers, bile-acid profiles, or neurotransmitter pathways. Finally, the cross-sectional design precludes temporal or causal inference, because the microbial differences observed here may precede, follow, or simply accompany the phenotypes examined.
Predictive performance was also limited. Discrimination remained modest for short sleep and depression (AUC 0.57-0.68 across analyses) and was higher in the phenotype-matched constipation analysis (microbiota-only AUC 0.771; extended clinical-plus-microbiota AUC 0.798). That analysis, however, included only 78 constipation cases and 695 controls, and the highest-AUC tree models had very low sensitivity; none of these estimates therefore supports clinical use. In addition, differences in library size and the compositional nature of microbiome data may influence diversity and abundance estimates, and unmeasured confounding related to medication use, diet, geography, and sampling variation may persist. The AGP cohort is also not population-representative, which limits generalization. Overall, the findings should be regarded as hypothesis-generating and require replication in longitudinal cohorts with validated phenotyping, standardized sampling, and functional or metabolomic measurements.
6. Conclusions
Among older AGP participants, short sleep and depression were associated with subtle, partially condition-associated fecal microbiota features rather than a single shared microbial signature. The implicated taxa were predominantly butyrate-producing and mucin-associated groups, yet these associations did not improve discrimination beyond age, sex, and BMI. A phenotype-matched sensitivity analysis produced a clearer, though still non-diagnostic, signal for constipation, indicating that the strength of microbiota association in this cohort varies by phenotype. These findings are exploratory, require independent validation, and do not support clinical diagnostic or causal interpretations. Longitudinal and multi-omic studies will be needed to determine whether the observed associations reflect shared or phenotype-specific biological pathways.
Supplementary Materials
The following supporting information can be downloaded at the website of this paper posted on Preprints.org. Supplementary Tables S1-S15 and Supplementary Figures S1-S4 are provided in the Supplementary Material. The standard LEfSe taxon-level discriminant analysis is presented as main-text Figure 4.
Author Contributions
Y.W. designed the study, curated and verified the data, performed the statistical and machine-learning analyses, generated the figures, tables, and source data, and drafted the manuscript. J.R. conceived and supervised the study, verified the analysis, and critically revised the manuscript. Both authors approved the final version and agree to be accountable for all aspects of the work.
Funding
This research received no specific grant from any funding agency in the public, commercial, or not-for-profit sectors.
Institutional Review Board Statement
This study used publicly available, de-identified American Gut Project data obtained through ENA. Ethical approval and informed consent were obtained by the original study investigators; no additional approval was required for this secondary analysis.
Informed Consent Statement
Informed consent was obtained by the original American Gut Project investigators. This secondary analysis used only de-identified, publicly available data and did not require additional informed consent.
Data Availability Statement
Source sequencing data are available from ENA project PRJEB11419. Derived participant-level tables, analysis outputs, source data, and code are provided in the submission package. No new sequencing data were generated.
Acknowledgments
We thank the American Gut Project participants and the ENA for maintaining this public data resource.
Conflicts of Interest
The authors declare that the research was conducted in the absence of any commercial or financial relationships that could be construed as a potential conflict of interest.
Use of Artificial Intelligence
The authors declare that no generative artificial intelligence or AI-assisted technologies were used in the preparation of this manuscript.
References
- Anderson, M. J. A new method for non-parametric multivariate analysis of variance. Austral Ecol. 2001, 26, 32–46. [Google Scholar] [CrossRef]
- Bao, A. M.; Swaab, D. F. The human hypothalamus in relation to seasonal cycles and depression. Neurosci. Biobehav. Rev. 2017, 74, 277–285. [Google Scholar] [CrossRef] [PubMed]
- Benjamini, Y.; Hochberg, Y. Controlling the false discovery rate: a practical and powerful approach to multiple testing. J. R. Stat. Soc. B 1995, 57, 289–300. [Google Scholar] [CrossRef]
- Bolyen, E.; Rideout, J. R.; Dillon, M. R.; Bokulich, N. A.; Abnet, C. C.; Al-Ghalith, G. A.; et al. Reproducible, interactive, scalable and extensible microbiome data science using QIIME 2. Nat. Biotechnol. 2019, 37, 852–857. [Google Scholar] [CrossRef] [PubMed]
- Bradley, E.; Haran, J. The human gut microbiome and aging. Gut Microbes 2024, 16, 2359677. [Google Scholar] [CrossRef] [PubMed]
- Breyner, N. M.; Michon, C.; de Sousa, C. S.; Vilas Boas, P. B.; Chain, F.; Azevedo, V. A.; et al. Microbial anti-inflammatory molecule (MAM) from Faecalibacterium prausnitzii shows a protective effect on DNBS and DSS-induced colitis model in mice through inhibition of NF-kappaB pathway. Front. Microbiol. 2017, 8, 114. [Google Scholar] [CrossRef] [PubMed]
- Caetano-Silva, M. E.; Rund, L.; Hutchinson, N. T.; Woods, J. A.; Steelman, A. J.; Johnson, R. W. Inhibition of inflammatory microglia by dietary fiber and short-chain fatty acids. Sci. Rep. 2023, 13, 2819. [Google Scholar] [CrossRef] [PubMed]
- Callahan, B. J.; McMurdie, P. J.; Rosen, M. J.; Han, A. W.; Johnson, A. J. A.; Holmes, S. P. DADA2: high-resolution sample inference from Illumina amplicon data. Nat. Methods 2016, 13, 581–583. [Google Scholar] [CrossRef] [PubMed]
- Canfora, E. E.; Jocken, J. W.; Blaak, E. E. Short-chain fatty acids in control of body weight and insulin sensitivity. Nat. Rev. Endocrinol. 2015, 11, 577–591. [Google Scholar] [CrossRef] [PubMed]
- Cheng, J.; Hu, H.; Ju, Y.; Liu, J.; Wang, M.; Liu, B.; et al. Gut microbiota-derived short-chain fatty acids and depression: deep insight into biological mechanisms and potential applications. Gen. Psychiatry 2024, 37, e101374. [Google Scholar] [CrossRef] [PubMed]
- Claesson, M. J.; Jeffery, I. B.; Conde, S.; Power, S. E.; O’Connor, E. M.; Cusack, S.; et al. Gut microbiota composition correlates with diet and health in the elderly. Nature 2012, 488, 178–184. [Google Scholar] [CrossRef] [PubMed]
- Dalile, B.; Van Oudenhove, L.; Vervliet, B.; Verbeke, K. The role of short-chain fatty acids in microbiota-gut-brain communication. Nat. Rev. Gastroenterol. Hepatol. 2019, 16, 461–478. [Google Scholar] [CrossRef] [PubMed]
- Fang, P.; Kazmi, S. A.; Jameson, K. G.; Hsiao, E. Y. The microbiome as a major regulator of brain development and behavior. J. Cell. Mol. Med. 2019, 23, 4066–4073. [Google Scholar] [CrossRef] [PubMed]
- Ferreira-Halder, C. V.; de Sousa Faria, A. V.; Andrade, S. S. Action and function of Faecalibacterium prausnitzii in health and disease. Best Pract. Res. Clin. Gastroenterol. 2017, 31, 643–648. [Google Scholar] [CrossRef] [PubMed]
- Gao, F.; Ding, L.; Du, G. Association between sleep duration and gut microbiome among adults in the American Gut Project. Sleep Breath 2024, 29, 18. [Google Scholar] [CrossRef] [PubMed]
- Gao, M.; Wang, J.; Liu, P.; Tu, H.; Zhang, R.; Zhang, Y.; et al. Gut microbiota composition in depressive disorder: a systematic review, meta-analysis, and meta-regression. Transl. Psychiatry 2023, 13, 379. [Google Scholar] [CrossRef] [PubMed]
- Jia, M.; Fan, Y.; Ma, Q.; Yang, D.; Wang, Y.; He, X.; et al. Gut microbiota dysbiosis promotes cognitive impairment via bile acid metabolism in major depressive disorder. Transl. Psychiatry 2024, 14, 503. [Google Scholar] [CrossRef] [PubMed]
- Jiang, Z.; Zhuo, L. B.; He, Y.; Fu, Y.; Shen, L.; Xu, F.; et al. The gut microbiota-bile acid axis links the positive association between chronic insomnia and cardiometabolic diseases. Nat. Commun. 2022, 13, 3002. [Google Scholar] [CrossRef] [PubMed]
- Kennedy, P. J.; Cryan, J. F.; Dinan, T. G.; Clarke, G. Kynurenine pathway metabolism and the microbiota-gut-brain axis. Neuropharmacology 2017, 112, 399–412. [Google Scholar] [CrossRef] [PubMed]
- Li, X.; Ke, L.; Wang, T.; Lei, Z.; Tian, F.; Zhang, Y.; et al. Shared and condition-associated gut microbiota alterations in older adults with depression and constipation: evidence from the American Gut Project. Front. Microbiol. 2026, 17, 1891231. [Google Scholar] [CrossRef] [PubMed]
- Liang, S.; Sin, Z. Y.; Yu, J.; Zhao, S.; Xi, Z.; Bruzzone, R.; et al. Multi-cohort analysis of depression-associated gut bacteria sheds insight on bacterial biomarkers across populations. Cell. Mol. Life Sci. 2022, 80, 9. [Google Scholar] [CrossRef] [PubMed]
- Matenchuk, B. A.; Mandhane, P. J.; Kozyrskyj, A. L. Sleep, circadian rhythm, and gut microbiota. Sleep Med. Rev. 2020, 53, 101340. [Google Scholar] [CrossRef] [PubMed]
- Mayer, E. A.; Knight, R.; Mazmanian, S. K.; Cryan, J. F.; Tillisch, K. Gut microbes and the brain: paradigm shift in neuroscience. J. Neurosci. 2014, 34, 15490–15496. [Google Scholar] [CrossRef] [PubMed]
- Miquel, S.; Martin, R.; Rossi, O.; Bermudez-Humaran, L. G.; Chatel, J. M.; Sokol, H.; et al. Faecalibacterium prausnitzii and human intestinal health. Curr. Opin. Microbiol. 2013, 16, 255–261. [Google Scholar] [CrossRef] [PubMed]
- Nøhr, M. K.; Pedersen, M. H.; Gille, A.; Egerod, K. L.; Engelstoft, M. S.; Husted, A. S.; et al. GPR41/FFAR3 and GPR43/FFAR2 as cosensors for short-chain fatty acids in enteroendocrine cells vs FFAR3 in enteric neurons and FFAR2 in enteric leukocytes. Endocrinology 2013, 154, 3552–3564. [Google Scholar] [CrossRef] [PubMed]
- O’Mahony, S. M.; Clarke, G.; Borre, Y.; Dinan, T. G.; Cryan, J. Serotonin, tryptophan metabolism and the brain-gut-microbiome axis. Behav. Brain Res. 2015, 277, 32–48. [Google Scholar] [CrossRef] [PubMed]
- O’Toole, P. W.; Jeffery, I. B. Gut microbiota and aging. Science 2015, 350, 1214–1215. [Google Scholar] [CrossRef] [PubMed]
- Peng, L.; Li, Z.-R.; Green, R. S.; Holzman, I. R.; Lin, J. Butyrate enhances the intestinal barrier by facilitating tight junction assembly via activation of AMP-activated protein kinase in Caco-2 cell monolayers. J. Nutr. 2009, 139, 1619–1625. [Google Scholar] [CrossRef] [PubMed]
- Quast, C.; Pruesse, E.; Yilmaz, P.; Gerken, J.; Schweer, T.; Yarza, P.; et al. The SILVA ribosomal RNA gene database project: improved data processing and web-based tools. Nucleic Acids Res. 2013, 41, D590–D596. [Google Scholar] [CrossRef] [PubMed]
- Quévrain, E.; Maubert, M. A.; Michon, C.; Chain, F.; Marquant, R.; Tailhades, J.; et al. Identification of an anti-inflammatory protein from Faecalibacterium prausnitzii, a commensal bacterium deficient in Crohn’s disease. Gut 2016, 65, 415–425. [Google Scholar] [CrossRef] [PubMed]
- Ritchie, M. E.; Phipson, B.; Wu, D.; Hu, Y.; Law, C. W.; Shi, W.; et al. limma powers differential expression analyses for RNA-sequencing and microarray studies. Nucleic Acids Res. 2015, 43, e47. [Google Scholar] [CrossRef] [PubMed]
- Rubin, D. B. Multiple Imputation for Nonresponse in Surveys; Wiley: New York, 1987. [Google Scholar]
- Segata, N.; Izard, J.; Waldron, L.; Gevers, D.; Miropolsky, L.; Garrett, W. S.; et al. Metagenomic biomarker discovery and explanation. Genome Biol. 2011, 12, R60. [Google Scholar] [CrossRef] [PubMed]
- Shen, H.; Zhang, C.; Zhang, Q.; Lv, Q.; Liu, H.; Yuan, H.; et al. Gut microbiota modulates depressive-like behaviors induced by chronic ethanol exposure through short-chain fatty acids. J. Neuroinflammation 2024, 21, 290. [Google Scholar] [CrossRef] [PubMed]
- Silva, Y. P.; Bernardi, A.; Frozza, R. L. The role of short-chain fatty acids from gut microbiota in gut-brain communication. Front. Endocrinol. 2020, 11, 25. [Google Scholar] [CrossRef] [PubMed]
- Sokol, H.; Pigneur, B.; Watterlot, L.; Lakhdari, O.; Bermudez-Humaran, L. G.; Gratadoux, J. J.; et al. Faecalibacterium prausnitzii is an anti-inflammatory commensal bacterium identified by gut microbiota analysis of Crohn disease patients. Proc. Natl. Acad. Sci. U.S.A. 2008, 105, 16731–16736. [Google Scholar] [CrossRef] [PubMed]
- Supasitdikul, T.; et al. Sleep deprivation alters gut microbiome diversity and taxonomy: a systematic review and meta-analysis of human and rodent studies. J. Sleep Res. 2026, 35, e70125. [Google Scholar] [CrossRef] [PubMed]
- Tilves, C.; et al. Associations of self-reported and actigraphic sleep with gut microbiome composition and diversity among older adults. Sleep 2026, 49, zsag217. [Google Scholar] [CrossRef] [PubMed]
- Valles-Colomer, M.; Falony, G.; Darzi, Y.; Tigchelaar, E. F.; Wang, J.; Tito, R. Y.; et al. The neuroactive potential of the human gut microbiota in quality of life and depression. Nat. Microbiol. 2019, 4, 623–632. [Google Scholar] [CrossRef] [PubMed]
- van Buuren, S.; Groothuis-Oudshoorn, K. mice: multivariate imputation by chained equations in R. J. Stat. Softw. 2011, 45, 1–67. [Google Scholar] [CrossRef]
- Vickers, A. J.; Elkin, E. B. Decision curve analysis: a novel method for evaluating prediction models. Med. Decis. Making 2006, 26, 565–574. [Google Scholar] [CrossRef] [PubMed]
- Wang, Z.; Wang, Z.; Lu, T.; Chen, W.; Li, S.; Zhang, K.; et al. Sleep and gut microbiota: a bidirectional relationship. Sleep Med. Rev. 2022, 61, 101691. [Google Scholar] [CrossRef] [PubMed]
- Xu, Y.; Liu, X.; Liu, X.; Chen, D.; Wang, M.; Jiang, X.; et al. The roles of the gut microbiota and chronic low-grade inflammation in older adults with frailty. Front. Cell. Infect. Microbiol. 2021, 11, 675414. [Google Scholar] [CrossRef] [PubMed]
Figure 1.
Alpha and beta diversity by phenotype group. Panels A-D show Shannon diversity, Faith’s phylogenetic diversity, Pielou evenness, and Simpson diversity across the healthy control, short-sleep-only, depression-only, and exploratory short-sleep-plus-depression groups. Hollow boxes show medians and interquartile ranges, points show individual samples, and brackets indicate pairwise Mann-Whitney tests with Benjamini-Hochberg correction across the three contrasts within each metric. Panel E shows within-group Bray-Curtis distances, with filled points marking group means. Panel F shows Bray-Curtis principal-coordinate analysis with 95% within-group ellipses. The reference-style layout follows Li et al. (2026), while all plotted values are from the present analysis.
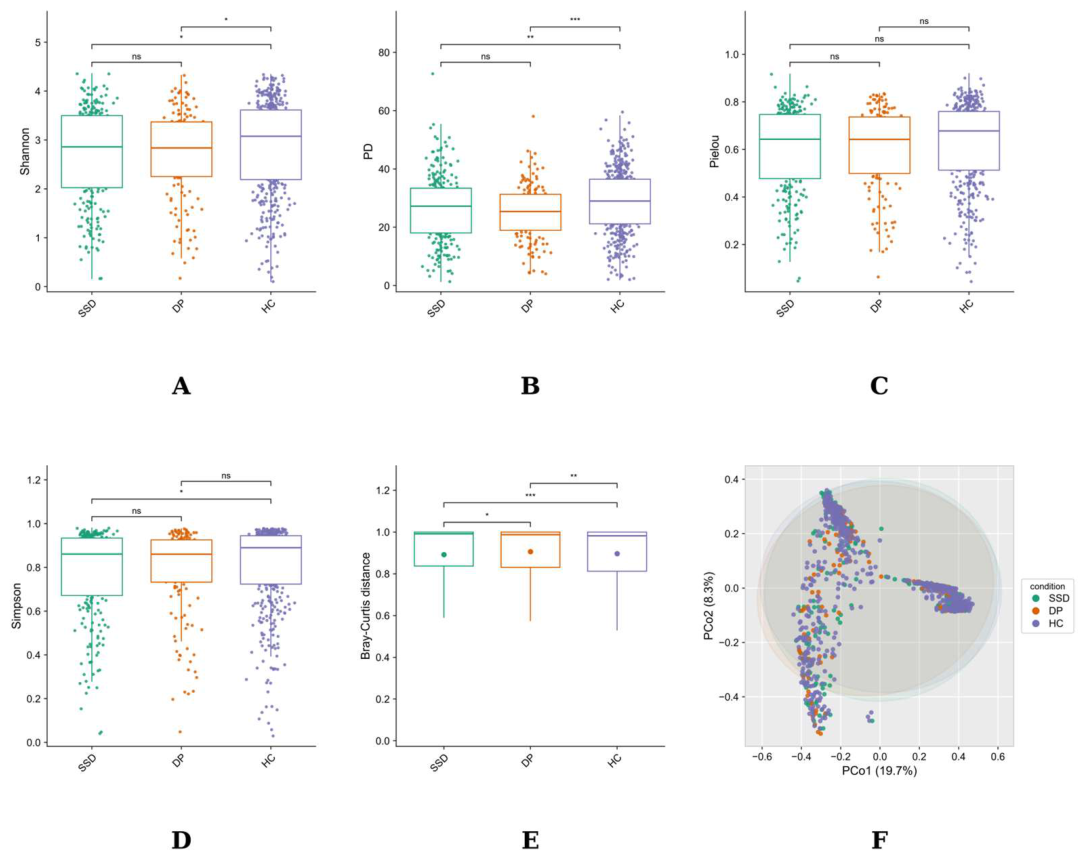
Figure 2.
Taxonomic composition. Panel A shows a three-set Venn diagram of ASVs detected in at least 10% of samples within each phenotype group. Panels B and C show 100% stacked phylum-level and class-level mean relative abundances, with the top taxa retained and the remainder grouped as Others. Panel D shows the top 40 genera plus Others. The reference-style layout follows Li et al. (2026), and the prevalence threshold in panel A is stated to avoid an uninformative presence-absence core.
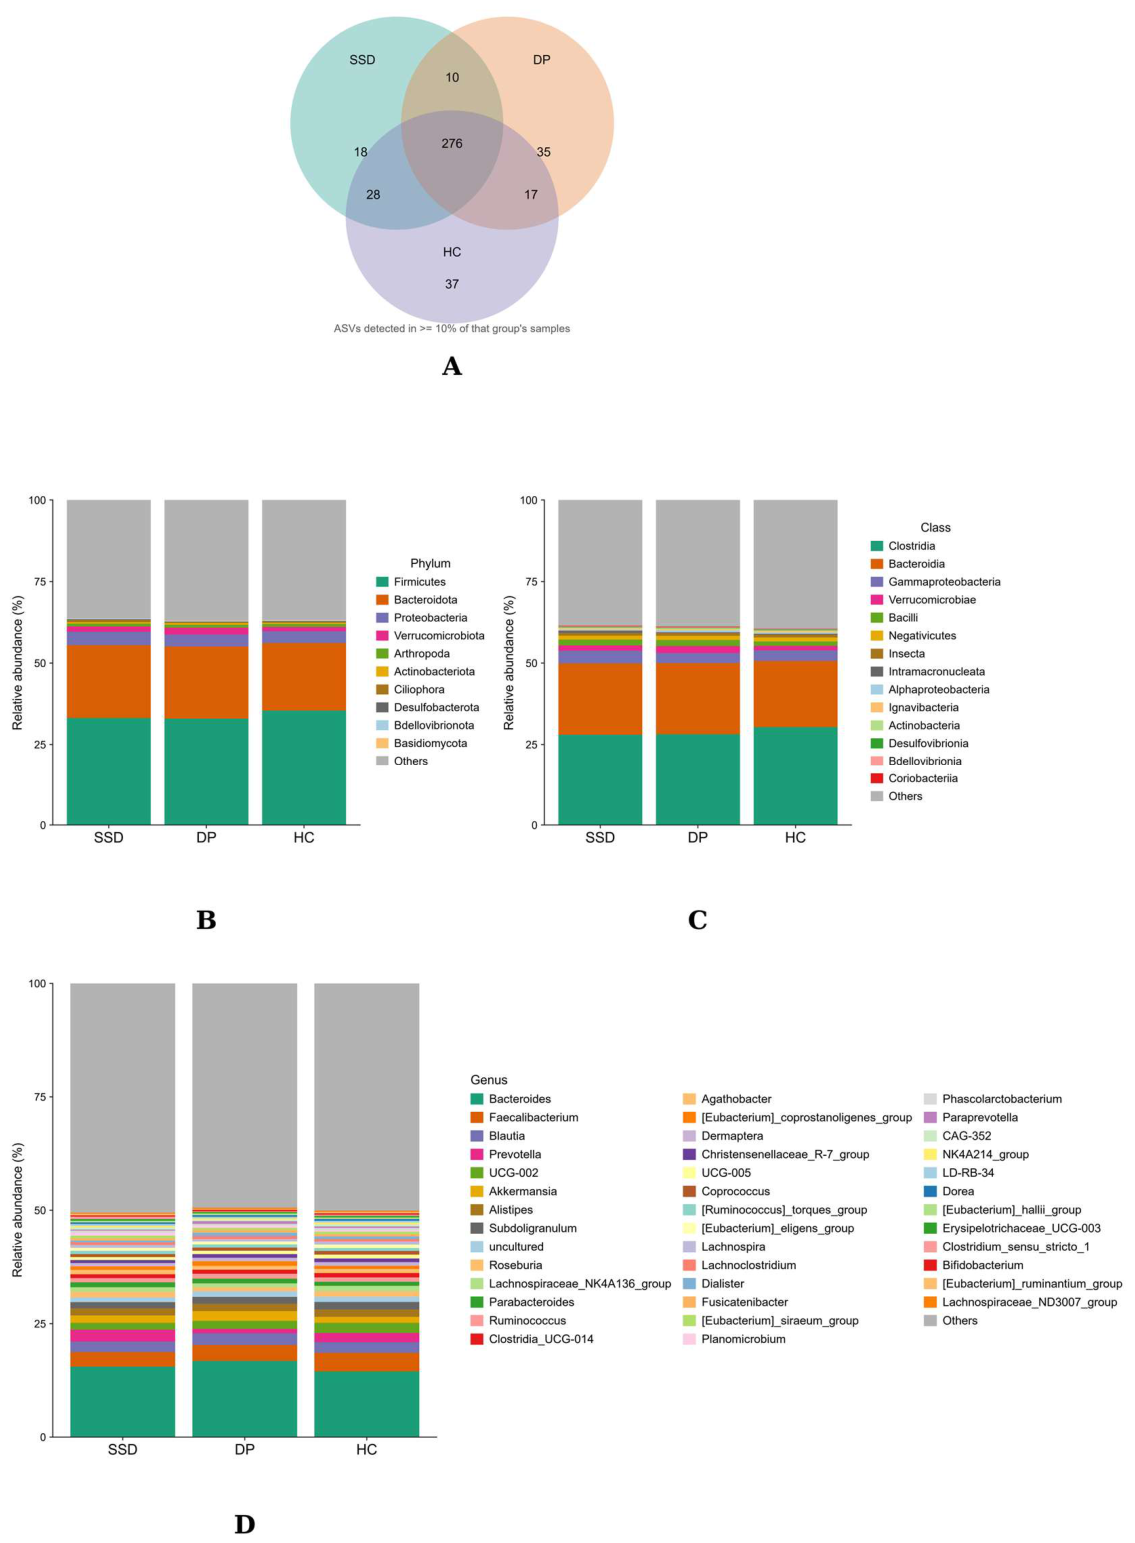
Figure 3.
Genus-level pairwise differential abundance. Panels show short-sleep-only versus healthy control (A), depression-only versus healthy control (B), and short-sleep-only versus depression-only (C) comparisons. For each contrast, the left block shows group mean proportions, the middle block shows the difference in mean proportions with 95% confidence intervals, and the right column reports Welch two-sample t-test P values. The top 18 genera with at least 5% prevalence are displayed, ordered by mean proportion in the first group. The reference-style layout follows Li et al. (2026); weak and nominal signals are reported without forced significance.
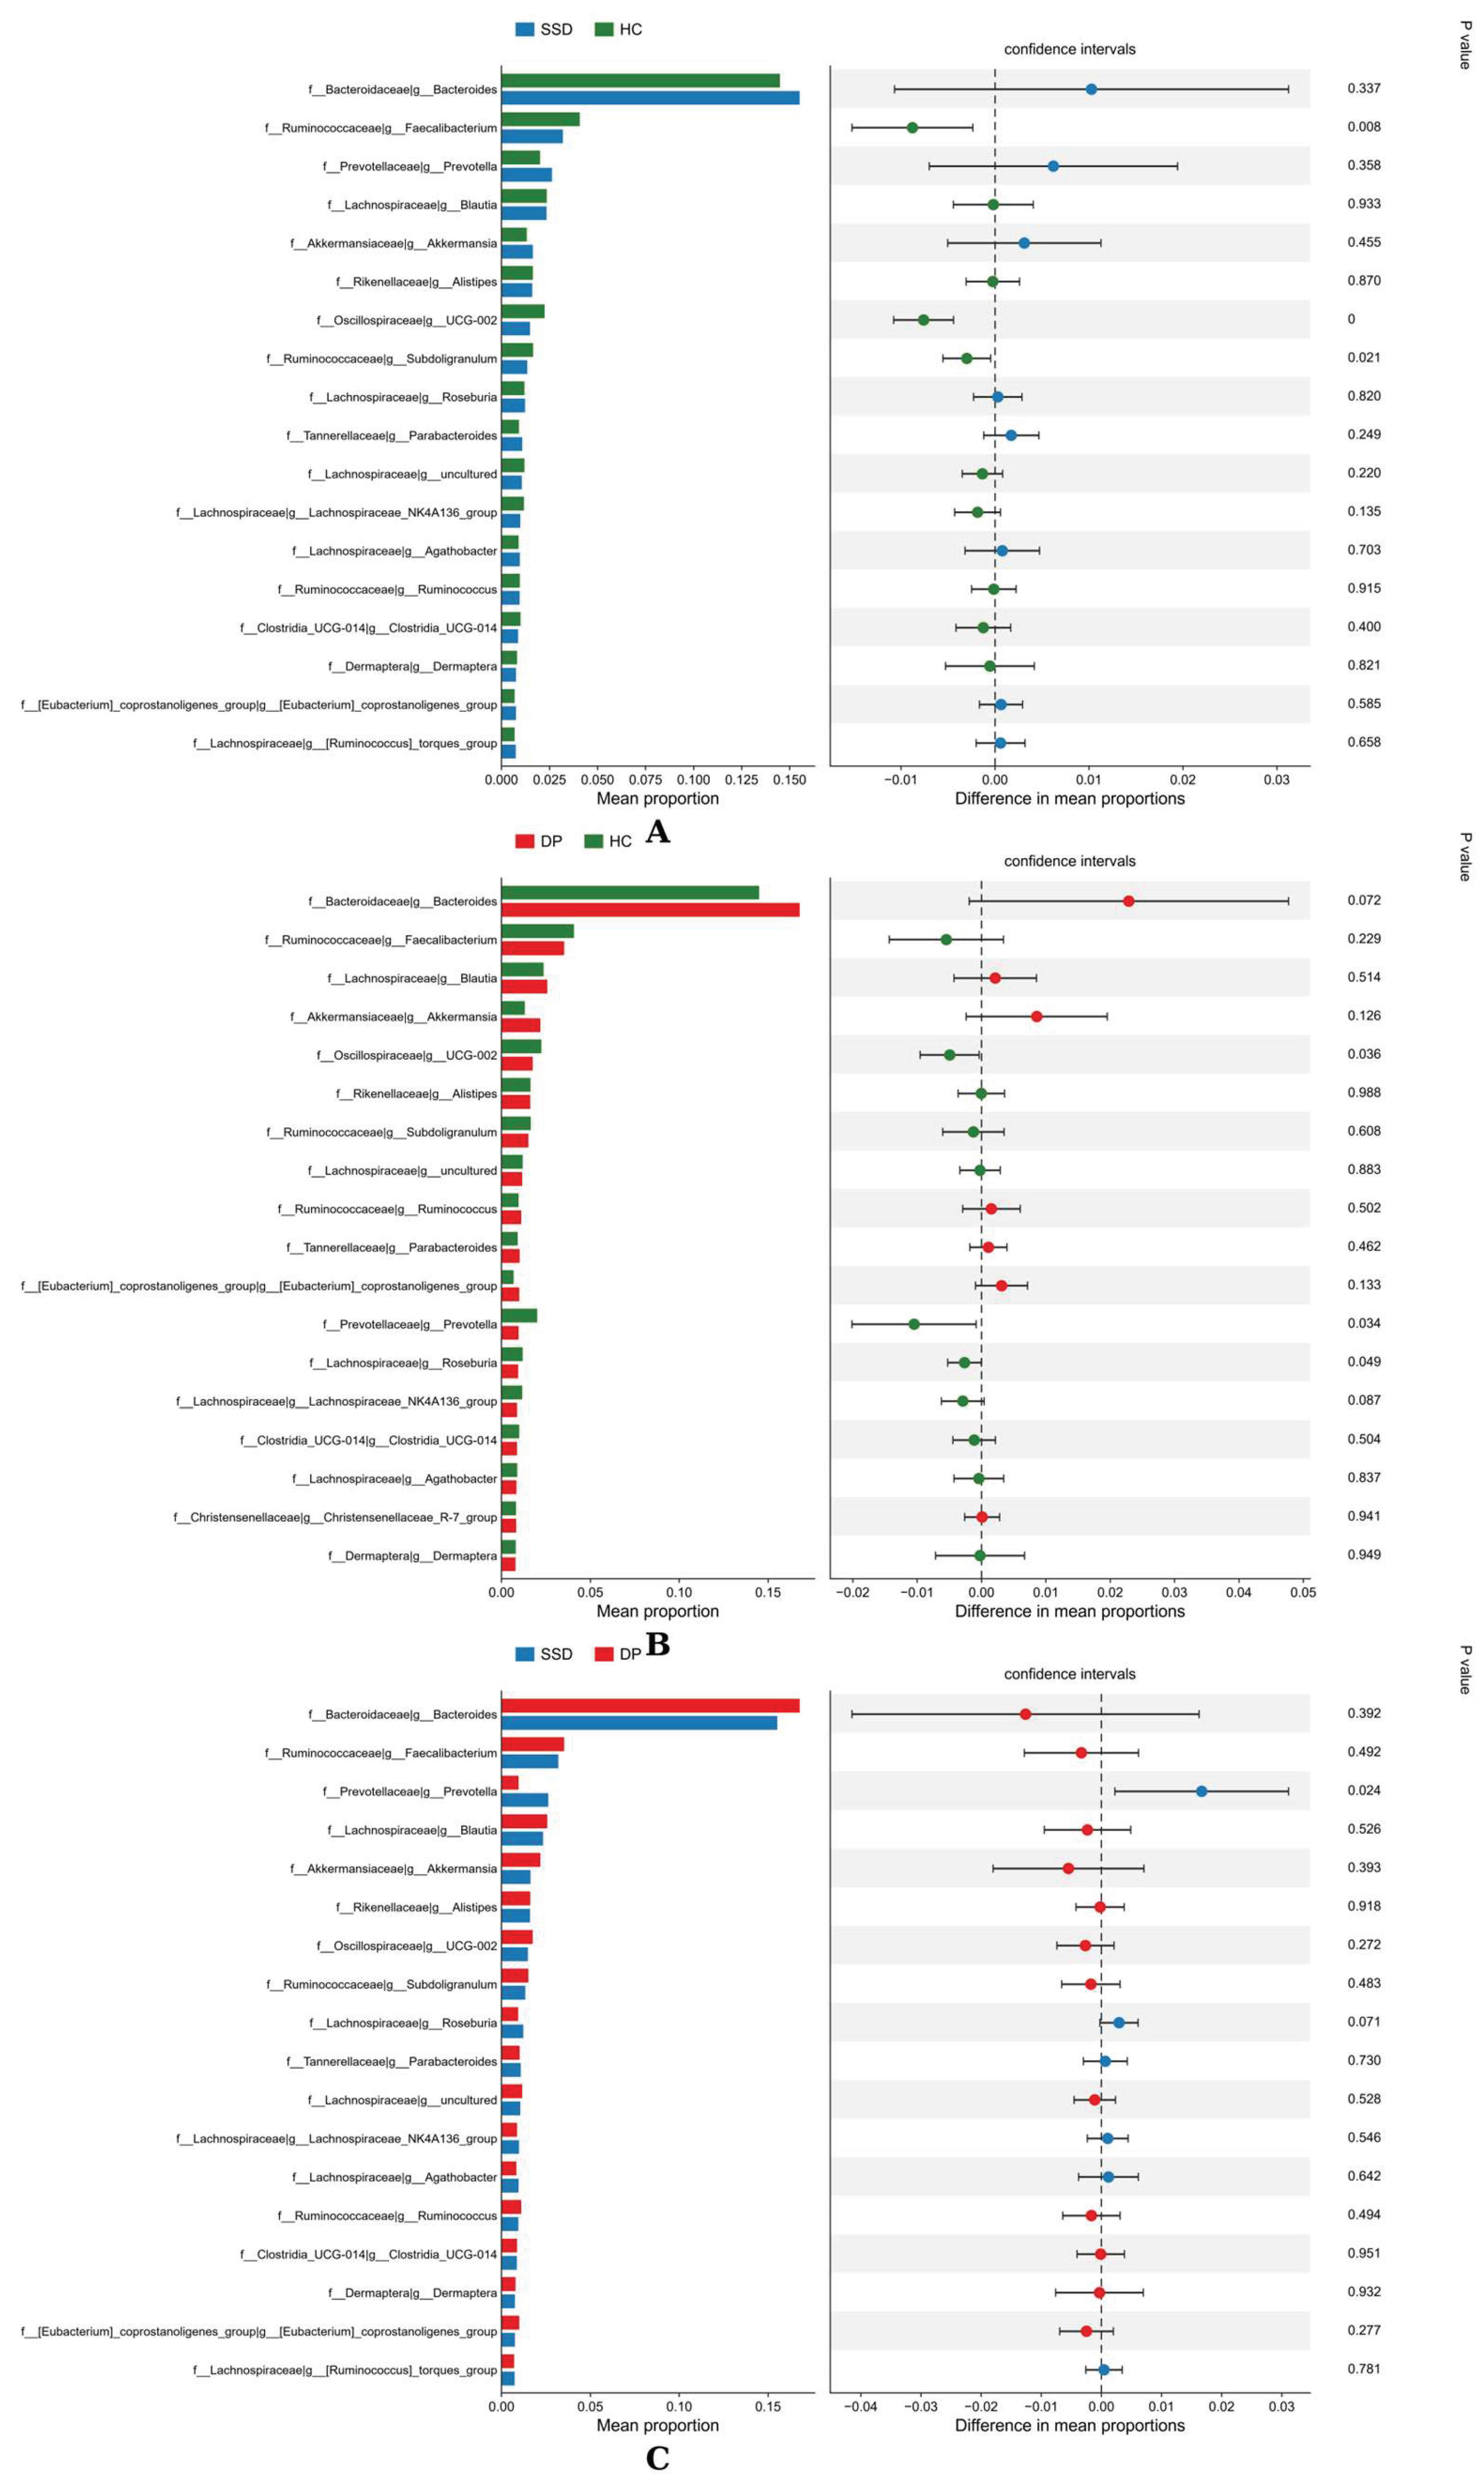
Figure 4.
Standard LEfSe taxon-level discriminant analysis. Panel A shows linear discriminant analysis (LDA) effect sizes for all taxa passing the standard LEfSe criterion (raw Kruskal-Wallis p < 0.05, pairwise Wilcoxon p < 0.05, and LDA effect size >= 2.0) across taxonomic ranks. Bars are grouped by the group with higher mean relative abundance. Panel B shows the corresponding radial cladogram, in which branches and outer fans mark discriminating taxa. The analysis used the scale-up set (n = 1,307), and all significant taxon-contrast pairs are listed in Table S15.
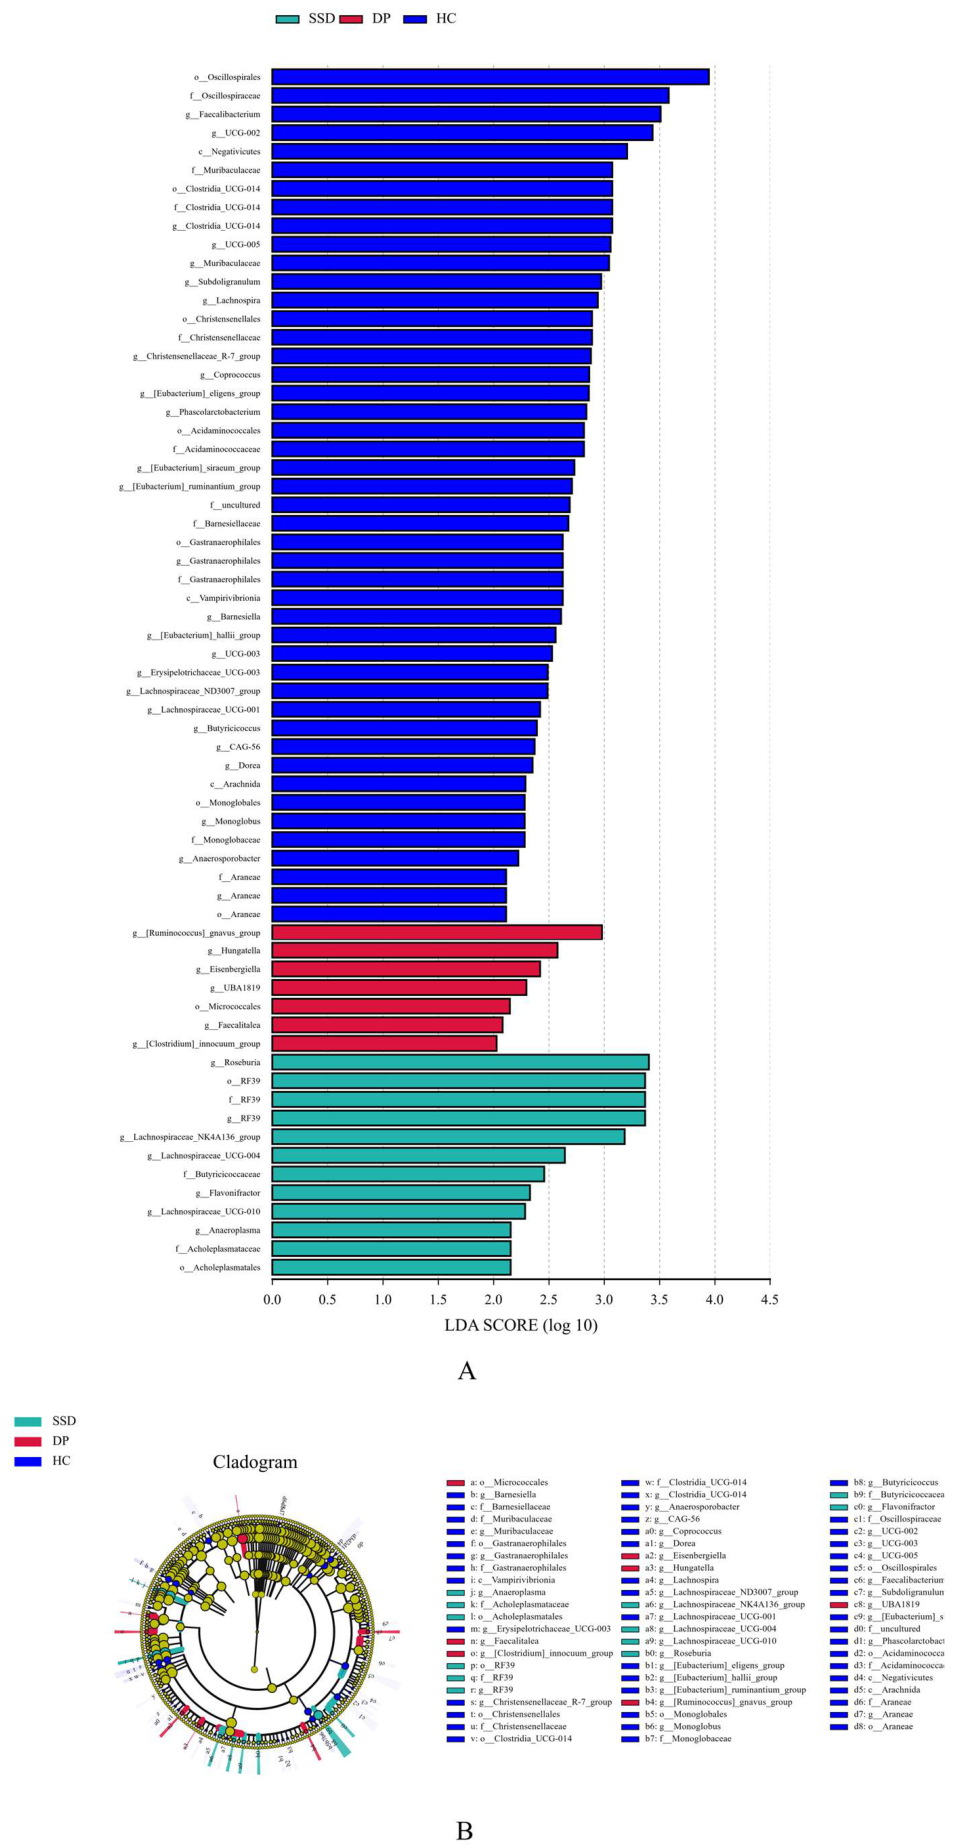
Figure 5.
Machine-learning discrimination. Panels A-C show receiver-operating-characteristic curves for constipation versus healthy control (CP vs HC), depression versus healthy control (DP vs HC), and short sleep versus healthy control (SSD vs HC), comparing a microbiota-only model (blue) with a model combining microbiota and other attributes (orange). Constipation was defined by a positive constipation field among participants without depression, and controls were healthy participants without constipation, depression, or short sleep. Panel D shows the leading genus coefficients of the depression model, and panel E shows the mean relative abundance of the corresponding genera across the healthy-control, short-sleep, and depression groups. The reference-style layout follows Li et al. (2026), while all plotted values are from the present analysis.
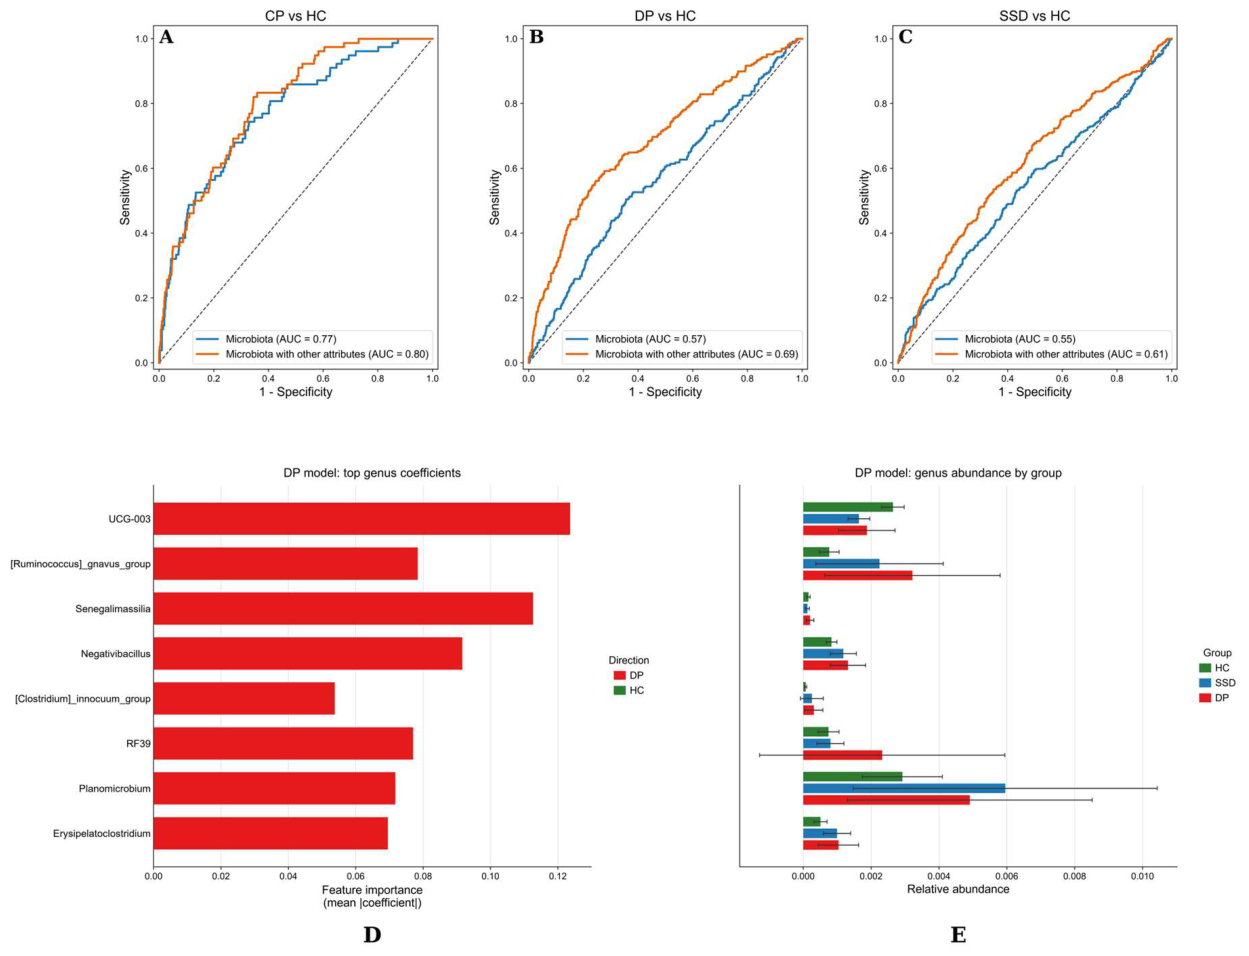
Figure 6.
Shared and condition-associated taxa. Panel A shows the number of differentially abundant genera classified as shared enriched, shared depleted, short-sleep-only specific, depression-only specific, or opposite-direction (FDR q < 0.05 and |log2 fold change| >= 0.5). Panel B shows the adjusted log2 centered-log-ratio effect of each classified genus across the short-sleep-only, depression-only, and exploratory comorbid contrasts.
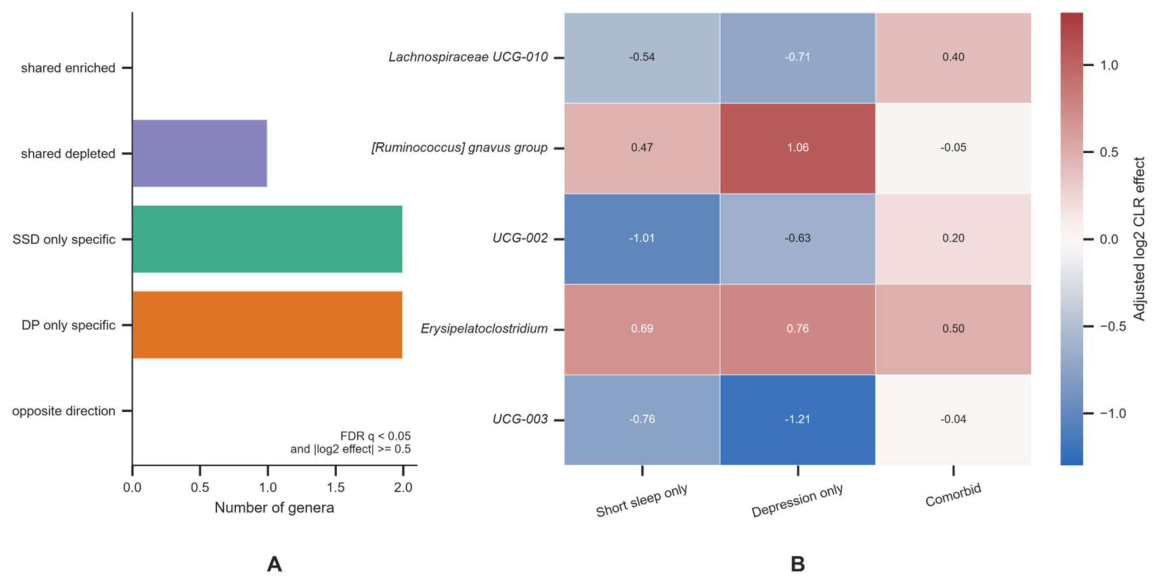
Figure 7.
Model comparison under nested cross-validation. Panels A and B show receiver-operating-characteristic curves for short sleep versus healthy control (SSD vs HC) and depression versus healthy control (DP vs HC) for the core clinical, core clinical plus microbiota, extended clinical, and extended clinical plus microbiota feature sets. Panel C shows the corresponding cross-validated areas under the curve with 95% bootstrap confidence intervals. Penalty type, regularization strength, class weighting, imputation, one-hot encoding, and scaling were confined to the training folds of a repeated stratified five-fold split with five repeats and a three-fold inner loop.
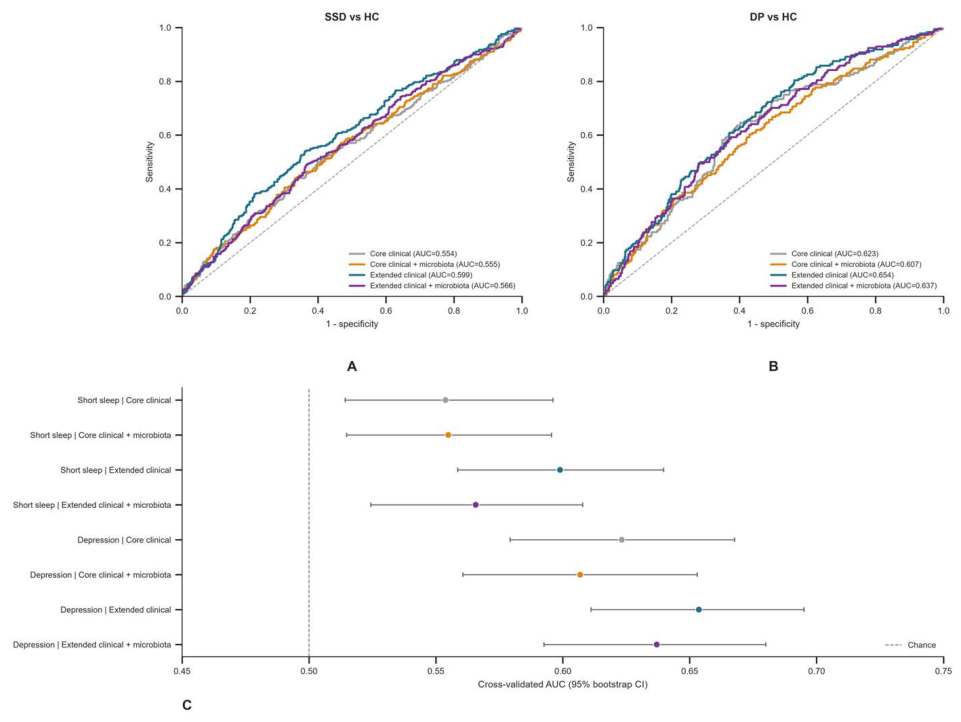
Figure 8.
Sensitivity analyses. Cross-validated discrimination of the extended clinical model under strict single-condition definitions (short-sleep-only or depression-only), strict controls (no antibiotic use in the prior year and BMI 18.5-35.0 kg/m2), and restriction to the overlap of case and control BMI ranges. Points show cross-validated areas under the curve with 95% bootstrap confidence intervals; the primary analysis estimate is shown for comparison.
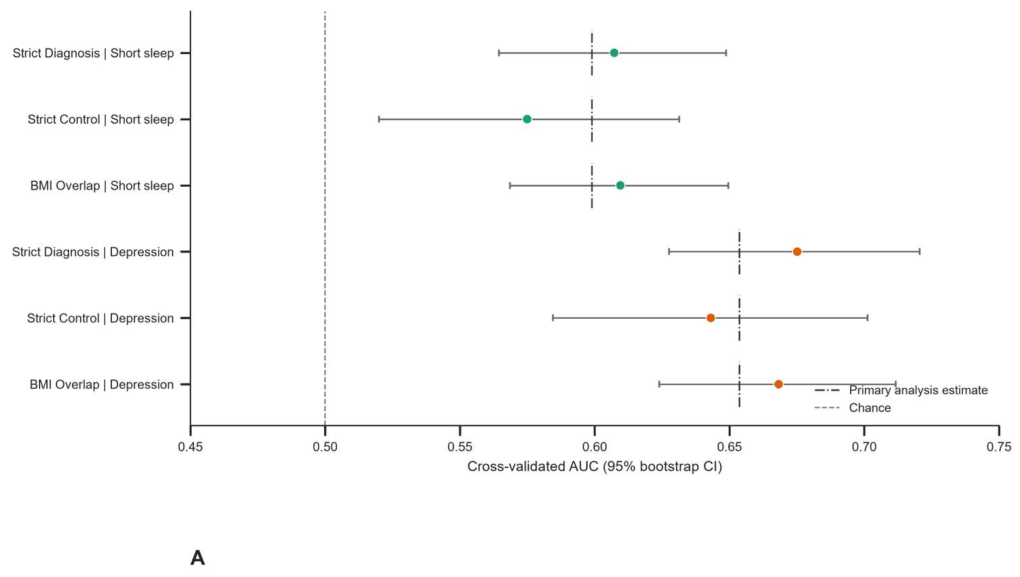
Figure 9.
Scale-upgraded sensitivity and statistical design. The fully eligible analysis set (n = 1,307) was evaluated across 20 multiply imputed data sets. Panels show covariate-adjusted depression and short-sleep differential abundance (A, B), genera confirmed in the same direction by both OLS and limma (C), factorial short-sleep-by-depression interaction estimates (D), covariate-adjusted PERMANOVA group effects across distance metrics and imputations (E), calibration (F), logistic-model discrimination with 95% confidence intervals (G), and decision-curve net benefit for depression (H). The expanded analysis is a sensitivity and scale-up analysis; the frozen complete-case primary analysis remains reported in Figure 1, Figure 2, Figure 3, Figure 4, Figure 5, Figure 6, Figure 7 and Figure 8.
Disclaimer/Publisher’s Note: The statements, opinions and data contained in all publications are solely those of the individual author(s) and contributor(s) and not of MDPI and/or the editor(s). MDPI and/or the editor(s) disclaim responsibility for any injury to people or property resulting from any ideas, methods, instructions or products referred to in the content. |
© 2026 by the authors. Licensee MDPI, Basel, Switzerland. This article is an open access article distributed under the terms and conditions of the Creative Commons Attribution (CC BY) license.
Copyright: This open access article is published under a Creative Commons CC BY 4.0 license, which permit the free download, distribution, and reuse, provided that the author and preprint are cited in any reuse.