

Submitted:
01 October 2026
Posted:
02 October 2026
You are already at the latest version
Abstract
Background/Objectives: Parkinson’s disease (PD) is a rapidly growing cause of neurological disability, yet diagnosis is often delayed in settings with limited access to movement-disorder specialists, including Kazakhstan and other Central Asian countries. This study aimed to develop a brief, self-administered, two-stage machine-learning-derived questionnaire based on binary symptom responses to identify individuals with possible clinically manifest PD who may benefit from specialist neurological assessment, and to evaluate its performance. Methods: From outpatient records of 402 patients with confirmed PD, a preliminary 100-item yes/no questionnaire was compiled. In a development cohort of 389 participants aged 60 to 90 years (146 with PD, 243 controls) recruited in Almaty, Kazakhstan, we used ElasticNet logistic regression, random forest, and gradient boosting to select features, reducing the instrument to 35 items (15 in Stage 1, 20 in Stage 2). We assessed performance on a held-out test set (n=78) and in an interim prospective external-validation cohort (n=290) recruited independently, with neurologists blinded to questionnaire results. Results: On the held-out test set, sensitivity was 86.2%, specificity 89.8%, accuracy 88.5%, and Stage 1 AUC 0.9557. In the interim external validation, sensitivity was 95.1%, specificity 94.4%, accuracy 94.5%, NPV 99.2%, and Stage 1 AUC 0.9962; only 12.1% of participants required Stage 2. Conclusion: The two-stage questionnaire showed strong case-finding ability in identifying individuals who warrant neurological evaluation. Findings are interim; completion of external validation, larger geographically diverse cohorts, and comparison against existing instruments are needed before wider implementation.
Keywords:
Parkinson’s disease
; PD case finding
; two-stage questionnaire
; binary symptom items
; machine learning
; Kazakhstan
1. Introduction
Parkinson’s disease (PD) is a progressive neurodegenerative disorder and represents one of the fastest-growing neurological causes of disability worldwide. The prevalence and societal burden of PD are projected to increase substantially as populations age [1,2,3]. Although diagnosis remains primarily clinical, recognition is often delayed, particularly during early stages when symptoms are mild, heterogeneous, or misattributed to aging or other common conditions [4,5,6]. Earlier recognition of clinically manifest PD can facilitate timely neurological assessment, initiation of appropriate symptomatic treatment, multidisciplinary management, patient education, and planning of supportive care [7,8].
Diagnostic delay is a significant challenge in setting with limited access to movement-disorder specialists and advanced diagnostic technologies. In Kazakhstan and other Central Asian countries, data on PD epidemiology and clinical pathway remain limited. Regional evidence indicates substantial gaps in PD recognition and registration, with the interval between symptom onset and diagnosis often extending over several years [9,10]. The limited availability of specialized neurological assessment and the concentration of expert services in major urban centers further contribute to delayed recognition. These challenges underscore the need for simple and accessible approaches to identify individuals with symptoms suggestive of PD and to prioritize those who may benefit from specialist neurological evaluation.
Multiple strategies have been explored to improve the identification of individuals with PD or those at increased risk of developing the disease. Biomarkers based on α-synuclein, genetic susceptibility, neuroimaging, and other biological measures have demonstrated considerable promise [11,12,13,14]. Genetic methods are increasingly important for identifying people at elevated risk of PD, particularly before typical motor symptoms appear. However, genetic testing currently supports risk stratification and etiological classification rather than independently confirming sporadic PD [15,16]. Advanced imaging techniques, such as dopaminergic imaging, structural and diffusion magnetic resonance imaging, and other quantitative methods, may provide additional diagnostic information in selected clinical context [17,18,19]. Digital technologies and wearable sensors have enabled objective assessment of motor and non-motor manifestations [20,21]. However, these approaches often require specialized equipment, trained personnel, laboratory infrastructure, or significant financial resources, limiting their applicability to large-scale community-based case finding [22,23].
Questionnaire-based approaches offer a potentially inexpensive and scalable alternative. Several instruments have been developed to identify parkinsonian symptoms or specific symptom domains. The Tanner Parkinson’s Disease Screening Questionnaire is a brief tool focusing primarily on motor manifestation [24]. Other questionnaires, such as the Parkinson’s Disease Screening Questionnaire (PDSQ), incorporate a broader range of symptoms but have demonstrated variable performance across study populations and clinical settings [25]. The Non-Motor Symptoms Questionnaire and related instruments are effective for identifying non-motor manifestations but were not designed as stand-alone tools to establish or screen for PD [26]. These findings suggest that questionnaire performance depends substantially on the target population, symptom spectrum, disease stage, and clinical context.
Researchers have also developed more complex risk-prediction approaches. For instance, the PREDICT-PD program has demonstrated the feasibility of combining multiple demographics, motor, non-motor, olfactory, genetic, and other risk indicators to estimate an individual’s probability of developing PD [27,28]. These methods provide valuable information regarding PD risk and facilitate the prospective identification of individuals who may subsequently develop the disease. However, they differ methodologically and operationally from brief questionnaires designed for pragmatic case findings and referral in routine community or primary-care settings.
Machine-learning methods offer an additional approach to analyzing combinations of clinical features that may be difficult to capture with prespecified symptom scores. By evaluating multiple variables simultaneously, machine-learning techniques can select and weight features associated with clinical outcomes dataset [29,30]. Previous studies have applied machine learning to PD-related data, including clinical assessments, digital biomarkers, neuroimaging, genetic information, and multimodal datasets.
There is a lack of diversity in research on complex disease. Limited information exists regarding the manifestation of Parkinson’s disease across ethnic groups, including potential differences, in case ascertainment, medication response, and risk determinants [31].
Developing clinically useful screening tools requires careful considerations of the intended target population. A questionnaire designed for population-level risk prediction or identification of prodromal PD is conceptually distinct from an instrument intended to identify individuals with possible clinically manifest PD who may benefit from specialist assessment. Similarly, a screening or case-finding instrument should not be interpreted as a diagnostic test. Its primary clinical role is to identify individuals who warrant further neurological evaluation.
Few studies have focused on developing a brief, self-administered, binary-response questionnaire using machine-learning-based feature selection specifically to identify individuals who may require neurological evaluation for possible clinically manifest PD. Moreover, independent prospective validation is essential before such instruments can be considered for broader implementation.
This study was motivated by need for an accessible case-finding approach in settings characterized by diagnostic delay, limited access to specialized diagnostic resources, and potential underrepresentation of local populations in the development of existing PD screening instruments. The objective was to develop a two-stage, machine-learning-derived questionnaire based on binary symptoms responses to identify individuals with possible clinically manifested PD who may benefit from specialist neurological assessment. We evaluated the questionnaire’s performance in a held-out development dataset and in an interim prospective external validation cohort recruited in Almaty, Kazakhstan. The questionnaire is intended as a screening and referral tool, not for establishing a diagnosis of PD. Larger prospective studies involving geographically diverse populations and a greater proportion of previously unrecognized and early-stage cases will be necessary to determine its performance in broader screening settings.
2. Materials and Methods
2.1. Study Design, Participants and Data Collection
The study included several stages. Figure 1 shows all stages schematically. The overall study was conducted in Almaty, Kazakhstan, between October 2024 and July 2026. Participants were recruited from movement disorders specialists, city clinics, and centers of active longevity (non-medical social-service facilities for older adults).
The first stage involved a retrospective analysis of the medical records of 402 patients with a confirmed diagnosis of Parkinson’s disease who had consulted with movement disorder specialists. We collected all complaints and symptoms and compiled a questionnaire based on this data. The second stage, conducted from October 2024 to January 2026, involved interviewing two groups of participants aged 60 to 90 years. We chose this age group because both the incidence of new cases and the overall incidence of the disease are higher in this group than in younger populations [32,33].
Group 1 is a new cohort of patients who presented to movement disorder specialists and were diagnosed with Parkinson’s disease according to MDS criteria [34]. Group 2 (control) consisted of individuals of the same age group, but who had not previously been diagnosed with Parkinson’s disease, with no identified psychiatric or neurological diseases. We recruited participants until the number reached a plateau, as estimated by three learning curves (ElasticNet regularization, Random Forest, and Gradient Boosting) (Figure 2). Thus, the development cohort included 389 participants: 146 patients diagnosed with Parkinson’s disease and 243 participants without a previous diagnosis of Parkinson’s disease.
Next, we analyzed all answers using machine learning. We divided the development dataset into training and held-out test subsets using an 80:20 stratified split that preserved the proportion of PD cases and controls. The internal test set included 78 participants: 29 with PD and 49 controls. The feature-selection procedure applied a greedy diversity filter that excluded features with an absolute Spearman correlation greater than 0.75 with already selected items. The 15 items with the highest final meta-importance after filtering were assigned to Stage 1, and the next 20 items were assigned to Stage 2. The interim prospective external validation stage was conducted from March to July 2026.
This interim prospective validation cohort includes 290 participants, 41 with PD and 249 who were not previously diagnosed with PD. None of the participants in this stage contributed to the development phase. None of the participants recruited from city clinics had previously been diagnosed with Parkinson’s disease. As in the development cohort, participants with previously diagnosed neurological and psychiatric disorders were excluded from the control group. Participants completed the finalized questionnaire and then underwent a comprehensive neurological assessment by board-certified neurologists blinded to the questionnaire results. All participants completed the finalized questionnaire and underwent an independent neurological reference assessment. The reference diagnosis was recorded as “PD confirmed” or “PD not detected” according to the MDS Clinical Diagnostic Criteria [34].
2.2. A retrospective Analysis of Outpatient Records
Outpatient records of patients diagnosed with PD at the Smagul Kaishibayev Institute of Neurology and Neurorehabilitation (Center#1) and the Alta Neuro Center for Practical Neurology (Center#2) that came to the clinics between 1.01.2023 and 31.07.2024 were analyzed. Over this period, we analyzed medical records of 402 patients, excluding repeat visits (262 at Center#1, 140 at Center#2) with confirmed PD according to the 2015 MDS Parkinson’s disease diagnostic criteria. We analyzed outpatient records to compile a list of all complaints, symptoms, and daily activities reported by patients with PD. We used the 402 retrospective records exclusively for item generation and did not include them as observations in the machine-learning development or validation datasets. Two independent neurologists checked the records and paraphrased them; they resolved all differences by consensus. Compiling the list of questions did not involve mathematical analysis. We collected all complaints and symptoms regardless of frequency, then removed duplicates. The full list of complaints and symptoms was paraphrased into patient-friendly questions, comprising 100 questions (Appendix A), to which respondents could answer “yes” or “no”. This initial set of 100 questions written both in Russian and Kazakh, so patient can choose the preferred language.
2.3. Participants and Data Collection
For the development phase, inclusion criteria were age 60-90 years, confirmed PD for cases, and no PD diagnosis for controls. Exclusion criteria were clinically assessed dementia, other known psychiatric disorders that could interfere with questionnaire completion. Two neurologists specializing in movement disorders and were experienced in PD diagnosis (Center#1) independently confirmed all PD cases according to MDS criteria [34]. We recruited the control group from active longevity centers in Almaty. First, all participants were asked whether they had ever been diagnosed with Parkinson’s disease, while the remaining 100 questions concerned their well-being and daily activities. Patients answered “yes” or “no” to all questions (Appendix A). The development cohort comprised 389 participants, including 146 participants with confirmed PD and 243 controls. PD cases represent a new group of patients not previously included in the medical records analyzed to formulate the questions. This number, according to 3 different machine learning algorithms, was sufficient for this stage. Participants could answer the questions in two formats (depending on their preference): paper or electronic (via a Google Form). Because the final questionnaire was intended to be self-administered, no assistance was provided while answering the questions. Patients were not subject to time limits but were asked to answer all questions without skipping any.
Following the machine learning phase on this cohort, which initially included 100 questions, we developed a two-stage questionnaire comprising 15 questions in step 1 and 20 in step 2. This questionnaire was validated in a new group of 290 participants: 41 confirmed PD cases from Center#1 and 249 controls who were not previously diagnosed with PD, from 3 city clinics. First, they asked all 35 questions. Then all participants in this cohort were independently examined by 2 neurologists who specialized in movement disorders and were experienced in PD diagnosis (Center#2) according to MDS criteria [34]. The examining neurologists were blinded to the questionnaire results.
2.4. Machine Learning Analysis
We analyzed all responses using machine learning. We treated the 100 questionnaire items as binary predictor variables. The response database is divided into two sets: a training set and a test set, with an 80/20 split. Feature selection was performed using three algorithms: logistic regression with ElasticNet regularization [35], Random Forest [36], and Gradient Boosting [37]. For each algorithm, feature importance values were averaged across five cross-validation folds and normalized them, so importance values summed to one for that algorithm. We calculated the combined meta-importance of each item as the weighted average of its algorithm-specific importance values, using the algorithm-level AUC weights.
meta(j) = Σ α_m × Î_m(j)
The feature-selection procedure applied a greedy diversity filter that excluded features with an absolute Spearman correlation greater than 0.75 with already selected items. The 15 items with the highest final meta-importance after filtering were assigned to Stage 1, and the next 20 items were assigned to Stage 2 (Appendix B). The first-line screen of 15 items resolves most respondents; a further block of 20 items is administered only to those whose first-stage score falls in an intermediate band. We also evaluated the continuous Stage 1 score using receiver operating characteristic analysis. The reported Stage 1 thresholds were 22.70 points for the lower threshold and 84.00 points for the upper threshold. A final Stage 2 threshold of 20.26 points was reported. Participants with a Stage 1 score below 22.70 were classified as low risk and did not proceed to Stage 2. Scores from 22.70 to 84.00 were classified as intermediate risk and triggered Stage 2. Scores at or above 84.00 at Stage 1, or at or above 20.26 at Stage 2, resulted in referral for neurological verification.
2.5. Validation
Internal validation was performed on the held-out development test set containing 78 participants, that is 20% from development cohort. Case-finding performance was assessed using accuracy, sensitivity, specificity, positive predictive value, negative predictive value, F1-score, and AUC [38]. Bootstrap confidence intervals were calculated using 3,000 repeated resamples of the test set with replacement.
The interim external validation used a final cascade 15/20 questionnaire set on prospectively recruited independent cohort. This set was performed before the reference neurological assessment, and the assessing neurologists were blinded to questionnaire results. The reference diagnosis was based on comprehensive neurological examination by a board-certified neurologist and the MDS Clinical Diagnostic Criteria [34]. The neurologists were independent of the questionnaire-based screening verdict. The screening output was dichotomized as “refer to a neurologist” versus “PD not detected.”
The external-validation program remains ongoing; therefore, the results reported in this manuscript are interim findings from the available validation cohort rather than final validation results [39].
2.6. Statistical Analysis
For the development analysis, discrimination was assessed using the AUC, and case-finding performance was evaluated at the prespecified two-stage screening thresholds. All analyses were performed in Python 3.13.3 using scikit-learn 1.7.1, NumPy 2.2.6, Pandas 2.3.1 and SciPy 1.16.1 on macOS 15.3.1 (arm64). Sensitivity, specificity, positive and negative predictive values (PPV, NPV) and overall accuracy were computed with 95% confidence intervals by the Wilson method, which is preferred for small samples and proportions near the boundary. Point estimates and bootstrap 95% confidence intervals were reported for the held-out development test set. A sample-size calculation was also reported using the standard proportion formula:
where p represented expected sensitivity and d represented the half-width of the 95% confidence interval.
For an expected sensitivity of 90% with a confidence-interval half-width of ±10%, the reported requirement was 35 confirmed PD cases and 266 total participants at a prevalence of 13.2% [40,41]. Model convergence was assessed by a learning curve tracking cross-validated AUC as a function of training-set size.
2.7. Ethical Considerations
The Local Ethics Committee of the Kazakhstan-Russian Medical University approved the study protocol under Approval Number 26 dated September 17, 2024. All participants provided written informed consent before enrollment. The study was conducted in accordance with the Declaration of Helsinki and applicable national regulations [42]. Participants were informed of their right to withdraw at any time without penalty.
3. Results
3.1. Development Stage Study Population
We administered a 100-question questionnaire, based on an analysis of outpatient records from patients with PD, in which patients answered “yes” or “no” (Appendix A). When developing the questions, we did not consider data from outpatient records, such as age of symptom onset, Hoehn and Yahr stage, or medications taken. We relied solely on complaints and visible signs. The questions were written in two languages, Kazakh and Russian This was done to ensure patient comfort, as most people in Kazakhstan speak both languages fluently, but preferences may exist. Two physicians from the Institute of Neurology prepared an initial list of questions in Russian, as patients’ outpatient records were maintained in Russian. We then translated this list of questions into Kazakh, using a certified translator. Before the survey, participants were pre-tested for cognitive understanding of the questions: five patients with Parkinson’s disease in Kazakh, five patients with PD in Russian, five older people without PD in Kazakh, and five in Russian.
The development cohort included 389 participants: 146 with confirmed PD and 243 controls. All 389 participants completed the questionnaire and were included in the model-development analysis in an 80/20 ratio: 80% (311 participants) in the training group and 20% (78 participants) in the test group. The test group included 29 patients with PD and 49 controls.
To assess whether increasing the training sample size improved model discrimination, we constructed learning curves using progressively larger training subsets (50, 80, 120, 160, 200, 250, and 311 participants). For each subset size, we calculated the mean AUC across the three machine-learning models (EN-LR – logistic regression; RF – random forest; GB – gradient boosting) and the corresponding standard deviation across cross-validation folds using five-fold cross-validation with three repetitions. Mean AUC increased from 0.9503 at a sample size of 50 to 0.9774 at 200 participants and remained stable thereafter (0.9741 at 250 and 0.9775 at 311 participants). At the same time, the variability of the estimates decreased substantially, with the SD (Spread) declining from 0.0605 to 0.0088. These findings suggest that model discrimination had approached a plateau by approximately 200 participants. At the same time, further increases in sample size primarily improved the stability of the performance estimates rather than producing a substantial increase in AUC. Table 1 and Figure 2 present the corresponding AUC values and standard deviations across cross-validation folds.
The demographic characteristics of the development cohort, including age and sex distribution, are presented in Table 2.
3.2. Development of the Questionnaire
The preliminary set contained 100 binary items covering motor, autonomic, sleep-related, sensory, cognitive, psychiatric, gastrointestinal, urinary, sexual, and other non-motor features (Appendix A).
Three learners were trained under five-fold stratified cross-validation on the training partition:
- EN-LR: logistic regression with elastic-net penalty (ℓ1 ratio = 0.2, C = 1.0, saga solver, max iter= 5000), preceded by standardisation;
- RF: random forest, 400 trees, balanced subsample class weighting;
- GB: gradient boosting (scikit-learn implementation, default hyperparameters).
These were chosen for complementary inductive biases: a sparse linear model, a variance-reducing bagging ensemble, and a bias-reducing boosting ensemble. Item importance was taken as |βj| for EN-LR and as mean impurity decrease for RF and GB.
The feature-selection process identified 35 final items (Figure 3). After item selection, we normalized the weights of the selected questions independently within each stage, so their sum equaled one. In Stage 1, normalization resulted in one item receiving a disproportionately high weight, which could drive the screening score primarily by a single symptom. Therefore, we applied a square-root transformation (α = 0.5), followed by re-normalization, to smooth the weight distribution. This approach reduced the dominance of the highest-weighted item while preserving the relative importance of all selected questions and providing a more balanced contribution of multiple clinical features to the final screening score.
Questions are sorted by descending meta-weight and selected greedily. Still, with a duplication limit: a candidate is discarded if it is too similar to an already taken question (Spearman’s |ρ | > 0.75 on responses). If two questions almost always receive the same answers, the second adds no information; instead, we take the next strongest, dependent one. Thus, the two questions ranked third and fourth by frequency of positive responses, despite their high frequency, were assigned to Set 2. As a result, we formed two sets of questions: Set 1 (15 questions) and Set 2 (20 questions). Stage 2 is scored based only on 20 questions. Appendix B shows the selected items and their algorithm-specific normalized importance values, simple average, AUC-weighted combined meta-importance, and stage assignment.
Because the initial weights were excessively concentrated in Q6, Stage 1 weights were smoothed using a square-root transformation (α = 0.5) before renormalization, reducing the contribution of Q6 from 39.9% to 18.3% and producing a more balanced multidimensional score. The stage-specific model weights, expressed as percentages, were as follows: Stage 1 included Q6 at 18.31%, Q23 at 8.94%, Q40 at 8.33%, Q15 at 7.80%, Q44 at 6.36%, Q49 at 5.69%, Q47 at 5.46%, Q38 at 5.23%, Q25 at 5.19%, Q51 at 5.16%, Q2 at 5.01%, Q68 at 4.91%, Q19 at 4.79%, Q14 at 4.45%, and Q4 at 4.37%. Stage 2 included Q9 at 19.80%, Q7 at 17.34%, Q42 at 4.48%, Q31 at 4.38%, Q62 at 4.28%, Q36 at 4.24%, Q72 at 3.87%, Q79 at 3.86%, and Q63 at 3.79% (Figure 4, Appendix C).
The final item consists of two stages of short yes/no questions.
- Stage 1: 15 questions. These are asked to everyone. Answers are scored from 0 to 100. If the score is low, the person is discharged; if it is very high, they are immediately referred to a neurologist; if the score is average (the so-called “gray zone”), they proceed to Stage 2.
- Stage 2: another 20 questions, only for the gray zone. These are used to calculate a second score from 0 to 100, and this is used to make the final decision: refer or discharge.
In simple terms, the questionnaire works like a two-layer filter. The first layer quickly filters out obvious cases in both directions, while the second layer carefully examines only “questionable” individuals. As a result, most people are asked only 15 questions instead of 100.
Technically, it’s a cascade classifier with a rejection option. The score for each stage is a weighted sum of binary responses:
Score = 100 × Σ wi xi , where xi ∈ {0,1} is the answer to question i, Σ wi = 1
Machine learning models determine the weights wi, and the decision thresholds are set on the training data. A “yes” answer to a symptom question contributes a score proportional to the question’s weight.
We set all three thresholds only during the training phase (311 people) and then froze them. The full rule:
- Stage 1 score < 22.70 – low risk, the person is not referred for neurological assessment;
- Stage 1 score ≥ 84.00 – very high risk, immediately referred to a neurologist;
- otherwise – gray zone: 20 Stage 2 questions are asked, and if the Stage 2 score ≥ 20.26, the person is referred; otherwise, they are not referred for neurological assessment.
For the first 15 questions, we use the lower threshold, T1_low = 22.70, to achieve maximum specificity while maintaining a sensitivity of at least 0.97. Simply put, we dismiss a patient permanently if their score is below this threshold, so the requirement is the most stringent – not more than 3 out of 100 patients can be dismissed. In the training phase, this threshold yields 97.4% sensitivity and 90.7% specificity.
The upper threshold, T1_high = 84.00, was chosen as the maximum PPV with a PPV ≥ 0.70: only those whose positive decision is almost certainly confirmed can be “bypassed” from the second stage. In the training phase, above the threshold, the PPV is 100.0% with a specificity of 100.0% (Figure 5).
For interpretability, the stage 1 score is additionally converted into a PD probability using Platt calibration (a single-feature logistic regression trained on out-of-fold predictions from the training part) (Figure 6):
P(PD) = 1 / (1 + e^−(a·S + b)) , a = 0,1216, b = -4,3609
Ninety-four participants fell into the gray zone during the training portion, including 76 patients (80.9%). This group of participants was assessed on 20 questions in Set 2. The T2 threshold of 20.26 was chosen based on the criterion: maximum specificity with a sensitivity in the gray zone of at least 0.90 (criterion justification – Section 5). During training, this yields a sensitivity of 93.4% in the gray zone with a specificity of 11.1%. Low specificity is expected here – four out of five patients are in the gray zone, and the cost of missing a question is highest (Figure 7).
3.3. Internal Validation
The held-out development test set included 78 participants: 29 with PD and 49 controls.
The screening algorithm correctly classified 44 controls as not requiring referral (TN – true negative) and correctly flagged 25 participants with PD for referral (TP – true positive). There were 5 false-positive referrals (FP) and 4 false-negative (FN) results (Table 3). Table 4 presents the corresponding confusion matrix, and Table 5 summarizes the corresponding performance measures.
That is, of 29 patients, the questionnaire identified 25, and of 49 controls, it flagged 5 in vain. We then performed two additional checks: stability on 20 splits and an independent cohort.
A single random data split can be either successful or unsuccessful. Therefore, the entire pipeline, from question selection to thresholds, is repeated 20 times with different random 80/20 splits; each split yields its own full questionnaire and its own metrics on its deferred portion (Table 5).
The average of 20 splits is a more reliable estimate than a single run: sensitivity 87.1%, specificity 90.0%, AUC 0.9711. The result of one split from section 6.1 lies within this corridor, i.e., it is not an outlier (Figure 8).
3.3. Interim Prospective Validation
After the machine learning phase, which initially included 100 questions, we developed a two-stage questionnaire with 15 questions in step 1 and 20 in step 2. This questionnaire was validated in a new cohort of 290 participants, including 41 confirmed Parkinson’s disease (PD) cases from Center#1 and 249 controls without prior PD diagnosis from three city clinics. All 35 questions were administered to the participants. Subsequently, each participant was two neurologists specializing in movement disorders and experienced in PD diagnosis independently examined all participants in this cohort (Center#2), following MDS criteria [34]. The neurologists conducting the examinations were blinded to the questionnaire results.

Table 6.
Demographic characteristics of participants in the interim prospective external validation cohort.
Table 6.
Demographic characteristics of participants in the interim prospective external validation cohort.
| Characteristic | Parkinson’s disease (n = 41) | Control (n = 249) | Total (n = 290) |
| Age, years, mean (SD) | 66.24 (6.20) | 68.51 (5.84) | 68.19 (5.93) |
| Female, n (%) | 25 (60.97%) | 175 (70.28%) | 200 (68.97%) |
| Male, n (%) | 16 (39.02%) | 74 (29.72%) | 90 (31.03%) |
The prevalence of confirmed PD in the available external-validation cohort was 14.1%. We included all 290 participants in the interim external-validation analysis. As the external-validation program remains ongoing, these findings should be interpreted as interim results.
All 290 participants provided complete responses to all 35 questions in the tool, including those who were not referred for neurological assessment or referred immediately during the first stage. This allows for recalculation of each individual’s score from their raw responses. We used the same thresholds previously determined for the training group.
In the external-validation cohort, the two-stage questionnaire correctly identified 39 of 41 participants with PD, missing two cases. Among 249 participants without detected PD, 14 were incorrectly referred for further neurological assessment. This resulted in a sensitivity of 95.1% and specificity of 94.4%. The positive predictive value (PPV) was 73.6%, the negative predictive value (NPV) was 99.2%, and overall accuracy was 94.5%. The discriminative performance of the Stage 1 score was excellent (AUC = 0.9962), while the Stage 2 score also demonstrated excellent discrimination (AUC = 0.9926). Table 7 presents the confusion matrix, and Table 8 summarizes the corresponding performance measures.
The two-stage design substantially reduced the screening burden. At Stage 1, 227 participants were not referred for further screening, with no participants with PD among them, whereas all 28 participants referred directly after Stage 1 were confirmed to have PD. Stage 2 was therefore required for only 35 participants (12.1%) of the external-validation cohort.
Because PPV and NPV depend on underlying disease prevalence, we also calculated expected predictive values across a range of hypothetical PD prevalence levels while holding the observed sensitivity (95.1%) and specificity (94.4%) constant. At the observed external-validation prevalence of 14.1%, the estimated PPV was 73.6%, and NPV was 99.2%. As expected, PPV decreased substantially as the assumed prevalence decreased, whereas NPV remained consistently high (Table 9).
These findings indicate that the questionnaire retains a very high NPV across a broad range of disease prevalence, supporting its potential utility as a screening tool. At lower prevalence levels, the PPV decreases, as expected for screening instruments applied to populations in which PD is relatively uncommon. Therefore, a positive screening result should be interpreted as an indication for further neurological assessment rather than as confirmation of PD.
4. Discussion
4.1. Principal Findings
This study developed and evaluated a two-stage machine-learning-based questionnaire for the early screening and risk stratification of Parkinson’s disease. Beginning with 100 binary items covering motor and some non-motor features, the feature-selection procedure identified 35 items for the final instrument. We assigned 15 items to Stage 1 and 20 additional items to Stage 2, preserving a sequential screening structure while reducing the number of questions presented to participants.
The questionnaire showed high discrimination and specificity in both the held-out development test set and the interim external-validation cohort, although sensitivity differed between the two evaluations. In the internal validation set, the accuracy was 88.5%, sensitivity was 86.2%, specificity was 89.8%, and the AUC was 0.956. In the available external-validation cohort, the interim sensitivity was 95.1%, specificity was 94.4%, accuracy was 94.5%, and the AUC for the continuous Stage 1 score was 0.9962.
These results indicate that the questionnaire can identify individuals who should undergo neurological assessment. Still, they should not be interpreted as evidence that the instrument establishes a diagnosis of Parkinson’s disease. The intended output is referral for neurological verification, with the definitive diagnosis based on comprehensive clinical assessment and established diagnostic criteria.
4.2. Interpretation and Clinical Relevance
A two-stage design may improve screening feasibility. Participants with low scores in the first stage do not proceed to the second stage. In contrast, those with average scores complete an additional 20 items, and those with high scores are referred for a neurological examination.
The selected characteristics also reflect the questionnaire’s multidomain nature. High-scoring items include tremor, decreased facial expression, slowed hygiene, decreased arm span, difficulty turning over in bed, handwriting impairment, postural changes, olfactory impairment, anxiety, and hypophonia. The second stage included additional items covering tremor characteristics, difficulty rising from a chair, swallowing, excessive daytime sleepiness, dressing, concentration and memory, presyncope symptoms, depressive mood, urinary disturbances, constipation, limb movements during sleep, and slowed handwriting. This distribution suggests that the final tool did not rely solely on overt motor symptoms. Instead, it retained a combination of motor and non-motor indicators identified through a machine-learning feature selection process, reflecting the clinical heterogeneity of Parkinson’s disease.
4.3. Relationship with Existing Screening Approaches
Previous Parkinson’s disease screening tools have evolved from primarily motor questionnaires to tools that incorporate non-motor symptoms and algorithmic risk assessment. The Tanner Parkinson’s Disease Screening Questionnaire was developed for brief motor screening. Meanwhile, the Parkinson’s Disease Screening Questionnaire, the Non-Motor Symptom Assessment Questionnaire, and the PREDICT-PD approach included a broader range of clinical characteristics and, in some cases, online or remote assessments.
The current questionnaire differs from these approaches by using data-driven feature selection and consistent administration. However, the study did not directly compare the tool with existing instruments, including the Tanner Parkinson’s Disease Screening Questionnaire, the Non-Motor Symptom Assessment Questionnaire, or other published tools. Therefore, the results demonstrate the feasibility and intermediate diagnostic efficacy of the developed tool but do not confirm its superiority over existing screening questionnaires. Further studies of the developed questionnaire in a larger sample, along with direct comparative studies with existing screening questionnaires, are needed to determine whether the machine learning-based approach offers advantages in discrimination, efficiency, or clinical applicability.
4.4. Internal and External Validation
Internal and interim prospective external-validation results showed strong case-finding performance, with both sensitivity and specificity higher in the external-validation cohort than in the held-out internal test set. Sensitivity increased from 86.2% in the internal evaluation to 95.1% in the interim external validation, while specificity increased from 89.8% to 94.4%, respectively. Interpret these differences cautiously, given differences in cohort composition and the ongoing nature of the external validation.
The external-validation results should nevertheless be regarded as interim rather than definitive. External validation remains ongoing, and the available cohort was recruited within a single geographic setting. The relatively small number of participants with confirmed PD limits the precision with which the external sensitivity estimate can be interpreted, despite the reported confidence interval.
4.5. Strengths and Limitations
Several methodological features strengthen the study. The questionnaire was developed from a broad preliminary item set, and feature selection integrated Logistic ElasticNet, Random Forest, and Gradient Boosting models [35,37]. We further screened the selected features for high inter-item correlation using a diversity filter. In addition, the external-validation assessment was prospective, was performed before the neurological reference assessment, and used neurologists who were blinded to the questionnaire results. The study also used an independent neurological reference diagnosis based on the Movement Disorder Society Clinical Diagnostic Criteria [34]. All participants completed the questionnaire, and no missing values were reported. We evaluated case-finding performance using multiple measures and calculated bootstrap confidence intervals for internal validation and, where available, for external-validation estimates.
The limitations define the current scope of applicability. The study was conducted exclusively in Almaty, Kazakhstan, and therefore its performance may not generalize to other regions, countries, or healthcare systems. Completing the validation program and evaluating larger cohorts are necessary to obtain more precise estimates of case-finding performance. The reported 290 participants are not the final validation sample. We did not stop at the current sample based on performance. We didn’t finalize a sample size because we need more participants to obtain more robust results. We did not directly compare the questionnaire with established screening instruments. Fourth, we evaluated only three machine-learning approaches; we did not assess XGBoost or LightGBM, and we did not perform a formal grid search or randomized hyperparameter optimization [37]. These methodological choices do not invalidate the reported findings, but they limit conclusions about comparative model performance.
Finally, the questionnaire should be used only for screening and risk stratification. A high-risk result requires confirmation by a neurologist using comprehensive clinical assessment and established diagnostic criteria. It should not be used as a stand-alone diagnostic test.
5. Conclusion
We developed a 35-item two-stage questionnaire using machine-learning-based feature selection to identify older adults with possible clinically manifest Parkinson’s disease who may benefit from specialist neurological assessment. The instrument demonstrated promising discrimination in a held-out development cohort and high performance in an interim prospective external-validation cohort in Almaty, Kazakhstan. However, the validation cohort was relatively small, geographically restricted, and included specialist-recruited PD cases. Larger, population-based prospective studies enriched for previously unrecognized and early-stage disease, together with direct comparison against established screening instruments, are required before clinical implementation. The questionnaire requires further research involving a large population of individuals without a prior PD diagnosis – to identify those with suspected PD via the questionnaire, followed by specialist assessment (by movement disorder experts). This represents a major upcoming phase in our plans to improve PD detection in Kazakhstan.
Author Contributions
Conceptualization, A.K.; methodology, A.N. and A.T.; software, A.T., M.M. and B.A.; validation, A.N., A.T., G.S. and F.B.; formal analysis, A.T., M.M.; investigation, A.N., A.T., G.S. and F.B.; resources, A.Z. and M.L.; data curation, M.M.; writing—original draft preparation, A.N. and A.T.; writing—review and editing, A.K.; visualization, A.K. and A.K.; supervision, A.K.; project administration, A.K.; funding acquisition, M.M. and B.A. All authors have read and agreed to the published version of the manuscript.
Funding
This research was funded by the Committee of Science of the Ministry of Science and Higher Education of the Republic of Kazakhstan (Grant No. BR27198099).
Institutional Review Board Statement
The study was conducted in accordance with the Declaration of Helsinki, and approved by the Ethics Committee of The Local Ethics Committee of the Kazakhstan-Russian Medical University (protocol under Approval Number 26 dated September 17, 2024.
Informed Consent Statement
Informed consent was obtained from all subjects involved in the study.
Data Availability Statement
The data presented in this study are available from the corresponding author upon request; such a statement is required because some of the data contain personal patient information (medical records of patients with PD used to analyze complaints and symptoms, as well as electronic and written responses to questions).
Acknowledgments
We thank G.S. Kaishibayeva, Director of the S. Kaishibayev Institute of Neurology and Neurorehabilitation, for the administrative support provided for this work, as well as the heads of the municipal polyclinics and active longevity centers in Almaty and all the participants who agreed to take part in our study. During the preparation of this manuscript, the authors used Grammarly and ChatGPT for orthography and punctuation in the manuscript. The authors have reviewed and edited the output and take full responsibility for the content of this publication.
Conflicts of Interest
The author(s) declared that this work was conducted in the absence of any commercial or financial relationships that could be construed as a potential conflict of interest.
Abbreviations
The following abbreviations are used in this manuscript:
| AUC | Area under the receiver operation characteristic curve |
| CI | Confidence interval |
| CV | Cross-validation |
| EN-LR | Logistic regression with elastic-net penalty |
| FN | False negative |
| FP | False positive |
| GB | Gradient boosting |
| MDS | International Parkinson and Movement Disorder Society |
| NPV | Negative predictive value |
| PD | Parkinson’s disease |
| PDSQ | Parkinson’s Disease Screening Questionnaire |
| PPV | Positive predictive value |
| RF | Random forest |
| SD | Standard deviation |
| TN | True negative |
| TP | True positive |
Appendix A
Complete 100-item questionnaire. The first question is: Have you been diagnosed with Parkinson’s disease? This is followed by 100 statements (questions) regarding the participants’ well-being. For all questions patient answers “yes” or “no”.
Table A1.
Complete 100-item questionnaire.
| 1. | Have you been diagnosed with Parkinson’s disease? | Yes | No |
| 2. | It has become difficult for me to move quickly; I have started doing everything more slowly. | Yes | No |
| 3. | It has become difficult for me to start doing something, as if my body does not want to move. | Yes | No |
| 4. | My muscles seem stiff and tense; it has become difficult to move my arms and/or legs. | Yes | No |
| 5. | It has become difficult to relax my body, as if it were freezing. | Yes | No |
| 6. | My fingers have started to tremble on their own. | Yes | No |
| 7. | My arms and/or legs have started to tremble, especially when I am sitting relaxed or resting. | Yes | No |
| 8. | My lower jaw, chin, or lips have started to tremble. | Yes | No |
| 9. | I have trembling in my arms, but it usually decreases or disappears when I start doing something. | Yes | No |
| 10. | It has become difficult for me to maintain balance when walking, turning, or changing direction. | Yes | No |
| 11. | I have started to fall frequently. | Yes | No |
| 12. | I started walking with small steps. | Yes | No |
| 13. | It has become difficult for me to start walking. | Yes | No |
| 14. | It has become difficult for me to turn and change direction while walking. | Yes | No |
| 15. | While walking, I have started to swing my arms less or not at all. | Yes | No |
| 16. | I climb hills more slowly. | Yes | No |
| 17. | I have noticed that sometimes during a walk I suddenly stop and cannot move forward. | Yes | No |
| 18. | Sometimes when someone on the street or in the store stops to ask me something, I feel like my feet stick to the ground. | Yes | No |
| 19. | My voice has become quiet, and it is difficult for me to speak so that others can hear me. | Yes | No |
| 20. | My speech has become unclear; sometimes other people ask me to repeat what I said. | Yes | No |
| 21. | I have started speaking more slowly, and I need more time to express my thoughts. | Yes | No |
| 22. | My speech has become monotonous, without expression. | Yes | No |
| 23. | People tell me that my face does not show emotions. | Yes | No |
| 24. | People constantly ask me what I am so upset about. | Yes | No |
| 25. | My posture has changed with a forward lean or tilt to one side. | Yes | No |
| 26. | I have started to stoop. | Yes | No |
| 27. | I have started producing more saliva, and it sometimes interferes with normal eating and speaking. | Yes | No |
| 28. | It has become difficult for me to chew food, especially hard foods, and it takes more time. | Yes | No |
| 29. | Sometimes it becomes hard to swallow even small pieces of food. | Yes | No |
| 30. | Occasionally I choke on food or saliva. | Yes | No |
| 31. | Occasionally, food gets stuck in my throat. | Yes | No |
| 32. | Eating has started to take too much time. | Yes | No |
| 33. | I often spill soup from a spoon or drop food from a fork. | Yes | No |
| 34. | It has become difficult for me to bring food to my mouth. | Yes | No |
| 35. | The tableware (fork, spoon, knife, etc.) seems too slippery or heavy to hold. | Yes | No |
| 36. | I dress more slowly than before. | Yes | No |
| 37. | Sometimes I get confused about how to put on clothes correctly. | Yes | No |
| 38. | It has become more difficult for me to button buttons, zip zippers, and tie shoelaces. | Yes | No |
| 39. | I have started to ask for help getting dressed. | Yes | No |
| 40. | It has taken me longer to brush my teeth, shower, wash my hair, and cut my nails. I do everything more slowly. | Yes | No |
| 41. | I have started needing help with showering, washing my hair, or cutting my nails. | Yes | No |
| 42. | It has become difficult to get out of a chair or sofa, especially if the chair or sofa is low and soft. | Yes | No |
| 43. | Sometimes when I get up from bed or a sofa, I lose balance and may even fall. | Yes | No |
| 44. | Turning in bed and getting out of bed become slower. | Yes | No |
| 45. | It has become difficult for me to find a comfortable position in bed. | Yes | No |
| 46. | Turning in bed and getting out of bed become difficult. | Yes | No |
| 47. | My handwriting has become smaller and shorter. | Yes | No |
| 48. | I have started writing more slowly than before. | Yes | No |
| 49. | It has become difficult for me to engage in activities such as drawing, jobbing, minor repairs, or knitting due to movement problems. | Yes | No |
| 50. | I cannot engage in my habitual activities because I have become slower, tired quickly, and lose interest. | Yes | No |
| 51. | I smell poorly or not at all. | Yes | No |
| 52. | It has become difficult for me to fall asleep. | Yes | No |
| 53. | I often wake up during the night and then cannot fall back asleep for a long time. | Yes | No |
| 54. | I started to feel exhausted and tired in the morning, as if I did not rest at all. | Yes | No |
| 55. | I have started having vivid and unpleasant dreams. | Yes | No |
| 56. | Sometimes I move, cry, or talk during sleep, which worries my loved ones. | Yes | No |
| 57. | I have often noticed that my arms and legs move involuntarily when I lie down or sit relaxed. | Yes | No |
| 58. | My family often tells me that I snore. | Yes | No |
| 59. | Sometimes I wake up because I have difficulty breathing. | Yes | No |
| 60. | When I sit or lie down, I want to move my legs or arms, and it brings me a kind of relief. | Yes | No |
| 61. | Sometimes I start to fall asleep during the day at home, which I never did before. | Yes | No |
| 62. | Sometimes I can fall asleep in transport or while sitting in line, so I may miss the stop I need to get off at or skip my turn. | Yes | No |
| 63. | I often feel sad without any reason. | Yes | No |
| 64. | I have started to cry too often without a serious reason. | Yes | No |
| 65. | Nothing pleases me anymore, even things I used to enjoy. | Yes | No |
| 66. | Sometimes I feel hopeless, and it seems to me that I am worthless. | Yes | No |
| 67. | I become more sensitive, feel lonely and abandoned, and feel that I do not receive enough support from those around me. | Yes | No |
| 68. | I have started to feel constant inner tension and find it difficult to relax, even when there are no obvious reasons to worry. | Yes | No |
| 69. | I have become irritable and lose my temper quickly. | Yes | No |
| 70. | Sometimes I have a feeling that something bad is about to happen. | Yes | No |
| 71. | It has become difficult for me to plan and organize my affairs. | Yes | No |
| 72. | It has become difficult for me to concentrate and remember information. | Yes | No |
| 73. | I often forget what I have done or said. | Yes | No |
| 74. | I often bump into furniture or other objects. | Yes | No |
| 75. | I have started to see and hear things that are not actually there. | Yes | No |
| 76. | Sometimes it seems to me that someone is watching me or that something is threatening me. | Yes | No |
| 77. | Sometimes it seems to me that objects around me are moving or changing shape. | Yes | No |
| 78. | When I stand up, I often feel dizzy and weak. | Yes | No |
| 79. | Sometimes it becomes dark before my eyes, and I feel as if I am about to faint. | Yes | No |
| 80. | It has become difficult for me to hold my urine. | Yes | No |
| 81. | I often go to urinate frequently during the day. | Yes | No |
| 82. | I often get up at night to go to the bathroom several times per night. | Yes | No |
| 83. | I have developed painful sensations in my body. | Yes | No |
| 84. | I frequently start to feel pain in my muscles and joints. | Yes | No |
| 85. | I have started to feel numbness in my body. | Yes | No |
| 86. | Painful spasms have started to occur in my muscles. | Yes | No |
| 87. | Sometimes I start to feel unpleasant heat or cold at normal room temperature. | Yes | No |
| 88. | I have started to experience pain in my arms or legs or body, especially in the morning. | Yes | No |
| 89. | My stool has become less regular. | Yes | No |
| 90. | I have started to be troubled by persistent constipation problems. | Yes | No |
| 91. | I have started to feel emotionally exhausted and drained. | Yes | No |
| 92. | I have little strength; even small efforts have started to exhaust me greatly. | Yes | No |
| 93. | I quickly tire from activities I could previously do for a long time. | Yes | No |
| 94. | My sexual desire has decreased. | Yes | No |
| 95. | I don’t have pleasure during sex; moreover, it has become uncomfortable and difficult to do. | Yes | No |
| 96. | I have noticed that I am losing weight, although I eat as before. | Yes | No |
| 97. | I have started sweating frequently for no reason. | Yes | No |
| 98. | I have started to feel nauseous often. | Yes | No |
| 99. | I no longer want to talk and meet with friends and family as before; I have no desire to maintain contact. | Yes | No |
| 100. | When I am in crowded places, I have started to feel uncomfortable. | Yes | No |
| 101. | I have started to notice that my emotions have become less vivid; previously I could enjoy small things and deeply empathize with others, but now everything seems somewhat dull. | Yes | No |
Appendix B
Table A2.
Final 35 selected questionnaire items with algorithm-specific importance and combined meta-importance.
Table A2.
Final 35 selected questionnaire items with algorithm-specific importance and combined meta-importance.
| Rank | Q-N | Selected questionnaire item | Logistic ElasticNet | Random Forest | Gradient Boosting | AUC-weighted meta-importance | Simple average | Stage |
| 1 | 6 | My fingers have started to tremble on their own. | 0,04409 | 0,09486 | 0,49908 | 0,21317 | 0,21268 | Stage 1 |
| 2 | 23 | People tell me that my face does not show emotions. | 0,02772 | 0,04264 | 0,08195 | 0,05085 | 0,05077 | Stage 1 |
| 3 | 9 | I have trembling in my arms, but it usually decreases or disappears when I start doing something. | 0,03458 | 0,06315 | 0,05328 | 0,05042 | 0,05034 | Stage 2 |
| 4 | 7 | My arms and/or legs have started to tremble, especially when I am sitting relaxed or resting. | 0,03956 | 0,05896 | 0,03389 | 0,04418 | 0,04414 | Stage 2 |
| 5 | 40 | It has taken me longer to brush my teeth, shower, wash my hair, and cut my nails. I do everything more slowly. | 0,02161 | 0,04027 | 0,07007 | 0,04407 | 0,04398 | Stage 1 |
| 6 | 15 | While walking, I have started to swing my arms less or not at all. | 0,03077 | 0,04514 | 0,04009 | 0,03871 | 0,03867 | Stage 1 |
| 7 | 44 | Turning in bed and getting out of bed become slower. | 0,02479 | 0,02981 | 0,02248 | 0,0257 | 0,02569 | Stage 1 |
| 8 | 49 | It has become difficult for me to engage in activities such as drawing, jobbing, minor repairs, or knitting due to movement problems. | 0,01577 | 0,02335 | 0,02251 | 0,02057 | 0,02054 | Stage 1 |
| 9 | 47 | My handwriting has become smaller and shorter. | 0,02001 | 0,03006 | 0,00674 | 0,01895 | 0,01894 | Stage 1 |
| 10 | 38 | It has become more difficult for me to button buttons, zip zippers, and tie shoelaces. | 0,00602 | 0,02459 | 0,02131 | 0,01736 | 0,01731 | Stage 1 |
| 11 | 25 | My posture has changed with a forward lean or tilt to one side. | 0,0224 | 0,02488 | 0,00418 | 0,01714 | 0,01715 | Stage 1 |
| 12 | 51 | I smell poorly or not at all. | 0,02679 | 0,012 | 0,01222 | 0,01695 | 0,017 | Stage 1 |
| 13 | 2 | It has become difficult for me to move quickly; I have started doing everything more slowly. | 0,01386 | 0,0304 | 0,00351 | 0,01595 | 0,01592 | Stage 1 |
| 14 | 68 | I have started to feel constant inner tension and find it difficult to relax, even when there are no obvious reasons to worry. | 0,02649 | 0,01311 | 0,00659 | 0,01535 | 0,0154 | Stage 1 |
| 15 | 19 | My voice has become quiet, and it is difficult for me to speak so that others can hear me. | 0,00774 | 0,02533 | 0,01052 | 0,01457 | 0,01453 | Stage 1 |
| 16 | 14 | It has become difficult for me to turn and change direction while walking. | 0,01461 | 0,01195 | 0,01131 | 0,01262 | 0,01263 | Stage 1 |
| 17 | 4 | My muscles seem stiff and tense; it has become difficult to move my arms and/or legs. | 0,01314 | 0,01876 | 0,00444 | 0,01212 | 0,01211 | Stage 1 |
| 18 | 42 | It has become difficult to get out of a chair or sofa, especially if the chair or sofa is low and soft. | 0,00972 | 0,02338 | 0,00105 | 0,01141 | 0,01138 | Stage 2 |
| 19 | 31 | Occasionally, food gets stuck in my throat. | 0,02246 | 0,0071 | 0,00404 | 0,01115 | 0,0112 | Stage 2 |
| 20 | 62 | Sometimes I can fall asleep in transport or while sitting in line, so I may miss the stop I need to get off at or skip my turn. | 0,02075 | 0,00218 | 0,00993 | 0,0109 | 0,01095 | Stage 2 |
| 21 | 36 | I dress more slowly than before. | 0,00372 | 0,02513 | 0,00337 | 0,01079 | 0,01074 | Stage 2 |
| 22 | 72 | It has become difficult for me to concentrate and remember information. | 0,02611 | 0,00305 | 0,00066 | 0,00987 | 0,00994 | Stage 2 |
| 23 | 79 | Sometimes it becomes dark before my eyes, and I feel as if I am about to faint. | 0,01854 | 0,00351 | 0,00761 | 0,00984 | 0,00989 | Stage 2 |
| 24 | 63 | I often feel sad without any reason. | 0,01153 | 0,00867 | 0,00883 | 0,00966 | 0,00967 | Stage 2 |
| 25 | 50 | I cannot engage in my habitual activities because I have become slower, tired quickly, and lose interest. | 0,00169 | 0,02193 | 0,00122 | 0,00833 | 0,00828 | Stage 2 |
| 26 | 16 | I climb hills more slowly. | 0,0192 | 0,00299 | 0,00276 | 0,00827 | 0,00832 | Stage 2 |
| 27 | 26 | I have started to stoop. | 0,00854 | 0,01306 | 0,00277 | 0,00813 | 0,00812 | Stage 2 |
| 28 | 77 | Sometimes it seems to me that objects around me are moving or changing shape. | 0,01691 | 0,00178 | 0,00581 | 0,00812 | 0,00817 | Stage 2 |
| 29 | 5 | It has become difficult to relax my body, as if it were freezing. | 0,01575 | 0,00519 | 0,00347 | 0,0081 | 0,00813 | Stage 2 |
| 30 | 69 | I have become irritable and lose my temper quickly. | 0,02042 | 0,00249 | 0,00112 | 0,00795 | 0,00801 | Stage 2 |
| 31 | 80 | It has become difficult for me to hold my urine. | 0,0189 | 0,00217 | 0,00259 | 0,00783 | 0,00788 | Stage 2 |
| 32 | 34 | It has become difficult for me to bring food to my mouth. | 0,01929 | 0,00219 | 0,00143 | 0,00758 | 0,00764 | Stage 2 |
| 33 | 90 | I have started to be troubled by persistent constipation problems. | 0,01134 | 0,00863 | 0,00241 | 0,00745 | 0,00746 | Stage 2 |
| 34 | 57 | I have often noticed that my arms and legs move involuntarily when I lie down or sit relaxed. | 0,017 | 0,00519 | 0,00007 | 0,00738 | 0,00742 | Stage 2 |
| 35 | 48 | I have started writing more slowly than before. | 0,00819 | 0,01269 | 0,00116 | 0,00735 | 0,00735 | Stage 2 |
References
- Li, Y.; Lv, Z.; Dai, Y.; Yu, L.; Zhang, L.; Wang, K.; Hu, P. The global, regional, and national burden of Parkinson’s disease in 204 countries and territories, 1990-2021: A systematic analysis for the Global Burden of Disease Study 2021. BMC Public Health 2025, 25, 3047. [Google Scholar] [CrossRef] [PubMed]
- Su, D.; Cui, Y.; He, C.; Yin, P.; Bai, R.; Zhu, J.; Lam, J.S.T.; Zhang, J.; Yan, R.; Zheng, X.; Wu, J.; Zhao, D.; Wang, A.; Zhou, M.; Feng, T. Projections for prevalence of Parkinson’s disease and its driving factors in 195 countries and territories to 2050: Modelling study of Global Burden of Disease Study 2021. BMJ 2025, 388, e080952. [Google Scholar] [CrossRef] [PubMed]
- Zhu, J.; Cui, Y.; Zhang, J.; Yan, R.; Su, D.; Zhao, D.; Wang, A.; Feng, T. Temporal trends in the prevalence of Parkinson’s disease from 1980 to 2023: A systematic review and meta-analysis. Lancet Healthy Longev. 2024, 5, e464–e479. [Google Scholar] [CrossRef] [PubMed]
- Schrag, A.; Ben-Shlomo, Y.; Quinn, N. How valid is the clinical diagnosis of Parkinson’s disease in the community? J. Neurol. Neurosurg. Psychiatry 2002, 73, 529–534. [Google Scholar] [CrossRef] [PubMed]
- De Miranda, B.R.; Goldman, S.M.; Miller, G.W.; Greenamyre, J.T.; Dorsey, E.R. Preventing Parkinson’s disease: An environmental agenda. J. Park. Dis. 2022, 12, 45–68. [Google Scholar] [CrossRef] [PubMed]
- Rizzo, G.; Copetti, M.; Arcuti, S.; Martino, D.; Fontana, A.; Logroscino, G. Accuracy of clinical diagnosis of Parkinson disease: A systematic review and meta-analysis. Neurology 2016, 86, 566–576. [Google Scholar] [CrossRef] [PubMed]
- Jankovic, J.; Aguilar, L.G. Current approaches to the treatment of Parkinson’s disease. Neuropsychiatr. Dis. Treat. 2008, 4, 743–757. [Google Scholar] [CrossRef] [PubMed]
- Tsukita, K.; Sakamaki-Tsukita, H.; Takahashi, R. Long-term effect of regular physical activity and exercise habits in patients with early Parkinson disease. Neurology 2022, 98, e859–e871. [Google Scholar] [CrossRef] [PubMed]
- Kaiyrzhanov, R.; Rizig, M.; Aitkulova, A.; Zharkinbekova, N.; Shashkin, C.; Kaishibayeva, G.; Karimova, A.; Khaibullin, T.; Sadykova, D.; Ganieva, M.; Rasulova, K.; Houlden, H. Parkinson’s disease in Central Asian and Transcaucasian countries: A review of epidemiology, genetics, clinical characteristics, and access to care. Park. Dis. 2019, 2019, 2905739. [Google Scholar] [CrossRef] [PubMed]
- Akanova, A.A. Epidemiological, Clinical and Genetic features of PD Patients in Kazakhstan, Based on the City of Almaty. PhD Thesis, (In Russian) Kazakh National Medical University, Almaty, Kazakhstan, 2015. [Google Scholar]
- Tolosa, E.; Poewe, W.; Noyce, A.J.; Svenningsson, P.; Mahlknecht, P.; Marti, M.J. Towards biomarker-based diagnosis of Parkinson disease. Nat. Rev. Neurol. 2026, 22, 139–151. [Google Scholar] [CrossRef] [PubMed]
- Concha-Marambio, L.; Weber, S.; Farris, C.M.; Dakna, M.; Lang, E.; Wicke, T.; Ma, Y.; Starke, M.; Ebentheuer, J.; Sixel-Döring, F.; Muntean, M.L.; Schade, S.; Trenkwalder, C.; Soto, C.; Mollenhauer, B. Accurate detection of α-synuclein seeds in cerebrospinal fluid from isolated rapid eye movement sleep behavior disorder and patients with Parkinson’s disease in the DeNovo Parkinson (DeNoPa) cohort. Mov. Disord. 2023, 38, 567–578. [Google Scholar] [CrossRef] [PubMed]
- Orrù, C.D.; Ma, T.C.; Hughson, A.G.; Groveman, B.R.; Srivastava, A.; Galasko, D.; Angers, R.; Downey, P.; Crawford, K.; Hutten, S.J.; Kang, U.J.; Caughey, B. A rapid α-synuclein seed assay of Parkinson’s disease CSF panel shows high diagnostic accuracy. Ann. Clin. Transl. Neurol. 2021, 8, 374–384. [Google Scholar] [CrossRef] [PubMed]
- Kluge, A.; Schaeffer, E.; Bunk, J.; Sommerauer, M.; Röttgen, S.; Schulte, C.; Roeben, B.; von Thaler, A.K.; Welzel, J.; Lucius, R.; Heinzel, S.; Xiang, W.; Eschweiler, G.W.; Maetzler, W.; Suenkel, U.; Berg, D. Detecting misfolded α-synuclein in blood years before the diagnosis of Parkinson’s disease. Mov. Disord. 2024, 39, 1289–1299. [Google Scholar] [CrossRef] [PubMed]
- Funayama, M.; Nishioka, K.; Li, Y.; Hattori, N. Molecular genetics of Parkinson’s disease: Contributions and global trends. J. Hum. Genet. 2023, 68, 125–130. [Google Scholar] [CrossRef] [PubMed]
- Trevisan, L.; Gaudio, A.; Monfrini, E.; Avanzino, L.; Di Fronzo, A.; Mandich, P. Genetics in Parkinson’s disease, state-of-the-art and future perspectives. Br. Med. Bull. 2024, 149, 60–71. [Google Scholar] [CrossRef] [PubMed]
- Mitchell, T.; Lehéricy, S.; Chiu, S.Y.; Strafella, A.P.; Stoessl, A.J.; Vaillancourt, D.E. Emerging neuroimaging biomarkers across disease stage in Parkinson disease: A review. JAMA Neurol. 2021, 78, 1262–1272. [Google Scholar] [CrossRef] [PubMed]
- Yoo, H.S.; Kim, H.K.; Na, H.K.; Kang, S.; Park, M.; Ahn, S.J.; Lee, J.H.; Ryu, Y.H.; Lyoo, C.Y. Association of striatal dopamine depletion and brain metabolism changes with motor and cognitive deficits in patients with Parkinson disease. Neurology 2024, 103, e210105. [Google Scholar] [CrossRef] [PubMed]
- Gu, W.; He, C.; Chen, J.; Li, J. Proton magnetic resonance spectroscopy for the early diagnosis of Parkinson disease in the substantia nigra and globus pallidus: A meta-analysis with trial sequential analysis. Front. Neurol. 2022, 13, 838230. [Google Scholar] [CrossRef] [PubMed]
- Rábano-Suárez, P.; Del Campo, N.; Benatru, I.; Moreau, C.; Desjardins, C.; Sánchez-Ferro, Á.; Fabbri, M. Digital outcomes as biomarkers of disease progression in early Parkinson’s disease: A systematic review. Mov. Disord. 2025, 40, 184–203. [Google Scholar] [CrossRef] [PubMed]
- Sun, Y.M.; Wang, Z.Y.; Liang, Y.Y.; Hao, C.W.; Shi, C.H. Digital biomarkers for precision diagnosis and monitoring in Parkinson’s disease. npj Digit. Med. 2024, 7, 218. [Google Scholar] [CrossRef] [PubMed]
- Castro Mejia, A.; Sapienza, S.; Paccoud, I.; Alcock, L.; Brown, P.; Gaßner, H.; Hunter, H.; Maetzler, W.; Mirelman, A.; Nieuwboer, A.; Regensburger, M.; Rochester, L.; Stallforth, S.; Vereijken, B.; Yarnall, A.; Klucken, J. Consensus on the clinical utility of digital mobility outcomes for personalized clinical decision support in Parkinson’s disease. Neurol. Res. Pract. 2025, 7, 66. [Google Scholar] [CrossRef] [PubMed]
- Rees, R.N.; Acharya, A.P.; Schrag, A.; Noyce, A.J. An early diagnosis is not the same as a timely diagnosis of Parkinson’s disease. F1000Research 2018, 7, F1000 Faculty Rev–1106. [Google Scholar] [CrossRef] [PubMed]
- Dakay, D.; Tangcalagan, F.; Villanueva, E., III; Abejero, J.; Saranza, G. Philippine Parkinson’s Disease Prevalence Study Group. Cross-cultural validation of the Cebuano version of a screening questionnaire for Parkinson’s disease. Arq. Neuropsiquatr. 2022, 80, 1239–1245. [Google Scholar] [CrossRef] [PubMed]
- Dahodwala, N.; Kubersky, L.; Siderowf, A.; PARS Investigators. Can a screening questionnaire accurately identify mild Parkinsonian signs? Neuroepidemiology 2012, 39, 171–175. [Google Scholar] [CrossRef] [PubMed]
- Durcan, R.; Wiblin, L.; Lawson, R.A.; Khoo, T.K.; Yarnall, A.J.; Duncan, G.W.; Brooks, D.J.; Pavese, N.; Burn, D.J. ICICLE-PD Study Group. Prevalence and duration of non-motor symptoms in prodromal Parkinson’s disease. Eur. J. Neurol. 2019, 26, 979–985. [Google Scholar] [CrossRef] [PubMed]
- Noyce, A.J.; Bestwick, J.P.; Silveira-Moriyama, L.; Hawkes, C.H.; Knowles, C.H.; Hardy, J.; Giovannoni, G.; Nageshwaran, S.; Osborne, C.; Lees, A.J.; Schrag, A. PREDICT-PD: Identifying risk of Parkinson’s disease in the community: Methods and baseline results. J. Neurol. Neurosurg. Psychiatry 2014, 85, 31–37. [Google Scholar] [CrossRef] [PubMed]
- Noyce, A.J.; R’Bibo, L.; Peress, L.; Bestwick, J.P.; Adams-Carr, K.L.; Mencacci, N.E.; Hawkes, C.H.; Masters, J.M.; Wood, N.; Hardy, J.; Giovannoni, G.; Lees, A.J.; Schrag, A. PREDICT-PD: An online approach to prospectively identify risk indicators of Parkinson’s disease. Mov. Disord. 2017, 32, 219–226. [Google Scholar] [CrossRef] [PubMed]
- Makarious, M.B.; Leonard, H.L.; Vitale, D.; Iwaki, H.; Sargent, L.; Dadu, A.; Violich, I.; Hutchins, E.; Saffo, D.; Bandres-Ciga, S.; Kim, J.J.; Song, Y.; Maleknia, M.; Bookman, M.; Nojopranoto, W.; Campbell, R.H.; Hashemi, S.H.; Botia, J.A.; Carter, J.F.; Craig, D.W.; Van Keuren-Jensen, K.; Morris, H.R.; Hardy, J.A.; Blauwendraat, C.; Singleton, A.B.; Faghri, F.; Nalls, M.A. Multi-modality machine learning predicting Parkinson’s disease. npj Park. Dis. 2022, 8, 35. [Google Scholar] [CrossRef] [PubMed]
- Wang, W.; Lee, J.; Harrou, F.; Sun, Y. Early detection of Parkinson’s disease using deep learning and machine learning. IEEE Access 2020, 8, 147635–147646. [Google Scholar] [CrossRef]
- Hall, A.; Bandres-Ciga, S.; Diez-Fairen, M.; Quinn, J.P.; Billingsley, K.J. Genetic risk profiling in Parkinson’s disease and utilizing genetics to gain insight into disease-related biological pathways. Int. J. Mol. Sci. 2020, 21, 7332. [Google Scholar] [CrossRef] [PubMed]
- Pringsheim, T.; Jette, N.; Frolkis, A.; Steeves, T.D. The prevalence of Parkinson’s disease: A systematic review and meta-analysis. Mov. Disord. 2014, 29, 1583–1590. [Google Scholar] [CrossRef] [PubMed]
- Luo, Y.; Qiao, L.; Li, M.; Wen, X.; Zhang, W.; Li, X. Global, regional, national epidemiology and trends of Parkinson’s disease from 1990 to 2021: Findings from the Global Burden of Disease Study 2021. Front. Aging Neurosci. 2025, 16, 1498756. [Google Scholar] [CrossRef] [PubMed]
- Postuma, R.B.; Berg, D.; Stern, M.; Poewe, W.; Olanow, C.W.; Oertel, W.; Obeso, J.; Marek, K.; Litvan, I.; Lang, A.E.; Halliday, G.; Goetz, C.G.; Gasser, T.; Dubois, B.; Chan, P.; Bloem, B.R.; Adler, C.H.; Deuschl, G. MDS clinical diagnostic criteria for Parkinson’s disease. Mov. Disord. 2015, 30, 1591–1601. [Google Scholar] [CrossRef] [PubMed]
- Tay, J.K.; Narasimhan, B.; Hastie, T. Elastic net regularization paths for all generalized linear models. J. Stat. Softw. 2023, 106, 1–31. [Google Scholar] [CrossRef] [PubMed]
- Speiser, J.L. A random forest method with feature selection for developing medical prediction models with clustered and longitudinal data. J. Biomed. Inform. 2021, 117, 103763. [Google Scholar] [CrossRef] [PubMed]
- Li, K.; Yao, S.; Zhang, Z.; Cao, B.; Wilson, C.M.; Kalos, D.; Kuan, P.F.; Zhu, R.; Wang, X. Efficient gradient boosting for prognostic biomarker discovery. Bioinformatics 2022, 38, 1631–1638. [Google Scholar] [CrossRef] [PubMed]
- Binuya, M.A.E.; Engelhardt, E.G.; Schats, W.; Schmidt, M.K.; Steyerberg, E.W. Methodological guidance for the evaluation and updating of clinical prediction models: A systematic review. BMC Med. Res. Methodol. 2022, 22, 316. [Google Scholar] [CrossRef] [PubMed]
- Riley, R.D.; Archer, L.; Snell, K.I.E.; Ensor, J.; Dhiman, P.; Martin, G.P.; Bonnett, L.J.; Collins, G.S. Evaluation of clinical prediction models (part 2): How to undertake an external validation study. BMJ 2024, 384, e074820. [Google Scholar] [CrossRef] [PubMed]
- Flahault, A.; Cadilhac, M.; Thomas, G. Sample size calculation should be performed for design accuracy in diagnostic test studies. J. Clin. Epidemiol. 2005, 58, 859–862. [Google Scholar] [CrossRef] [PubMed]
- Monti, C.B.; Ambrogi, F.; Sardanelli, F. Sample size calculation for data reliability and diagnostic performance: A go-to review. Eur. Radiol. Exp. 2024, 8, 79. [Google Scholar] [CrossRef] [PubMed]
- World Medical Association. World Medical Association Declaration of Helsinki: Ethical principles for medical research involving human participants. JAMA 2025, 333, 71–74. [Google Scholar] [CrossRef] [PubMed]
Figure 1.
Stages of the study.
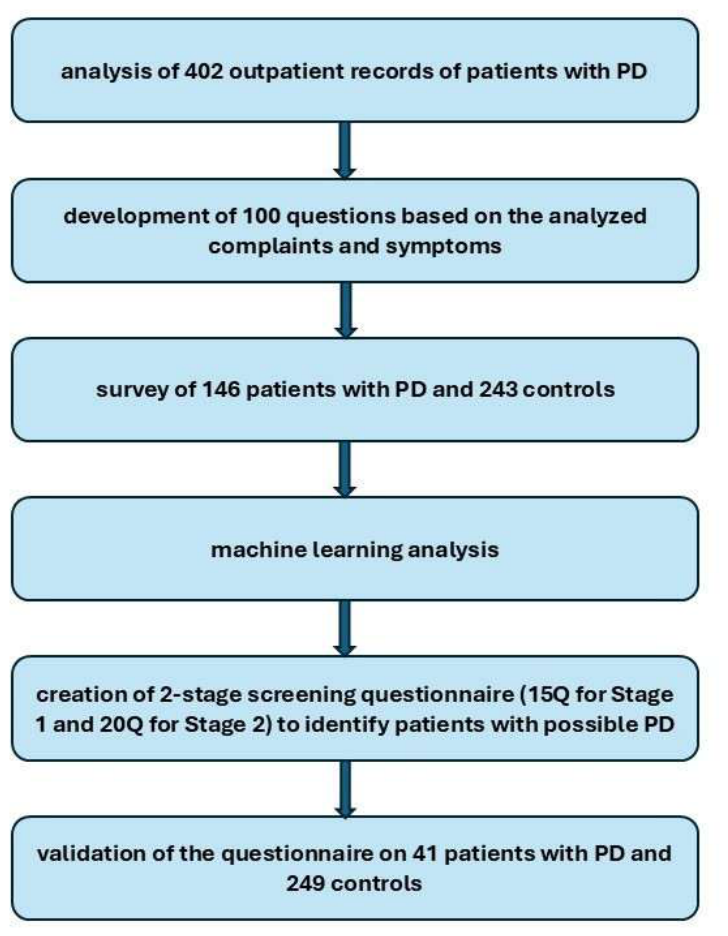
Figure 2.
Learning curve. Cross-validated AUC as a function of training-set size for the three learners and their weighted ensemble, with ±1 standard deviation bands. Estimates at 50-100 examples are unstable rather than good: the apparent AUC of 1.000 for the random forest at n = 50 reflects near-perfect separability of a very small subsample, and fold-to-fold standard deviations reach 0.128 at n = 100. From 150 examples onward the curves stabilize and the meta-ensemble varies only between 0.962 and 0.970. Note that the vertical axis is truncated.
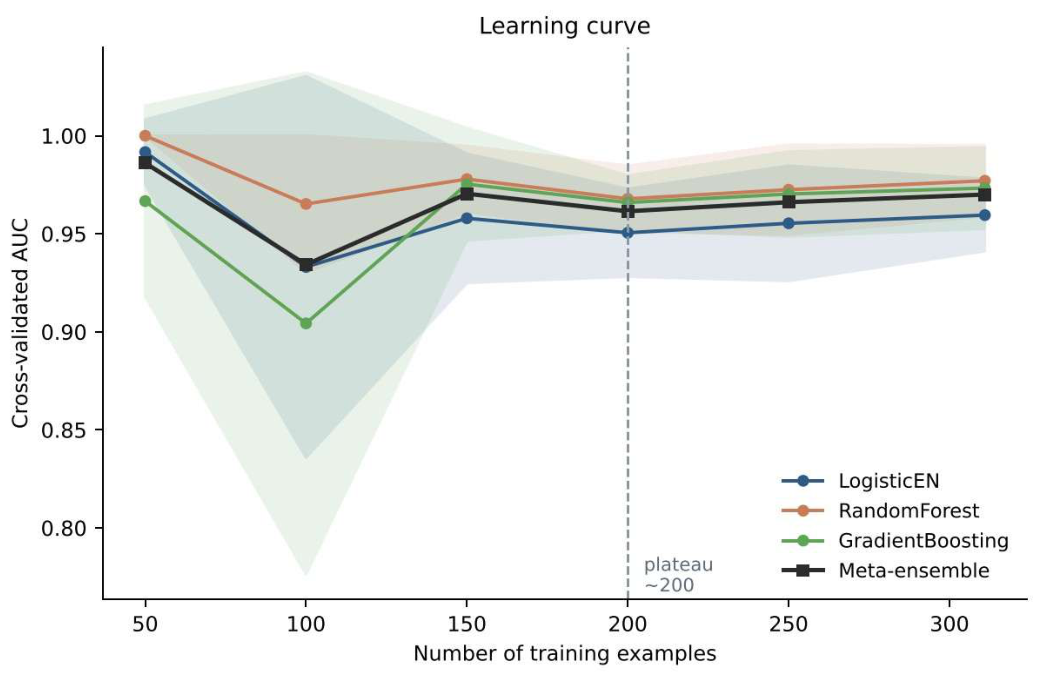
Figure 3.
100 questions rank by meta-weight, %.
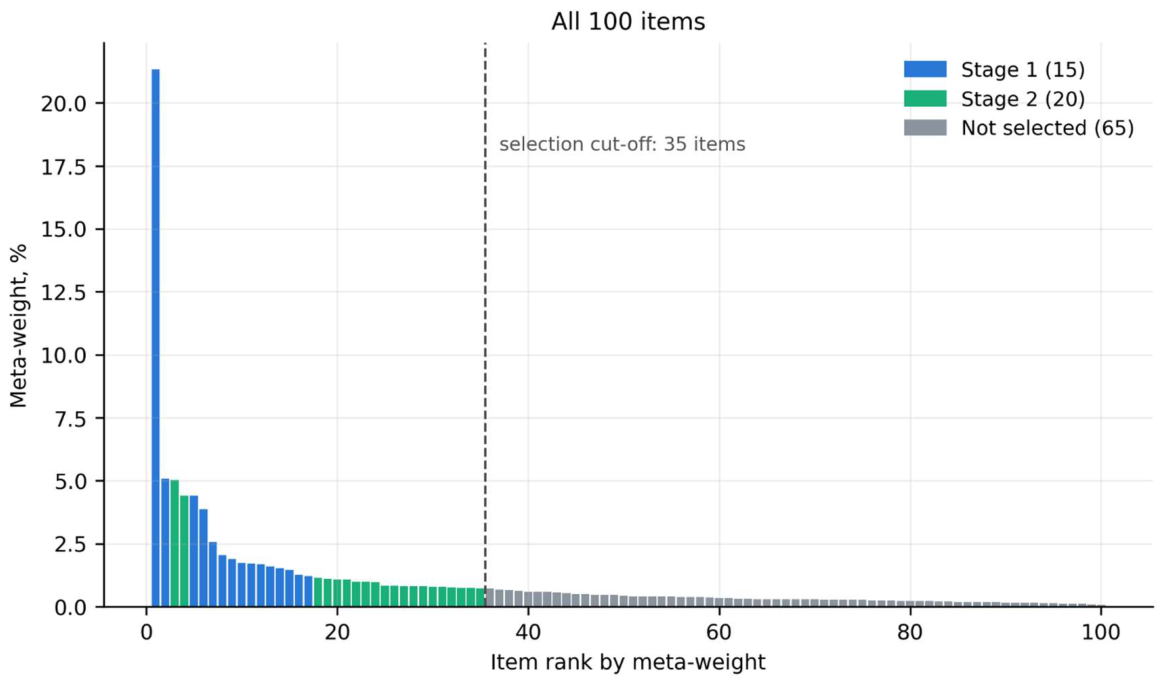
Figure 4.
Questions weight smoothing.
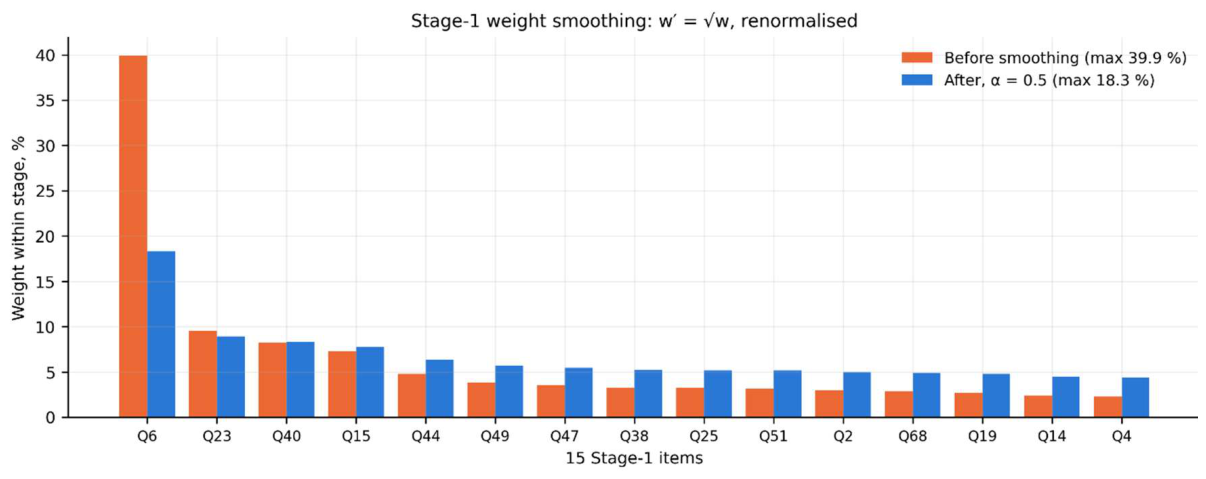
Figure 5.
First stage score for the training part: three solution zones.
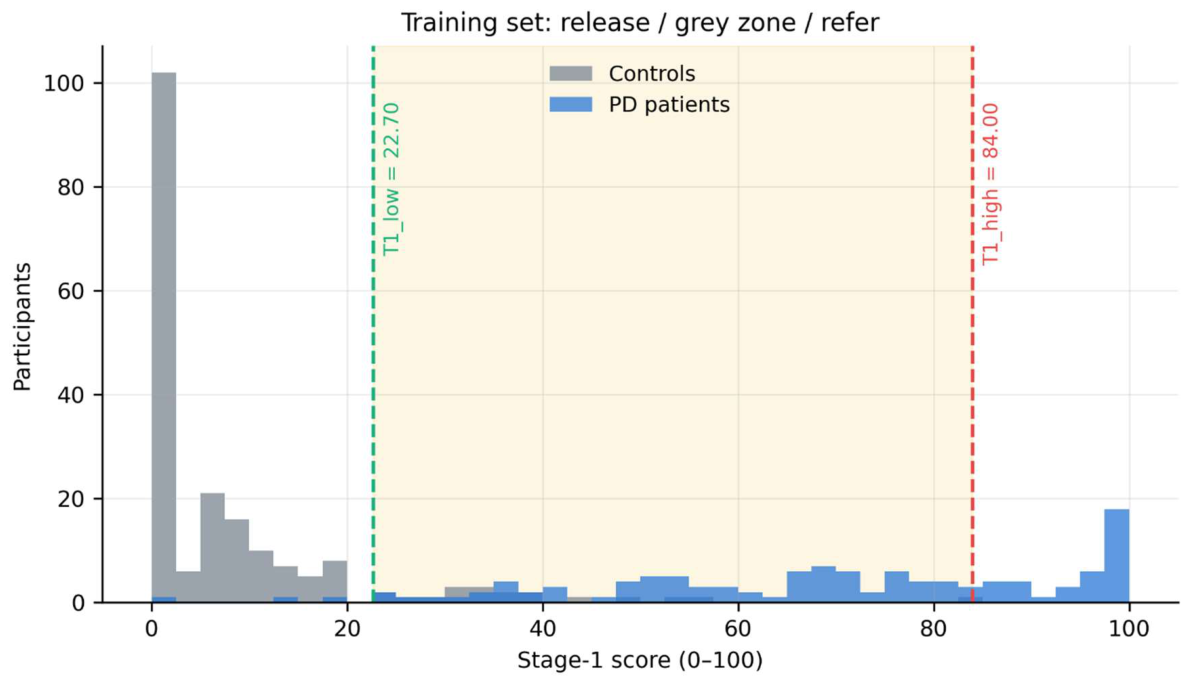
Figure 6.
Training set score calibration. Calibration of the score into probability - the points of the observed proportion of patients lie on the curve.
Figure 6.
Training set score calibration. Calibration of the score into probability - the points of the observed proportion of patients lie on the curve.
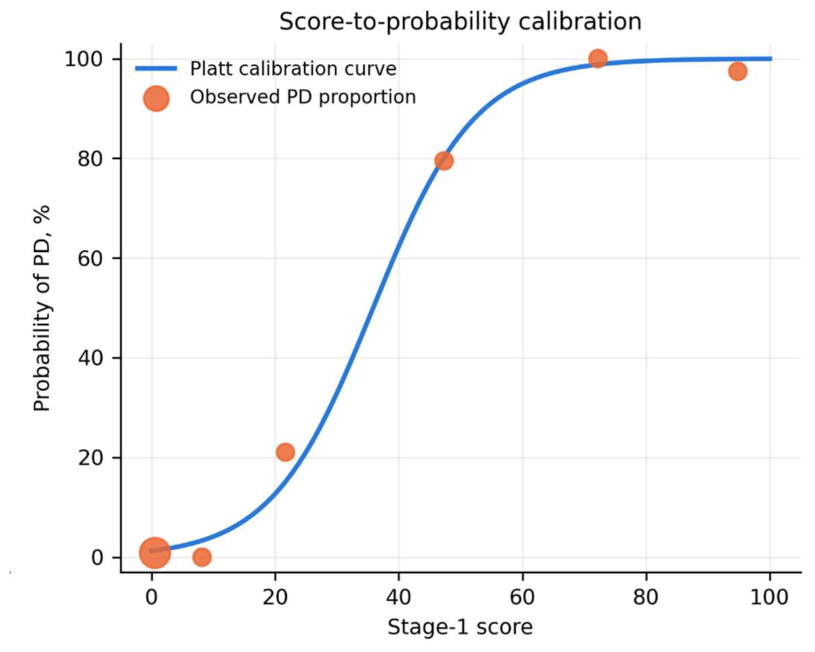
Figure 7.
Gray area in the training part: stage 2 scores in patients and controls and T2 threshold.
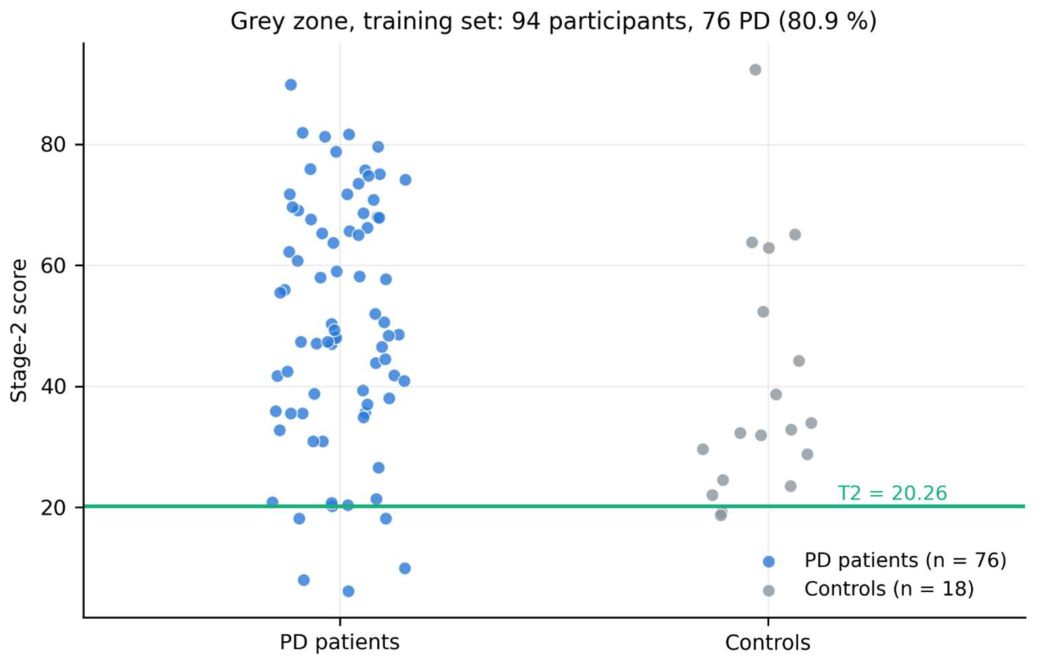
Figure 8.
Spread of metrics across 20 repeated splits of the full sample (sensitivity 0.90 rule).
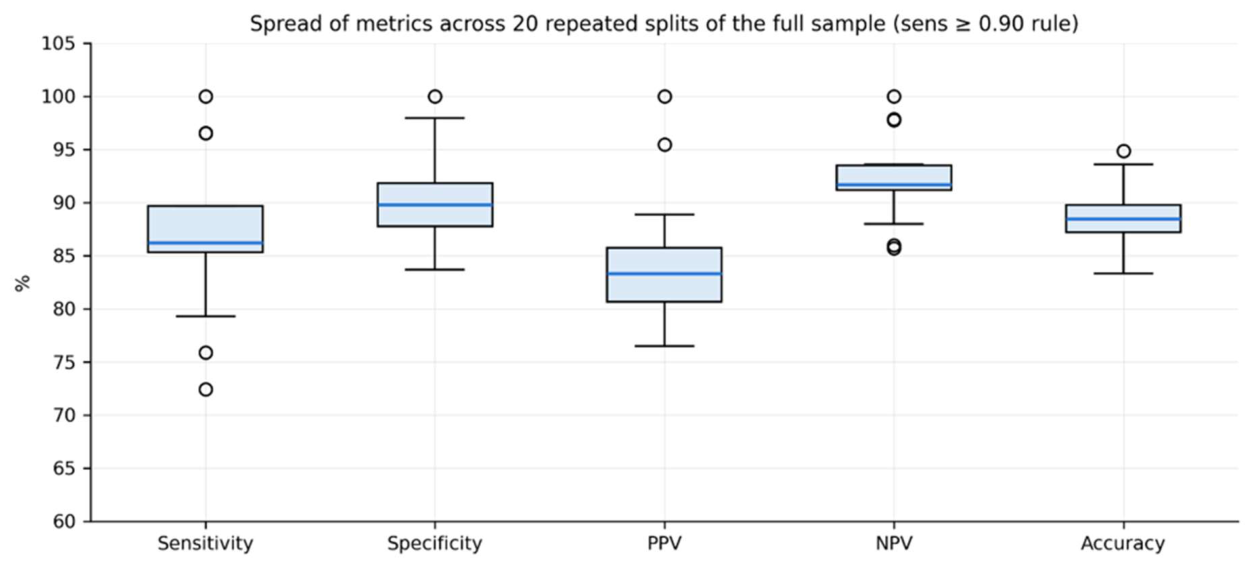
Table 1.
AUC Performance Across Different Training Set Sizes.
| Training subsample size | AUC (average across three models) | Spread (SD across CV folds) |
| 50 | 0.9503 | ±0.0605 |
| 80 | 0.9557 | ±0.0453 |
| 120 | 0.9728 | ±0.0286 |
| 160 | 0.9706 | ±0.0289 |
| 200 | 0.9774 | ±0.0208 |
| 250 | 0.9741 | ±0.0240 |
Table 2.
Demographic characteristics of participants in the model development cohort.
| Characteristics | Parkinson’s disease (n=146) | Control (n=243) | Total (n=389) |
| Age, years, mean (SD) | 66.58 (6.36) | 66.78 (5.35) | 66.71 (5.74) |
| Female, n (%) | 101 (69.18%) | 175 (72.02%) | 276 (70.95%) |
| Male, n (%) | 45 (30.82%) | 68 (27.98%) | 113 (29.05%) |
Table 3.
Demographic characteristics of participants in the model development cohort.
| Reference status | Predicted no referral | Predicted referral |
| Control, n=49 | TN=44 | FP=5 |
| PD, n=29 | FN=4 | TP=25 |
Table 4.
Performance of the two-stage screening questionnaire on the Held-Out Development Test Set.
| Metric | Value | 95% Wilson CI | 95% Bootstrap CI (B=3000) |
| Sensitivity | 86.2% | [69.4; 94.5] | [72.4; 96.9] |
| Specificity | 89.8% | [78.2; 95.6] | [80.9; 97.8] |
| PPV | 83.3% | [66.4; 92.7] | [69.2; 95.8] |
| NPV | 91.7% | [80.4; 96.7] | [83.0; 98.1] |
| Accuracy | 88.5% | [79.5; 93.8] | [80.8; 94.9] |
| Stage 1 score AUC | 0.9557 | - | - |
Table 5.
Stability over 20 partitions (criterion sensitivity ≥ 0.90).
| Metric | Mean ± SD of 20 splits |
| Sensitivity | 87,1 ± 7,1% |
| Specificity | 90,0 ± 4,0% |
| PPV | 84,2 ± 5,7% |
| NPV | 92,4 ± 3,8% |
| Accuracy | 88,9 ± 2,9% |
| Stage 1 score AUC | 0,9711 ± 0,0141 |
Table 7.
Confusion matrix for the interim prospective external validation set.
| Reference status | Predicted no referral | Predicted referral |
| PD not detected, n=249 | TN=235 | FP=14 |
| PD confirmed, n=41 | FN=2 | TP=39 |
Table 8.
Performance of the two-stage screening questionnaire on the interim prospective external validation set.
Table 8.
Performance of the two-stage screening questionnaire on the interim prospective external validation set.
| Metric | Value | 95% Wilson CI |
| Sensitivity | 95.1% | [83.9; 98.7] |
| Specificity | 94.4% | [90.8; 96.6] |
| PPV | 73.6% | [60.4; 83.6] |
| NPV | 99.2% | [97.0; 99.8] |
| Accuracy | 94.5% | [91.2; 96.6] |
| Stage 1 score AUC | 0.9962 | - |
| Stage 2 score AUC | 0.9926 | - |
Table 9.
Positive and Negative Predictive Values at Different Hypothetical Parkinson’s Disease Prevalence Levels.
Table 9.
Positive and Negative Predictive Values at Different Hypothetical Parkinson’s Disease Prevalence Levels.
| Hypothetical PD prevalence | PPV | NPV |
| 1.0% | 14.6% | 99.9% |
| 3.0% | 34.4% | 99.8% |
| 5.0% | 47.1% | 99.7% |
| 10.0% | 65.3% | 99.4% |
| 14.1% | 73.6% | 99.2% |
Disclaimer/Publisher’s Note: The statements, opinions and data contained in all publications are solely those of the individual author(s) and contributor(s) and not of MDPI and/or the editor(s). MDPI and/or the editor(s) disclaim responsibility for any injury to people or property resulting from any ideas, methods, instructions or products referred to in the content. |
© 2026 by the authors. Licensee MDPI, Basel, Switzerland. This article is an open access article distributed under the terms and conditions of the Creative Commons Attribution (CC BY) license (http://creativecommons.org/licenses/by/4.0/).
Copyright: This open access article is published under a Creative Commons CC BY 4.0 license, which permit the free download, distribution, and reuse, provided that the author and preprint are cited in any reuse.