

Submitted:
30 September 2026
Posted:
01 October 2026
You are already at the latest version
Abstract
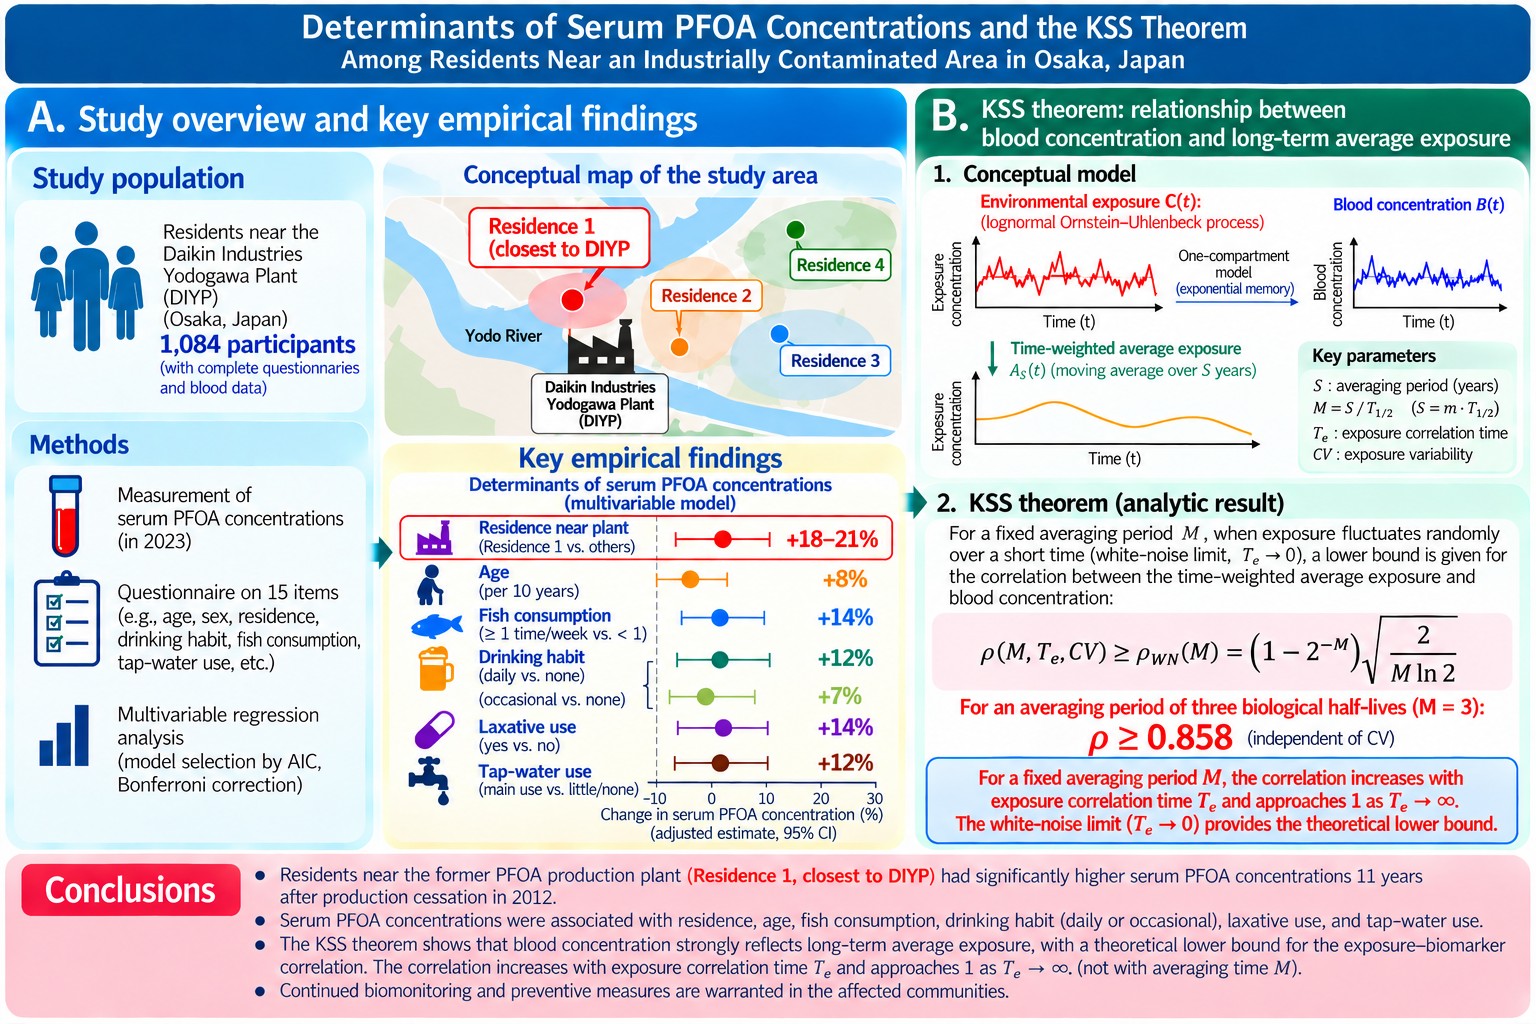
Background: In 2023, community-initiated biomonitoring was conducted among residents near the Daikin Industries Yodogawa Plant (DIYP), where PFOA contamination had previously been identified. Methods: Serum PFOA and questionnaire data were analyzed in 1,174 participants; 1,084 had complete data for 15 prespecified variables. Log10(PFOA) was modeled using multivariable regression, with model selection by AIC and Bonferroni correction. A sensitivity analysis excluded six consumers of self-grown agricultural products. We also theoretically examined the relationship between serum concentration and time-weighted average exposure using a one-compartment model with a lognormal Ornstein–Uhlenbeck exposure process. Results: Residence, age, fish consumption, drinking habit, laxative use, and tap-water use were significant determinants. Residents nearest DIYP had a geometric mean PFOA concentration of 5.95 ng/mL and adjusted concentrations 18%–21% higher than other areas. Predicted and observed stratum means were strongly correlated (r=0.927). Results remained significant in sensitivity analysis. The theoretical analysis showed that the white-noise limit provides a global lower bound for the serum–exposure correlation; for averaging over three biological half-lives, ρ≥0.858. Conclusions: Elevated PFOA near DIYP suggests that local exposure may have persisted after production ceased in 2012. Continued biomonitoring is warranted.
Keywords:
PFOA-producing plant
; PFOA biomonitoring
; Ornstein-Uhlenbeck process
; lower bound theorem
; time-weighted average
; residence area
; drinking habit
; laxatives
; fish consumption
; local vegetable consumption
1. Introduction
Perfluorooctanoic acid (PFOA) is a representative member of the more than 10,000 per- and polyfluoroalkyl substances (PFAS) and, together with perfluorooctane sulfonate (PFOS), is classified as a legacy PFAS. PFOA has been called a 'forever chemical' because of its exceptional chemical stability and useful properties, including heat resistance, water repellency, and amphiphilicity. It was manufactured worldwide beginning in the 1960s. By the 2000s, however, concerns had increased regarding environmental persistence and bioaccumulation, and production was discontinued in many countries during the 2010s. By then, environmental contamination had already occurred, and community contamination had been documented in the United States [1], European countries [2], China [3], and elsewhere.
In Japan, environmental contamination attributable to PFOA production at the Daikin Industries Yodogawa Plant (DIYP) was identified in the early 2000s in the Yodo and Ai River basins of Osaka Prefecture, with substantial contamination extending through the Yodo River system to Osaka Bay [4]. Subsequent investigations documented contamination of groundwater [5], soil, and locally grown agricultural products [6].
PFOA is now listed under the Stockholm Convention on Persistent Organic Pollutants and is regulated in Japan, where its manufacture, sale, and import are prohibited. The US Environmental Protection Agency (EPA) has cited epidemiological evidence concerning immunotoxicity, impaired fetal and neonatal growth, altered lipid metabolism, and kidney cancer. With particular emphasis on prevention of immune effects, while also addressing carcinogenicity and developmental effects, the EPA established a stringent drinking-water maximum contaminant level of 4 ng/L for PFOA [7]. In 2023, the International Agency for Research on Cancer (IARC) reclassified PFOA from Group 2B to Group 1, carcinogenic to humans [8]. In Japan, because epidemiological evidence for human health effects was considered insufficiently definitive, a tolerable daily intake of 20 ng/kg/day was established primarily on the basis of reduced fetal body-weight gain in animal studies [9].
The US National Academies has recommended a combined serum or plasma PFAS concentration of 20 ng/mL for seven PFAS, including PFOA and PFOS, as a level at which clinical follow-up should be considered [10]. Serum PFAS concentrations integrate exposure from multiple pathways, including drinking water, outdoor and indoor environments, and food, and have therefore been widely used for exposure assessment. Serum concentrations can vary not only with contamination of community drinking-water sources but also with demographic factors such as age, sex, and BMI and with behavioral or dietary factors such as consumption of local vegetables and fish, use of local fishery resources, and use of personal-care products [11,12,13,14].
One-compartment models have been applied for dosimetry to quantitatively relate adult serum concentrations to external exposure [15]. In contrast, physiologically based pharmacokinetic (PBPK) models have been developed to investigate more detailed toxicokinetic mechanisms, including target-organ concentrations [16]. Studies in contaminated drinking-water areas along the Ohio River [17] and in Veneto [12] showed that serum PFOA concentrations declined according to biological half-life after exposure reduction, supporting the utility of one-compartment models for dosimetric evaluation of remediation effects.
The first objective of this study was to characterize current serum PFOA concentrations among residents living around DIYP in Settsu City, Osaka Prefecture, where PFOA contamination has been documented. PFOA had been produced at DIYP since the 1970s, and production ceased in 2012. Although elevated exposure among nearby residents had been reported before production cessation [18,19,20], serum concentrations 11 years after cessation had not been characterized.
Serum concentration is widely used as an index of PFOA exposure, but the duration of time-weighted average (TWA) exposure represented by a serum measurement has not been established theoretically. Multiplying a TWA concentration by its averaging duration yields cumulative exposure over that period; therefore, the correlation between serum concentration and TWA exposure is important for interpreting exposure intensity. The Koizumi-Sekiguchi theorem [21] addresses this correlation, but it was originally developed for occupational exposure over an 8-h workday. Our second objective was therefore to establish a more general toxicokinetic framework applicable to exposure scenarios extending over years. This framework provides a theoretical basis for interpreting serum concentrations in relation to the persistence of community contamination around DIYP after production ceased.
2. Subjects and Methods
2.1. Study Design and Participants
In 2023, a community-initiated serum PFAS biomonitoring campaign was conducted in northern Osaka Prefecture, including Settsu City and Higashiyodogawa Ward, where DIYP is located, in collaboration with Kyoto University and Osaka Min-iren, a social movement organization comprising public-interest entities that operate hospitals, 47 clinics, and medical, nursing, and long-term-care facilities in Osaka Prefecture [6].
The campaign was conducted from September through December 2023 and primarily targeted current residents of northern Osaka Prefecture and people working in the area. Because the campaign was broadly publicized through local mass media, a participation rate could not be calculated. Accordingly, the number of individuals who actually provided blood samples was used as the denominator for the analytical population. Blood collection was conducted at 39 sites, most of which were community clinics or hospitals. Current and former DIYP employees were excluded from the present analysis.
At blood collection, 12-15 mL of venous blood was obtained from the median cubital vein. Participants were also asked to complete a self-administered questionnaire.
The questionnaire collected date of birth, height, weight, residential history, medical history (including thyroid disease, dyslipidemia, heart disease, liver disease, diabetes, hypertension, ulcerative colitis, allergy, testicular cancer, kidney cancer, and pregnancy-related disorders), laxative use, smoking history, drinking habits, tap-water use, use of well water for drinking, water-filter use, consumption of locally produced agricultural products, use of well water to grow consumed produce, seafood consumption, consumption of fish from Osaka Bay, shellfish consumption frequency, and history of aqueous film-forming foam (AFFF) use. Age was calculated from date of birth at the time of blood collection. Questionnaires were checked on site when received, and participants were asked to correct obvious errors or complete omitted items whenever possible.
2.2. Measurement of Serum PFOA Concentrations
Serum was separated by conventional centrifugation. Serum PFOA concentrations (ng/mL) were measured by gas chromatography-mass spectrometry (GC-MS) as previously described [22].
For GC-MS analysis, 0.10 mL of serum was mixed with 0.4 mL acetonitrile and a surrogate standard solution (EPA-533ES; Wellington Laboratories, Canada). Precipitated proteins were removed by centrifugation, and the supernatant was evaporated to dryness under a nitrogen stream.
Bis(4-tert-phenyl)iodonium hexafluorophosphate (tBPI; Tokyo Chemical Industry, Japan) was used as the in-port derivatization reagent. Each sample extract was dissolved in 1% (w/v) tBPI in acetone and transferred to a glass vial. A 1-uL aliquot was injected into an Agilent 6890N GC at an inlet temperature of 300 degrees C under splitless conditions.
PFOA was separated on a DB-5MS column (30 m x 0.25 mm internal diameter, 0.25 um film thickness).
PFOA was detected using a 5973N inert mass spectrometer with methane negative chemical ionization [22]. The analytical value used in this study was the sum of linear and branched PFOA isomers.
2.3. Statistical Analysis
Statistical analyses were performed using Statistica [23] and Python [24]. Serum PFOA concentrations were log10-transformed for regression analyses. If a PFOA concentration was below the limit of detection (0.1 ng/mL), one-half the detection limit (0.05 ng/mL) was assigned. Medical-history outcomes were not included as explanatory variables in the present determinant analysis.
Determinants of serum PFOA concentration were evaluated using linear regression models with log10(PFOA) as the dependent variable. The following explanatory variables were prespecified.
Continuous or ordinal variables were: (1) BMI; (2) AgeClass (<50 years = 1, 50-59 = 2, 60-69 = 3, 70-79 = 4, >=80 = 5); (3) drinking habit (Drink: never = 1, occasional = 2, habitual = 3); (4) fish consumption (FishCons); and (5) shellfish consumption (ShellCons). FishCons and ShellCons were each coded in six frequency categories: <1 time/month = 1, 1-3 times/month = 2, 1-2 times/week = 3, 3-4 times/week = 4, 5-6 times/week = 5, and daily or more = 6.
Categorical variables were: (6) Residence (Residence 1: Settsu City plus Higashiyodogawa Ward; Residence 2: Toyonaka, Ikeda, Minoh, Suita, Ibaraki, Takatsuki, Shimamoto, Moriguchi, and Neyagawa; Residence 3: Osaka City excluding Higashiyodogawa Ward; Residence 4: other areas of Osaka Prefecture); (7) Sex (male = 1, female = 2); (8) Laxative use (yes = 1, no = 2); (9) Tobacco use (never = 1, former = 2, current = 3); (10) TapWater use for drinking (yes = 1, no = 2); (11) WellUse, use of well water for drinking (yes = 1, no = 2); (12) VegWell, use of well water for vegetable farming (yes = 1, no = 2, do not know = 3); (13) WaterFilter water filter use (yes = 1, no = 2); (14) Veg, consumption of locally produced vegetables (yes = 1, no = 2); (15) OsakaFish, consumption of fish caught in Osaka Bay (yes = 1, no = 2); and (16) history of AFFF use (yes = 1, no = 2, do not know = 3). Variables with valid responses from at least 80% of participants were retained for regression analysis. Significance of each variable was evaluated using a likelihood-ratio chi-square test (LRT-Chi2), with a Bonferroni-corrected alpha of 0.05 divided by the number of retained variables. Regression analyses were restricted to complete cases; no imputation was performed.
First, Model 1 assumed a common residual variance across residence groups:
Model 1:
The analysis was then repeated using Model 2, which allowed residual variance to differ by residence group:
Model 2:
These two models were fitted to the data. Model selection was based primarily on the Akaike information criterion (AIC), with the lower AIC indicating the preferred model [25]. AIC was also used to compare normal and log-normal distributional fits for serum PFOA. Log-likelihood values were calculated as supporting information, but AIC was the primary model-selection criterion.
Differences among residence groups in age, BMI, PFOA, and log10(PFOA) were evaluated by one-way analysis of variance (ANOVA). When the overall test was significant at p < 0.05, pairwise comparisons were performed using the Scheffe post hoc test with a significance level of 0.05. Comparisons of geometric mean PFOA concentrations were conducted on the log10-transformed scale.
To evaluate potential selection associated with questionnaire completeness, age, BMI, PFOA, and log10(PFOA) were compared between complete and excluded participants using Welch's t-test, and sex distributions were compared using the chi-square test.
As a sensitivity analysis, participants who consumed self-grown agricultural products were excluded to assess whether these participants influenced the residence effect.
3. Results
3.1. Demographic Characteristics
A total of 1,190 individuals initially participated. After excluding 12 nonresidents of Osaka Prefecture and four current or former Daikin workers, 1,174 participants remained (Figure 1). Table 1 summarizes their demographic characteristics. The overall sex distribution was approximately 30%-40% male and 60%-70% female. Mean age was 63.3 years overall, ranging from 66.8 years in Residence 1 to 56.4 years in Residence 4. Mean BMI was 23.0 kg/m2 and was similar across the four residence groups. Overall serum PFOA had an arithmetic mean (SD) of 5.93 (6.04) ng/mL and a geometric mean (GSD) of 4.80 (1.86) ng/mL (Table1).
The difference in AIC between the normal and log-normal models was 1656.6 in favor of the log-normal model, which also had the higher log-likelihood (Figure S1, Table S1). Therefore, subsequent analyses used log10(PFOA). PFOA was detected in 100% of participants. Serum PFOA differed significantly among residence groups; Residence 1 had significantly higher arithmetic and geometric mean concentrations than each of Residences 2-4 (overall ANOVA and Scheffe post hoc comparisons, p < 0.0001; Table 1). The coefficient of variation was <1.3 in each residence group.
The questionnaire item on use of well water for vegetable farming had only 469 valid responses and did not meet the prespecified >=80% response-rate criterion; it was therefore excluded. The remaining 15 variables were analyzed, giving a Bonferroni-corrected significance threshold of 0.05/15 = 0.0033. After excluding 90 participants with missing data for one or more required variables, 1,084 complete cases were included in the main regression analysis. The 1,084 complete cases and the 90 excluded participants did not differ significantly in age, sex, BMI, or serum PFOA concentration (Table S2). Questionnaire completion rates across the four residence groups ranged from 90.3% to 93.9% and did not differ significantly (chi-square = 2.30, df = 3, p = 0.512).
3.2. Application of Generalized Least-Squares Models
Model 1 was first fitted with log10(PFOA) as the dependent variable (Table S3). Seven variables were significant at the Bonferroni-corrected level: AgeClass, FishCons, Residence, Drink, Laxative, TapWater, and WaterFilter. BMI, ShellCons, Sex, Tobacco, WellUse, Veg, OsakaFish, and AFFF were not significant.
Model 2, which allowed residence-specific residual variances, was then fitted (Table S4). Six variables were significant: AgeClass, FishCons, Residence, Drink, Laxative, and TapWater. The AIC decreased from -138.79 for Model 1 to -151.32 for Model 2, and Model 2 also had the higher log-likelihood (Table S5). Model 2 was therefore selected for the main analysis.
Using the selected Model 2, the effects of the six significant determinants on serum log10(PFOA) were estimated (Table 2). Residence 1 was associated with approximately 18%-21% higher PFOA concentrations than the other residence groups. Laxative use was associated with an approximately 18% lower concentration, and avoiding tap water use for drinking was associated with an approximately 13% lower concentration. Each one-category increase in AgeClass was associated with an approximately 21% increase, each category increase in FishCons with an approximately 11% increase, and each category increase in Drink with an approximately 7% increase.
Using the significant predictors (AgeClass, FishCons, Residence, Drink, Laxative, and TapWater), individual predicted values were calculated and summarized together with observed values by age class and residence. Across the 20 residence-by-age-class strata, predicted and observed mean log10(PFOA) values were strongly correlated (Pearson r = 0.927, p = 4.46 x 10⁻⁹; Figure 2A). Figure 2B shows age-class profiles of observed mean log10(PFOA) +/- 1 SD and predicted mean log10(PFOA) for each residence group. Agreement was particularly strong in Residences 1-3. In Residence 4, the correlation was high (approximately 0.80) but was not statistically significant. Stratum-specific observed values, SDs, and predicted values are presented in Table S6.
3.3. Sensitivity Analysis
A sensitivity analysis was then conducted after excluding six prespecified participants who consumed self-grown agricultural products. Among the remaining 1,168 participants, the arithmetic mean (SD) and geometric mean (GSD) serum PFOA concentration in Residence 1 decreased from 8.11 (10.48) and 5.95 (2.02) ng/mL to 6.85 (4.54) and 5.67 (1.86) ng/mL, respectively (Table S7), but Residence 1 remained significantly higher than the other residence groups by ANOVA. Regression analyses were performed among 1,078 complete cases using Model 1 (Table S8) and Model 2 (Table S9). The AIC values were -237.4 for Model 1 and -237.0 for Model 2; although Model 2 had a slightly higher log-likelihood, Model 1 had the slightly lower AIC and was selected for the sensitivity analysis (Table S10). In both models, the same six variables identified in the main analysis remained significant: AgeClass, FishCons, Residence, Drink, Laxative, and TapWater; WaterFilter was additionally significant. In the selected Model 1, the Residence 1 effect was approximately 14%-18%, and WaterFilter use was associated with an approximately 13% reduction in serum PFOA (Table 3).
Predicted and observed mean values across the 20 residence-by-age-class strata remained strongly correlated (r = 0.925, p = 5.68 x 10⁻⁹; Figure 3A), and the residence-specific age profiles showed close agreement between observed and predicted values (Figure 3B). The Residence 4 correlation was not statistically significant. Stratum-specific observed values, SDs, and predicted values are shown in Table S11.
4. Theoretical Analysis
An important question in biomonitoring is the duration of exposure for which a serum concentration is strongly correlated with the time-weighted average exposure concentration. Multiplying a TWA concentration by the averaging duration gives cumulative exposure over that period. Thus, when blood is used for exposure monitoring, it is important to know the period of TWA exposure - and therefore cumulative exposure - for which the serum concentration can serve as an indicator.
The Koizumi-Sekiguchi (KS) theorem [21] theoretically predicts the correlation between a TWA exposure and the concentration in a compartment when exposure concentration is modeled as a stochastic process. The original theorem assumes that exposure follows a normally distributed Ornstein-Uhlenbeck (OU) process, that fluctuations in airborne concentration occur on a time scale much shorter than the biological half-life, and that the process is stationary. Under those assumptions, a TWA over approximately two biological half-lives can have a correlation >0.9 with the compartment concentration. Environmental PFAS concentrations, however, are often approximately log-normally distributed, and their correlation time may not be negligible relative to biological half-life. We therefore retained stationarity but derived a new exact solution under more general conditions.
The exact mathematical results are summarized below as the Koizumi-Sekiguchi-Shiota (KSS) Theorem 1, two corollaries, and the global lower-bound theorem.
4.1. Koizumi-Sekiguchi-Shiota (KSS) Theorem 1: Exact Correlation between Serum Concentration and Time-Weighted Average Exposure under Lognormal OU Exposure
The concept of treating temporally varying exposure concentration as a stochastic process was introduced into occupational health by Roach (1966) [26]. Mathematically, the OU process is a classical Gaussian Markov process related to Brownian motion [27]. The discrete-time stochastic process considered by Roach corresponds, in continuous time, to an OU process, as previously shown [21]. Here we use this continuous-time representation to analyze the relationship between exposure concentration and serum concentration.
Let the exposure concentration be
C(t) = exp{X(t)} (1)
where X(t) is a stationary Gaussian OU process satisfying
E[X(t)] = μ, Var[X(t)] = σ2, (2)
(3)
Here, Te > 0 is defined as the exposure correlation time: the autocorrelation of log exposure decays exponentially with time lag Te, at which the autocorrelation equals e−1and decreases to at Teln2. Let the biological half-life be T1/2 and define
(4)
Under a one-compartment model, we define serum concentration as
(5)
and define the time-weighted average exposure over the preceding interval of length S as
(6)
For each n ≥ 1, we define
(7)
and let
(8)
(9)
(10)
Then
(11)
Furthermore, each integral can be written explicitly in terms of Te
(12)
(13)
(14)
For the exceptional parameter value λn = k, at which a denominator vanishes, the corresponding continuous limit is used. The coefficient of variation of the lognormal exposure distribution is
(15)
Also, if we define
(16)
then, the correlation coefficient is independent of the parameter μ and is determined only by M, and CV. We denote it compactly below as ρ(M,Te,CV), with dependence on Te occurring through the relevant dimensionless ratioTe/T1/2. See Supplement 1 for the proof.
4.2. Corollary 1: White-Noise Limit
Keeping constant, let the exposure correlation time tend to zero Te ↓ 0. Then
(17)
This limit is independent of exposure variability CV. Thus, in the white-noise limit, the correlation coefficient is determined only by M, the ratio of averaging duration S to biological half-life T1/2. See Supplement 2 for the proof.
In particular,
(18)
(19)
4.3. Corollary 2: Limit of Extremely Slowly Varying Exposure
Keep M and CV constant and let Te → ∞. Then, for every finite time lag τ
(20)
and therefore
(21)
Thus, when exposure varies sufficiently slowly relative to both the biological half-life T1/2 and averaging duration S, AS(t) and B(t) are governed by essentially the same slowly varying exposure level, and their correlation approaches 1. See Supplement 3 for the proof.
4.4. Koizumi-Sekiguchi-Shiota (KSS) Theorem 2: Global Lower-Bound Theorem
Under the assumptions of Theorem 1, for any
M > 0, Te > 0, 0 < CV < ∞ (22)
we have
(23)
Moreover, by Corollary 1, equality is approached in the white-noise limit Te ↓ 0. Therefore, including that limiting case,
ρWN(M) ≤ ρ(M,Te,CV) ≤ 1. (24)
This lower bound is independent of exposure variability CV. In other words, within the class of lognormal OU exposures, the correlation for any finite exposure correlation time cannot be lower than the white-noise-limit correlation. See Supplement 4 for the proof.
For an averaging duration equal to three biological half-lives, Corollary 1 gives a lower bound of 0.85812 (Eq. 19). This high lower bound indicates that cumulative exposure over approximately three biological half-lives is strongly reflected in the current serum concentration.
5. Discussion
5.1. Major Findings and Contributions
Many studies have investigated determinants of serum PFAS concentrations [11,12,13,14]. In the present study, age, fish consumption, residence, drinking habit, laxative use, and tap-water use for drinking were identified as significant determinants of serum PFOA; WaterFilter use was additionally identified in the sensitivity analysis. Age, fish consumption, and drinking habit have been reported previously [11,12,13,14] and were confirmed here. Laxative use was a newly identified determinant. We also found that living near DIYP remained associated with higher serum PFOA concentrations more than a decade after PFOA production ceased in 2012. This raises the question of whether the elevated concentrations reflect continuing local exposure, residual body burden from historical exposure, or both.
We therefore considered theoretically how far back in time the serum concentration at blood collection represents exposure. Both one-compartment and PBPK models have been used for PFOA toxicokinetics [15]. PBPK models can provide valuable information for toxicity assessment, including target-organ concentrations. However, tissue uptake and elimination of PFOA involve active transport processes [28], and the complete organ-specific transporter system remains incompletely characterized. For dosimetry, where serum concentration is treated as the response to external exposure, one-compartment models have been shown to provide useful approximations [12,17]. Under this framework, the KSS theorem derived here can be applied.
The KSS theorem evaluates the correlation between two different linear filters of a lognormal OU exposure process: the one-compartment serum concentration and the TWA exposure, indicating that the mathematical operation is elementary once the covariance structure is specified. Given that one-compartment models are widely used in chemical exposure assessment, an exact stochastic-process formulation directly linking biomonitoring to TWA exposure has been lacking. We therefore formulate the result as the KSS theorem to emphasize the theoretical basis of one-compartment biomonitoring. When biological half-life is used as the time scale, the theorem proves that the white-noise limit - the most rapidly fluctuating exposure considered - provides a global lower bound for the correlation. For an averaging duration of three biological half-lives, the correlation is at least 0.858. If the PFOA biological half-life is approximately 2.2-3 years [6,12,17], current serum PFOA is therefore strongly correlated with TWA exposure over approximately 7-9 years. For blood collected in 2023, this interval extends back to roughly the early-to-mid 2010s, overlapping the period when DIYP ceased PFOA production. The higher serum PFOA in Residence 1 is therefore consistent with greater cumulative exposure during the post-cessation period, although serial follow-up is needed to determine the temporal trajectory.
Tap-water use and water-filter use may reflect continuing contributions from PFOA in drinking water. Drinking habit has previously been considered a possible marker of exposure through beverages produced with contaminated water [12]. However, the C8 study also observed a longer PFAS biological half-life among habitual drinkers after contaminated water exposure had been reduced [17], suggesting that biological mechanisms may also contribute. Animal studies have identified the apical sodium-dependent bile acid transporter (ASBT) as a transporter involved in intestinal handling of PFAS [29], and ASBT-related enterohepatic bile-acid transport can be altered by alcohol exposure [30]. These observations raise the hypothesis that PFAS exposure and habitual alcohol consumption could modify intestinal reabsorption and thereby influence serum PFOA kinetics. This mechanism remains speculative and requires direct investigation.
Laxative use was a novel determinant associated with lower serum PFOA. One possible mechanism is enhanced fecal elimination through interruption of enterohepatic recirculation, analogous in principle to the effect of bile-acid-binding resins. Anion-exchange treatment has been reported to substantially reduce serum PFAS concentrations [32]. Laxatives can increase fecal output and, depending on their type, may alter bile-acid excretion [33]; dietary fiber interventions have also reduced PFAS body burden in animal experiments [34]. Because PFOA and PFOS are excreted into bile and can undergo intestinal reabsorption and enterohepatic circulation in humans [35], enhanced fecal elimination is biologically plausible. However, the questionnaire did not identify the specific laxative products used, so the mechanism cannot be established from the present data.
Several local exposure pathways could contribute to the Residence 1 effect. As previously reported, some residents consume agricultural products grown in PFOA-contaminated soil, including water-rich vegetables such as Chinese cabbage, eggplant, and daikon radish [6]. Excluding six clearly identified consumers of self-grown agricultural products reduced both the mean and variability of serum PFOA in Residence 1, but the residence difference remained. Thus, self-grown produce explains only part of the observed geographic pattern, and exposure through locally produced and marketed vegetables cannot be excluded. Atmospheric dispersion of PFOA has also been documented in this area [20]. PFOA transported from outdoor air may have accumulated indoors, and our previous study found higher PFOA concentrations in household dust near the plant [36]. Detailed investigation of exposure from local foods and the indoor environment is therefore warranted.
5.2. Limitations and Strengths
This study has several important limitations. First, because the questionnaire was self-administered, omissions and recall errors regarding past and current lifestyle factors are possible. Second, a participation rate could not be calculated for the community blood-monitoring campaign. Third, the determinant analysis assumed linear relationships with log10(PFOA), and possible nonlinear associations were not examined. Fourth, the questionnaire did not identify specific laxative products or detailed information on alcoholic beverages, limiting evaluation of the mechanisms underlying these associations. Fifth, although observed and predicted values agreed well in Residences 1-3, the Residence 4 correlation was not statistically significant, indicating a limitation of the prediction model in that group. Finally, residential history could not be incorporated into the present determinant analysis.
This study also has several strengths. Participation from residents throughout Osaka Prefecture enabled confirmation of biological and lifestyle determinants of serum PFOA, including age and fish consumption, within a broad regional population. The main and sensitivity analyses consistently identified a Residence 1 effect even after exclusion of six participants with clearly documented consumption of self-grown agricultural products, supporting the robustness of the geographic finding. In addition, the KSS theorem provides a stochastic-process basis for interpreting current serum concentrations in relation to cumulative exposure over a period on the order of several biological half-lives. Applied to the present findings, this framework supports the interpretation that residents of Residence 1 experienced greater cumulative PFOA exposure during the years following production cessation. The observed associations with drinking habit and laxative use also generate hypotheses concerning enterohepatic transport that merit further biological investigation.
6. Conclusions
Among residents of Osaka Prefecture, serum PFOA concentrations were significantly associated with six determinants in the main analysis: age class, fish consumption, residence, drinking habit, laxative use, and tap-water use for drinking. Water-filter use was additionally significant in the sensitivity analysis. After exclusion of six participants who consumed self-grown agricultural products, the mean and variance of serum PFOA in Residence 1 decreased, but the residence difference persisted, suggesting that locally grown produce may contribute to exposure while other area-specific pathways also remain possible. Serum PFOA concentrations were higher in Residence 1, the area nearest DIYP. The KSS lower-bound theorem indicates that current serum concentrations are strongly correlated with TWA exposure over a period of approximately three biological half-lives. Accordingly, the Residence 1 finding is consistent with greater cumulative exposure during the years after DIYP ceased PFOA production. Continued biomonitoring is warranted to determine whether serum concentrations decline over time.
Supplementary Materials
The following supporting information can be downloaded at the website of this paper posted on Preprints.org.
Author Contributions
Conceptualization and methodology, O.T., K.K., and K.A.; software, K.A.; data curation, K.A.; validation, K.K.; formal analysis, K.A.; Mathematical investigation, K.A., S.T., and S.Y.; Serum PFOA GC/MS analysis, HKH.; writing—original draft preparation, K.A., O.T., K.K., S.T., and S.Y.; writing—review and editing, O.T., K.K., H.H.K., A.H., O.H., N.K., S.T., S.Y., and KA; funding acquisition, OT and KK. All authors have read and agreed to the published version of the manuscript.
Funding
Personnel, equipment, and venue costs for the community blood-testing campaign and informational meetings were supported by Osaka Min-iren and related participating organizations. Chemical analysis was supported by the Takagi Fund to HKH (No. 226-002).
Institutional Review Board Statement and Informed Consent
The study protocol was approved by the Ethics Committee of Kyoto University Graduate School and Faculty of Medicine and Kyoto University Hospital (latest approval No. R1478; approved 14 September 2023) and by the Ethics Committee of the Yodogawa Workers' Welfare Association (approval No. 2023-Rin-31; approved March 2024). Written informed consent was obtained from all participants. The study was conducted in accordance with the principles of the Declaration of Helsinki.
Data Availability Statement
The data presented in this study are available on request from the corresponding author. Individual-level participant data are not publicly available because of privacy.
Acknowledgments
We acknowledge the cooperation provided by clinical staff in Osaka Miniren to recruit participants and blood sampling. Special thanks will be given to Mr. Nagase Fumio (Yodogawa Kinroushakousei Association), Mr. Kondo Satoshi (Osaka Miniren), and Ms. Nagaoka Yuriko for their dedicated support. During the preparation of this work, the authors used ChatGPT (OpenAI) for language editing, document formatting, and Table/Figure production. After using these tools, the authors reviewed and edited all outputs as needed; all statistical specifications, code, numerical results, and interpretations were independently checked and validated by the authors, who take full responsibility for the content of this publication.
Conflict of interests
The authors declare no conflicts of interest.
Abbreviations
The following abbreviations are used in this manuscript:
| AFFF | Aqueous Film Forming Foam |
| AgeClass | Age Class |
| AIC | Akaike’s Information Criteria |
| ANOVA | Analysis of Variance |
| ASBT | Apical Sodium-dependent Bile Acid Transporter |
| BMI | Body Mass Index |
| CV | Coefficient of variation |
| DIYP | Daikin Industry Yodogawa Plant |
| EPA | Environmental Protection Agency |
| FishCons | Fish Consumption |
| GC-MS | Gas Chromatography Mass Spectrometry |
| IARC | International Agency of Research on Cancer |
| LRT-Chi2 | Likeihood ratio Chi-Square test |
| OsakaFish | Fish caught in the Osaka Bay |
| OU process | Orstein Uhlenbeck Process |
| PBPK | Physiologically based pharmacokinetic modeling |
| PFAS | Polyfluoro and Perfluoroalkyl substance |
| PFOA | Perfluorooctanoic Acid |
| PFOS | Perfluorooctane sulfonate |
| POPs | Persistent organic pollutants |
| ShellCons | Shell Consumption |
| TapWater | Tap water use for drinking water |
| TDI | Tolerable Daily Intake |
| TWA | Time Weighted Average |
| VegWell | Well water use for Vegetable farming |
References
- Hoffman, K.; Webster, T.F.; Bartell, S.M.; Weisskopf, M.G.; Fletcher, T.; Vieira, V.M. Private drinkng water wells as a souce of exposure to perfluoro octanoic acid (PFOA) in communities srrounding a fluoropolymer production facikity. 2010 Environ. Health Perspect. 119, 92–97. [CrossRef] [PubMed]
- Gebbink, W.A.; Van Leeuwen, S.P.J. Environmental Contamination and human exposure to PFASs near a fluorochemical production plant: Review of historic and current PFOa abd GenX contamination in the Netherlands. Environ. Int. 2020, 137, 105583. [Google Scholar] [CrossRef] [PubMed]
- Li, J.; Duan, W.; An, Z.; Jiang, Z.; Li, L.; Guo, M.; Tan, Z.; Zeng, X.; Liu, X.; Liu, Y.; Li, A.; Guo, H. Legacy and alternative per- and polyfluoroalkyl substances spatiotemporal distribution in China: Human exposure, environmental media, and risk assessment. J. Hazard. Mater. 2024, 480, 135795. [Google Scholar] [CrossRef] [PubMed]
- Saito, N.; Harada, K.; Inoue, K.; Sasaki, K.; Yoshinaga, T.; Koizumi, A. Perfluorooctanoate and perfluorooctane sulfonate concentrations in surface water in Japan. Occup. Health 2004, 46(1), 49–59. [Google Scholar] [CrossRef] [PubMed]
- Shiwaku, Y.; Lee, P.; Thepaksorn, P.; Zheng, B.; Koizumi, A.; Harada, K.H. Spatial and temporal trends in perfluorooctanoic and perfluorohexanoic acid in well, surface, and tap water around a fluoropolymer plant in Osaka, Japan Chemosphere. Epub. 2016, 164, 603–610. [Google Scholar] [CrossRef] [PubMed]
- Kanetani, K.; Nakamura, N.; Harada, K.H.; Akihisa, H.; Oshima, T.; Ogata, O.; Koizumi, A. High serum perfluorooctanoic acid (PFOA) concentrations and interstitial lung disease in former and current workers in a fluorochemical company Ind Health. Epub. 2025, 63(5), 490–502. [Google Scholar] [CrossRef] [PubMed]
- US EPA. Available online: https://www.epa.gov/newsreleases/epa-announces-it-will-keep-maximum-contaminant-levels-pfoa-pfos.
- IARC Monographs evaluate the carcinogenicity of perfluorooctanoic acid (PFOA) and perfluorooctanesulfonic acid (PFOS). Available online: https://www.iarc.who.int/news-events/iarc-monographs-evaluate-the-carcinogenicity-of-perfluorooctanoic-acid-pfoa-and-perfluorooctanesulfonic-acid-pfos/.
- Food Safety Commission of Japan. Available online: https://www.fsc.go.jp/fsciis/evaluationDocument/show/kya20240625001.
- Board on Population Health and Public Health Practice; Board on Environmental Studies and Toxicology; Committee on the Guidance on PFAS Testing and Health Outcomes. Consensus/Advisory Activity Guidance on PFAS Testing and Health Outcomes. Natl. Acad. Sci. Eng. Med. 2022. [Google Scholar]
- Batzella, E.; Rosato, I.; Pitter, G.; Da Re, F.; Russo, F.; Canova, C.; Fletcher, T. Determinants of PFOA Serum Half-Life after End of Exposure: A Longitudinal Study on Highly Exposed Subjects in the Veneto Region. Environ. Health Perspect. 2024, 132(2), 27002. [Google Scholar] [CrossRef] [PubMed]
- Lahne, H.; Gerstner, D.; Völkel, W.; Schober, W.; Aschenbrenner, B.; Herr, C.; Heinze, S.; Quartucci, C. Human biomonitoring follow-up study on PFOA contamination and investigation of possible influencing factors on PFOA exposure in a German population originally exposed to emissions from a fluoropolymer production plant. Int. J. Hyg. Environ. Health Epub. 2024, 259, 114387. [Google Scholar] [CrossRef] [PubMed]
- Riou, J.; Rime, C.F.; von Goetz, N.; Nussle, S.G.; Jaus, A.; Largiadèr, C.R.; Zwahlen, M.; Bochud, M. Diet, lifestyle, and sociodemographic influences on serum concentration of PFASs: Insights from human biomonitoring in Switzerland. Environ. Int. Epub. 2026, 211, 110251. [Google Scholar] [CrossRef] [PubMed]
- Thépaut, E.; Dirven, H.A.A.M.; Haug, L.S.; Lindeman, B.; Poothong, S.; Andreassen, M.; Hjertholm, H.; Husøy, T. Per- and polyfluoroalkyl substances in serum and associations with food consumption and use of personal care products in the Norwegian biomonitoring study from the EU project. EuroMix Environ. Res. 2021, 195, 110795. [Google Scholar] [CrossRef] [PubMed]
- East, A.; Dawson, D.E.; Brady, S.; Vallero, D.A.; Tornero-Velez, R. A Scoping Assessment of Implemented Toxicokinetic Models of Per- and Polyfluoro-Alkyl Substances, with a Focus on One-Compartment Models Toxics. 2023, 11(2), 163. [Google Scholar] [CrossRef] [PubMed]
- Verner, M.A.; Loccisano, A.E.; Morken, N.H.; Yoon, M.; Wu, H.; McDougall, R.; Maisonet, M.; Marcus, M.; Kishi, R.; Miyashita, C.; Chen, M.H.; Hsieh, W.S.; Andersen, M.E.; Clewell, H.J., 3rd; Longnecker, M.P. Associations of Perfluoroalkyl Substances (PFAS) with Lower Birth Weight: An Evaluation of Potential Confounding by Glomerular Filtration Rate Using a Physiologically Based Pharmacokinetic Model (PBPK)Environ Health Perspect. 2015, 123(12), 1317–24. [Google Scholar] [CrossRef] [PubMed]
- Bartell, S.M.; Calafat, A.M.; Lyu, C.; Kato, K.; Ryan, P.B.; Steenland, K. Rate of decline in serum PFOA concentrations after granular activated carbon filtration at two public water systems in Ohio and West Virginia. Environ. Health Perspect. 2010, 118(2), 222–8. [Google Scholar] [CrossRef] [PubMed]
- Harada, K.; Koizumi, A.; Saito, N.; Inoue, K.; Yoshinaga, T.; Date, C.; Fujii, S.; Hachiya, N.; Hirosawa, I.; Koda, S.; Kusaka, Y.; Murata, K.; Omae, K.; Shimbo, S.; Takenaka, K.; Takeshita, T.; Todoriki, H.; Wada, Y.; Watanabe, T.; Ikeda, M. Historical and geographical aspects of the increasing perfluorooctanoate and perfluorooctane sulfonate contamination in human serum in Japan Chemosphere. Epub. 2007, 66(2), 293–301. [Google Scholar] [CrossRef]
- Kärrman, A.; Harada, K.H.; Inoue, K.; Takasuga, T.; Ohi, E.; Koizumi, A. Relationship between dietary exposure and serum perfluorochemical (PFC) levels--a case study. Environ. Int. Epub. 2009, 35(4), 712–7. [Google Scholar] [CrossRef] [PubMed]
- Niisoe, T.; Harada, K.H.; Ishikawa, H.; Koizumi, A. Long-term simulation of human exposure to atmospheric perfluorooctanoic acid (PFOA) and perfluorooctanoate (PFO) in the Osaka urban area. Jpn. Sci. Technol. 2010, 44(20), 7852–7. [Google Scholar] [CrossRef] [PubMed]
- Koizumi, A.; Sekiguchi, T.; Konno, M.; Ikeda, M. Evaluation of the time weighted average of air contaminants with special references to concentration fluctuation and biological half. Am. Ind. Hyg. Assoc. J. 1980, 41(10), 693–9. [Google Scholar] [CrossRef] [PubMed]
- Harada, K.H.; Fujii, Y.; Zhu, J.; Zheng, B.; Cao, Y.; Hitomi, T. Analysis of perfluorooctanesulfonate isomers and other perfluorinated alkyl acids in serum by in-port arylation gas chromatography negative chemical ionization–mass spectrometry. Environ. Sci. Technol. Lett. 2020, 7, 259–265. [Google Scholar] [CrossRef]
- Spotfire® Industry Pro Cloud Software Group, Inc. Fort Lauderdale, Florida USA.
- Seabold, S.; Perktold, J. statsmodels: econometric and statistical modeling with Python. In Proceedings of the 9th Python in Science Conference, 2010; pp. 92–96. [Google Scholar] [CrossRef]
- McCullagh, P.; Nelder, J. A. Generalized Linear Models, 2nd ed.; Chapman & Hall/CRC, 1989. [Google Scholar]
- Roach, S. A. A More Rational Basis for Air Sampling Programs. Am. Ind. Hyg. Assoc. J. 1966, 27(1), 1–12. [Google Scholar] [CrossRef] [PubMed]
- Doob, J.L. The Brownian Movement and Stochastic Equations. Ann. Math. 1942, 43, 351–369. [Google Scholar] [CrossRef]
- Furukawa, K.; Okamoto-Matsuda, K.; Harada, K.H.; Minata, M.; Hitomi, T.; Kobayashi, H.; Koizumi, A. Role of ABCB1 and ABCB4 in renal and biliary excretion of perfluorooctanoic acid in mice. Environ. Health Prev. Med. 2024, 29:21. [Google Scholar] [CrossRef] [PubMed]
- Roth, K.; Yang, Z.; Agarwal, M.; Birbeck, J.; Westrick, J.; Lydic, T.; Gurdziel, K.; Petriello, M.C. Exposure of Ldlr -/- Mice to a PFAS Mixture and Outcomes Related to Circulating Lipids, Bile Acid Excretion, and the Intestinal Transporter ASBT. Environ. Health Perspect. Epub. 2024, 132(8), 87007. [Google Scholar] [CrossRef] [PubMed]
- Gong, X.; Zhang, Q.; Ruan, Y.; Hu, M.; Liu, Z.; Gong, L. Chronic Alcohol Consumption Increased Bile Acid Levels in Enterohepatic Circulation and Reduced Efficacy of Irinotecan Alcohol Alcohol. 2020, 55(3), 264–277. [Google Scholar] [CrossRef] [PubMed]
- Claudel, T.; Staels, B.; Kuipers, F. The Farnesoid X receptor: a molecular link between bile acid and lipid and glucose metabolism Arterioscler Thromb Vasc Biol. 2005, 25(10), 2020–30. [Google Scholar] [CrossRef] [PubMed]
- Møller, J.J.; Lyngberg, A.C.; Hammer, P.E.C.; Flachs, E.M.; Mortensen, O.S.; Jensen, T.K.; Jürgens, G.; Andersson, A.; Soja, A.M.B.; Lindhardt, M. Substantial decrease of PFAS with anion exchange resin treatment - A clinical cross-over. Environ. Int. Epub. 2024, 185, 108497. [Google Scholar] [CrossRef] [PubMed]
- Marlett, J.A.; Fischer, M.H. The active fraction of psyllium seed husk. Proc. Nutr. Soc. 2003, 62(1), 207–9. [Google Scholar] [CrossRef] [PubMed]
- Schlezinger, J.J.; Biswas, K.; Garcia, A.; Heiger-Bernays, W.J.; Bello, D. An oat fiber intervention for reducing PFAS body burden: A pilot study in male C57Bl/6 J mice. Toxicol. Appl. Pharmacol. Epub. 2025, 495, 117188. [Google Scholar] [CrossRef] [PubMed]
- Harada, K.H.; Hashida, S.; Kaneko, T.; Takenaka, K.; Minata, M.; Inoue, K.; Saito, N.; Koizumi, A. Biliary excretion and cerebrospinal fluid partition of perfluorooctanoate and perfluorooctane sulfonate in humans. Environ. Toxicol. Pharmacol. 2007, 24(2), 134–139. [Google Scholar] [CrossRef] [PubMed]
- Liu, W.; Chen, S.; Harada, K.H.; Koizumi, A. Analysis of perfluoroalkyl carboxylates in vacuum cleaner dust samples in Japan Chemosphere. Epub. 2011, 85(11), 1734–41. [Google Scholar] [CrossRef] [PubMed]
Figure 1.
Participant flow and analytical populations. The blood-monitoring campaign included 1,190 participants. Twelve nonresidents and four current or former Daikin workers were excluded, leaving 1,174 residents of Osaka Prefecture. Of these, 1,084 participants with complete data for the 16 questionnaire items entered the main regression analysis, whereas 90 participants had incomplete questionnaire data. For the sensitivity analysis, six participants who owned agricultural land were excluded from the 1,174 residents, leaving 1,168 participants; 1,078 complete cases were included in the sensitivity regression analysis. Demographic analyses were conducted in the corresponding full analytical populations.

Figure 2.
Agreement between observed and model-predicted serum PFOA concentrations in the main analysis. (A) Mean predicted versus observed log10(PFOA) across 20 residence-by-age-class strata (four residence groups × five age classes). Pearson r = 0.927, p = 4.46 × 10⁻⁹. The analysis included 1,084 complete cases and used the selected Model 2. (B) Age-class profiles of observed mean log10(PFOA) ± 1 SD (blue) and predicted mean log10(PFOA) (orange) for each residence group. Pearson correlation coefficients and p values are shown for each residence group.

Figure 3.
Agreement between observed and model-predicted serum PFOA concentrations in the sensitivity analysis. (A) Mean predicted versus observed log10(PFOA) across 20 residence-by-age-class strata after exclusion of six participants who owned agricultural land. Pearson r = 0.925, p = 5.68 × 10⁻⁹. The analysis included 1,078 complete cases and used the selected Model 1. (B) Age-class profiles of observed mean log10(PFOA) ± 1 SD (blue) and predicted mean log10(PFOA) (red) for each residence group. Pearson correlation coefficients and p values are shown for each residence group.


Table 1.
Demographic characteristics and serum PFOA concentrations by residence area.
| Population | Overall | Residence 1 | Residence 2 | Residence 3 | Residence 4 | ANOVA, p value |
| No. of participants | 1174 | 311 | 196 | 448 | 219 | - |
| No. of women | 813 | 200 | 131 | 335 | 147 | - |
| Women (%) | 69.25 | 64.31 | 66.84 | 74.78 | 67.12 | - |
| Age, n | 1174 | 311 | 196 | 448 | 219 | - |
| Age, mean | 63.34 | 66.79 | 61.52 | 65.15 | 56.38 | p<1.00E-04 |
| Age, SD | 15.01 | 15.21 | 15.70 | 14.10 | 13.37 | - |
| BMI n | 1153 | 306 | 190 | 440 | 217 | - |
| BMI, mean | 23.00 | 22.86 | 23.26 | 22.85 | 23.26 | p=0.33 |
| BMI SD | 3.61 | 3.35 | 3.65 | 3.68 | 3.76 | - |
| PFOA n | 1174 | 311 | 196 | 448 | 219 | - |
| PFOA, arithmetic mean | 5.93 | 8.11* | 5.04 | 5.45 | 4.61 | p<1.00E-04 |
| PFOA SD | 6.04 | 10.48 | 3.10 | 2.87 | 2.18 | - |
| PFOA GM | 4.80 | 5.95* | 4.33 | 4.68 | 4.10 | p<1.00E-04 |
| PFOA GSD | 1.86 | 2.02 | 1.73 | 1.82 | 1.67 | - |
Note: Values are shown for all 1,174 participants. Overall differences among the four residence groups were evaluated by one-way analysis of variance (ANOVA). When the overall test was significant, pairwise comparisons were performed using the Scheffé post hoc test with a family-wise significance level of 0.05(*). Comparisons of geometric mean PFOA concentrations were performed on log10-transformed PFOA values. GM, geometric mean; GSD, geometric standard deviation; SD, standard deviation.
Table 2.
Effects of significant determinants of serum PFOA concentration in the selected main-analysis model.
Table 2.
Effects of significant determinants of serum PFOA concentration in the selected main-analysis model.
| Parameter | Beta | SE | PFOA ratio 10^Beta | Ratio CI_Low | Ratio CI_High |
| const | 0.25 | 0.04 | 1.77 | 1.48 | 2.11 |
| AgeClass | 0.08 | 5.72E-03 | 1.21 | 1.18 | 1.25 |
| Drink | 0.03 | 8.55E-03 | 1.07 | 1.03 | 1.11 |
| FishCons | 0.05 | 7.25E-03 | 1.11 | 1.08 | 1.15 |
| Residence_2 | -0.10 | 0.02 | 0.79 | 0.72 | 0.87 |
| Residence_3 | -0.10 | 0.02 | 0.79 | 0.72 | 0.86 |
| Residence_4 | -0.09 | 0.02 | 0.82 | 0.74 | 0.90 |
| Laxative_2.0 | 0.07 | 0.02 | 1.18 | 1.08 | 1.30 |
| TapWater_2.0 | -0.06 | 0.02 | 0.87 | 0.81 | 0.94 |
Note: The analysis included 1,084 complete cases. Model 2, which allows residence-specific heteroscedasticity, was selected by AIC. The table presents coefficients for terms that were significant by likelihood-ratio chi-square testing at the Bonferroni-corrected significance level (0.05/15 = 0.0033). Beta is the regression coefficient for log10(PFOA); SE, standard error; CI, 95% confidence interval. The PFOA ratio is 10^Beta. For categorical variables (Residence, Laxative, and TapWater), ratios are relative to category 1. For ordinal variables (AgeClass, Drink, and FishCons), the ratio represents the multiplicative change per one-category increase.
Table 3.
Sensitivity analysis: effects of significant determinants of serum PFOA concentration.
| Parameter | Beta | SE | PFOA ratio 10^Beta | Ratio CI_Low | Ratio CI_High |
| const | 0.22 | 0.04 | 1.65 | 1.38 | 1.96 |
| AgeClass | 0.08 | 5.59E-03 | 1.20 | 1.17 | 1.23 |
| Drink | 0.03 | 8.27E-03 | 1.07 | 1.03 | 1.11 |
| FishCons | 0.04 | 6.99E-03 | 1.10 | 1.07 | 1.14 |
| Residence_2 | -0.08 | 0.02 | 0.83 | 0.76 | 0.91 |
| Residence_3 | -0.08 | 0.02 | 0.82 | 0.76 | 0.89 |
| Residence_4 | -0.07 | 0.02 | 0.86 | 0.78 | 0.94 |
| Laxative_2.0 | 0.08 | 0.02 | 1.20 | 1.09 | 1.32 |
| TapWater_2.0 | -0.06 | 0.02 | 0.86 | 0.80 | 0.93 |
| WaterFilter_2.0 | 0.05 | 0.01 | 1.13 | 1.06 | 1.21 |
Note: The sensitivity analysis excluded six prespecified participants who consumed self-grown agricultural products and included 1,078 complete cases. Model 1 (homoscedastic model) was selected by AIC. The table presents coefficients for terms that were significant by likelihood-ratio chi-square testing at the Bonferroni-corrected significance level (0.05/15 = 0.0033). Beta is the regression coefficient for log10(PFOA); SE, standard error; CI, 95% confidence interval. The PFOA ratio is 10^Beta. For categorical variables, ratios are relative to category 1; for ordinal variables, ratios represent the multiplicative change per one-category increase.
Disclaimer/Publisher’s Note: The statements, opinions and data contained in all publications are solely those of the individual author(s) and contributor(s) and not of MDPI and/or the editor(s). MDPI and/or the editor(s) disclaim responsibility for any injury to people or property resulting from any ideas, methods, instructions or products referred to in the content. |
© 2026 by the authors. Licensee MDPI, Basel, Switzerland. This article is an open access article distributed under the terms and conditions of the Creative Commons Attribution (CC BY) license (http://creativecommons.org/licenses/by/4.0/).
Copyright: This open access article is published under a Creative Commons CC BY 4.0 license, which permit the free download, distribution, and reuse, provided that the author and preprint are cited in any reuse.