
Submitted:
30 September 2026
Posted:
01 October 2026
You are already at the latest version
Abstract
Stevia (Stevia rebaudiana) is processed industrially mainly for steviol glycosides, whereas its co-occurring chlorogenic acids—especially dicaffeoylquinic acids (diCQAs)—are emerging value-added food and feed ingredients. The stability of a commercial stevia chlorogenic acid product (total acids 61.39%; diCQAs 53.79%) was evaluated in the solid state and in 80% aqueous methanol under heat (80–180 °C), light, oxygen, metal-ion (Fe³⁺, Cu²⁺), pH (3.0–8.0), and solvent conditions. In solids, total acid loss remained below 10% at ≤140 °C (≤4 h) and was 2.12% at ≤100 °C for 24 h, but rose to 45.45% (160 °C) and 93.21% (180 °C) after 4 h; LC–MS revealed degradation, methylation, acetylation, and diCQA lactonization products that accumulated below 160 °C and degraded above 180 °C. In solution, total acid content was conserved at 60–80 °C, as acyl migration converted 4,5-diCQA and 5-CQA to more stable isomers. Fe³⁺ and Cu²⁺ formed reversible insoluble diCQA complexes (98.36–99.81% recovery after EDTA) that accelerated light- and oxidation-induced loss, Cu²⁺ more strongly. Hydrolytic loss predominated at pH 3.0–4.0 and was buffered by monomer interconversion at pH 5.0–8.0. These findings define a safe processing/storage window (≤140 °C solids; ≤80 °C, metal-ion-free, sealed opaque liquids) and provide a mechanistic basis for quality control.
Keywords:
stevia
; dicaffeoylquinic acid
; thermal stability
; degradation pathway
1. Introduction
Stevia (Stevia rebaudiana (Bertoni) Hemsl.) is a perennial herb of the family Asteraceae native to the alpine grasslands bordering Paraguay and Brazil in South America. Stevia was introduced to China in 1977 and is currently managed as a vegetable crop; the planting area has reached 20,000–25,000 ha, with an annual output exceeding 100,000 tons. Stevia is best known for its diterpene glycosides (steviol glycosides), whose sweetness is 200–300 times that of sucrose; owing to their non-cariogenic properties and suitability for diabetic consumers, steviol glycosides are widely used in the food, pharmaceutical, and personal-care industries, with a global market volume of ~10,000 tons [1].
In addition to steviol glycosides and flavonoids, stevia leaves contain approximately 7% (HPLC) chlorogenic acids, of which the dicaffeoyl-substituted isochlorogenic acids (diCQAs) account for up to ~5% [2,3]. The diCQA content in stevia is markedly higher than that in traditional medicinal/industrial plants such as Lonicera japonica and Eucommia ulmoides [3]. However, the content and composition of chlorogenic acids vary considerably among cultivars [2]. Isochlorogenic acids (dicaffeoylquinic acids) comprise three positional isomers—isochlorogenic acid A (3,5-diCQA), B (3,4-diCQA), and C (4,5-diCQA) [4]—and exhibit multiple activities, including regulation of glucose metabolism [5,6], hepatoprotection [7,8], anti-inflammatory [9], and antibacterial effects [10,11]. Because of the higher degree of caffeoylation and the o-dihydroxyphenol (catechol) moieties, diCQAs generally display stronger antioxidant, anti-inflammatory, and antiviral activities than mono-caffeoyl chlorogenic acids [2,4,9]. Stevia-derived isochlorogenic acids have been approved in China as both a new food ingredient and a new feed additive and are now produced at an industrial scale, where stevia-derived chlorogenic acid is a byproduct/co-product of steviol glycoside production [3].
Caffeoylquinic acids are intrinsically labile. The o-dihydroxyl structure of chlorogenic acids is prone to decomposition under high temperatures, light, and pH changes, which lowers the extraction yield and product integrity [12,13,14,15,16,17]. Quantitative studies on mono-caffeoyl chlorogenic acids have established that 5-CQA degrades in aqueous solution under heating [12], that its thermal stability is strongly pH-dependent [13], that alcoholic extraction can generate esters and amine derivatives [14,15], and that roasting drives CQA degradation and lactone formation in coffee [16,17,18]. For diCQAs, Deshpande et al. demonstrated that acyl migration among the mono- and dicaffeoylquinic acid isomers occurs under aqueous basic, aqueous acidic, and dry-roasting conditions via hydrated intermediates [19], and Clifford et al. established LC–MSⁿ diagnostic rules that discriminate the six diCQA isomers [21]. Xue et al. reported the stability and degradation of CQAs under different storage conditions [22]. Within our own group, earlier work screened the influence of light, temperature, dissolved oxygen, pH, and metal ions on stevia chlorogenic acid content [23], and a subsequent UPLC-QTOF MS/MS study identified dehydration, degradation, hydrolysis, and isomerization as the main degradation routes of stevia CQAs under solvent, light, heat, and pH stresses [24].
Nevertheless, three aspects remain unresolved for industrial practice: (i) a quantitative temperature–time envelope for the solid diCQA product under realistic processing conditions (drying, coating, extrusion) has not been established; (ii) the complete solid-state transformation network (degradation, methylation, acetylation, lactonization) and its temperature dependence, including the transient accumulation and subsequent degradation of these derivatives, are not described quantitatively; and (iii) the interplay between metal-ion complexation (a common unavoidable contaminant in processing water and vessels) and light/oxidative loss, and its mechanistic basis, has not been reported for stevia products.
In this study, a commercial stevia isochlorogenic acid product (total acids 61.39%, diCQAs 53.79%) was subjected to solid heat treatment at 80–180 °C and solution treatment at 60–80 °C, metal ions, light, oxygen, pH, and solvent variations following our standardized stability protocols. Transformation products were identified using UPLC-QTOF MS/MS. The results provide a quantitative stability map—thermal thresholds, transformation pathways, and metal-ion catalytic behavior—that guides processing, storage, transport, and end-use of stevia chlorogenic acid ingredients.
2. Materials and Methods
2.1. Materials and Reagents
Stevia chlorogenic acid product (batch no. 2-0969-200613; total acid content 61.39%; diCQA content 53.79%) was supplied by Chenguang Biotech Group Co., Ltd. (Handan, China). Reference standards of 3,5-diCQA, 4,5-diCQA, 3,4-diCQA, 3-CQA, 4-CQA, 5-CQA, and caffeic acid (purity >95%) were obtained from Chengdu Mansite Biotechnology Co., Ltd. (Chengdu, China). Acetonitrile, formic acid, and trifluoroacetic acid were of chromatographic grade. Methanol and ethanol were of analytical grade. FeCl₃ and CuSO₄ (analytical grade) were dissolved in ultrapure water to prepare 1 mol/L stock solutions of each. EDTA-2Na (analytical grade) was used at a concentration of 1 mol/L for decomplexation. Citric acid (0.1 mol/L) and disodium hydrogen phosphate (0.2 mol/L) were used to prepare pH-adjusting buffer solutions.
2.2. Instrumentation
Electric blast drying oven (101-1AB, Tianjin Taiste Instrument Co., Ltd.); artificial climate chamber (Shanghai Yiheng Scientific Instrument Co., Ltd.); peristaltic pump; thermostatic water bath; analytical balance (AUW220, Shimadzu); pH meter (Shanghai Sanxin Instrument Factory); HPLC system (e2695, Waters); and UPLC-QTOF MS/MS system (Xevo G2-XS, Waters) equipped with a Waters BEH C18 column (2.1 mm × 100 mm, 1.7 µm).
2.3. Solid-State Heat Treatment and Content-Loss Calculation
Chlorogenic acid samples were spread evenly on stainless-steel trays (thickness ≤4 mm) and heated in the oven at 80, 100, and 120 °C for 24 h, and at 140, 160, and 180 °C for 4 h. After each treatment, the content was determined by HPLC (Section 2.10). The content loss rate was calculated as follows:
where A₁ is the total acid content of the untreated original sample, and A₂ is that of the treated sample.
Loss (%) = (A₁ − A₂) / A₁ × 100 (1)
2.4. Solution Heat Treatment
Product (0.5164 g) was dissolved in 100 mL of 80% methanol and heated at 60, 70, and 80 °C for 4 and 8 h. The 80% ethanol solution was heated at 60 and 80 °C for 4 and 8 h for comparison. After heating, the solutions were cooled and weight-replenished with the corresponding solvent before HPLC analysis.
2.5. Metal-Ion Treatment and EDTA Decomplexation
0.5164 g of product was dissolved in 80% methanol to 100 mL. CuSO₄ or FeCl₃ stock solution was added slowly to reach metal-ion-to-diCQA molar ratios of 1:20, 1:10, and 1:5, and samples were left standing for 24 h. To distinguish complexation-induced detectability loss from genuine degradation, an equimolar amount of 1 mol/L EDTA-2Na was added to the 1:5 samples to decomplex; after mixing, the solutions were allowed to stand for 24 h and re-analyzed. In addition, solutions before and after metal-ion addition were filtered through a 0.45 µm membrane and subjected to full-wavelength scanning (300–400 nm) to examine λmax shifts.
2.6. Light-Exposure Tests
Solid: The product was spread on stainless-steel trays (<5 mm); after 1, 2, 4, 8, and 25 days of exposure in the climate chamber (37 °C, 35% RH, 12,000 lx), samples from four corners and the center were mixed for analysis.
Solution: 0.5164 g product/100 mL (80% methanol) was sealed; the dark control was wrapped in aluminum foil; both groups were placed in a climate chamber and sampled at 1, 2, 4, 8, and 20 days, with weight replenishment before each sampling. Parallel solution groups containing 1 mL of 1 mol/L CuSO₄ or FeCl₃ (per 100 mL) were run under the same light conditions.
2.7. Oxidative-Loss Tests
Solutions (as in Section 2.6, ± metal ions) were sealed and protected from light; air was bubbled through at a fixed rate using a peristaltic pump. Samples were taken at 1, 5, 10, and 15 days with weight replenishment; a metal-ion-free solution under identical conditions served as the control.
2.8. pH-Stability Tests
Citric acid (0.1 mol/L) and disodium hydrogen phosphate (0.2 mol/L) stock solutions were added to methanol to adjust the pH to 3.0, 4.0, 5.0, 6.0, 7.0, and 8.0. The product (0.5164 g) was brought to 100 mL with each pH-adjusted solution; each was divided into two portions, one left untreated and the other heated at 80 °C for 2 h, then analyzed.
2.9. Process-Liquid Tests
The stevia isochlorogenic acid process liquid (before and after concentration) was refluxed at 55 °C for 8 h and at 80 °C for 10 h, cooled, and weight-replenished with ethyl acetate before analysis.
2.10. HPLC Quantification and UPLC-QTOF MS/MS Identification
HPLC conditions (330 nm): column temperature, 40 °C; mobile phase A, 0.1% trifluoroacetic acid in water; mobile phase B, acetonitrile; gradient, 0–2 min 95% A, 2–10 min 95–80% A, 10–20 min 80–65% A, 20–20.5 min 65–50% A, 20.5–45 min 50–0% A, 45–48.5 min 0% A, 48.5–49.5 min 0–65% A, 49.5–50 min 65–95% A, 50–55 min 95% A; flow rate, 0.2 mL/min (LC–MS) or 1.5 mL/min (HPLC-UV).
The UPLC-QTOF MS/MS conditions (ESI⁻) were as follows: scan range, 50–2000 Da; collision gas, argon; collision energy, 20–40 V; capillary voltage, 2.5 kV; cone voltage, 40 V; source temperature, 120 °C; desolvation gas, nitrogen at 300 °C; cone gas, 50 L/h; and desolvation gas, 700 L/h. Compounds were assigned based on the exact [M−H]⁻/adduct masses and MS² fragment patterns, following the LC–MSⁿ rules of Clifford et al. [21].
2.11. Statistical Analysis
The stability data were obtained as single determinations per condition under the group’s standardized protocols and are reported descriptively; no inferential statistics were applied, and the results are therefore presented without error bars or measures of dispersion.
3. Results
3.1. Thermal Stability of the Solid Product: A Quantitative Processing Window
The effect of solid heat treatment on the total acid content is shown in Figure 1. Three regimes can be distinguished: (i) heating at ≤100 °C for 24 h caused <2.12% loss; (ii) heating at ≤140 °C for 4 h caused <9.24% loss (8.95% at 120 °C/24 h and 9.24% at 140 °C/4 h); and (iii) heating at ≥160 °C for 4 h caused severe loss (45.45% at 160 °C and 93.21% at 180 °C).
Below 140 °C, the loss rates of diCQAs and CQAs were comparable, whereas at 160–180 °C, the loss rate of diCQAs exceeded that of CQAs by ~30%, consistent with the partial conversion of diCQAs into CQAs (Figure 1). Notably, 5-CQA increased slightly in the 80–160 °C range (4.65% → 5.37% at 160 °C) and declined sharply at 180 °C (1.86%, 60.01% loss), suggesting that diCQA degradation during solid heating generates 5-CQA as a transient product.
3.2. Identification of Solid-State Thermal Transformation Products and Pathways
Untreated, mid-loss (160 °C/4 h), and near-complete-loss (180 °C/4 h) samples were profiled using UPLC-QTOF MS/MS (Figure 2, Table 1). After heating, quinic acid and acetylquinic acid increased strongly, whereas CQA, diCQA, triCQA, caffeic acid, and steviol glycosides decreased. Ferulic acid, feruloyl-caffeoylquinic acid, acetyl-dicaffeoylquinic acid, and the dicaffeoylquinic acid lactone first increased (160 °C) and then decreased or disappeared (180 °C). The observed transformation network (Figure 3) comprises (i) hydrolytic degradation of CQA and diCQA to caffeic acid and quinic acid; (ii) methylation of caffeic acid to ferulic acid; (iii) acetylation of quinic acid to acetylquinic acid; and (iv) methylation, acetylation, and lactonization of diCQA to feruloyl-caffeoylquinic acid, acetyl-diCQA, and diCQA lactone, respectively. Heat exerts a dual effect: below 160 °C, it promotes the formation of the methylated/acetylated/lactonized products, whereas above 180 °C, these derivatives themselves undergo thermal degradation.
3.3. Solution Thermal Stability: Total-Acid Conservation and Acyl-Migration-Driven Isomer Interconversion
In 80% aqueous methanol, heating at 60–80 °C for up to 8 h only slightly changed the total acid content (0.32–0.35 g/100 mL; Figure 4), and the sums of diCQAs and CQAs were essentially conserved. Monomer-level changes were highly consistent across temperatures: 4,5-diCQA decreased (−12.6% to −16.5%), while 3,4- and 3,5-diCQA increased (up to +35% and +17%, respectively); 5-CQA decreased, while 3-CQA and 4-CQA increased (up to +40% and +47%, respectively). The same pattern was obtained in 80% ethanol (Figure 5), showing that the interconversion is solvent-type-independent. These results indicate the conversion of 4,5-diCQA to 3,4- and 3,5-diCQA and of 5-CQA to 3- and 4-CQA during thermal treatment, that is, isomer interconversion toward thermodynamically more stable structures (Figure 6).
3.4. Metal Ions: Complexation Without Direct Loss, but with Catalytic Acceleration of Light/Oxidative Loss
Addition of Fe³⁺ or Cu²⁺ lowered the measured contents of diCQAs and CQAs with increasing metal concentration. However, after EDTA-2Na decomplexation, the detected contents recovered to 98.36–99.81%, demonstrating that complexation itself did not destroy the active ingredients (Figure 7). After the addition of metal ions, the solutions darkened, trace insoluble particles adhered to the vial wall, and filtration markedly reduced absorbance; the maximum absorption wavelength remained near 325 nm throughout, and metal addition did not shift λmax (Table 2). Thus, the immediate “loss” upon metal-ion addition is attributable to the poor solubility of diCQA/CQA–metal complexes and the pre-injection filtration step of the HPLC method, which removes part of the complexed active ingredients.
The complexes are not inert intermediates. Under light exposure for 20 days, the total acid loss of the metal-free control was 40.43%; addition of Fe³⁺ (48.25%) and especially Cu²⁺ (68.05%) accelerated the loss, with diCQA losses exceeding 70% in the Cu²⁺ group (3,4-: −71.83%; 4,5-: −77.67%; Figure 8). Under oxidative conditions (15 d bubbling), the metal-free control lost 9.25% of total acids (4,5-diCQA −15.93%; caffeic acid −16.67%); Fe³⁺ partly suppressed the loss (5.41%), whereas Cu²⁺ markedly increased it (28.17%; Figure 9). Fe³⁺ thus shows a mild protective effect on oxidative loss, while Cu²⁺ is a strong pro-oxidant/catalyst; Cu²⁺ catalyzes both photo- and oxidative degradation more strongly than Fe³⁺.
3.5. pH Dependence of Hydrolysis and Interconversion
Relative to the original solution (80% aqueous methanol), the total acid content was lowest at pH 3.0 and 4.0 (losses of 5.64% and 7.11%), varied only 0.19–1.97% at pH 5.0–7.0, and increased by 3.5% at pH 8.0. After heating at 80 °C for 2 h, the total acid variation in every pH environment was <0.6% (Figure 10). At pH 3.0–4.0, diCQA loss was larger than at pH 5.0–8.0, and heating had essentially no additional effect, indicating acid-catalyzed hydrolysis mainly of 4,5-diCQA. In the pH 5.0–8.0 range, pH promoted conversion of 3,5- and 4,5-diCQA toward 3,4-diCQA, and diCQA toward CQAs (preferentially 3-CQA and 4-CQA): the strong interconversion buffer kept the total acid content almost constant.
3.6. Solvent and Process-Liquid Behavior
Solid-phase light exposure for 25 days caused only 3.76% total acid loss (3,4-diCQA −5.95%; 3,5-diCQA −3.63%; 4,5-diCQA −3.89%; 4-CQA −4.33%; 3-/5-CQA <1.0%), indicating good light stability of the solid product, with strong direct light to be avoided during storage.
For process liquids, refluxing the pre-concentration liquid at 55 °C/8 h and 80 °C/10 h changed the total acid content by less than 2% (−0.39% and −1.16%), whereas the post-concentration liquid lost 2.49% and 11.07% under the same conditions, with loss of diCQAs exceeding that of CQAs (Figure 11). HPLC comparison revealed a peak near 15 min in the process liquid—assigned, on the basis of earlier data, to methylated/ethylated chlorogenic acid derivatives—that was absent both before and after heating of the purified product in methanol or ethanol. This indicates that during solvent extraction, the process matrix induces (ethyl)alkylation of chlorogenic acids at elevated temperatures, and that the concentrated process stream is more susceptible to thermal loss than the purified isochlorogenic acid product.
4. Discussion
4.1. The Solid-State Transformation Network and Its Temperature Dependence
The solid-state results define a practically exploitable processing window: total acid loss <10% at ≤140 °C/4 h, but ~45% loss at 160 °C/4 h. The LC–MS data show that the losses arise not only from hydrolytic degradation to caffeic and quinic acids [12,16,17] but also from thermally driven covalent modifications—methylation, acetylation, and lactonization—that have a pronounced temperature dependence. The dual (promoting-degrading) temperature effect below 160 °C versus above 180 °C, respectively, is, to our knowledge, newly documented here for a complex industrial chlorogenic acid product. Recent reviews of caffeoylquinic acid chemistry and of processing effects position this behavior within a general structural lability—the higher the degree of caffeoylation, the more readily the acyl ester chain degrades thermally or photochemically—and attribute the bulk of CQA loss during thermal processing to lactonization, polymerization, and hydrolysis [25,26,27]. Under milder conditions, the process is real but slow, with CGA half-lives of ca. 4–5 years estimated for green coffee during long-term storage [28]. Methylated and acetylated derivatives (ferulic acid, acetylquinic acid, feruloyl-caffeoylquinic acid, acetyl-diCQA) and the diCQA lactone behave as metastable pools: they accumulate at moderate temperature and are themselves consumed at higher temperature. The partial conversion of diCQAs to CQAs (and of diCQAs to 5-CQA, inferred from the transient rise of 5-CQA) explains why diCQA loss rates exceed CQA loss rates at high temperature, and echoes the mono/diCQA interconversion reported under aqueous and roasting conditions [19].
4.2. Solution Behavior: Acyl-Migration-Driven Structural Stabilization
In solution, total acid and class sums (ΣdiCQA, ΣCQA) are conserved even at 80 °C; however, positional isomers re-equilibrate. The observed conversions—4,5-diCQA → 3,4-/3,5-diCQA and 5-CQA → 3-/4-CQA—are fully consistent with the intramolecular acyl-migration mechanism (via hydrated intermediates) established for caffeoylquinic acids under neutral–weakly basic aqueous conditions [19,20,26,29,30]. The thermodynamic ranking of the isomers, which parallels their spatial arrangements (adjacent vs. meta, same vs. opposite orientation; e.g., PubChem CID 5281780, 6474310, 10324242), explains the net direction of conversion: 4,5-diCQA (two adjacent, same-orientation substituents) is the least stable and converts preferentially; 4-CQA (para to the quinic carboxyl) is the most stable, driving the preferential 5-CQA → 4-CQA conversion. This “unstable-to-stable” interconversion is an internal quality-preserving buffer: it minimizes total acid loss during mild processing and storage, consistent with the conserved total acid in Figure 4 and Figure 5; it likewise agrees with the degradation kinetics quantified for isochlorogenic acid A in aqueous solution [31] and with the preparative conversion of chlorogenic acid into its more stable isomers during processing [32].
4.3. Metal Ions: Complexation, Catalysis, and the Fe³⁺/Cu²⁺ Asymmetry
The immediate content drop upon metal-ion addition is a detectability artifact of insoluble complex formation (recovered by EDTA), not an actual loss—consistent with the well-established catecholate/gallate chelation chemistry of hydroxycinnamic acids, whereby the caffeic-acid catechol coordinates Fe³⁺ and Cu²⁺ into poorly soluble adducts that are dissociated by strong chelators such as EDTA [25,33]. The long-term danger, however, is catalytic: complex intermediates accelerate photodegradation and oxidative loss. Caffeic acid’s catechol and its phenolate anion coordinate Cu²⁺, and the resulting complex can undergo electron transfer to generate o-quinone and superoxide radical anions, which inflict oxidative damage and lower the energy barrier for active-component reactions [34]. This mechanism explains why Cu²⁺ (stronger complexation, per the Irving–Williams-type order Cu²⁺ > Fe²⁺ > Fe³⁺ coordination tendency; e.g., [33,34]) exceeds Fe³⁺ in accelerating photo/oxidative loss, and why Fe³⁺ can paradoxically protect against oxidative loss by trapping/sequestering oxidizable centers or by forming less redox-active complexes [33,34]. In practical terms, avoid introducing metal ions (processing vessels, water, packaging) and avoid combining acidic conditions (pH < 4) with metals, since hydrolytic and metal-catalyzed routes then superimpose (Section 3.4 and Section 3.5).
4.4. Integrated Stability Map and Industrial Recommendations
Combining all factors, the influence ranking for solid product loss is dominated by temperature (≈160 °C onset), followed by prolonged strong-light exposure; for liquid product, the loss drivers in increasing order are pH, oxidation, light, storage time, and metal ions. Recommended and testable operating rules: (1) solid handling at ≤140 °C with minimal time (extrusion ≤160 °C as an upper bound for short processes); (2) avoid metal-ion introduction at every stage; (3) sealed, opaque, cool, and dry storage (as supported by packaging-dependent CQA retention in stored roasted coffee and by the slow, multi-year CGA degradation estimated for stored green coffee [28,35]); (4) use formulated aqueous/alcoholic solutions promptly, avoid open storage, and strong direct light; (5) for concentrated process streams, minimize thermal hold time and control conditions that promote alkylation.
4.5. Limitations
Results are reported as single determinations per recorded point without measures of dispersion, reflecting the screening-oriented design of the stability trials; the study is therefore descriptive in scope. LC–MS components were quantified as relative peak areas (semi-quantitative) by UPLC-QTOF MS/MS, whereas total and monomer acid contents (%) were obtained by the group’s standard HPLC-UV protocol. The regiochemistry of the methylated, acetylated, and lactonized products was assigned from the exact masses and MS² product-ion patterns, according to published rules [21]; however, NMR confirmation of the diCQA lactone was not performed. Metal-complex stoichiometry and stability constants were not determined.
5. Conclusions
Stevia chlorogenic acid products showed good thermal stability in the solid state, with total acid loss below 10% at ≤140 °C for ≤4 h. Above 160 °C, diCQAs and CQAs underwent degradation, methylation, acetylation, and lactonization; these modification products accumulated below 160 °C and degraded above 180 °C. In an aqueous-alcoholic solution, the product is stable at 60–80 °C, and acyl-migration-driven isomer interconversion (toward 3,4-diCQA and 4-CQA) conserves the total acid content. Metal ions (notably Cu²⁺) do not directly destroy the actives but, as complex intermediates, accelerate light- and oxidation-induced loss, while Fe³⁺ mildly protects against oxidation. Hydrolytic loss occurs at pH 3.0–4.0, whereas pH 5.0–8.0 favors buffering interconversion. These findings provide quantitative guidance for the processing, storage, and application of stevia-derived chlorogenic acid products (≤140 °C solid handling; ≤80 °C liquids; metal-ion-free, sealed, opaque, cool, and dry conditions).
Author Contributions
Conceptualization, X.Y.; methodology, M.-L.X.; software, F. L.; validation, R. T.; investigation, F. L.; writing—original draft preparation, M.-L.X.; writing—review and editing, M.-L.X.; supervision, L. H.; project administration, L. H.; funding acquisition, H. L.
Funding
This research was funded by the Development of Key Technologies for the Preparation and Industrial Application of High-Quality Isochlorogenic Acid (grant number 254Z2805G).
Institutional Review Board Statement
Not applicable.
Informed Consent Statement
Not applicable.
Data Availability Statement
The data presented in this study are contained within the article and its supplementary material. The underlying raw records are no longer available.
Acknowledgments
During the preparation of this manuscript, the authors used the open-source AI coding assistant opencode (version 1.15.12, npm package opencode-ai; https://opencode.ai), powered by a large language model (model ID: opencode/big-pickle). The tool was used solely for revising the paper and checking the content. All scientific opinions, study design, data analysis, and conclusions are the sole responsibility of the authors, who independently verified and revised all generated content.
Conflicts of Interest
Authors Mei-li Xu, Lijuan Hou, Fuyong Lu, and Rumeng Tang were employed by Chenguang Biological Technology Group Co., Ltd. The remaining authors declare that the research was conducted in the absence of any commercial or financial relationships that could be construed as a potential conflict of interest.
References
- Shahariyar, T.; Ishtiaq, A.; Tahir, S.; Afzaal, M.; Hussain, M.B.; Sadikan, M.Z.; Islam, F.; Usmanov, R.; Mushtaq, R. Stevia rebaudiana Bertoni: Phytochemical composition, sensory properties, and nutritional implications. Eur. Food Res. Technol. 2026, 252, 196.
- Guo, Z.; Ma, Z.; Zhang, H.; et al. Comparative study on chlorogenic acid compounds in leaves of different Stevia varieties. Guihaia 2020, 40, 696–705. (In Chinese).
- Li, Y.; Niu, Z.; Xu, M.; Tian, H.; Gao, W. Comparative analysis of chlorogenic acids in Stevia and other plants. China Food Addit. 2021, 32, 1–6. (In Chinese).
- Wang, H.-N.; Shen, Z.; Liu, Q.; Hou, X.-Y.; Cao, Y.; Liu, D.-H.; Jiang, H.; Du, H.-Z. Isochlorogenic acid (ICGA): natural medicine with potentials in pharmaceutical development. Chin. J. Nat. Med. 2020, 18, 860–871.
- Chen, Y.; Geng, S.; Liu, B. Three common caffeoylquinic acids as potential hypoglycemic nutraceuticals: Evaluation of α-glucosidase inhibitory activity and glucose consumption in HepG2 cells. J. Food Biochem. 2020, 44, e13361.
- Yin, X.-L.; Xu, B.-Q.; Zhang, Y.-Q. Gynura divaricata rich in 3,5−/4,5-dicaffeoylquinic acid and chlorogenic acid reduces islet cell apoptosis and improves pancreatic function in type 2 diabetic mice. Nutr. Metab. 2018, 15, 73.
- Liu, X.; Huang, K.; Niu, Z.; Mei, D.; Zhang, B. Protective effect of isochlorogenic acid B on liver fibrosis in non-alcoholic steatohepatitis of mice. Basic Clin. Pharmacol. Toxicol. 2019, 124, 144–153.
- Liu, X.; Niu, Z.; Mei, D.; Zhang B. Mechanisms and Protective Effect of Isochlorogenic Acid B on Liver Injury in Mice. Herald Med. 2020, 39, 895–899. (In Chinese).
- Wan, P.; Xie, M.; Chen, G.; Dai, Z.; Hu, B.; Zeng, X.; Sun, Y. Anti-inflammatory effects of dicaffeoylquinic acids from Ilex kudingcha on lipopolysaccharide-treated RAW264.7 macrophages and potential mechanisms. Food Chem. Toxicol. 2019, 126, 332–342.
- Han, J.; Lv, Q.-Y.; Jin, S.-Y.; Zhang, T.-T.; Jin, S.-X.; Li, X.-Y.; Yuan, H.-L. Comparison of anti-bacterial activity of three types of di-O-caffeoylquinic acids in Lonicera japonica flowers based on microcalorimetry. Chin. J. Nat. Med. 2014, 12, 108–113.
- Fiamegos, Y.C.; Kastritis, P.L.; Exarchou, V.; Han, H.; Bonvin, A.M.J.J.; Vervoort, J.; Lewis, K.; Hamblin, M.R.; Tegos, G.P. Antimicrobial and efflux pump inhibitory activity of caffeoylquinic acids from Artemisia absinthium against Gram-positive pathogenic bacteria. PLoS ONE 2011, 6, e18127.
- Dawidowicz, A.L.; Typek, R. Thermal stability of 5-O-caffeoylquinic acid in aqueous solutions at different heating conditions. J. Agric. Food Chem. 2010, 58, 12578–12584.
- Dawidowicz, A.L.; Typek, R. The influence of pH on the thermal stability of 5-O-caffeoylquinic acids in aqueous solutions. Eur. Food Res. Technol. 2011, 233, 223–232.
- Dawidowicz, A.L.; Typek, R. Formation of ester and amine derivatives of 5-O-caffeoylquinic acid in the process of its simulated extraction. J. Agric. Food Chem. 2012, 60, 12289–12295.
- Dawidowicz, A.L.; Typek, R. Thermal transformation of trans-5-O-caffeoylquinic acid (trans-5-CQA) in alcoholic solutions. Food Chem. 2015, 167, 52–60.
- Dawidowicz, A.L.; Typek, R. Transformation of chlorogenic acids during the coffee beans roasting process. Eur. Food Res. Technol. 2017, 243, 379–390.
- Moon, J.K.; Shibamoto, T. Formation of volatile chemicals from thermal degradation of less volatile coffee components: Quinic acid, caffeic acid, and chlorogenic acid. J. Agric. Food Chem. 2010, 58, 5465–5470.
- Farah, A.; de Paulis, T.; Trugo, L.C.; Martin, P.R. Effect of roasting on the formation of chlorogenic acid lactones in coffee. J. Agric. Food Chem. 2005, 53, 1505–1513.
- Deshpande, S.; Jaiswal, R.; Matei, M.F.; Kuhnert, N. Investigation of acyl migration in mono- and dicaffeoylquinic acids under aqueous basic, aqueous acidic, and dry roasting conditions. J. Agric. Food Chem. 2014, 62, 9160–9170.
- Clifford, M.N.; Johnston, K.L.; Knight, S.; Kuhnert, N. Hierarchical scheme for LC–MSⁿ identification of chlorogenic acids. J. Agric. Food Chem. 2003, 51, 2900–2911.
- Clifford, M.N.; Knight, S.; Kuhnert, N. Discriminating between the six isomers of dicaffeoylquinic acid by LC–MSⁿ. J. Agric. Food Chem. 2005, 53, 3821–3832.
- Xue, M.; Shi, H.; Zhang, J.; Liu, Q.-Q.; Guan, J.; Zhang, J.-Y.; Ma, Q. Stability and degradation of caffeoylquinic acids under different storage conditions studied by HPLC–DAD and HPLC–ESI-CID-MS/MS. Molecules 2016, 21, 948.
- Li, Y.; Wang, Y.; Li, J.; Gao, W.; Niu, Z. Study on the stability of chlorogenic acids in stevia. China Food Addit. 2021, 32, 73–78. (In Chinese).
- Wu, J.; Wang, Z.; Lian, Y.; Hou, L.; Niu, Z.; Wang, W.; Wu, D. Exploration of degradation mechanism of chlorogenic acids in stevia based on UPLC-QTOF MS/MS. J. Chin. Mass Spectrom. Soc. 2025, 46, 65–77. (In Chinese).
- Clifford, M.N.; Jaganath, I.B.; Ludwig, I.A.; Crozier, A. Chlorogenic acids and the acyl-quinic acids: Discovery, biosynthesis, bioavailability and bioactivity. Nat. Prod. Rep. 2017, 34, 1391–1421.
- Alcázar Magaña, A.; Kamimura, N.; Soumyanath, A.; Stevens, J.F.; Maier, C.S. Caffeoylquinic acids: Chemistry, biosynthesis, occurrence, analytical challenges, and bioactivity. Plant J. 2021, 107, 1299–1319.
- Lu, H.; Tian, Z.; Cui, Y.; Liu, Z.; Ma, X. Chlorogenic acid: A comprehensive review of the dietary sources, processing effects, bioavailability, beneficial properties, mechanisms of action, and future directions. Compr. Rev. Food Sci. Food Saf. 2020, 19, 3130–3158.
- Badmos, S.; Kuhnert, N. Stability and degradation of chlorogenic acids in green and roasted coffee beans during long-term storage. Food Res. Int. 2025, 220, 117031.
- Tu, B.; Lai, W. Study on the stability of high-purity chlorogenic acid. Jiangxi Chem. Ind. 2011, 4, 52–54. (In Chinese).
- Zhu, P.; Miao, X.; Chen, Y. Degradation kinetics of chlorogenic acid, cryptochlorogenic acid and neochlorogenic acid under neutral and alkaline pH conditions. Acta Pharm. Sin. 2016, 51, 122–126. (In Chinese).
- Wang, D.; Wang, M.; Ren, X. Study on the degradation law of isochlorogenic acid A in aqueous solution based on chemical kinetics. J. Tianjin Univ. Tradit. Chin. Med. 2021, 40, 247–252. (In Chinese).
- Wen, J.; Ni, F.; Wang, X.; Li, M.; Song, Y.; Wang, Z.; Xiao, W. Optimization on Transformation from Chlorogenic Acid to Neochlorogenic Acid by Box-Behnken Design-response Surface Methodology. World Sci. Technol. Mod. Tradit. Chin. Med. 2017, 19, 1239–1244. (In Chinese).
- Perron, N.R.; Brumaghim, J.L. A review of the antioxidant mechanisms of polyphenol compounds related to iron binding. Cell Biochem. Biophys. 2009, 53, 75–100.
- Sakihama, Y.; Cohen, M.F.; Grace, S.C.; Yamasaki, H. Plant phenolic antioxidant and prooxidant activities: Phenolics-induced oxidative damage mediated by metals in plants. Toxicology 2002, 177, 67–80.
- Strocchi, G.; Bagnulo, E.; Ravaioli, G.; Pellegrino, G.; Bicchi, C.; Liberto, E. Evaluation of the behaviour of phenols and alkaloids in samples of roasted and ground coffee stored in different types of packaging: Implications for quality and shelf life. Food Res. Int. 2023, 174, 113548.
Figure 1.
Contents of chlorogenic acid monomers (%) in the solid product after heat treatment.
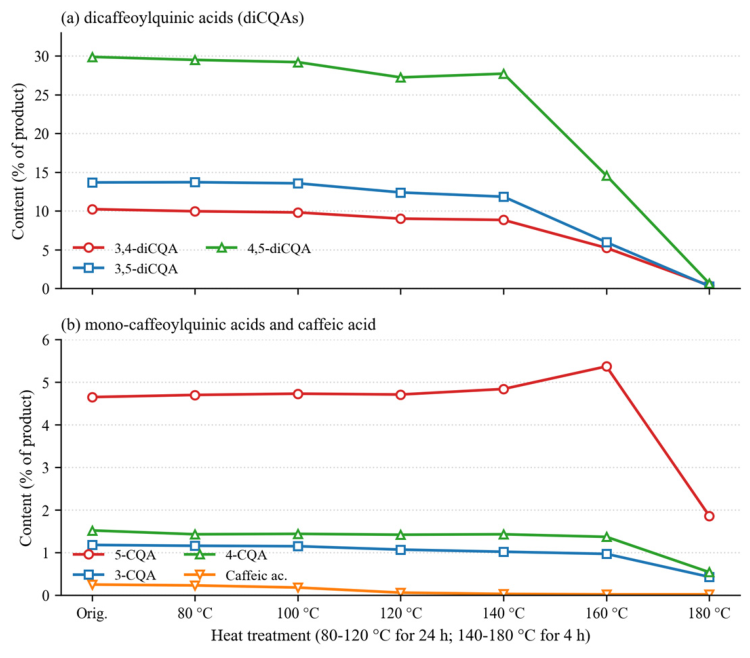
Figure 2.
Total ion chromatograms (ESI⁻) of the stevia chlorogenic acid product before heating and after heating at 160 °C/4 h and 180 °C/4 h.
Figure 2.
Total ion chromatograms (ESI⁻) of the stevia chlorogenic acid product before heating and after heating at 160 °C/4 h and 180 °C/4 h.
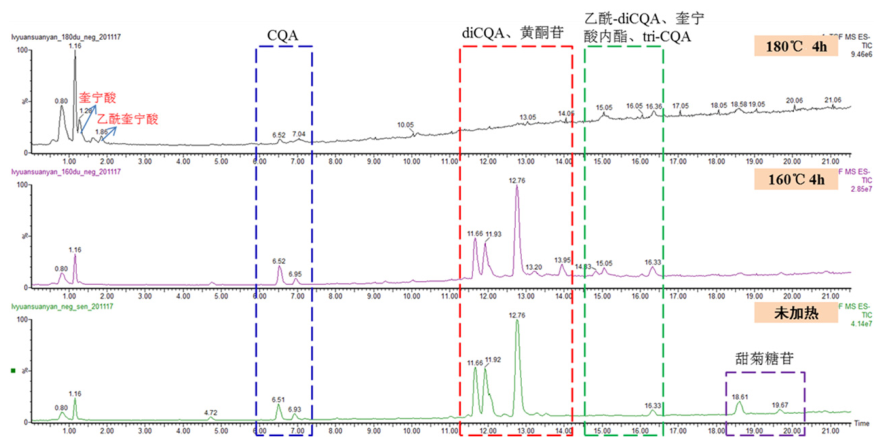
Figure 3.
Thermal degradation pathways of stevia chlorogenic acids. Proposed thermal transformation network of stevia chlorogenic acids: degradation (CQA/diCQA → caffeic acid + quinic acid), methylation (caffeic acid → ferulic acid), acetylation (quinic acid → acetylquinic acid), and diCQA methylation/acetylation/lactonization; dashed arrows denote temperature-dependent (dual-effect) steps.
Figure 3.
Thermal degradation pathways of stevia chlorogenic acids. Proposed thermal transformation network of stevia chlorogenic acids: degradation (CQA/diCQA → caffeic acid + quinic acid), methylation (caffeic acid → ferulic acid), acetylation (quinic acid → acetylquinic acid), and diCQA methylation/acetylation/lactonization; dashed arrows denote temperature-dependent (dual-effect) steps.
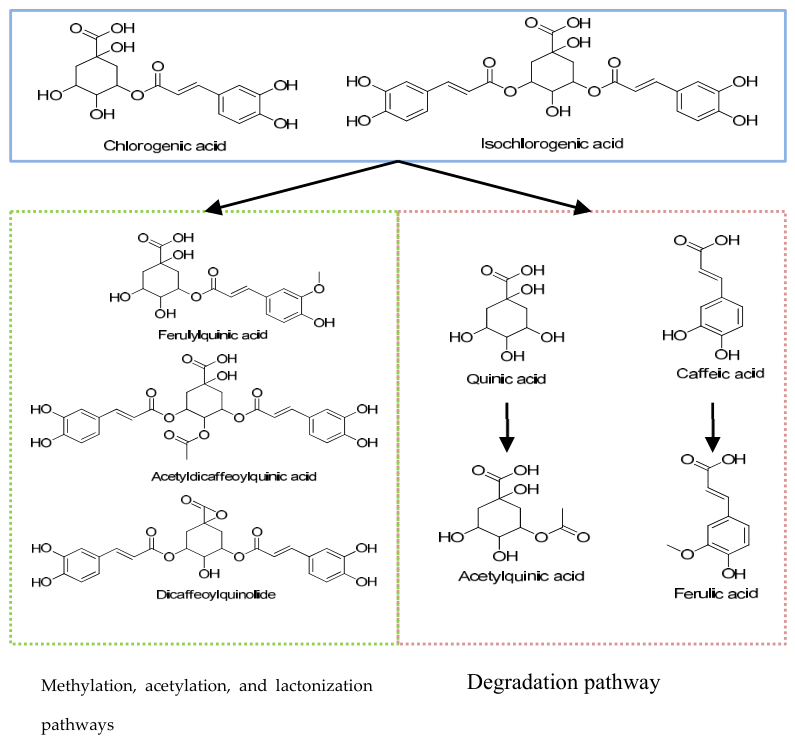
Figure 4.
Change of monomer contents in 80% aqueous methanol (60–80 °C, 8 h) relative to stock.
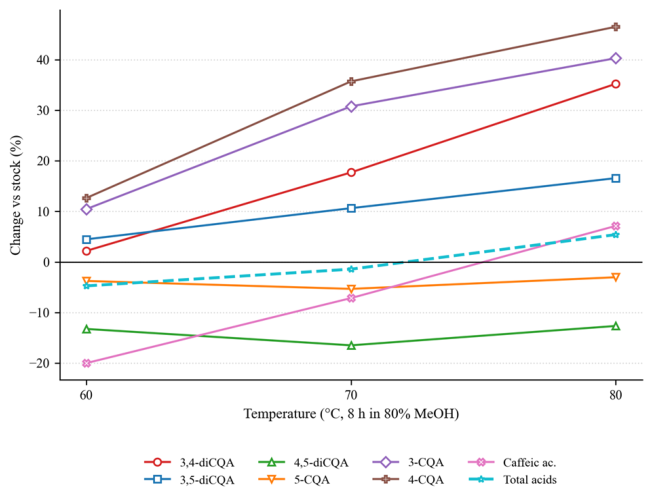
Figure 5.
Change of monomer contents in 80% aqueous ethanol (60–80 °C, 8 h) relative to stock.
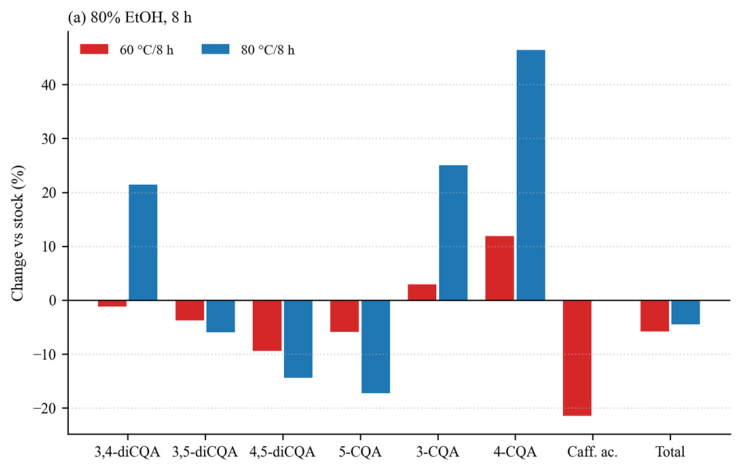
Figure 6.
Monomer interconversion in 80% aqueous methanol at 60–80 °C: 4,5-diCQA → 3,4- and 3,5-diCQA.
Figure 6.
Monomer interconversion in 80% aqueous methanol at 60–80 °C: 4,5-diCQA → 3,4- and 3,5-diCQA.
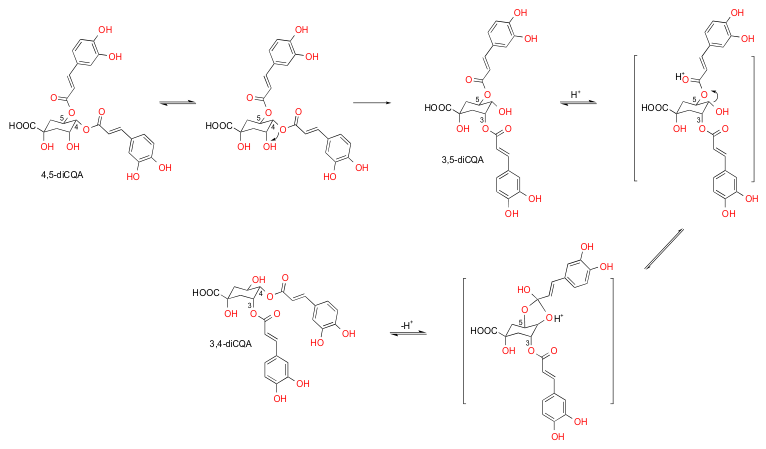
Figure 7.
Change rate (%) of monomers upon metal-ion addition (1:20/1:10/1:5) and recovery after EDTA-2Na decomplexation. EDTA-2Na recoveries at 1:5 ratio: 98.36–99.81% (all monomers; total acid recovery within the same range).
Figure 7.
Change rate (%) of monomers upon metal-ion addition (1:20/1:10/1:5) and recovery after EDTA-2Na decomplexation. EDTA-2Na recoveries at 1:5 ratio: 98.36–99.81% (all monomers; total acid recovery within the same range).
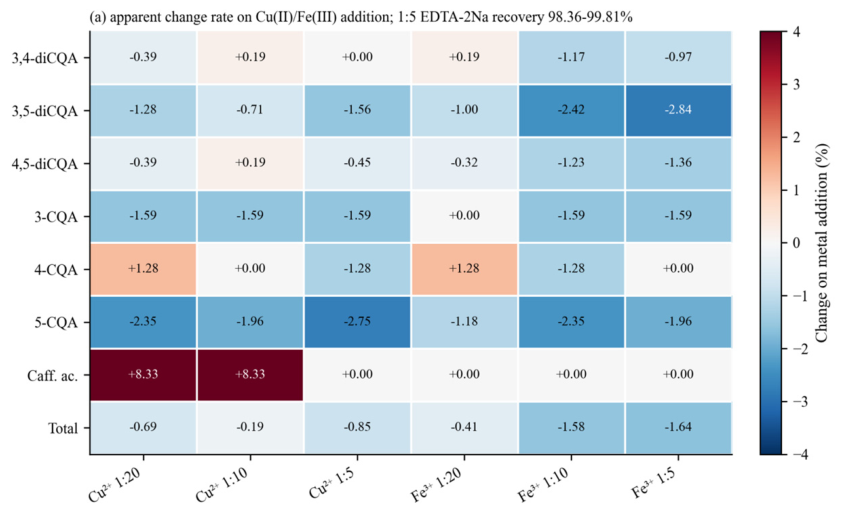
Figure 8.
Photodegradation of the product solution (20 d, 12,000 lx) with and without metal ions. Associated solid light data (25 d): total acid loss 3.76%; 3,4- −5.95%; 3,5- −3.63%; 4,5- −3.89%; 4-CQA −4.33%; 3-/5-CQA <1.0%.
Figure 8.
Photodegradation of the product solution (20 d, 12,000 lx) with and without metal ions. Associated solid light data (25 d): total acid loss 3.76%; 3,4- −5.95%; 3,5- −3.63%; 4,5- −3.89%; 4-CQA −4.33%; 3-/5-CQA <1.0%.
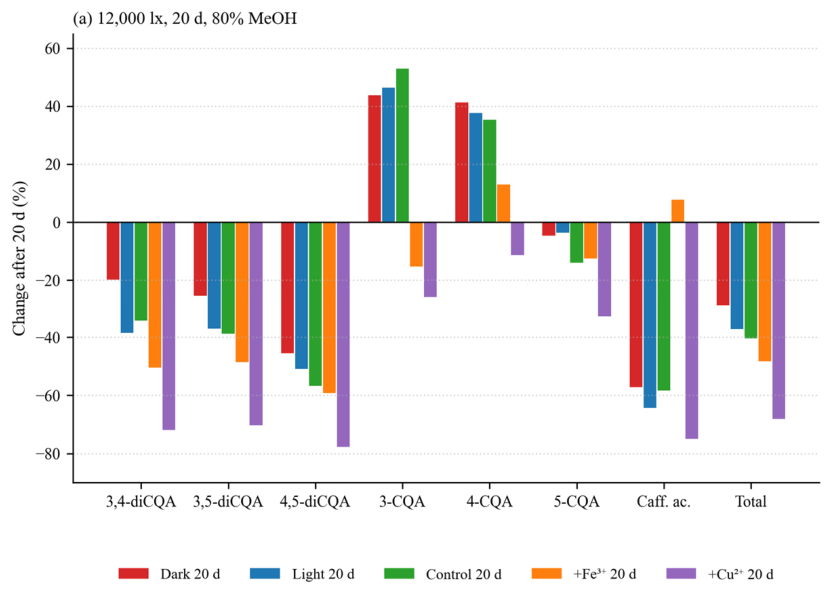
Figure 9.
Oxidative degradation of the product solution (15 d air bubbling) with and without metal ions.
Figure 9.
Oxidative degradation of the product solution (15 d air bubbling) with and without metal ions.
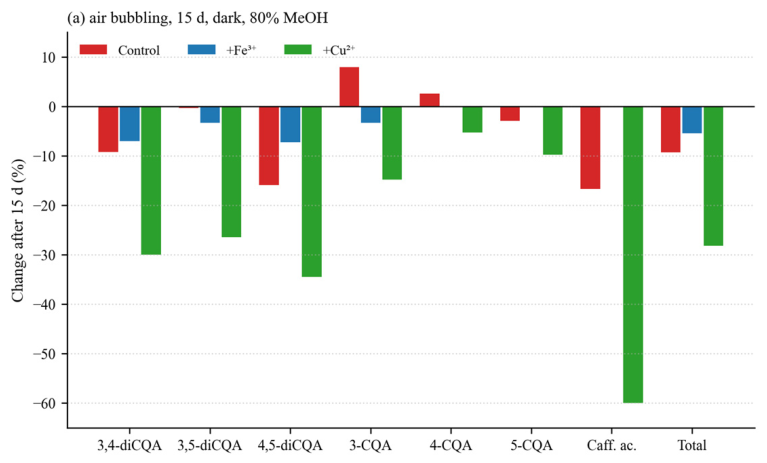
Figure 10.
Total acid variation after heating at 80 °C for 2 h in every pH environment.
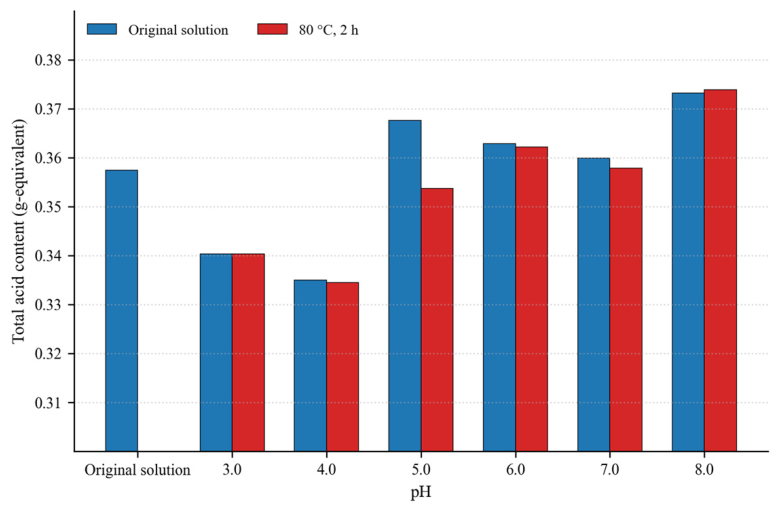
Figure 11.
Thermal stability of process liquids (before/after concentration).
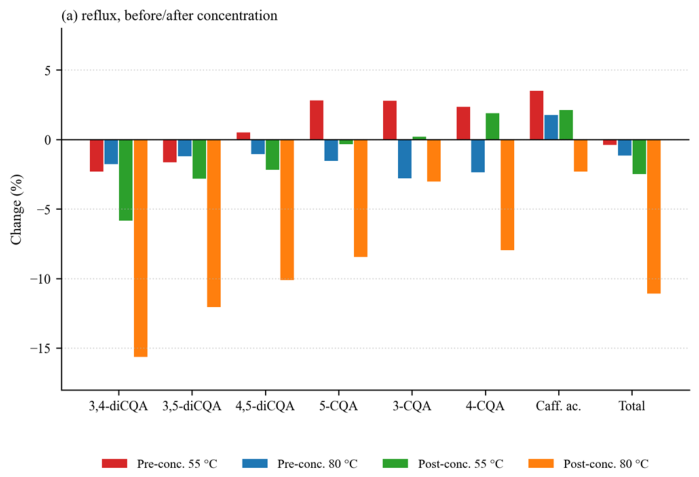

Table 1.
Compounds identified by UPLC-QTOF MS/MS (ESI⁻) in the product before and after heat treatment; peak areas are relative (semiquantitative).
Table 1.
Compounds identified by UPLC-QTOF MS/MS (ESI⁻) in the product before and after heat treatment; peak areas are relative (semiquantitative).
|
tR (min) |
[M–H]⁻ / adduct |
Compound (assigned) |
Formula |
Original |
160 °C/4 h |
180 °C/4 h |
| 1.28 |
191.0543 |
Quinic acid |
C₇H₁₂O₆ |
7.37E+04 |
2.58E+05 |
1.30E+06 |
| 1.65 |
233.0636 |
Acetylquinic acid |
C₉H₁₄O₇ |
– |
1.56E+03 |
1.45E+04 |
| 1.86 |
233.0636 |
Acetylquinic acid |
C₉H₁₄O₇ |
– |
1.16E+04 |
9.40E+04 |
| 4.76 |
353.0881 |
CQA |
C₁₆H₁₈O₉ |
1.77E+05 |
9.35E+04 |
5.34E+03 |
| 6.51 |
353.0881 |
CQA |
C₁₆H₁₈O₉ |
5.57E+05 |
4.74E+05 |
2.91E+04 |
| 6.93 |
353.0881 |
CQA |
C₁₆H₁₈O₉ |
3.43E+05 |
2.34E+05 |
6.27E+03 |
| 7.21 |
179.0339 |
Caffeic acid |
C₉H₈O₄ |
5.05E+04 |
2.06E+03 |
– |
| 11.66 |
515.1195 |
diCQA |
C₂₅H₂₄O₁₂ |
2.77E+06 |
1.76E+06 |
4.63E+03 |
| 11.92 |
515.1195 |
diCQA |
C₂₅H₂₄O₁₂ |
2.16E+06 |
1.14E+06 |
2.86E+03 |
| 12.76 |
515.1195 |
diCQA |
C₂₅H₂₄O₁₂ |
3.39E+06 |
3.04E+06 |
1.26E+04 |
| 13.42 |
193.0487 |
Ferulic acid |
C₁₀H₁₀O₄ |
3.15E+03 |
1.17E+05 |
9.19E+03 |
| 13.95 |
529.134 |
Feruloyl-caffeoylquinic acid |
C₂₆H₂₆O₁₂ |
2.43E+03 |
5.85E+05 |
1.72E+03 |
| 14.83 |
557.1277 |
Acetyl-dicaffeoylquinic acid |
C₂₇H₂₆O₁₃ |
1.23E+04 |
1.27E+05 |
1.10E+03 |
| 15.05 |
497.108 |
Dicaffeoylquinic acid lactone |
C₂₅H₂₂O₁₁ |
– |
9.88E+04 |
– |
| 16.33 |
677.1492 |
tri-CQA |
C₃₄H₃₀O₁₅ |
1.78E+05 |
1.48E+05 |
– |
| 18.61 |
641.3154 |
Stevioside |
C₃₂H₅₀O₁₃ |
5.69E+04 |
4.85E+03 |
– |
| 18.68 |
849.3749* |
Stevioside |
C₃₈H₆₀O₁₈ |
1.12E+05 |
7.82E+03 |
– |
| 18.99 |
1011.4252* |
Stevioside |
C₄₄H₇₀O₂₃ |
1.95E+05 |
8.10E+03 |
1.20E+03 |
| 19.67 |
355.2108* |
Stevioside A |
C₁₈H₃₀O₄ |
6.22E+04 |
3.84E+04 |
3.45E+03 |
Table 2.
Full-wavelength absorption before and after filtration and metal-ion addition.
|
Sample |
λmax (nm) |
Abs(330 nm) before filtration |
Abs after filtration |
Δ after filtration (%) |
Δ after metal addition (%) |
| No metal ions |
325 |
2.38 |
2.41 |
+1.26 |
– |
| + Fe³⁺ |
326 |
2.27 |
2.12 |
−6.61 |
−12.03 |
| + Cu²⁺ |
324 |
2.32 |
2.25 |
−3.02 |
−6.64 |
Disclaimer/Publisher’s Note: The statements, opinions and data contained in all publications are solely those of the individual author(s) and contributor(s) and not of MDPI and/or the editor(s). MDPI and/or the editor(s) disclaim responsibility for any injury to people or property resulting from any ideas, methods, instructions or products referred to in the content. |
© 2026 by the authors. Licensee MDPI, Basel, Switzerland. This article is an open access article distributed under the terms and conditions of the Creative Commons Attribution (CC BY) license (http://creativecommons.org/licenses/by/4.0/).
Copyright: This open access article is published under a Creative Commons CC BY 4.0 license, which permit the free download, distribution, and reuse, provided that the author and preprint are cited in any reuse.