

Submitted:
29 September 2026
Posted:
30 September 2026
You are already at the latest version
Abstract
Background and Aims: Proper sagittal alignment and postural control are important for functional independence. This exploratory cross-sectional study evaluated sagittal vertical alignment (SVA) in individuals with axial spondyloarthritis (iwaxSpA) and examined its associations with plantar-pressure-derived postural sway parameters and handgrip strength (HGS). Methods: Twenty-one iwaxSpA and 20 controls underwent whole-spine lateral radiography for SVA measurement, baropodometric assessment, and HGS testing. Results: An SVA ≥50 mm was observed in 9/21 (42.8%) iwaxSpA and 4/20 (20.0%) controls. Median SVA was higher in iwaxSpA than in controls (31 [16–53] vs. 26.5 [9.50–36.7] mm), but the between-group comparison was not statistically significant after correction for multiple testing (adjusted p=0.802). No baropodometric parameter or mean HGS differed significantly between groups after multiplicity correction. Within the iwaxSpA group, SVA showed nominal positive correlations with age (ρ=0.511, unadjusted p=0.017) and maximal mediolateral displacement (ρ=0.452, unadjusted p=0.039), but neither association remained statistically significant after Benjamini–Hochberg adjustment (adjusted p=0.356 and p=0.395, respectively). Conclusions: Although iwSpA exhibit worse postural assessment and balance control values than controls—when measured via spinal radiography and baropodometry, respectively—there are no significant differences after adjusting for multiple comparisons. In iwSpA, the associations between postural assessment (via spinal radiography) and baropodometric parameters or HGS are weak and non-significant. Larger, adequately characterized studies with prespecified outcomes and adjustment for relevant confounders are needed.
Keywords:
axial spondyloarthritis
; sagittal vertical axis
; posture sway
; balance control
; muscle
1. Introduction
Axial spondyloarthritis (axSpA) is an autoimmune rheumatic disease that affects the sacroiliac joints, the axial skeleton, and other joints. It is also associated with extra-skeletal manifestations, such as inflammatory bowel disease and uveitis [1]. AxSpA encompasses radiographic and non-radiographic diseases. The main difference between the two is the presence of definitive sacroiliitis on plain radiographs in radiographic disease, also known as ankylosing spondylitis [1]. The global prevalence is unclear, ranging from 0.3% to 1.4% [2]. The condition is sometimes associated with human leukocyte antigen B27 (HLA-B27) positivity and has a similar prevalence between sexes with an onset before the age of 45 [1,3]. AxSpA progresses slowly with recurrent periods of remission over the years [3]. In advanced stages, the inflammatory process can progress to fibrosis and calcification, which can impair mobility and cause spinal fusion. In addition to inflammation of the hips, shoulders, peripheral joints, and digits of the hands and feet, iwaxSpA typically present with lower back pain and progressive spinal stiffness [4].
Individuals with axSpA (iwaxSpA) may experience sacroiliitis and enthesitis. They also tend to develop vertebral fusion, which results in progressive spinal stiffness and worsening lower back pain [5]. These changes, combined with the antalgic posture adopted by these individuals, contribute to reduced mobility and flexibility. This leads to a shift in the center of mass (CoM) and a forward-leaning posture [6]. In advanced stages, iwaxSpA experience functional limitations, such as difficulty standing for long periods, looking upward, and reduced field of vision, as well as limitations in activities of daily living (ADLs), communication, driving, leaving the house, and performing personal hygiene due to kyphotic posture and progressive spinal stiffness [7,8]. Sagittal misalignment occurs due to inadequate correction of the kyphotic curve. This leads to worsening thoracic hyperkyphosis, alters the body's vertical axis, and impairs biomechanical balance. Furthermore, this misalignment creates disharmony between the vertebral segments and the pelvis, hindering the body's ability to maintain its center of gravity (CoG) within the base of support [9].
Balance control (BC) involves the coordination of muscle activation and the rapid adjustment of motor responses to environmental demands. This process requires complex interactions among the somatosensory, vestibular, and visual systems [10]. In iwaxSpA, these systems remain intact except for the musculoskeletal system, which is responsible for the motor responses involved in BC. Joint restriction, muscle shortening, and atrophy do occur, however, leading to a loss of range of motion, reduced flexibility, and altered BC [11]. Furthermore, impaired BC and body stability can increase the risk of falls, a phenomenon observed in up to 35% of iwaxSpA [12]. A forward shift of the center of mass (CoM) occurs as axSpA progresses, driven by abnormalities in the neuromuscular and proprioceptive systems. This can lead to significant anatomical changes, including reversal of the cervical curve, loss of the lumbar curve, increased thoracic kyphosis, and hip flexion. Consequently, iwaxSpA may adopt compensatory mechanisms, such as posterior pelvic tilt, hip extension, knee flexion, and ankle dorsiflexion, to counteract shifts in the CoM [13]. Therefore, it is important to assess potential associations between postural deficits and alterations in BC in iwaxSpA in clinical practice.
Some iwaxSpA may experience functional limitations that are partially explained by a progressive loss of muscle mass. They may exhibit reduced muscle strength in their upper and lower limbs, which suggests generalized musculoskeletal system involvement. Computed tomography scans of iwSpA reveal a decrease in total muscle mass, particularly in key areas such as the thighs. These scans also reveal changes in muscle structure, such as quadriceps fibrosis, indicating that axSpA alters muscle composition and quality rather than merely reducing volume [14]. Despite these findings, there has been considerable debate in recent years regarding whether sarcopenia is a complication of axSpA [15].
In axSpA, postural assessment is important because it reflects physical performance and quality of life (QoL) [16]. Patients with axSpA who develop thoracolumbar kyphosis may experience changes in sagittal balance, which can compromise their ability to gaze at the horizon and perform ADLs and work-related tasks [17]. Furthermore, mechanoreceptor dysfunction caused by enthesitis and reduced muscle strength can impair rapid muscle responses and alter BC [18]. Consequently, iwaxSpA are believed to exhibit impaired BC, which is characterized by altered ankle-hip-step balance strategies, disordered muscle activation, and restricted trunk-righting reactions due to limited mobility. Reduced range of motion in the cervical spine and head can also affect postural adjustments and impair gaze stabilization [11]. A deeper understanding of postural changes in axSpA and their relationship with BC and handgrip strength (HGS) is essential for developing more effective rehabilitation strategies. Thus, this study aimed to evaluated sagittal vertical alignment (SVA) in iwaxSpA and examined its associations with plantar-pressure-derived postural sway parameters and HGS.
2. Materials and Methods
2.1. Subjects and Ethics
From December 2025 to September 2026, a cross-sectional study was conducted with adults (≥18 years) with axSpA of both sexes, at Policlínica Tereza Rambaldi, Campos dos Goytacazes, Brazil. Eligibility for the axSpA group was based on previously proposed classification criteria [19]. Individuals with clinically stable axSpA for at least six months and without hip or knee prostheses were included. Exclusion criteria comprised systemic musculoskeletal diseases, vestibular and/or cerebellar disorders, cognitive limitations that prevented comprehension of the instructions, pregnancy, previous or current psychiatric impairment, and a history of hip surgery. A control group of 20 adults (≥18 years) without previous neurological or orthopedic disease and without ambulation disability was also evaluated. Full-spine radiographs of the control subjects were obtained for research purposes, in order to rule out neurological and orthopedic conditions that could affect SVA. All radiographs were obtained in accordance with standard radiation protection procedures.
The Research Ethics Committee of Centro Universitário Augusto Motta approved the protocol (CAAE-92856525.6.0000.5235; approval date: 24 november 2025). The study adhered to the principles of the Declaration of Helsinki, and all patients provided written informed consent.
2.2. Assessments
SVA was assessed using a panoramic lateral radiograph encompassing the cervical, thoracic, and lumbar spine and the pelvis. The SVA was defined as the horizontal distance between the C7 plumb line and the posterosuperior aspect of S1 (Figure 1) [20]. Participants were positioned standing upright and barefoot with the feet parallel. The upper limbs were flexed to 90°, with the hands resting lightly on supports positioned anteriorly. One evaluator (P.F.F.B.) analyzed the images without access to the participants' clinical or demographic data. The radiographs were analyzed using Surgimap Spine software (Nemaris Inc., New York, NY, USA). Prior to measurement, each image was calibrated individually based on the grid markers present on the radiograph itself. Since the distance between the markers was actually 10 cm, the image scale was adjusted within the software so that subsequent distances would be expressed in millimeters. SVA was analyzed as a continuous measure of global sagittal alignment. For descriptive categorical analyses, values from 0 to 49 mm were considered within the reference range and values ≥50 mm were classified as anterior sagittal displacement [21,22].
We evaluated plantar load distribution and postural sway using a BaroScan baropodometer (Londrina, Brazil). The platform's dimensions are 46 cm in length and 51 cm in width, and it is equipped with 4,096 pressure sensors. The acquisition rate was 10 frames per second. Participants stood barefoot with the arms relaxed at the sides, gaze fixed on a point ahead, and body in an upright position. These conditions were standardized to reduce procedural variability without suppressing the physiological postural sway of interest. Participants remained on the platform for 30 seconds in a quiet, level environment with controlled temperature and lighting. Before acquiring valid data, a familiarization trial was conducted to allow the participant to adapt to the experimental protocol. Data obtained during this initial trial were excluded from the analyses. A second attempt was then performed, and the resulting data were used for analysis. Data were processed using BaroSys software version 3.8.2.2 (Londrina, Brazil). The following variables were obtained: forefoot and rearfoot load distribution; right and left lower-limb load distribution (LRLL and LLLL); maximal amplitude, mean velocity, and standard deviation of anteroposterior displacement (MADAP, MVAP, and SDDAP); maximal amplitude, mean velocity, and standard deviation of mediolateral displacement (MADML, MVML, and SDDML); maximal center-of-pressure displacement (MDCOP); total center-of-pressure displacement area (MADCOP); and the coefficient of maximal displacement divided by area (CMD/A) [23].
HGS was measured using a digital dynamometer (Electronic Hand Dynamometer, SKU A1754, São Paulo, Brazil). Participants were seated on an armless chair with the elbow flexed to 90°, forearm in neutral position, and wrist extended between 0° and 30° [24]. Maximal HGS of the dominant hand was assessed during a 3-s sustained contraction. Three trials were performed, separated by 1-min intervals, and the highest value was retained for analysis. The sex-specific cutoff values applied in the original analysis were 28 kgf for men and 18 kgf for women [25].
2.3. Statistical Analysis
Sample size calculation was performed using G*Power software version 3.1.9.7. The study was designed to compare two independent groups of participants (iwaxSpA and controls). The primary outcome variable selected was the SVA, based on results from the study by de Oliveira and colleagues [17]. Considering a significance level of 5% and a statistical power of 80%, the sample size calculation indicated a requirement of 20 participants per group.
We assessed all quantitative variables for normality of distribution separately within each applicable group using the Shapiro–Wilk test. We complemented this analysis with visual inspection of histograms and Q–Q plots. Comparisons between the axSpA and control groups for each quantitative variable were performed using a Welch's t-test if both groups met the criteria for a parametric approach and a Mann–Whitney test if not. Effect size was measured using Hedges' g for parametric comparisons and rank-biserial correlation for nonparametric comparisons, both with 95% confidence intervals (95% CI). For categorical variables, we tested for associations with the group using the chi-square test. When an expected cell count fell below five, we used Fisher’s exact test. We measured effect size using the odds ratio. We defined the event as “male” for sex and “left-handed” for dominant side. We compared the odds in the axSpA group relative to the control group. Associations between postural assessment (SVA) and other quantitative variables in the axSpA group were measured using Pearson’s coefficient if the relationship between the two variables was approximately linear and neither showed evidence of deviation from normality. Otherwise, Spearman’s coefficient was used. The 95% CI for the Pearson coefficient was obtained using the standard closed-form formula. The 95% CI for the Spearman coefficient was obtained via percentile bootstrapping with 2,000 resamples and a fixed seed of 123 for reproducibility.
The p-values from the between-group comparisons and the SVA association tests formed two distinct families of tests. Each family underwent a separate Benjamini-Hochberg adjustment to control the false discovery rate. The significance level adopted prior to adjustment was 5%. The reported 95% CIs were individual and were not adjusted for multiple analyses. Therefore, conclusions regarding statistical significance after controlling for multiplicity were based on p-values adjusted using the Benjamini–Hochberg method rather than on the 95% CIs directly. The analyses were performed in the R environment, version 4.3.3.
2. Results
2.1. Patient Characteristics
Of the 22 iwaxSpA who were evaluated for inclusion in the study, only one was excluded due to pregnancy. Of those patients, 11 were male and 10 were female. The mean age was 48.8±14.1 years, and the median time since diagnosis was 11 (6–18.2) years. Seven participants had radiographic axSpA, while 14 had non-radiographic axSpA. Eleven participants tested positive for HLA-B27. Comparisons of anthropometric data between the axSpA group and the control group showed no significant differences, except for larger foot size in the axSpA group (unadjusted p-value = 0.045) (Table 1). However, this difference in foot size between the two groups was not significant after adjusting for multiple comparisons (adjusted p-value=0.796).
2.2. Comparisons Between the Two Groups Regarding Sagittal Alignment Baropodometric Parameters, and Handgrip Strength
An SVA ≥50 mm was observed in 9/21 (42.8%) iwaxSpA and 4/20 (20.0%) controls. Median SVA was higher in iwaxSpA than in controls (31 [16–53] vs. 26.5 [9.50–36.7] mm), but the difference was not statistically significant after multiplicity correction (adjusted p=0.802). Point estimates for several load-distribution and CoP-derived variables differed between groups, but none remained statistically significant after correction for multiple testing. Six iwaxSpA (28.6%) and two controls (20.0%) had HGS values below the adopted sex-specific cutoffs; mean HGS did not differ significantly between groups in the original unadjusted comparison. Because these analyses were not adjusted for age and sex, the estimates should be considered exploratory pending adjusted modeling. Table 2 summarizes the original between-group comparisons.
2.3. Correlations Between Sagittal Vertical Alignment, Baropodometric Parameters, and Handgrip Strength
Within the iwaxSpA group, SVA showed a nominal positive correlation with age (ρ=0.511, 95% CI 0.019–0.813; unadjusted p=0.017), but the association was not statistically significant after Benjamini–Hochberg correction (adjusted p=0.356). SVA also showed a nominal positive correlation with MADML (ρ=0.452, 95% CI −0.006 to 0.799; unadjusted p=0.039), which likewise did not remain statistically significant after multiplicity adjustment (adjusted p=0.395). No other SVA correlation remained statistically significant after multiplicity correction. These bivariate associations should be interpreted cautiously because of the small sample and potential confounding, particularly by age and sex. Table 3 presents the original correlation analyses.
3. Discussion
This exploratory study examined SVA, baropodometric measures of plantar load distribution and postural sway, and HGS in iwaxSpA compared with controls. The principal observation is not that the groups were equivalent, but that the available sample produced imprecise estimates and no statistically robust between-group differences after correction for multiple testing. SVA was numerically higher in iwaxSpA, several baropodometric point estimates suggested greater sway or altered load distribution, and mean HGS was lower; however, the corresponding confidence intervals were wide. Within the axSpA group, the nominal associations of SVA with age and MADML did not remain statistically significant after multiplicity correction. These findings should therefore be interpreted as exploratory estimates rather than evidence of absence of clinically relevant differences.
AxSpA primarily affects the sacroiliac joints and spine and may produce progressive restriction of spinal mobility and altered sagittal alignment [27]. In the present sample, 42.8% of iwaxSpA and 20.0% of controls had SVA ≥50 mm. Although the continuous SVA comparison was not statistically significant after multiplicity correction, the approximately twofold difference in the proportion above the descriptive threshold is clinically noteworthy and warrants more precise estimation in a larger cohort. Importantly, a non-significant result in this small sample should not be interpreted as proof of equivalence. SVA captures one component of global sagittal alignment and may not fully characterize pelvic, thoracic, lumbar, cervical, or lower-limb compensatory strategies. Future studies should consider a broader set of sagittal alignment parameters when feasible.
Postural control depends on the integration of sensory information and coordinated neuromuscular responses that maintain the center of pressure within the base of support [11]. In the present study, several baropodometric point estimates differed between groups, but none remained statistically significant after multiplicity correction. These null inferential findings may reflect limited statistical precision, phenotypic heterogeneity, the measurement properties of the baropodometric protocol, or genuinely small between-group effects. Accordingly, the data do not establish that baropodometry is insensitive to axSpA-related postural changes. Load-distribution variables should also be distinguished conceptually from CoP-derived sway variables because they represent related but non-equivalent constructs. Previous studies have likewise reported heterogeneous findings depending on the balance task, instrument, and disease phenotype [29,30,31].
In the original bivariate analyses, SVA showed nominal positive associations with age and MADML, but neither association remained statistically significant after false-discovery-rate correction. The association with age is nevertheless clinically plausible and relevant to interpretation because age also differed between groups. Thus, future analyses should evaluate the SVA–postural-sway relationship using parsimonious adjusted models rather than relying exclusively on unadjusted bivariate correlations. Previous work using clinical postural measures has reported associations between sagittal alignment and balance-related outcomes, whereas more recent studies have demonstrated that dynamic balance and gait may be affected even when static sway variables are similar [29,31].
Individuals with axSpA may exhibit reduced muscle performance because of systemic inflammation, physical inactivity, metabolic alterations, pain, and structural impairment [32]. In the present study, HGS was used as a pragmatic marker of muscle function; it should not be interpreted as a direct measure of lower-limb or postural muscle strength. Mean HGS was numerically lower in iwaxSpA, but the original between-group comparison was not statistically significant after multiplicity correction. Interpretation is further complicated by the unequal sex distribution between groups because sex is strongly associated with HGS. Accordingly, age- and sex-adjusted analyses are needed before attributing HGS differences to axSpA. Future studies should additionally assess lower-limb muscle groups that contribute more directly to postural control.
From a clinical perspective, SVA, plantar-pressure-derived postural sway, and HGS should be viewed as complementary rather than interchangeable domains. The present data do not support using a single normal SVA value to exclude balance impairment or muscle-function deficits in axSpA. A multimodal assessment integrating disease activity, spinal mobility, structural damage, postural control, and task-relevant muscle performance is likely to be more informative for rehabilitation planning.
This study has several limitations. First, the sample was small and produced wide 95% CIs, limiting precision and the ability to detect small-to-moderate effects. Second, the single-center design and the recruitment strategy may limit external validity and should be described explicitly. Third, the axSpA group was heterogeneous, including 7 radiographic and 14 non-radiographic cases, and the study did not provide detailed measures of disease activity, spinal mobility, functional status, inflammatory markers, pain, current pharmacological treatment, physical activity, or structural damage that could explain variation in SVA and postural control. Fourth, the groups were not matched for age and sex, and the original inferential analyses were not adjusted for these potential confounders. Fifth, sagittal alignment was represented by SVA alone, without a broader set of spinopelvic parameters. Sixth, reliability indices for the radiographic measurements were not reported despite duplicate ratings by two evaluators. Seventh, baropodometry was based on a brief static assessment and important acquisition/processing details were not fully reported; the validity and reliability of the specific device and protocol for all analyzed CoP variables should be documented. Eighth, HGS was the only muscle-strength measure and does not directly quantify the lower-limb muscle groups most relevant to postural control. Ninth, the large number of correlated outcomes relative to sample size increased multiplicity and reduced inferential efficiency. Finally, the cross-sectional design precludes causal inference.
5. Conclusions
Although iwSpA exhibit worse postural assessment and BC values than controls—when measured via spinal radiography and baropodometry, respectively—there are no significant differences after adjusting for multiple comparisons. In iwSpA, the associations between postural assessment (via spinal radiography) and baropodometric parameters or HGS are weak and non-significant. Controlled multicenter studies involving larger cohorts of iwaxSpA are needed to better define the roles of spinal radiography and baropodometry in this population.
Author Contributions
Conceptualization, K.R.R.d.S. and A.J.L.; methodology, G.S.d.E.G., L.M.C., C.A.L., and E.R.M.; formal analysis, K.R.R.d.S. and A.J.L.; investigation, K.R.R.d.S., G.S.d.E.G., L.M.C., P.J.F.B., C.A.L., and E.R.M.; data curation, A.J.L.; writing—original draft preparation, A.J.L.; writing—review and editing, K.R.R.d.S., G.S.d.E.G., L.M.C., P.J.F.B., C.A.L., and E.R.M.; supervision, K.R.R.d.S.; project administration, K.R.R.d.S. and A.J.L.; funding acquisition, A.J.L. All authors have read and agreed to the published version of the manuscript.
Funding
This work was supported by the Conselho Nacional de Desenvolvimento Científico e Tecnólogico (CNPq) under Grant number #401633/2023-3, Brazil, the Fundação Carlos Chagas Filho de Amparo à Pesquisa do Estado do Rio de Janeiro (FAPERJ) under Grant number #E-26/200.037/2026, Brazil, and the Coordenação de Aperfeiçoamento de Pessoal de Nível Superior (CAPES) under Grant number Finance Code 001, Brazil.
Institutional Review Board Statement
The study was conducted in accordance with the Declaration of Helsinki. All patients provided written informed consent. The protocol was approved by the Research Ethics Committee of the Centro Universitário Augusto Motta (CAAE-92856525.6.0000.5235; 24 November 2025).
Informed Consent Statement
Informed consent was obtained from all subjects involved in the study.
Data Availability Statement
Data is contained within the article or supplementary material.
Conflicts of Interest
The authors declare no conflicts of interest.
Abbreviations
The following abbreviations are used in this manuscript:
| axSpA | Axial spondyloarthritis |
| HLA-B27 | Human leukocyte antigen B27 |
| IwaxSpA | Individuals with axial spondyloarthritis |
| CoM | Center of mass |
| ADL | Activity of daily living |
| CoG | Center of gravity |
| BC | Balance control |
| QoL | Quality of life |
| SVA | Sagittal vertical axis |
| LLRL | Percentage of load on the right lower limb |
| LLLL | Percentage of load on the left lower limb |
| MADAP | Maximal amplitude of anteroposterior displacement |
| MVAP | Mean velocity of anteroposterior displacement |
| SDDAP | Standard deviation of anteroposterior displacement |
| MADML | Maximal amplitude of mediolateral displacement |
| MVML | Mean velocity of mediolateral displacement |
| SDDML | Standard deviation of mediolateral displacement |
| MDCOP | Maximal displacement of center of pressure |
| MADCOP | Maximal total area of displacement of center of pressure |
| CMD/A | Coefficient of maximal displacement divided by the area |
| HGS | Handgrip strength |
| 95% CI | 95% confidence interval |
References
- Bittar, M.; Deodhar, A. Axial spondyloarthritis: a review. JAMA 2025, 333, 408–420. [Google Scholar] [PubMed]
- Bohn, R.; Cooney, M.; Deodhar, A.; Curtis, J.R.; Golembesky, A. Incidence and prevalence of axial spondyloarthritis: methodologic challenges and gaps in the literature. Clin. Exp. Rheumatol. 2018, 36, 263–274. [Google Scholar] [PubMed]
- Atar, E.; Askin, A. Somatosensory dysfunction related neuropathic pain component affects disease activity, functional status and quality of life in ankylosing spondylitis. Int. J. Rheum. Dis. 2020, 23, 1656–1663. [Google Scholar] [CrossRef] [PubMed]
- Moltó, A.; Nikiphorou, E. Comorbidities in spondyloarthritis. Front Med. 2018, 5, 62. [Google Scholar] [CrossRef] [PubMed]
- Nam, B.; Jo, S.; Bang, S.; Bang, S.Y.; Park, Y.; Shin, J.H.; Park, Y.S.; Lee, S.; Joo, K.B.; Kim, T.H. Clinical and genetic factors associated with radiographic damage in patients with ankylosing spondylitis. Ann. Rheum. Dis. 2022, 82, 527–532. [Google Scholar] [CrossRef] [PubMed]
- Çınar, E.; Akkoç, Y.; Karapolat, H.; Durusoy, R.; Keser, G. Postural deformities: potential morbidities to cause balance problems in patients with ankylosing spondylitis? Eur. J. Rheumatol. 2016, 3, 5–9. [Google Scholar] [PubMed]
- Jalai, C.M.; Cruz, D.L.; Diebo, B.G.; Poorman, G.; Lafage, R.; Bess, S.; Ramchandran, S.; Day, L.M.; Vira, S.; Liabaud, B.; et al. Whole-body analysis of age-adjusted alignment in adult patients with spinal deformity and lower limb compensation. Spine 2017, 42, 653–661. [Google Scholar] [CrossRef] [PubMed]
- Batur, E.B.; Karataş, G.K. Do postural changes affect balance in patients with ankylosing spondylitis? J. Rehabil. Med. 2017, 49, 437–440. [Google Scholar] [CrossRef] [PubMed]
- Schwab, F.; Lafage, V.; Boyce, R.; Skalli, W.; Farcy, J.P. Gravity line analysis in adult volunteers: age-related correlation with spinal parameters, pelvic parameters, and foot position. Spine 2006, 31, E959–E967. [Google Scholar] [PubMed]
- Horak, F.B. Postural orientation and equilibrium: what do we need to know about neural control of balance to prevent falls? Age Ageing 2006, 35 (Suppl. 2), ii7–ii11. [Google Scholar] [CrossRef] [PubMed]
- Pompeu, J.E.; Romano, R.S.L.; Pompeu, S.M.A.A.; Lima, S.M.A.L. Static and dynamic balance in subjects with ankylosing spondylitis: literature review. Rev. Bras. Reumatol. 2012, 52, 409–416. [Google Scholar] [PubMed]
- El Miedany, Y.; El Gaafary, M.; Youssef, S.; Palmer, D. Towards a multidimensional assessment of patient-reported outcome measures: development and validation of a questionnaire for patients with ankylosing spondylitis/spondyloarthritis. Jt. Bone Spine 2010, 77, 575–581. [Google Scholar] [CrossRef] [PubMed]
- Sawacha, Z.; Carraro, E.; Del Din, S.; Guiotto, A.; Bonaldo, L.; Punzi, L.; Cobelli, C.; Masiero, S. Biomechanical assessment of balance and posture in individuals with ankylosing spondylitis. J. Neuroeng. Rehabil. 2012, 9, 63. [Google Scholar] [CrossRef] [PubMed]
- Faus-Riera, S.; Martinez-Pardo, S.; Blanch-Rubio, J.; Benito-Ruiz, P.; Duró-Pujol, J.C.; Corominas-Torres, J.M. Clinical, enzymatic, electromyographic and histological correlation. J. Rheumatol. 1991, 18, 1368–1371. [Google Scholar] [PubMed]
- Ceolin, C.; Bindoli, S.; Cozzi, G.; di Marzio, B.; Lorenzin, M.; De Rui, M.; Sfriso, P.; Doria, A.; Sergi, G.; Ramonda, R. Body composition, bone mineral density, and functional impairment in axial spondyloarthritis: a 36-month longitudinal study. BMC Musculoskelet. Disord. 2025, 26, 878. [Google Scholar] [CrossRef] [PubMed]
- Magrey, M.; Wei, J.C.C.; Yndestad, A.; Bushmakin, A.G.; Cappelleri, J.C.; Dina, O.; Deodhar, A. Relationships of work productivity and activity impairment with patient-reported outcomes in ankylosing spondylitis: results from two trials. Arthritis Care Res. 2004, 76, 359–365. [Google Scholar]
- de Oliveira, T.L.; Silva, F.D.; Ormond Filho, A.G.; Nico, M.A.C.; da Rocha Correa Fernandes, A.; Ramiro, S.; de Medeiros Pinheiro, M. Exploring the influence of sagittal imbalance on spinal mobility, function and quality of life in axial spondyloarthritis: a novel comprehensive compensatory mechanism of adaptation. Adv. Rheumatol. 2025, 65, 60. [Google Scholar] [CrossRef] [PubMed]
- Lee, S.; Lee, J.Y.; Hwang, J.H.; Shin, J.H.; Kim, T.H.; Kim, S.K. Clinical importance of inflammatory facet joints of the spine in ankylosing spondylitis: a magnetic resonance imaging study. Scand. J. Rheumatol. 2016, 45, 491–498. [Google Scholar] [CrossRef] [PubMed]
- Rudwaleit, M.; van der Heijde, D.; Landewé, R.; Listing, J.; Akkoc, N.; Brandt, J.; Braun, J.; Chou, C.T.; Collantes-Estevez, E.; Dougados, M.; et al. The development of Assessment of SpondyloArthritis international Society classification criteria for axial spondyloarthritis (part II): validation and final selection. Ann. Rheum. Dis. 2009, 68, 777–783. [Google Scholar] [CrossRef] [PubMed]
- Gueugnon, M.; Riglet, L.; Fournel, I.; Ksiazek, E.; Beaurain, J.; Chapon, R.; Ornetti, P.; Laroche, D. Evaluation of the sagittal vertical axis with postural and 3D motion analyses in lumbar spinal stenosis. BMC Musculoskelet. Disord. 2024, 25, 827. [Google Scholar] [CrossRef] [PubMed]
- Lafage, R.; Schwab, F.; Challier, V.; Henry, J.K.; Gum, J.; Smith, J.; Hostin, R.; Shaffrey, C.; Kim, H.J.; Ames, C.; et al. Defining spino-pelvic alignment thresholds: should operative goals in adult spinal deformity surgery account for age? Spine 2016, 41, 62–68. [Google Scholar] [PubMed]
- Liu, C.; Zhu, W.; Li, Y.; Li, X.; Shi, B.; Kong, C.; Lu, S. How does cervical sagittal profile change after the spontaneous compensation of global sagittal imbalance following one- or two-level lumbar fusion. BMC Musculoskelet. Disord. 2024, 25, 387. [Google Scholar] [CrossRef] [PubMed]
- Pena Junior, P.M.; de Sá Ferreira, A.; Telles, G.; Lemos, T.; Nogueira, L.A.C. Concurrent validation of the centre of pressure displacement analyzed by baropodometry in patients with chronic non-specific low back pain during functional tasks. J. Bodyw. Mov. Ther. 2021, 28, 489–495. [Google Scholar] [CrossRef] [PubMed]
- Nonato, C.P.; Azevedo, B.L.P.A.; Oliveira, J.G.M.; Gardel, D.G.; de Souza, D.C.N.; Lopes, A.J. The Glittre Activities of Daily Living Test in women with scleroderma and its relation to hand function and physical capacity. Clin. Biomech. 2020, 73, 71–77. [Google Scholar] [CrossRef] [PubMed]
- Auyeung, T.W.; Arai, H.; Chen, L.K.; Woo, J. Letter to the editor: Normative data of handgrip strength in 26344 older adults—A pooled dataset from eight cohorts in Asia. J. Nutr. Health Aging. 2020, 24, 125–126. [Google Scholar] [CrossRef] [PubMed]
- Abudayeh, A.; Fishchenko, I. Defining sagittal imbalance in axial spondyloarthritis: considerations beyond C7 sagittal vertical axis. Adv. Rheumatol. 2006, 66, 13. [Google Scholar]
- Braun, J.; Sieper, J. Ankylosing spondylitis. Lancet 2007, 369, 1379–1390. [Google Scholar] [CrossRef] [PubMed]
- Wanders, A.J.; Landewe, R.B.; Spoorenberg, A.; Dougados, M.; Van Der Linden, S.; Mielants, H.; van der Tempel, H.; van der Heijde, D.M.F.M. What is the most appropriate radiologic scoring method for ankylosing spondylitis? A comparison of the available methods based on the Outcome Measures in Rheumatology Clinical Trials filter. Arthritis Rheum. 2004, 50, 2622–2632. [Google Scholar] [PubMed]
- Aydoğ, E.; Depedibi, R.; Bal, A.; Eksioglu, E.; Unlü, E.; Cakci, A. Dynamic postural balance in ankylosing spondylitis patients. Rheumatology 2006, 45, 445–448. [Google Scholar] [CrossRef] [PubMed]
- Murray, H.C.; Elliott, C.; Barton, S.E.; Murray, A. Do subjects with ankylosing spondylitis have poorer balance than normal subjects? Rheumatology 2000, 39, 497–500. [Google Scholar] [CrossRef] [PubMed]
- Türk, E.; Yurdakul, F.G.; Güler, T.; Bodur, H. Posture, balance and gait in axial spondyloarthritis: a case-control study. Rheumatol. Int. 2024, 44, 2527–2538. [Google Scholar] [CrossRef] [PubMed]
- Sardoo, A.M.; Neto, A.; Pinheiro Torres, R.; Rodrigues-Manica, S.; Domingues, L.; Lage Crespo, C.; Lagoas-Gomes, J.; Mascarenhas, V.; Mendes, C.S.; Galzerano, A.; et al. The role of muscle in the susceptibility and progression of axial spondyloarthritis: the myospa study protocol. Acta Reumatol. Port. 2021, 46, 342–349. [Google Scholar] [PubMed]
- Lima, T.R.L.; Almeida, V.P.; Ferreira, A.S.; Guimarães, F.S.; Lopes, A.J. Handgrip strength and pulmonary disease in the elderly: what is the link? Aging Dis. 2019, 10, 1109–1129. [Google Scholar] [CrossRef] [PubMed]
- Butler, A.A.; Lord, S.R.; Rogers, M.W.; Fitzpatrick, R.C. Muscle weakness impairs the proprioceptive control of human standing. Brain Res. 2008, 1242, 244–251. [Google Scholar] [CrossRef] [PubMed]
Figure 1.
Illustration showing how to measure the sagittal vertical axis (SVA). The SVA corresponds to the horizontal distance between a vertical plumb line drawn from the center of the C7 vertebral body and a vertical line drawn at the posterosuperior aspect of S1.
Figure 1.
Illustration showing how to measure the sagittal vertical axis (SVA). The SVA corresponds to the horizontal distance between a vertical plumb line drawn from the center of the C7 vertebral body and a vertical line drawn at the posterosuperior aspect of S1.
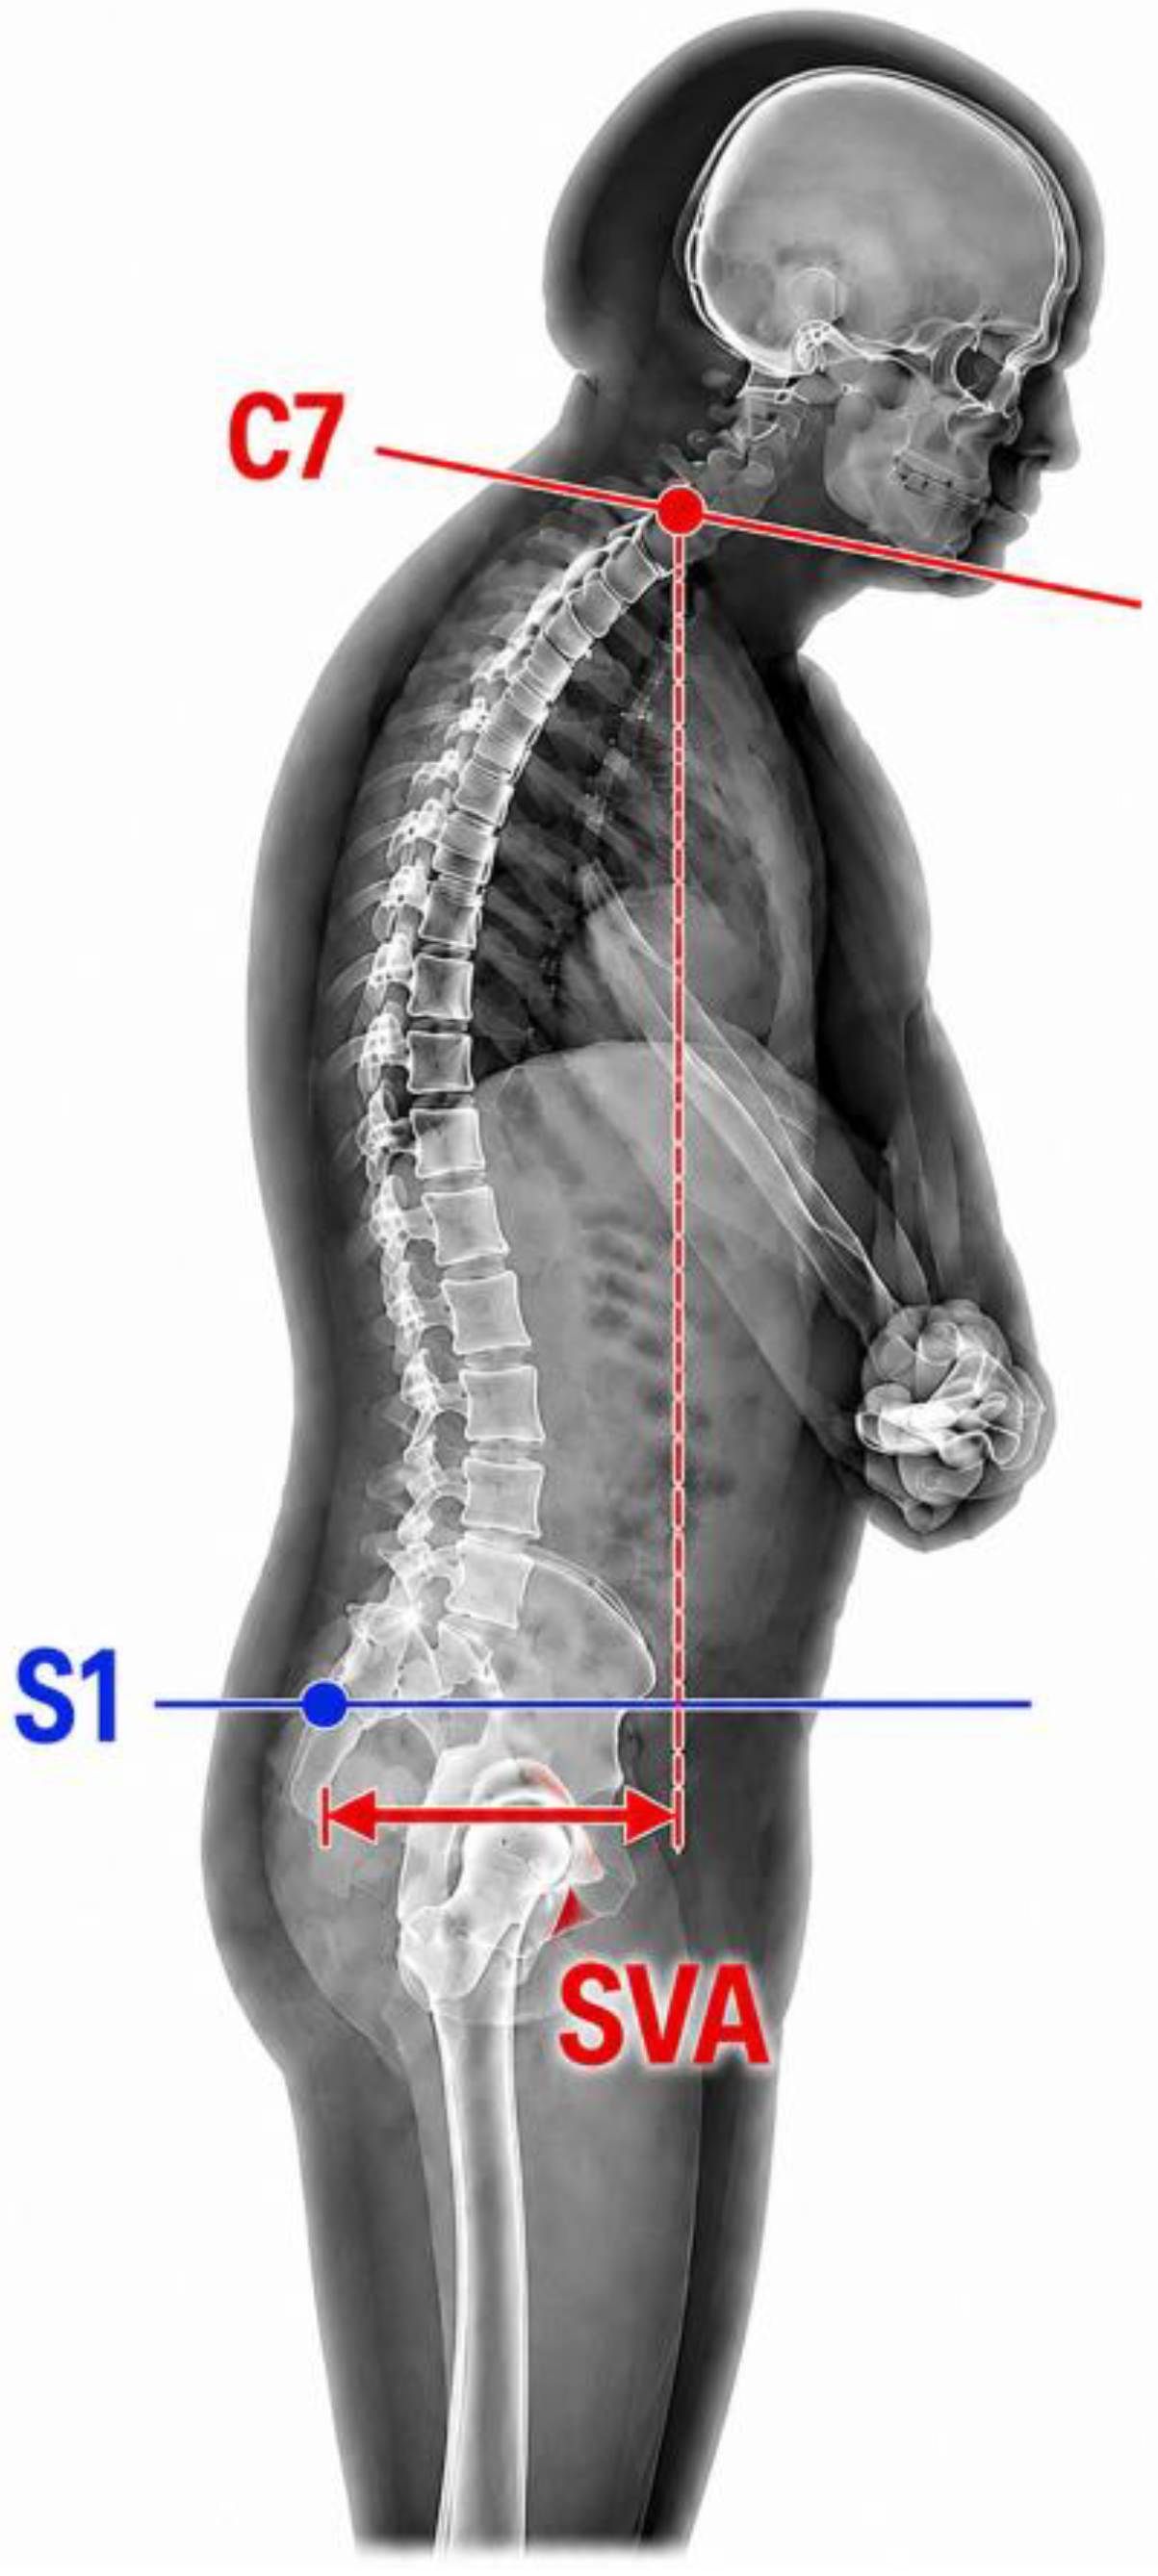

Table 1.
Anthropometry data the studied sample (n=41).
| Variable | ax-SpA group (n=21) |
Control group (n=20) | Method | Effect (95% CI) | Unadjusted p-value | Adjusted p-value |
|---|---|---|---|---|---|---|
| Sex (male/female) | 11/21 | 5/20 | chi-square | OR=3. 20 [0.742–15.7] | 0.072 | 0.796 |
| Anthropometry | ||||||
| Age (years) | 48.8±14.1 | 41.4±14.9 | Welch | g=0. 499 [-0. 114–1.110] | 0.111 | 0.802 |
| Body mass (kg) | 72 (63–89) | 73.5 (62.5–80.5) | Mann-Whitney | r=0. 093 [-0. 259–0.423] | 0.620 | 0.802 |
| Height (cm) | 167.1±6.44 | 166.1±8.90 | Welch | g=0. 126 [-0. 476–0,726] | 0.686 | 0.826 |
| BMI (kg/m2) | 26 (23–33) | 25 (23–30) | Mann-Whitney | r=0. 140 [-0. 213–0.462] | 0.446 | 0.802 |
| Foot size (number) | 39 (37–41) | 37 (35.7–38) | Mann-Whitney | r=0. 364 [0.024–0.629] | 0.045 | 0.796 |
The values shown are mean ± SD or number (%). Significant difference is indicated by bold text. axSpA, axial spondyloarthritis; BMI, body mass index.
Table 2.
Postural assessment, baropodometer parameters, and handgrip strength in the studied sample (n=41).
Table 2.
Postural assessment, baropodometer parameters, and handgrip strength in the studied sample (n=41).
| Variable | ax-SpA group (n=21) |
Control group (n=20) | Method | Effect (95% CI) | Unadjusted p-value | Adjusted p-value |
|---|---|---|---|---|---|---|
| Postural assessment | ||||||
| SVA (mm) | 31 (16–53) | 26.5 (9.50–36.7) | Mann-Whitney | r=0. 240 [-0. 112–0.539] | 0.191 | 0.802 |
| Baropodometer parameters | ||||||
| Forefoot load (%) | 39.9 ± 11 | 37.4 ± 6.72 | Welch | g=0. 271 [-0. 334–0.873] | 0.376 | 0.802 |
| Rearfoot load (%) | 60±11 | 62.5 ± 6.71 | Welch | g=-0, 270 [-0. 872–0.335] | 0.379 | 0.802 |
| LRLL (%) | 48.5±8.09 | 47.9 ± 3.77 | Welch | g=0. 096 [-0. 505–0.697] | 0.751 | 0.826 |
| LLLL (%) | 51.5 ± 8.09 | 52.1±3.77 | Welch | g=-0. 096 [-0. 697–0.505] | 0.751 | 0.826 |
| MADAP (mm) | 5.65±2.66 | 5.52±1.97 | Welch | g=0. 056 [-0. 545–0.656] | 0.855 | 0.865 |
| MVAP (mm/s) | 1.06 (0.87–1.18) | 0.99 (0.76–1.33) | Mann-Whitney | r=0. 110 [-0. 243–0.436] | 0.557 | 0.802 |
| SDDAP (mm) | 1.17 (0.84–1.62) | 1.23 (1.04–1.63) | Mann-Whitney | r=-0. 131 [-0. 454–0.222] | 0.481 | 0.802 |
| MADML (mm) | 2.74 (2.15–5.22) | 2.44 (1.85–5.42) | Mann-Whitney | r=0. 179 [-0. 175–0.492] | 0.334 | 0.802 |
| MVML (mm/s) | 1.05±0.38 | 1±0.32 | Welch | g=0. 161 [-0. 442–0.761] | 0.600 | 0.802 |
| SDDML (mm) | 0.62 (0.46–1.36) | 0.53 (0.35–1.06) | Mann-Whitney | r=0. 224 [-0. 129–0.527] | 0.225 | 0.802 |
| MDCOP (mm) | 45.6 (41.2–57.8) | 43.7 (34.3–57.6) | Mann-Whitney | r=0. 129 [-0. 225–0.452] | 0.489 | 0.802 |
| MADCOP (mm) | 14.2 (7.52–19.8) | 11.5 (6.78–19.9) | Mann-Whitney | r=0. 033 [-0. 314–0.372] | 0.865 | 0.865 |
| CMD/A | 3.76 (2.59–6.10) | 4.10 (1.86–5.21) | Mann-Whitney | r=0. 157 [-0. 197–0.475] | 0.396 | 0.802 |
| HGS (kgf) | 25.9 ± 7.03 | 28.8±6.84 | Welch | g=0. 397 [-0. 212–1] | 0.203 | 0.802 |
The values shown are mean ± SD or number (%). ax-SpA, axial spondyloarthritis; SVA, sagittal vertical axis; LRLL, load on the right lower limb; LLLL, load on the left lower limb; MADAP, maximal amplitude of anteroposterior displacement ; MVAP, mean velocity of anteroposterior displacement; SDDAP, standard deviation of anteroposterior displacement; MADML, maximal amplitude of mediolateral displacement; MVML, mean velocity of mediolateral displacement; SDDML, standard deviation of mediolateral displacement; MDCOP, maximal displacement of center of pressure; MADCOP, maximal total area of displacement of center of pressure; CMD/A, coefficient of maximal displacement divided by the area; HGS, handgrip strength.
Table 3.
Spearman's correlation coefficients between postural assessment, clinical data, baropodometer parameters, and handgrip strength measurements in individuals with axial spondyloarthritis (n=21).
Table 3.
Spearman's correlation coefficients between postural assessment, clinical data, baropodometer parameters, and handgrip strength measurements in individuals with axial spondyloarthritis (n=21).
| SVA (mm) | ||||
|---|---|---|---|---|
| Variable | Method | ρ (95% CI) | Unadjusted p-value | Adjusted p-value |
| Age (years) | Spearman | 0.511 [0.019–0.813] | 0.017 | 0.356 |
| Body mass (kg) | Spearman | 0.062 [-0. 453–0.592] | 0.790 | 0.993 |
| Height (m2) | Spearman | -0.030 [-0. 422–0.375] | 0.897 | 0.993 |
| BMI (kg/m2) | Spearman | 0.042 [-0. 486–0.519] | 0.855 | 0.993 |
| Foot size (number) | Spearman | 0.221 [-0. 222–0.587] | 0.335 | 0.993 |
| Time since diagnosis (years) | Spearman | 0.209 [-0. 322–0.642] | 0.376 | 0.993 |
| Forefoot load (%) | Spearman | -0. 150 [-0. 594–0.353] | 0.517 | 0.993 |
| Rearfoot load (%) | Spearman | 0.150 [-0. 352–0.609] | 0.517 | 0.993 |
| LRLL (%) | Spearman | 0.094 [-0. 389–0.560] | 0.684 | 0.993 |
| LLLL (%) | Spearman | -0. 094 [-0. 549–0.411] | 0.684 | 0.993 |
| MADAP (mm) | Spearman | -0. 087 [-0. 535–0.337] | 0.707 | 0.993 |
| MVAP (mm/s) | Spearman | 0.002 [-0. 466–0.428] | 0.993 | 0.993 |
| SDDAP (mm) | Spearman | -0. 011 [-0. 453–0.424] | 0.962 | 0.993 |
| MADML (mm) | Spearman | 0.452 [-0. 006–0.799] | 0.039 | 0.395 |
| MVML (mm/s) | Spearman | -0., 064 [-0. 460–0.316] | 0.782 | 0.993 |
| SDDML (mm) | Spearman | 0.349 [-0. 152–0.753] | 0.120 | 0.805 |
| MDCOP (mm) | Spearman | -0. 076 [-0. 498–0.371] | 0.742 | 0.993 |
| MADCOP (mm) | Spearman | 0.017 [-0. 474–0.493] | 0.942 | 0.993 |
| CMD/A | Spearman | -0. 133 [-0. 574–0.377] | 0.565 | 0.993 |
| HGS (kgf) | Spearman | 0.097 [-0. 310–0.494] | 0.676 | 0.993 |
Significant correlations are indicated by bold text. SVA, sagittal vertical axis; BMI, body mass index; LRLL, load on the right lower limb; LLLL, load on the left lower limb; MADAP, maximal amplitude of anteroposterior displacement ; MVAP, mean velocity of anteroposterior displacement; SDDAP, standard deviation of anteroposterior displacement; MADML, maximal amplitude of mediolateral displacement; MVML, mean velocity of mediolateral displacement; SDDML, standard deviation of mediolateral displacement; MDCOP, maximal displacement of center of pressure; MADCOP, maximal total area of displacement of center of pressure; CMD/A, coefficient of maximal displacement divided by the area; HGS, handgrip strength.
Disclaimer/Publisher’s Note: The statements, opinions and data contained in all publications are solely those of the individual author(s) and contributor(s) and not of MDPI and/or the editor(s). MDPI and/or the editor(s) disclaim responsibility for any injury to people or property resulting from any ideas, methods, instructions or products referred to in the content. |
© 2026 by the authors. Licensee MDPI, Basel, Switzerland. This article is an open access article distributed under the terms and conditions of the Creative Commons Attribution (CC BY) license (http://creativecommons.org/licenses/by/4.0/).
Copyright: This open access article is published under a Creative Commons CC BY 4.0 license, which permit the free download, distribution, and reuse, provided that the author and preprint are cited in any reuse.