

Submitted:
29 September 2026
Posted:
30 September 2026
You are already at the latest version
Abstract
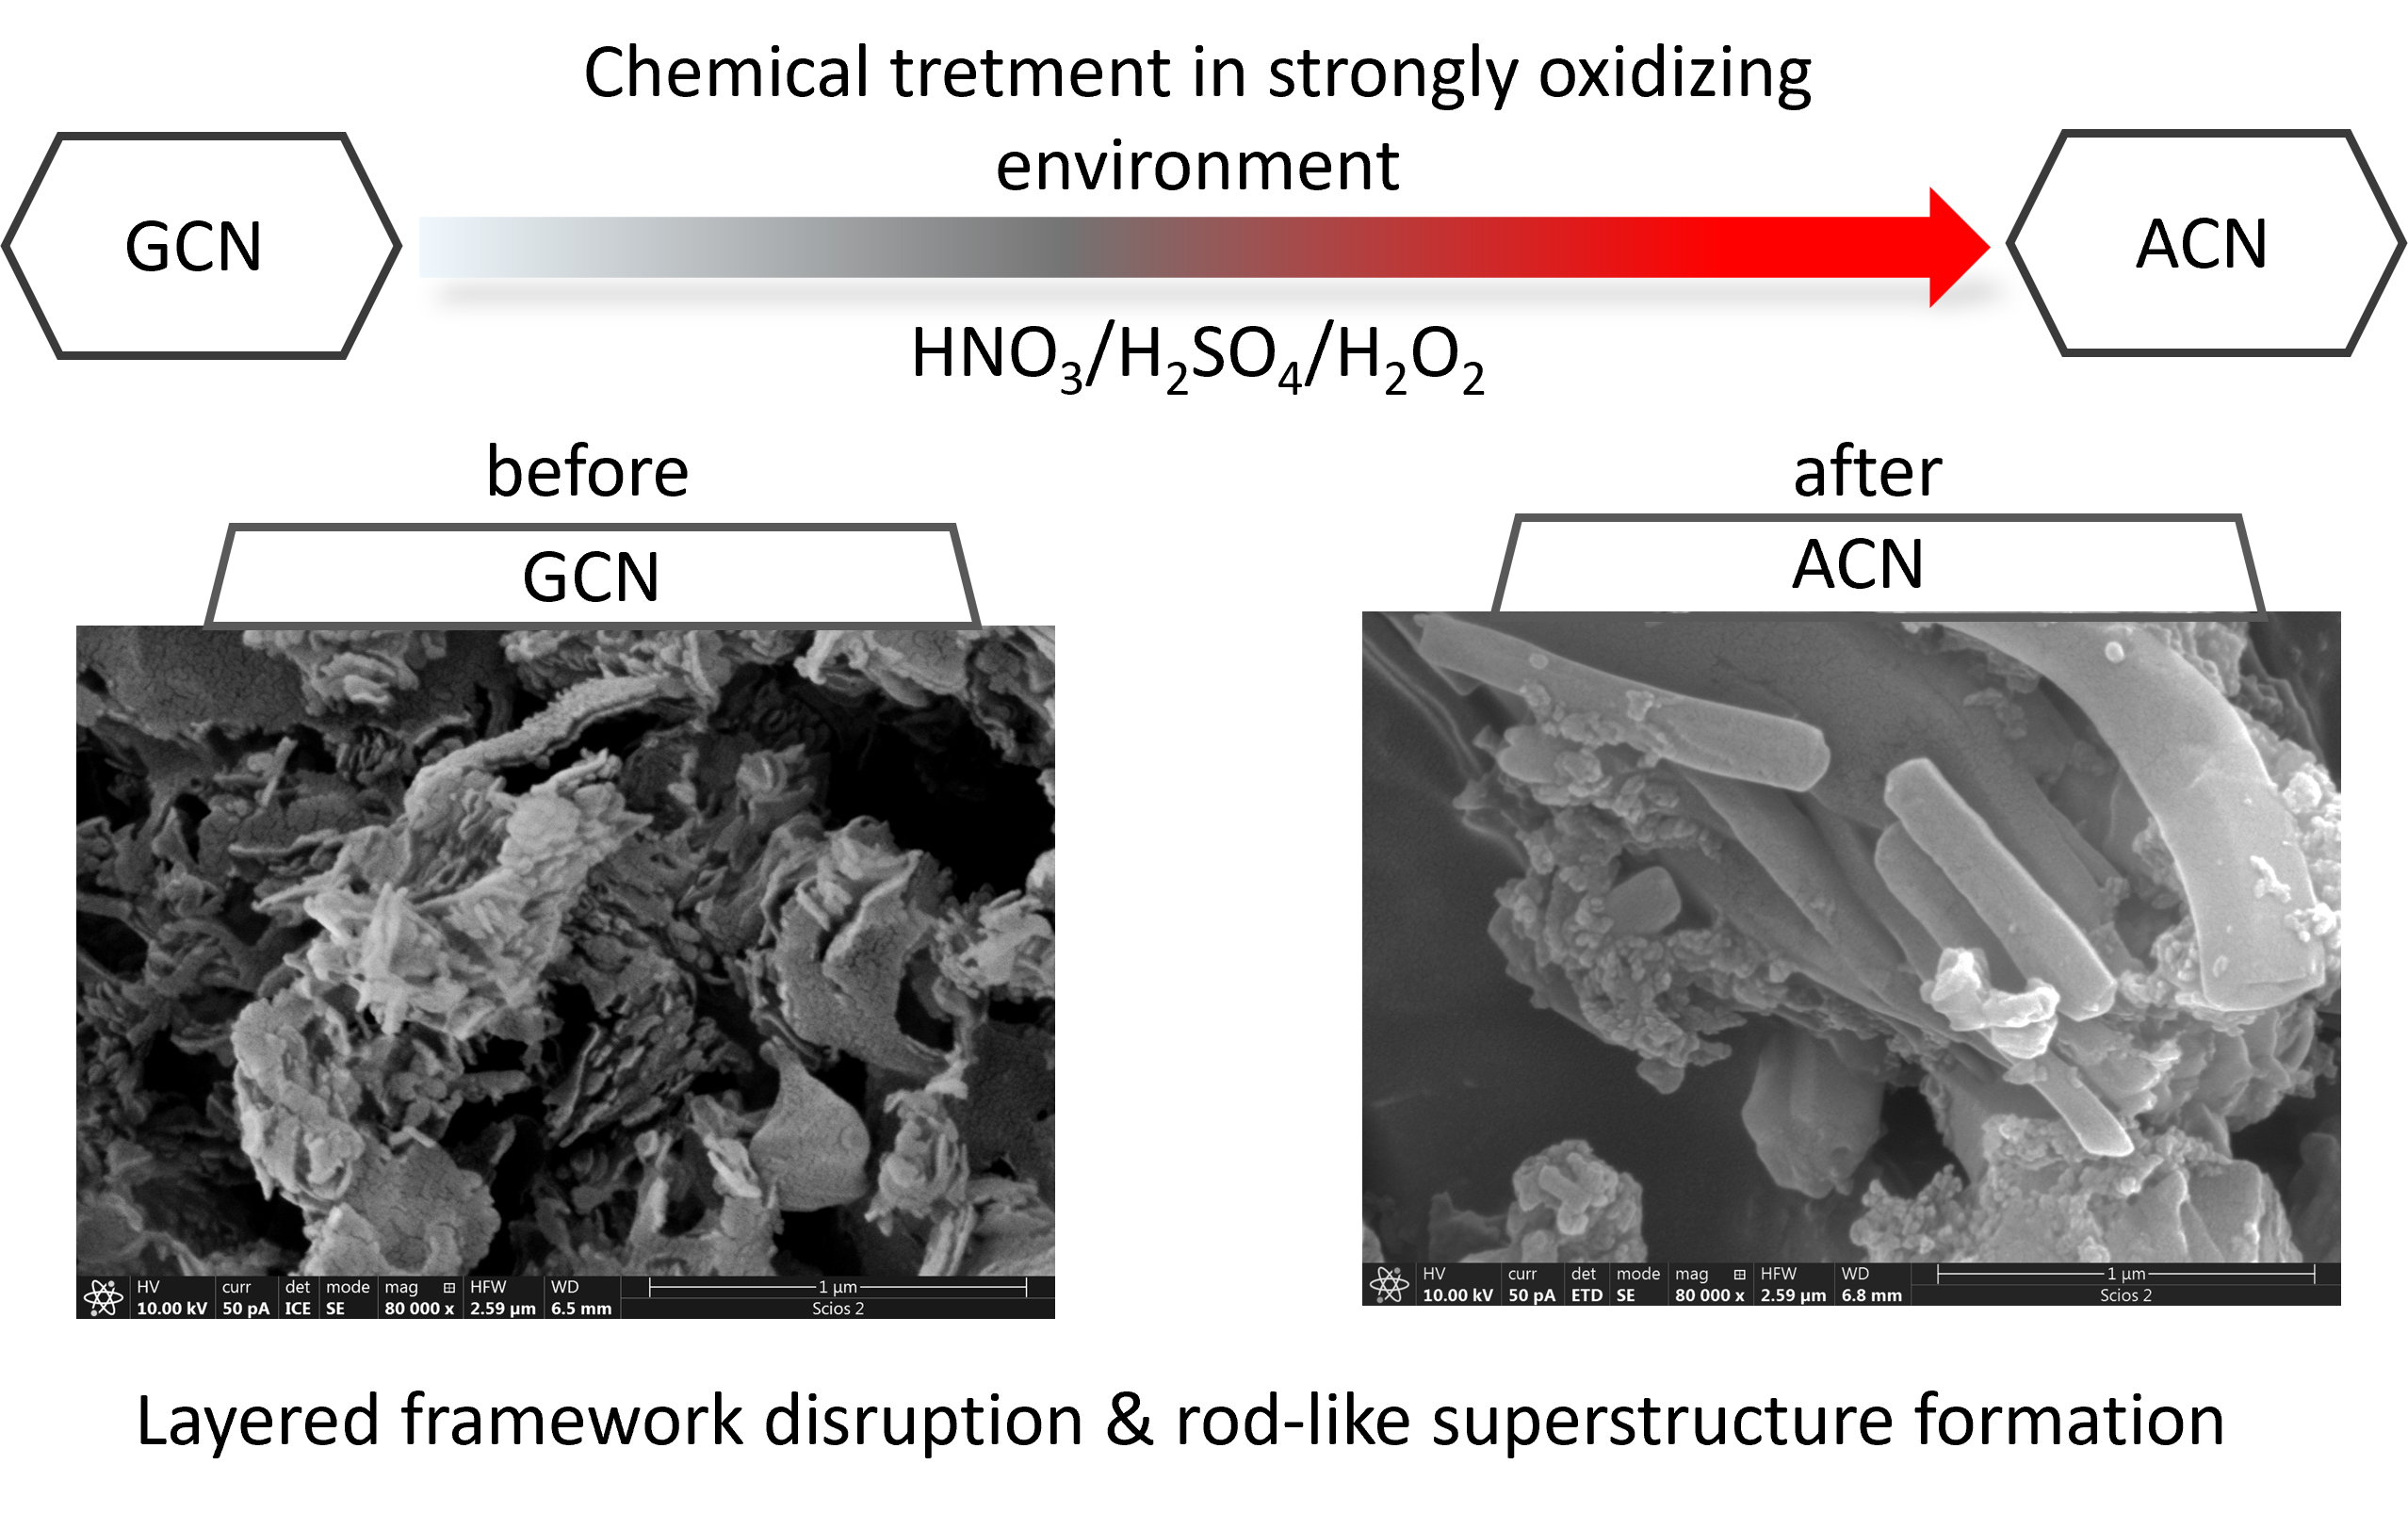
Urea-derived graphitic carbon nitride (g-C₃N₄) underwent to chemical treatment in a strongly oxidizing H₂SO₄/HNO₃/H₂O₂ environment, followed by dialysis against water. XRD and SEM measurements revealed significant disruption of the layered polymeric framework, including loss of hydrogen-bond-mediated order, partial depolymerization into melem-based units, and the formation of rod-like melem-hydrate superstructures. FTIR spectra indicated that chemical treatment resulted in the loss of the heptazine structure and emergence of melem/triazine vibrations. Consistent disruption of the C–N framework was also observed in XPS spectra, which showed a reduced contribution of nitrogen species associated with inter-triazine bridging. Mott–Schottky analysis yielded potential values suggesting the presence of additional electronic states in the chemically treated sample. This aligns with EPR spin-trapping results, which showed approximately a 2.5-fold decrease in superoxide radical anion generation upon visible light irradiation compared to the parent compound.
Keywords:
graphitic carbon nitride
; melem hydrate
; interfacial charge transfer
; oxidative treatment
; X-ray photoelectron spectroscopy
; electron paramagnetic resonance
1. Introduction
Graphitic carbon nitride (g-C3N4) is a conjugated polymeric semiconductor renowned for its excellent photocatalytic properties and has been extensively studied over the past few decades [1]. Depending on the desired final characteristics of the synthesized material, various organic carbon and nitrogen rich precursors, such as melamine, cyanamide, dicyanamide or urea, have been used to obtain g-C3N4 through simple thermal treatment. The resulting bulk materials are characterized by band gap energy of about 2.7 eV [2], with the conduction band potential at approximately -1.3 eV vs. NHE [2], making them photoactive under visible light irradiation with sufficiently high overpotential for the production of superoxide anion radicals.
However, regardless of the precursor or synthetic procedure used to obtain it, g-C3N4 suffers from several intrinsic drawbacks that hinder its photocatalytic performance: rapid recombination of photogenerated charges, a low density of available reactive sites and poor charge carrier mobility [3]. The origin of these drawbacks lies in the structural arrangement of s-triazine-based melon chains interconnected by covalent and hydrogen bonds, forming layers. These layers are connected by weak van der Waals forces, resulting in a stacked configuration with a substantial interlayer potential barrier – estimated at 33.2 eV – which obstructs electrical transport across layers [4]. Additionally, intralayer electrical transport in hydrogen bond rich areas is impeded by a potential barrier of 7.9 eV, causing localization of photogenerated charges and making them unavailable for useful redox reactions [4]. In this context, exfoliating the bulk material into thinner layered structures would enhance electrical transport, simultaneously prolonging the lifetime of photogenerated charges and increasing the availability of active sites, ultimately improving photocatalytic performance [5].
Previously, we have shown that thermally exfoliated g-C3N4 exhibits improved photocatalytic activity under simulated solar irradiation [6]. In this study, we examine the effect of the chemical exfoliation process in a strong oxidizing environment on the structural and optical characteristics of urea-derived g-C3N4. Several studies [2,5,7] have shown that treatment of carbon nitride with concentrated nitric acid leads to its depolymerization. Specifically, protons intercalate between carbon nitride layers, attaching selectively to bridging or stranding nitrogen atoms [2]. Such a swollen polymer matrix, when exposed to strong oxidative agents such as HNO3, is prone to depolymerization, that is decomposition into smaller building blocks [2]. The same effect is reported for carbon nitride (C3N4 or C3N5) treated with concentrated sulfuric acid or a combination of concentrated HNO3 and H2SO4: after initial intercalation/protonation and chemical exfoliation, cleavage of bridging C-NH-C bonds between melon units begins, eventually leading to decomposition of carbon nitride into melem units [8,9,10,11,12].
However, no significant changes in structure or morphology, nor fragmentation into smaller pieces, are reported when acid-etched carbon nitride was subsequently treated with a strong oxidizing agent such as hydrogen peroxide. As Choudhury et al. [13] reported, the layered nanostructure of g-C3N4 was preserved. Nevertheless, this combined chemical treatment resulted in surface functionalization with oxygen -containing groups (carbonyl, carboxyl, hydroxyl, etc.). Similar findings are reported by Kumar et al. [3] and Bahaguna et al. [14].
In this work, we investigate whether a strongly oxidizing H₂SO₄/HNO₃/H₂O₂ treatment leads to deeper reconstruction of urea-derived g-C₃N₄ or functions as a surface functionalization route. The connection between surface chemical evolution, interfacial electrical behavior, and structural fragmentation is given special consideration.
2. Materials and Methods
2.1. Materials
The following commercial chemicals were used: urea (VWR, reagent grade), nitric acid (HNO3, J.T. Baker, 69–70%), sulfuric acid (H2SO4, J.T. Baker, 95–97%), and hydrogen peroxide (H2O2, Chemsolute, 30%). All reagents were used as received without further purification. Deionized water obtained from a Milli-Q purification system was used in all experiments.
2.2. Sample Preparation
Graphitic carbon nitride (GCN) was prepared by the thermal polymerization of urea, following the procedure described in our previous work [6]. Briefly, urea (5 g) was heated in a semi - covered crucible from room temperature to 550 °C at a rate of 5 °C min⁻¹, after which this temperature was maintained for an additional 2 h. After cooling to ambient temperature, the resulting yellow powder was ground into a fine powder and stored for later use.
Acid-treated carbon nitride (ACN) samples were synthesized using a slightly modified procedure reported in the literature [14]. The protocol was as follows: 0.3 g of as -prepared GCN was dispersed in 9 mL of a mixed acid solution composed of concentrated H2SO4 and HNO3 in a 1:1 volume ratio. The resulting suspension was stirred for 30 minutes. Subsequently, 4 mL of H2O2 was added dropwise under continuous stirring, and the mixture was stirred for a further 15 minutes. After this, 50 mL of deionized water was added to dilute and quench the reaction. The reaction mixture was then left to stand for approximately 1 hour to allow sedimentation. The supernatant was carefully removed by pipetting, and 150 mL of deionized water was added. The suspension was transferred into dialysis tubing and dialyzed until the pH of the surrounding water reached neutrality. After dialysis, the product was collected by centrifugation and dried for further use.
2.3. Characterization
X-ray diffraction (XRD) patterns were recorded using a Philips PW 1050 powder diffractometer with Ni-filtered Cu Kα radiation (λ = 0.1542 nm). Data were collected in step-scan mode with a step size of 0.05° and a counting time of 5 s per step. Fourier-transform infrared (FTIR) spectra were obtained with a Nicolet 380 spectrometer (Thermo Scientific) equipped with a Smart Orbit™ ATR module. Measurements were performed in the 4000–525 cm⁻¹ region. A Scios 2 DualBeam (SEM) (Thermo Fisher Scientific), equipped with an energy-dispersive X-ray spectrometer, was used to analyze the morphology and qualitative chemical composition of the samples. Measurements were conducted at an accelerating voltage of 10 kV. UV–Vis diffuse reflectance (DR) spectra were collected in the 200–900 nm wavelength range using a Shimadzu UV-2600 spectrophotometer equipped with an integrating sphere (ISR-2600 Plus for UV-2600). XPS measurements were performed using a SPECS system equipped with an XP50M X-ray source for the Focus 500 and a PHOIBOS 100/150 analyzer. An Al Kα radiation source (hν = 1486.74 eV) operated at 12.5 kV and 32 mA was employed. Survey spectra in the 0-1000 eV binding-energy range were acquired at a base pressure of 8 × 10⁻⁹ mbar, using a pass energy of 40 eV in FAT mode. All binding energies were calibrated with respect to the C 1s peak at 284.5 eV. Data were recorded using the SpecsLab acquisition software and subsequently processed with the CasaXPS software package. EPR spectra were recorded at room temperature using a Bruker Elexsys E540 spectrometer operating at X-band (9.85 GHz). The measurement parameters were: modulation amplitude, 2 G; modulation frequency, 100 kHz; microwave power, 10 mW; and scan range 200 G. Data acquisition and processing were carried out using the Xepr software package (Bruker BioSpin, Rheinstetten, Germany). Samples (1 mg) were used either as dry powder or, for spin-trapping experiments, suspended in 26 µL of water containing 4 µL of the spin-trap DEPMPO (final concentration 3.3 mM). The samples were loaded into 5 cm long Teflon tubes (wall thickness 0.025 mm, inner diameter 0.6 mm; Zeus Industries), which were then inserted into quartz capillaries for EPR measurements. For visible light-induced radical generation, samples were irradiated using an 800 W artificial sunlight LED light source.
Electrochemical experiments were conducted using an Autolab electrochemical workstation (Autolab PGSTAT302N, Metrohm-Autolab BV, Netherlands) and a three-electrode cell comprising an Ag/AgCl in 3 M KCl as the reference electrode, a platinum rod as the counter electrode, and a glassy carbon electrode (GCE) coated with the investigated sample as the working electrode. The GCE was coated as follows: 10 mg of the sample was homogeneously dispersed in 0.95 ml of ethanol and 0.05 ml of 5 wt.% Nafion using an ultrasonic bath. Then, 10 μl of the suspension was placed on the surface of the GCE (0.071 cm2). A uniformly distributed sample was obtained on the GCE surface after solvent evaporation. Characterization of the samples was performed in 1 mM ferro/ferricyanide solution in 0.2 M KCl by cyclic voltammetry (CV) and electrochemical impedance spectroscopy (EIS). Mott–Schottky measurements were carried out at a frequency of 1000 Hz, with the voltage applied in successive steps of 50 mV from 1 V to -1 V. The measurements were performed in 0.1 M Na2SO4 (pH = 5.6).
The textural properties of the samples were determined from N2 adsorption–desorption isotherms obtained at −196 °C using a Sorptomatic 1990 Thermo Finnigan (Thermo Fisher Scientific, Waltham, MA, USA) apparatus. Before measurement, samples were degassed at the preparation site for 4 h at room temperature under vacuum, and then for a further 24 h at 80 °C under a vacuum pressure better than 0.3 Pa. The N2 isotherms were analyzed using ADP 5.13 Thermo Electron Software. The specific surface areas (SSABET) of the samples and BET constant (CBET) were calculated using the Brunauer–Emmett–Teller (BET) equation [15] from the part of the adsorption isotherms selected according to the Rouquerol criteria [16]. The mesopore volume (Vmeso) was obtained from the desorption branch of the isotherm for the p/p0 region corresponding to the mesopores.
3. Results and Discussion
The XRD pattern of graphitic carbon nitride (GCN) is typically characterized by two main peaks: one cantered around 13°, originating from intralayer ordering of tri-s-triazine building units, and another around 27.5°, attributed to the distance between layers interconnected by weak van der Waals forces [6].
The XRD pattern of ACN (Figure 1a) provided the first indication that severe disruption of ordered layered structure of GCN occurred under the applied chemical treatment, which was unexpected, as no similar disruption has been reported in previous studies using the same or similar chemical treatment of carbon nitride [3,14].
The peak at 12.9°, associated with the intralayer structure linked by hydrogen bonding, is absent in the XRD pattern of the ACN sample. Complete disappearance of this peak indicates that long-range order is severely destroyed due to cleavage of hydrogen bonds between heptazine-based melon chains. As hydrogen bonds in the GCN structure are formed between residual amino and imino groups, this strongly suggests that the applied experimental procedure led to the removal of these bridging groups. [4] Additionally, a shift of the interlayer-related peak from 27.4° to 27.9°, indicates delamination of the material, resulting in fewer, more densely stacked layers, as the d spacing was reduced from the initial 0.325 nm (GCN) to 0.319 nm (ACN).
Besides these noteworthy changes in the two carbon nitride-related peaks, the XRD pattern of the ACN sample is characterized by the presence of less intense but very sharp peaks at 10.9, 12.3, 18.5, 23.1, 24.8 and 31.1°. These peaks can be ascribed to melem-hydrate (MH) [17]. According to the literature, pristine MH has so far been synthesized by only a few research groups using a bottom-up approach [17,18], but it is also reported as a melem or melem hydrate, product obtained when C3N4 or C3N5 is treated with concentrated H2SO4 or a mixture of concentrated H2SO4 and HNO3 [8,9,11]. Melem hydrate units are usually composed of six melem molecules interconnected by hydrogen bonds, forming hexagonal porous structures, as initially described by Makowski [19]. Due to such an arrangement, a channel filled with water molecules is formed in the center of the structure.
Depending on the synthetic procedure and calcination temperature, melem-hydrate can form rod- or parallelogram-shaped microcrystals [17,18]. Both the resulting morphology and the amount of water present in the structure significantly affect the position of the peak around 12°. The XRD pattern of rod-shaped melem-hydrate is characterized by a peak at 12.3°, while for the parallelogram-shaped MH this peak is shifted to lower 2θ angles.
Structural changes induced by chemical treatment are confirmed by comparing the FTIR spectra of the parent and treated samples (Figure 1b). As previously stated [6], the heptazine (tri-s-triazine) based structure of GCN is characterized by bands in the 1200 –1650 cm-1 region, originating from stretching vibrations of C–N bonds in heterocycles. Their number and intensity correlate with the crystallinity of the sample, i.e. the degree of condensation. Additionally, the presence of side amino groups is confirmed by a weak, broad band cantered at about 3250 cm-1, and a sharp band at 890 cm-1. The GCN heptazine-based structure is further evidenced by the out-of-plane bending vibration of the ring structure with a band at 815 cm-1. After aggressive chemical treatment, the FTIR spectrum of ACN reveals a profound structural transformation, indicating severe acid-catalyzed depolymerization of the polymeric framework. The fine, well-resolved structure of the C–N and C=N bands between 1200 and 1650 cm⁻¹ is lost and replaced by a broad, dominant band. While the absence of sharp, well-defined melem monomer doublets (typically at 1622 and 1471 cm⁻¹ [9]) might initially suggest incomplete depolymerization, this spectral broadening is highly characteristic of the proposed melem-hydrate formation. In such a structure, the extensive network of strong intermolecular hydrogen bonds between the newly formed melem molecules and intercalated water significantly alters the vibrational environment, merging these stretching modes into a single broad band around 1600 cm⁻¹. This is strongly supported by the appearance of a massive, extremely broad absorption band dominating the high-frequency region (cantered at ~3100 cm⁻¹), which clearly corresponds to a large amount of heavily hydrogen-bonded –OH and –NH groups [11].
The most definitive evidence for the destruction of the polymeric network is the pronounced shift in the characteristic heptazine ring breathing vibration. The sharp band at 815 cm⁻¹ in GCN almost completely disappears, shifting to approximately 790 cm⁻¹ in ACN (inset in Figure. 1b). This shift is a well-established marker for the transition from a condensed polymeric melon/heptazine network to isolated melem (2,5,8-triamino-heptazine) molecules [9]. Together with the disappearance of the intralayer XRD peak at 13°, the FTIR results confirm that the ACN sample is not simply a delaminated GCN, but a completely new, highly ordered hydrogen-bonded molecular phase.
Structural changes are evident in the evolution of the layered and elongated morphology of the ACN sample, as observed in SEM images (Figure 2). While GCN consists of stacked layers, ACN comprises smaller, layered fragments with a very broad size distribution, as well as rod-shaped features up to a few micrometers in size, which, according to the available literature, can only be attributed to melem-hydrate based structures. The high inhomogeneity of shapes and sizes can be attributed to the relatively short duration of the chemical treatment, but SEM alone does not provide definite conclusions about the formation mechanism of melem hydrate-based structures. Exclusively MH hexagonal or parallelogram rods are characteristic of the bottom-up approach, whereas in the top-down synthesis approach used in this study, multiple steps in the formation of melem-hydrate based structures clearly overlapped. It can be speculated that the acidic mixture initially caused delamination of the GCN stacked layers, forming thinner structures, which were later fragmented into heptazine -based smaller units. These fragments were likely subsequently self-assembled into melem-hydrate based rods, possibly not only during the synthetic procedure, but, considering the size of stacked rod superstructures, even during the initial phases of post-treatment dialysis step. However, even the rods are not uniformly structured, which, based on conclusions drawn by Kanai et al. [18], may be a consequence of the amount of water added to the reaction system. According to their findings, the formation of a mixture of plate-shaped microcrystals together with hexagonal rods occurred with increasing water content, up to 40%. As the ratio of water in our synthesis and subsequent treatment was much higher, together with overlapping steps of fragmentation, melem formation, and rod assembly, the resulting inhomogeneity of shapes and sizes and the simultaneous presence of trigonal, pentagonal, and hexagonal melem-hydrate based rods is not unexpected.
To estimate changes in surface chemistry XPS spectra of both samples were recorded (Figure 3 and survey spectra in Figure S1). The deconvoluted C 1s spectrum of the GCN sample exhibited four components (Figure 3a): adventitious carbon at 284.9 eV, C–N bonding at 286.1 eV, N–C=N bond (carbon from the aromatic ring) at 287.9 eV and, the most prominent peak at 289.1 eV, which is usually assigned to C=O moieties, i.e. the carboxyl group [7,8,10,20,21], formed as a result of partial oxidation of the surface. However, as the estimated percentage of oxygen in the GCN sample is only about 3% (Figure S1a), assigning this peak exclusively to a C=O moiety is not chemically realistic, especially considering the absence of oxygen -related bands in the FTIR spectrum of this sample. According to some authors [8,11,22,23], the peak at 289.1 eV originates from sp2- hybridized carbon in the aromatic ring connected to an amino group (C–NH2). Such results are expected for urea-derived GCN, as this material is characterized by the presence of pores, imperfections in the layers, which are actually terminations of the heptazine-based structure, rich in amino groups [6]. Comparison of the peak areas revealed that the contribution of the C–NH2 peak relative to the N–C=N peak is about three times higher, further emphasizing the porosity of urea-based GCN. This ratio of the corresponding peaks in the ACN C 1s spectrum (Figure 3d) is as low as 0.85, indicating significant changes in surface chemistry after the applied chemical treatment.
At the same time, the N 1s spectrum (Figure 3b) of GCN can be deconvoluted into four bands, with the contribution of the N-O bond at 405.4 eV is almost negligible. The main contribution arises from the peak with a maximum at 399.8 eV, assigned to N3C three-coordinated structural nitrogen, i.e. the N-[C]3 bond, corresponding to nitrogen atoms connecting s-triazine rings [24] that form the heptazine backbone of graphitic carbon nitride. The N-[C]3 peak area, compared to the C-NH2 peak [5] area (maximum at 401.6 eV) and the C-N=C peak [5] area (N2C two-coordinated structural nitrogen, with maximum at 398.2 eV), relates as 0.73:0.21:0.057. Such a low proportion of N2C suggests incomplete condensation or aromatic ring opening in GCN, consistent with previous findings.
However, after the applied chemical treatment (Figure 3e) this ratio changes substantially to 0.43:0.34:0.25, i.e. the relative contribution of the N-[C]3 peak decreases, confirming the observed fragmentation.
High-resolution O 1s spectra of GCN and ACN are presented in Figure 3c and Figure 3f, respectively. As stated above, the oxygen contribution in both samples is very low, resulting in a very weak line, with high noise-to-signal ratio. In the deconvoluted O 1s spectra of both samples, three major lines are identified: at 530.9 –531.3 eV, at 533.4 –532.4 eV, and at 534.8 –534.3 eV. Assignment of these lines is challenging, as literature data are inconsistent. The component at about 533 eV can be assigned to a C=O bond [13,25]. However, as the presence of carboxyl oxygen is not supported by the C 1s or FTIR spectra, it can be assumed that this contribution more likely originates from surface-adsorbed water [26,27]. Nonetheless, any further discussion would be speculative, and it can only be concluded that the applied chemical treatment did not result in significant incorporation of oxygen into the carbon-nitride matrix.
Investigation of the textural properties of the samples showed that structural changes, induced by the applied chemical treatment, led to a slight decrease in the specific surface area (SSABET), as indicated in Table 1. Additionally, the BET constant value decreased, indicating a reduction in adsorbent-adsorbate interaction.
The N2 isotherms of the GCN sample (Figure 4a) correspond to Type II isotherms, according to IUPAC nomenclature [28], characteristic of non-porous or macroporous materials, with no characteristic infliction point related to the completion of monolayer coverage. Instead, the shape of the isotherm resembles an overlap of monolayer and multilayer coverage steps. The isotherms are characterized by a very narrow hysteresis, which can be identified as a Type H3 loop, common for non-rigid aggregates of plate-like particles [28].
The structural changes induced by the applied chemical treatment are reflected in the N2 isotherms of the ACN sample (Figure 4b). Although it exhibits a similar Type II shape, the hysteresis loop is more pronounced indicating changes in pore shape and/or connectivity of the mesopores.
Comparing the content of mesoporous regions and their distribution calculated by the BJH method [29] (Figure S2, SM), it is evident that the applied chemical treatment altered the pore-size distribution, although the cumulative mesopore volume remained almost unchanged. The GCN sample exhibits a broad mesopore size distribution with a median pore diameter of approximately 25 nm. In contrast the ACN sample displays a more uniform mesopore size distribution, with a lower median pore diameter of about 14.1 nm and a dominant pore size of around 11 nm.
An additional distinctive feature of the isotherm is the pronounced steep increase, almost parallel to the y-axis, near p/p0 → 1, indicating unrestricted multilayer adsorption on the available external surfaces of the particles. As the condensed liquid layer on the particle surfaces grows infinitely thick, it leads to capillary condensation within the macroscopic interparticle voids. This behavior strongly suggests that the ACN sample consists of small, highly dispersed entities with available external surface area, creating a highly open, loose network capable of significant macroscopic void filling.
To assess the optical characteristics of the synthesized samples UV-vis DR spectra were obtained (SM). In Figure 5a the transformed Kubelka-Munk spectra are presented. A broad maximum at approximately 370 nm in the GCN spectrum is typical for π-π* transitions in conjugated systems [5,29]. However, the same maximum in the ACN spectrum is barely visible, which is in accordance with the disruption of the π-conjugated network, as previously stated. Moreover, the absorption edge is blue-shifted, consistent with the whitish color of the sample. The obtained Tauc’s plots (Figure 5b) confirmed a shift in the band-gap energy towards higher values. The Tauc’s plot of the ACN sample clearly indicates the presence of two different materials, as two distinct linear regions are observed: one with an extrapolated band-gap energy of 2.92 eV and another with a band-gap energy of about 3.05 eV. Both values are higher than the estimated band-gap energy of the parent GCN material, which is about 2.77 eV.
To estimate the effect of chemical treatment on electronic energy levels, Mott-Schottky plots (Figure 6a) were recorded, and characteristic potentials were determined (Table 2). Both samples exhibit curves with positive slopes, indicating n-type semiconductor behavior. For n-type semiconductors the conduction band edge potential is generally considered to be 0.1 [30] to 0.3 V [31] more negative than the flat-band potential. Assuming a difference of 0.1 V, the conduction band edge of GCN would be at -0.92 V (vs. SHE). As the band gap of this material is estimated to be 2.77 eV, the valence band edge potential would be at +1.85 V (vs. SHE).
In contrast, the Mott-Schottky plot of the ACN sample exhibited two slopes, extrapolated to values of -0.37 V and -1.60 V (vs. SHE), indicating a significantly different electronic structure compared to the parent GCN. However, before assigning these values to the flat-band potentials of the ACN mesh components, two considerations must be addressed:
- The fragmentation of the layered GCN structure inevitably leads to the creation of defect states on the material’s surface. These defects can be donor-type, such as nitrogen vacancies and cyano groups, or acceptor-type, such as carbon vacancies or oxygen-containing groups (-OH, -C=O, or -COOH). Such surface states can create high-density energy states within the bandgap, effectively capturing charges and pinning the Fermi level (charge neutral level) to a fixed potential value [32,33]. As a consequence, potentials obtained by Mott-Schottky measurements show lower (more positive) values at the intercept [34], which is a possible explanation for the estimated potential of -0.37 V.
- Chemically induced fragmentation reduces the degree of polymerization, thereby shortening the conjugated system relative to the parent GCN. Consequently, electrons are less delocalized, that is fragmentation leads to improved electron confinement and negative shift of the flat-band potential could be expected [35,36,37] compared to the flat-band potential of the parent GCN. However, the estimated potential of -1.60 V would imply a significant negative shift of almost 0.8 V, placing the conduction band minimum at approximately -1.7 V, which would be characteristic of material capable of rapid and intense formation of superoxide radical anions. It would also mean that, once illuminated, it would probably be susceptible to photocorrosion.
Alternatively, this estimated potential may originate from localized, surface -associated defect states (electron trap states) characterized by strong reductive character.
To clarify the origin of the estimated potentials, further characterization was performed using electrochemical impedance spectroscopy and the resulting Nyquist plots are shown in Figure. 6b. The modified Randles circuit (inset in Figure. 6b) was used to fit the spectra. Parameters obtained from fitting the Nyquist plots are presented in Table S1 (SM). The results showed that the acid -treated sample has a higher charge-transfer resistance (58 kΩ for GCN vs. 83 kΩ for ACN), indicating that the estimated potentials likely originate from defect states in the fragmented phase, which act as electron-trap states.
EPR measurements were conducted to further verify the origin of the recorded potentials. In Figure 7a, the EPR spectrum of the GCN sample shows a weak Lorentzian line, originating from unpaired electrons in the hybridized aromatic system [38]. After illumination (red line, Figure 7a), the shape, intensity and g-value remain unchanged, indicating that photogenerated charges do not contribute to the signal, probably due to the fast charge-carrier recombination characteristic of GCN. However, the EPR spectrum of ACN (Figure 7b, black line) shows a more intense peak with characteristic splitting, which may indicate different electronic and structural environments, consistent with the coexistence of different phases in the material. Upon illumination (Figure 7b, red line), the peak area increases by a factor of 1.68, suggesting possible trapping of photogenerated charges in shallow trap states. Given the proven fragmentation of the polymeric structure, shallow trapping of charges could occur at under-coordinated N atoms and/or at heptazine edge terminal structural defects [38].
To evaluate the effect of the applied chemical treatment on the formation of short-lived radicals under visible light irradiation, the EPR spin-trapping technique using DEPMPO as a spin-trap was employed. Both GCN and ACN samples (Figure 7c,d) showed no detectable signal in the dark, indicating that neither material generates radicals without visible light. Upon illumination, a strong EPR signal characteristic of the DEPMPO-superoxide adduct (DEPMPO/OOH) was observed in both samples. Notably, the DEPMPO/OOH adduct signal for GCN was approximately 2.5 times higher than that for ACN (Figure 7e), suggesting that a fraction of the photogenerated charges may remain trapped in defect states.
According to the results obtained in this study, it is suggested that the widely cited chemical resistance of graphitic carbon nitride should be regarded with caution, as it strongly depends on the structure of the starting GCN. As shown previously [6], urea-derived GCN possesses a highly porous structure originating from gas release during synthesis. Such a porous system is particularly susceptible to reactions with strong acids such as H2SO4 and HNO3. Due to the strong oxidizing ability and direct cleavage function of SO42- and NO3- [5,8,10,11], not only delamination but also fragmentation of the GCN layers occurred, as not only hydrogen bonding network gets destructed, but also the C-N bond system between two adjacent building blocks of the heptazine unit, releasing melem. The subsequent addition of H2O2 likely further accelerated this process, possibly involving in-situ formation of Caro’s acid with H2SO4, promoting further release of melem. Upon addition of water and during dialysis, melem units spontaneously self-assembled into rod-like melem-hydrate superstructures.
Although almost the same treatment of graphitic carbon nitride is reported by other authors [3,13], no formation of MH or a fragmented phase is reported. This discrepancy can be attributed to the use of different carbon-nitride precursors (melamine/dicyandiamide), resulting in a more compact layered structure than urea-derived GCN, and consequently greater resistance to the oxidative action of acids. In the case of urea-derived GCN, the results show that the applied oxidative treatment reconstructs the carbon nitride surface into a defect-dominated interface that controls charge transfer processes rather than only changing surface functions. Additionally, fragmentation of the system starts quickly, providing melem units for self-assembly of MH rods. However, adjustment of reaction conditions is required to obtain more a homogeneous and uniform MH system.
4. Conclusion
To conclude, urea-derived GCN was chemically treated with a mixture of H2SO4/HNO3/H2O2, then dialyzed against water. XRD results confirmed the formation of melem hydrate (MH), while SEM revealed its self-assembly into tri-, penta-, and hexagonal rod-like morphologies. The observed structural inhomogeneity is likely due to the overlap between GCN fragmentation and the concurrent self-assembly process, as well as the excess water present during synthesis and post-treatment.
FTIR analysis further supported the destruction of the heptazine-based backbone, as the characteristic out-of-plane vibration at approximately 815 cm⁻¹ disappeared and a new band at around 790 cm⁻¹ emerged, consistent with melem-type units. However, optical characterization and Tauc’s analysis suggested that the acid-treated sample consists of a mixed phase system, as two band-gap values (2.92 and 3.05 eV) were estimated. In agreement with this, XPS indicated that fragmentation of GCN into melem-based fragments and their reorganization into MH is not fully completed within the applied treatment time. Therefore, the ACN sample should be considered a mesh of MH and defect-rich melem-based fragments, where the fragmented phase significantly affects the overall electronic properties. Specifically, Mott–Schottky and EPR measurements indicated an increased density of electron-trapping defects, which can limit charge-carrier availability and weaken the reduction capability of the material.
Overall, these results show that acid treatment of urea-based g-C₃N₄ provides a viable low-temperature route to melem hydrate–enriched structures. Unlike conventional high-temperature melamine condensation, this approach generates hydrated melem domains directly from polymeric carbon nitride. The resulting hydrogen-bonded architecture is structurally distinct and may be relevant for photocatalytic applications.
Supplementary Materials
The following supporting information can be downloaded at the website of this paper posted on Preprints.org, Figure S1: XPS survey spectra of GCN and ACN; Figure S2: Mesopore size distribution estimated by the Barrett, Joyner and Halenda (BJH) method for a) GCN and b) ACN. TSE stands for tensile strength effect; Table S1: The parameters obtained by fitting Nyquist plot with the equivalent circuit.
Author Contributions
Conceptualization, Investigation, Writing – Review & Editing M.V.C.; Conceptualization, Supervision, Investigation, Writing – Original Draft N.D.A.; Investigation, Writing – Review & Editing Z.D.M; Investigation, Writing – Review & Editing J.B.K; Investigation, Writing – Review & Editing M.D.M.; Investigation T.D.V.: Supervison, Writing – Review & Editing M.I.Č.
Funding
This work was financially supported by the Ministry of Science, Technological Development and Innovation of the Republic of Serbia (Grant No. 451-03-33/2026-03/200017, 451-03-33/2026-03/200026 and 451-03-34/2026-03/200146) and by the Science Fund of the Republic of Serbia, GRANT No.7673808, Sustainable implementation of textile waste in treatment of polluted water-SORBTEX.
Data Availability Statement
The original contributions presented in the study are included in the article/supplementary material, further inquiries can be directed to the corresponding author/s.
Acknowledgments
This work was financially supported by the Ministry of Science, Technological Development and Innovation of the Republic of Serbia (Grant No. 451-03-33/2026-03/200017, 451-03-33/2026-03/200026 and 451-03-34/2026-03/200146) and by the Science Fund of the Republic of Serbia, GRANT No.7673808, Sustainable implementation of textile waste in treatment of polluted water-SORBTEX.
Conflicts of Interest
The authors declare no conflicts of interest. The funders had no role in the design of the study; in the collection, analyses, or interpretation of data; in the writing of the manuscript; or in the decision to publish the results.
References
- Ong, W.J.; Tan, L.L.; Ng, Y.H.; Yong, S.T.; Chai, S.P. Graphitic Carbon Nitride (g-C3N4)-Based Photocatalysts for Artificial Photosynthesis and Environmental Remediation: Are We a Step Closer To Achieving Sustainability? Chem. Rev. 2016, 116(12), 7159–7329. [Google Scholar] [CrossRef]
- Zhang, J.; Zhang, M.; Lin, L.; Wang, X. Sol Processing of Conjugated Carbon Nitride Powders for Thin-Film Fabrication. Angew. Chem. Int. Ed. 2015, 54(21), 6297–6301. [Google Scholar] [CrossRef]
- Kumar, A.; Singh, S.; Khanuja, M. A comparative photocatalytic study of pure and acid-etched template free graphitic C3N4 on different dyes: An investigation on the influence of surface modifications. Mat. Chem. Phys. 2020, 243, 122402. [Google Scholar] [CrossRef]
- Kang, Y.; Yang, Y.; Yin, L.C.; Kang, X.; Wang, L.; Liu, G.; Cheng, H.M. Selective Breaking of Hydrogen Bonds of Layered Carbon Nitride for Visible Light Photocatalysis. Adv. Mater. 2016, 28, 6471–6477. [Google Scholar] [CrossRef]
- Lei, L.; Wang, W.; Shang, Y.; Li, J.; Yadav, A.K.; Wang, H.; Li, Q.; Fan, H. Tailoring chemical structures and intermolecular interactions of melem intermediates for highly efficient photocatalytic hydrogen evolution of g-C3N4. Appl. Surf. Sci. 2021, 563, 150384. [Google Scholar] [CrossRef]
- Carević, M.V.; Vulić, T.D.; Šaponjić, Z.V.; Mojović, Z.D.; Abazović, N.D.; Čomor, M.I. Carbon nitride impregnated non-woven jute post-industrial waste in photocatalytic degradation of textile dyes. Cellulose 2024, 31, 5297–5312. [Google Scholar] [CrossRef]
- Ma, L.; Fan, H.; Fu, K.; Lei, S.; Hu, Q.; Huang, H.; He, G. Protonation of graphitic carbon nitride (g-C3N4) for electrostatically self-assembling Carbon@g-C3N4 core-shell nanostructure toward high hydrogen evolution. ACS Sustain. Chem. Eng. 2017, 5(8), 7093–7103. [Google Scholar] [CrossRef]
- Mo, J.; Wang, N.; Zhang, S.; Chen, X.; Fu, J.; Chen, P.; Liang, Z.; Su, Q.; Li, X. Metal-free g-C3N4/melem nanorods hybrids for photocatalytic degradation of methyl orange. Res. Chem. Intermed. 2022, 48, 3835–3849. [Google Scholar] [CrossRef]
- Nikookar, M.; Rezaeifard, A.; Jafarpour, M.; Grzhegorzhevskii, K.V.; Ostroushko, A.A. A top-down design for easy gram scale synthesis of melem nano rectangular prisms with improved surface area. RSC Adv. 2021, 11, 38862. [Google Scholar] [CrossRef]
- De Medeiros, T.V.; Porto, A.O.; Bicalho, H.A.; González, J.C.; Naccache, R.; Teixeira, A.P.C. The effects of chemical and thermal exfoliation on the physico-chemical and optical properties of carbon nitrides. J. Mater. Chem. C. 2021, 9, 7622. [Google Scholar] [CrossRef]
- Nguyen, V.H.; Lee, T.; Nguyen, T.D. Construction of S-scheme melem hydrate/g-C3N5 heterojunction for enhanced photocatalytic performance under LED light irradiation. Appl. Surf. Sci. 2025, 711, 164121. [Google Scholar] [CrossRef]
- Raevskaya, A.E.; Panasiuk, Y.V.; Korzhak, G.V.; Stroyuk, O.L.; Kuchmiy, S.Y.; Dzhagan, V.M.; Zahn, D.R.T. Photocatalytic H2 production from aqueous solutions of hydrazine and its derivatives in the presence of nitric-acid-activated graphitic carbon nitride. Catal. Today. 2017, 284, 229–235. [Google Scholar] [CrossRef]
- Choudhary, P.; Bahuguna, A.; Kumar, A.; Dhankhar, S.S.; Nagaraja, C.M.; Krishnan, V. Oxidized graphitic carbon nitride as a sustainable metal-free catalyst for hydrogen transfer reactions under mild conditions. Green Chem. 2020, 22, 5084–5095. [Google Scholar] [CrossRef]
- Bahuguna, A.; Sasson, Y. Functionalized Graphitic Carbon Nitride Decorated with Palladium: an Efficient Heterogeneous Catalyst for Hydrogenation Reactions Using KHCO2 as a Mild and Noncorrosive Source of Hydrogen. ACS Omega 2020, 5, 12302−12312. [Google Scholar] [CrossRef]
- Rouquerol, J.; Rouquerol, F.; Llewellyn, P.; Maurin, G.; Sing, K.S.W. Adsorption by Powders and Porous Solids: Principles, Methodology and Applications, 2nd ed.; Elsevier Ltd.: Amsterdam, The Netherlands, 1999; ISBN 978-0-12-598920-6. [Google Scholar]
- Rouquerol, J.; Llewellyn, P.; Rouquerol, F. Is the BET Equation Applicable to Microporous Adsorbents? In Characterization of Porous Solids VII, Proceedings of the 7th International Symposium on the Characterization of Porous Solids (COPS-VII) Studies in Surface Science and Catalysis; Aix-en-Provence, France, Elsevier: Amsterdam, The Netherlands, 26–28 May 2005; Volume 160, pp. 49–56. [Google Scholar]
- Dai, T.; Kiuchi, H.; Minamide, H.; Miyake, Y.; Inoki, H.; Sonoda, Y.; Tsutsumi, J.; Kanai, K. Growth and characterization of melem hydrate crystals with a hydrogen-bonded heptazine framework. Phys. Chem. Chem. Phys. 2024, 24, 13922–13934. [Google Scholar] [CrossRef]
- Kanai, K.; Yamazaki, T.; Kiuchi, H.; Isobe, M.; Sonoda, Y. Role of Hydrogen Bonding in Crystal Structure and Luminescence Properties of Melem Hydrates. ACS Omega 2025, 10, 16977−16992. [Google Scholar] [CrossRef]
- Makowski, S.J.; Kçstler, P.; Schnick, W. Formation of a Hydrogen-Bonded Heptazine Framework by Self-Assembly of Melem into a Hexagonal Channel Structure. Chem. Eur. J. 2012, 18, 3248–3257. [Google Scholar] [CrossRef]
- Pandi, K.; Kangeyan, P.; Lakhera, S.K.; Kiong, T.S.; Bernaurdshaw, N. Melem Hydrate-Derived g-C3N4 Micro-Rods Coordinated with Cu2+: Why is Cu a superior cocatalyst compared to Ni and Co? Mater. Today Sustain. 2024, 27, 100942. [Google Scholar] [CrossRef]
- Han, S.; Qiu, T.; Xiong, C.; Li, X.; Guo, L. Tunable Nitrogen Defects on Graphitic Carbon Nitride toward the Visible-Light-Induced Reversible-Deactivation Radical Polymerization. Macromolecules 2022, 55, 5314−5325. [Google Scholar] [CrossRef]
- Wang, H.; Li, M.; Lu, Q.; Cen, Y.; Zhang, Y.; Yao, S. A Mesoporous Rod-like g-C3N5 Synthesized by Salt-Guided Strategy: As a Superior Photocatalyst for Degradation of Organic Pollutant. ACS Sustain. Chem. Eng. 2019, 7, 625−631. [Google Scholar] [CrossRef]
- Wang, C.; Wang, W.; Fan, H.; Zhao, N.; Ma, J.; Zhang, M.; Yadav, A.K. A Codoped Polymeric Photocatalyst with Prolonged Carrier Lifetime and Extended Spectral Response up to 600 nm for Enhanced Hydrogen Evolution. ACS Appl. Mater. Interfaces. 2020, 12(5), 5234–5243. [Google Scholar] [CrossRef]
- Niu, P.; Liu, G.; Cheng, H.M. Nitrogen Vacancy-Promoted Photocatalytic Activity of Graphitic Carbon Nitride. J. Phys. Chem. C. 2012, 116, 11013−11018. [Google Scholar] [CrossRef]
- She, X.; Wu, J.; Zhong, J.; Xu, H.; Yang, Y.; Vajtai, R.; Lou, J.; Liu, Y.; Du, D.; Li, H.; Ajayan, P.M. Oxygenated Monolayer Carbon Nitride for Excellent Photocatalytic Hydrogen Evolution and External Quantum Efficiency. Nano Energy 2016, 27, 138–146. [Google Scholar] [CrossRef]
- Praus, P.; Smýkalová, A.; Foniok, K.; Matějka, V.; Kormunda, M.; Smetana, B.; Cvejn, D. The presence and effect of oxygen in graphitic carbon nitride synthetized in air and nitrogen atmosphere. Appl. Surf. Sci. 2020, 529, 147086. [Google Scholar] [CrossRef]
- Zhai, B.; Li, H.; Gao, G.; Wang, Y.; Niu, P.; Wang, S.; Li, L. A Crystalline Carbon Nitride Based Near-Infrared Active Photocatalyst. Adv. Func. Mater. 2022, 32(47), 2207375. [Google Scholar] [CrossRef]
- Thommes, M.; Kaneko, K.; Neimark, A.V.; Olivier, J.P.; Rodriguez-Reinoso, F.; Rouquerol, J.; Sing, K.S.W. Physisorption of gases, with special reference to the evaluation of surface area and pore size distribution (IUPAC Technical Report). Pure Appl. Chem. 2015, 87(9-10), 1051–1069. [Google Scholar] [CrossRef]
- Lecloux, A.; Pirard, J.P. The importance of standard isotherms in the analysis of adsorption isotherms for determining the porous texture of solids. J. Coll. Interface Sci. 1979, 70(2), 265–281. [Google Scholar] [CrossRef]
- Abdelhafeez, I.A.; Yao, Q.; Wang, C.; Su, Y.; Zhou, X.; Zhang, Y. Green synthesis of ultrathin edge-activated foamlike carbon nitride nanosheets for enhanced photocatalytic performance under visible light irradiation. Sus. Energy Fuel. 2019, 3, 1764–1775. [Google Scholar] [CrossRef]
- Yu, L.; Zhang, X.; Li, G.; Cao, Y.; Shao, Y.; Li, D. Highly efficient Bi2O2CO3/BiOCl photocatalyst based on heterojunction with enhanced dye-sensitization under visible light. Appl. Cat. B – Environ. 2016, 187, 301–309. [Google Scholar]
- Kennedy, J.H.; Frese, Jr. K.W. Flatband Potentials and Donor Densities of Polycrystalline α-Fe2O3 Determined from Mott-Schottky Plots. J. Electrochem. Soc. 1978, 125, 723. [Google Scholar] [CrossRef]
- Albery, W.J.; O’Shea, G.J.; Smith, A.L. Interpretation and use of Mott-Schottky plots at the semiconductor/electrolyte interface. J. Chem. Soc. Faraday Trans. 1996, 92(20), 4083–4085. [Google Scholar] [CrossRef]
- Hankin, A.; Bedoya-Lora, F.E.; Alexander, J.C.; Regoutz, A.; Kelsall, G.H. Flat band potential determination: avoiding the pitfalls. J. Mater. Chem. A. 2019, 7, 26162. [Google Scholar] [CrossRef]
- Ge, H.; Tian, H.; Zhou, Y.; Wu, S.; Liu, D.; Fu, X.; Song, X.M.; Shi, X.; Wang, X.; Li, N. Influence of Surface States on the Evaluation of the Flat Band Potential of TiO2. ACS Appl. Mater. Interfaces. 2014, 6, 2401−2406. [Google Scholar] [CrossRef]
- Godin, R.; Wang, Y.; Zwijnenburg, M.A.; Tang, J.; Durrant, J. R. Time-Resolved Spectroscopic Investigation of Charge Trapping in Carbon Nitrides Photocatalysts for Hydrogen Generation. J. Am. Chem. Soc. 2017, 139, 5216−5224. [Google Scholar] [CrossRef]
- He, D.; Liu, C.; Zhang, Y.; Yang, H.; Qu, J. Efficient water disinfection accelerated by polymerization-degree-controlled graphitic carbon nitride under visible light. J. Environ. Chem. Eng. 2024, 12, 112247. [Google Scholar] [CrossRef]
- Zažímal, F.; Plašienka, D.; Atri, S.; Vrána, L.; Monfort, O.; Stavárek, P.; Klusoň, P.; Šob, M.; Homola, T. Unveiling the effect of the polymerization degree of graphitic carbon nitride on the surface functionalization by low-temperature plasma: Insights from XPS and DFT study. Appl. Surf. Sci. 2025, 699, 163073. [Google Scholar] [CrossRef]
- Xia, P.; Cheng, B.; Jiang, J.; Tang, H. Localized π-conjugated structure and EPR investigation of g-C3N4 photocatalyst. Appl. Surf. Sci. 2019, 487, 335–342. [Google Scholar] [CrossRef]
Figure 1.
a) XRD pattern and b) FTIR spectra of GCN (black line) and ACN (red line). Inset: enlarged FTIR spectra in the 1000-700 cm-1 region, showing a shift of the characteristic heptazine band towards lower wavenumber values.
Figure 1.
a) XRD pattern and b) FTIR spectra of GCN (black line) and ACN (red line). Inset: enlarged FTIR spectra in the 1000-700 cm-1 region, showing a shift of the characteristic heptazine band towards lower wavenumber values.
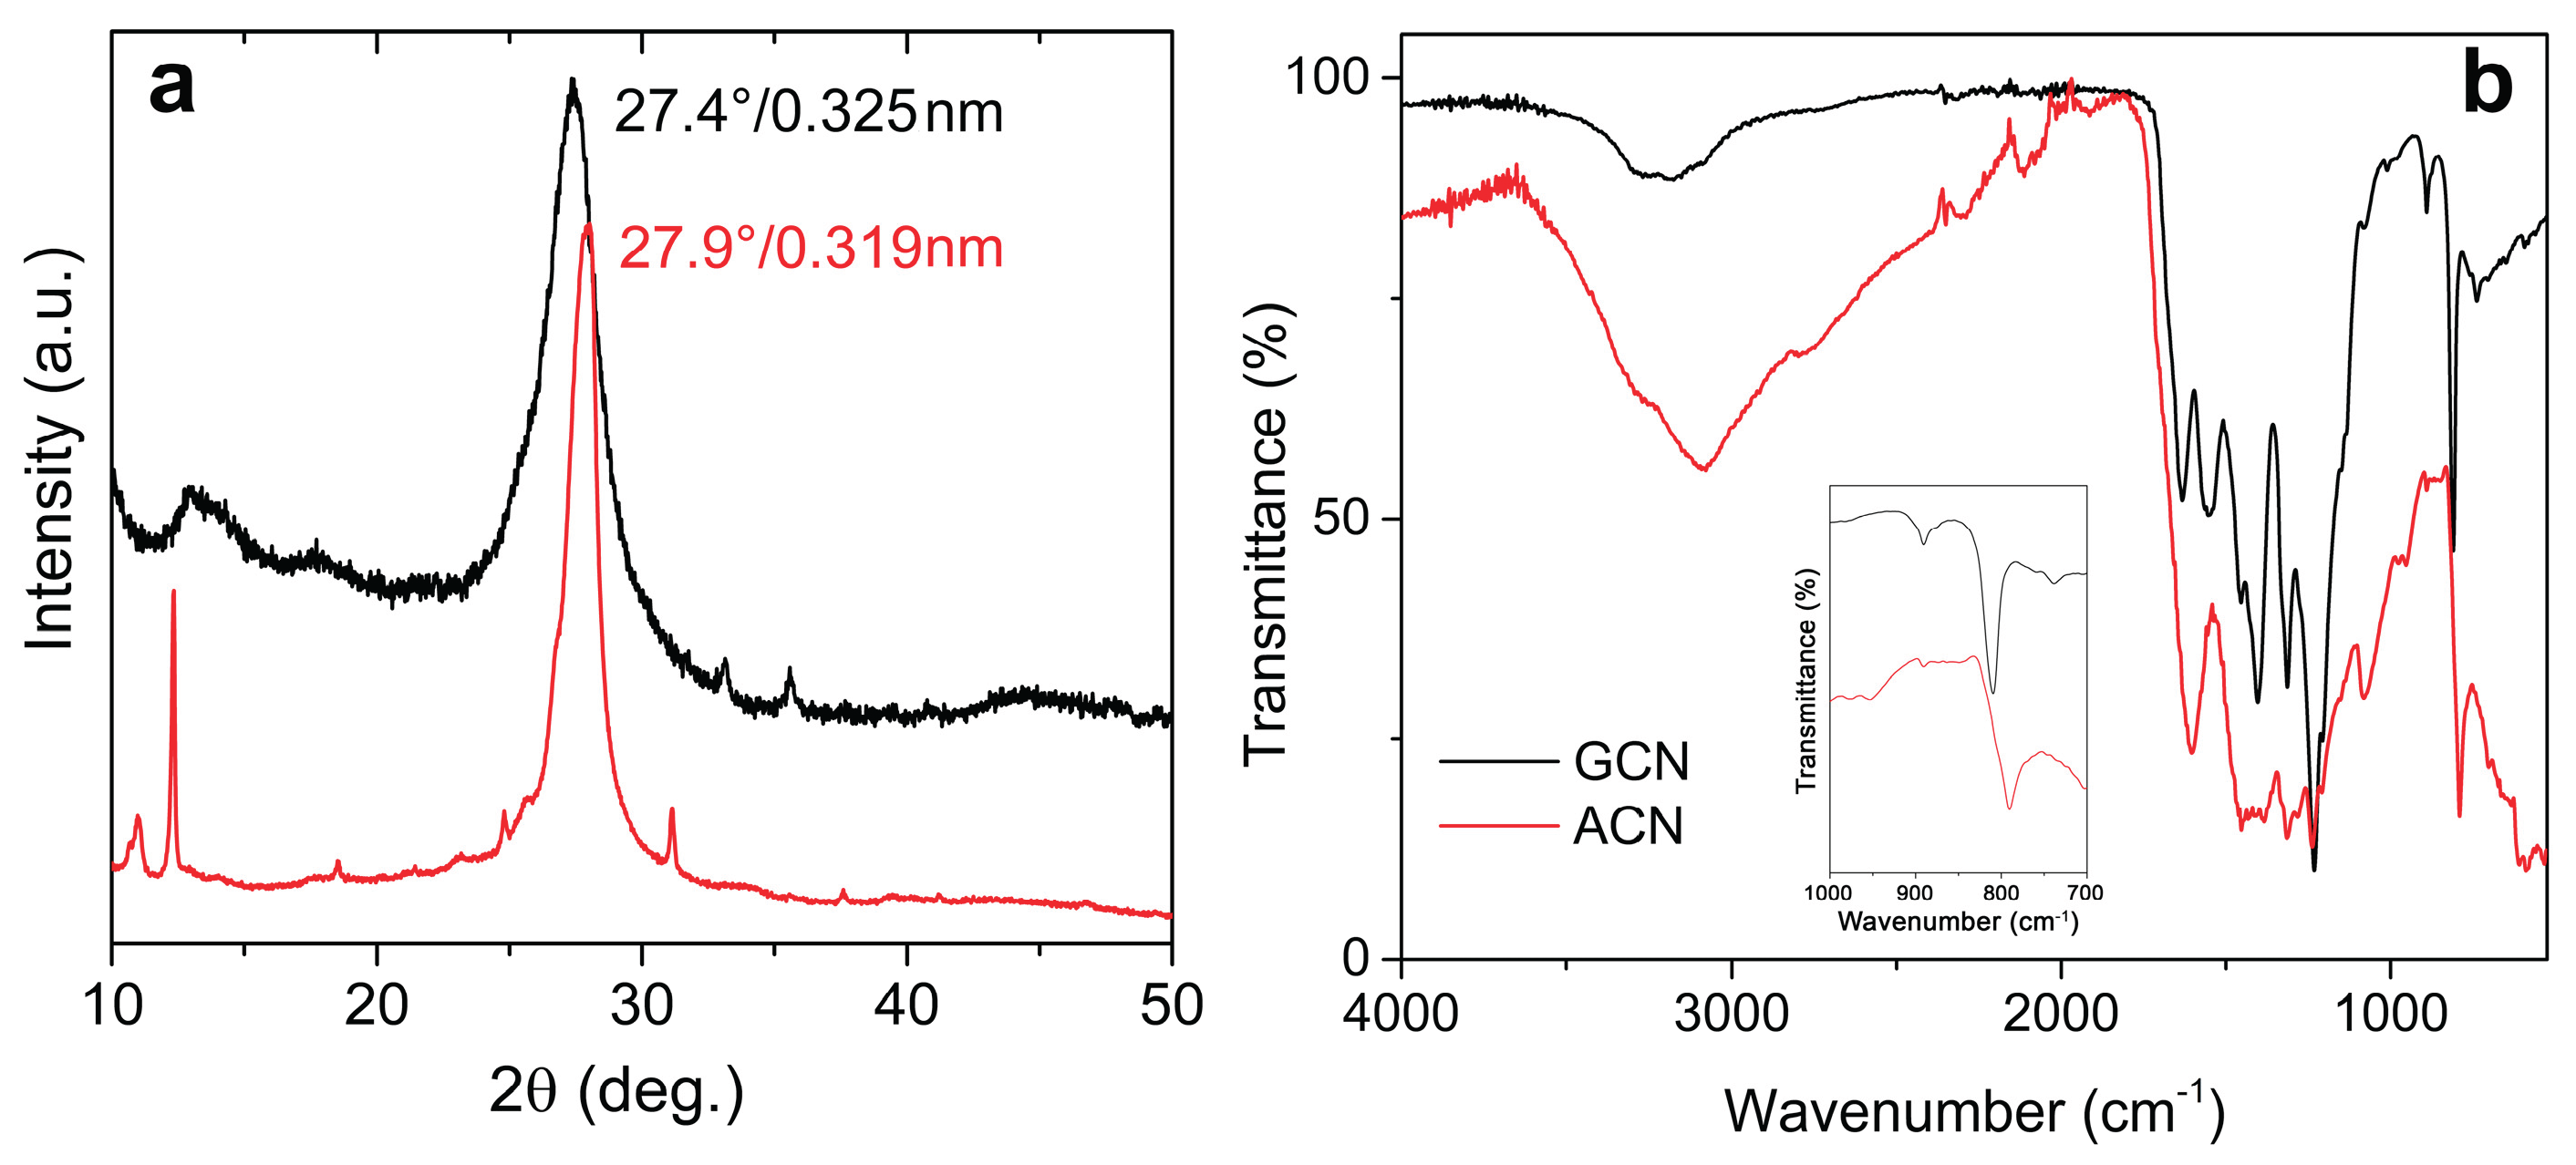
Figure 2.
SEM images of (a,b) GCN and (c,d) ACN.
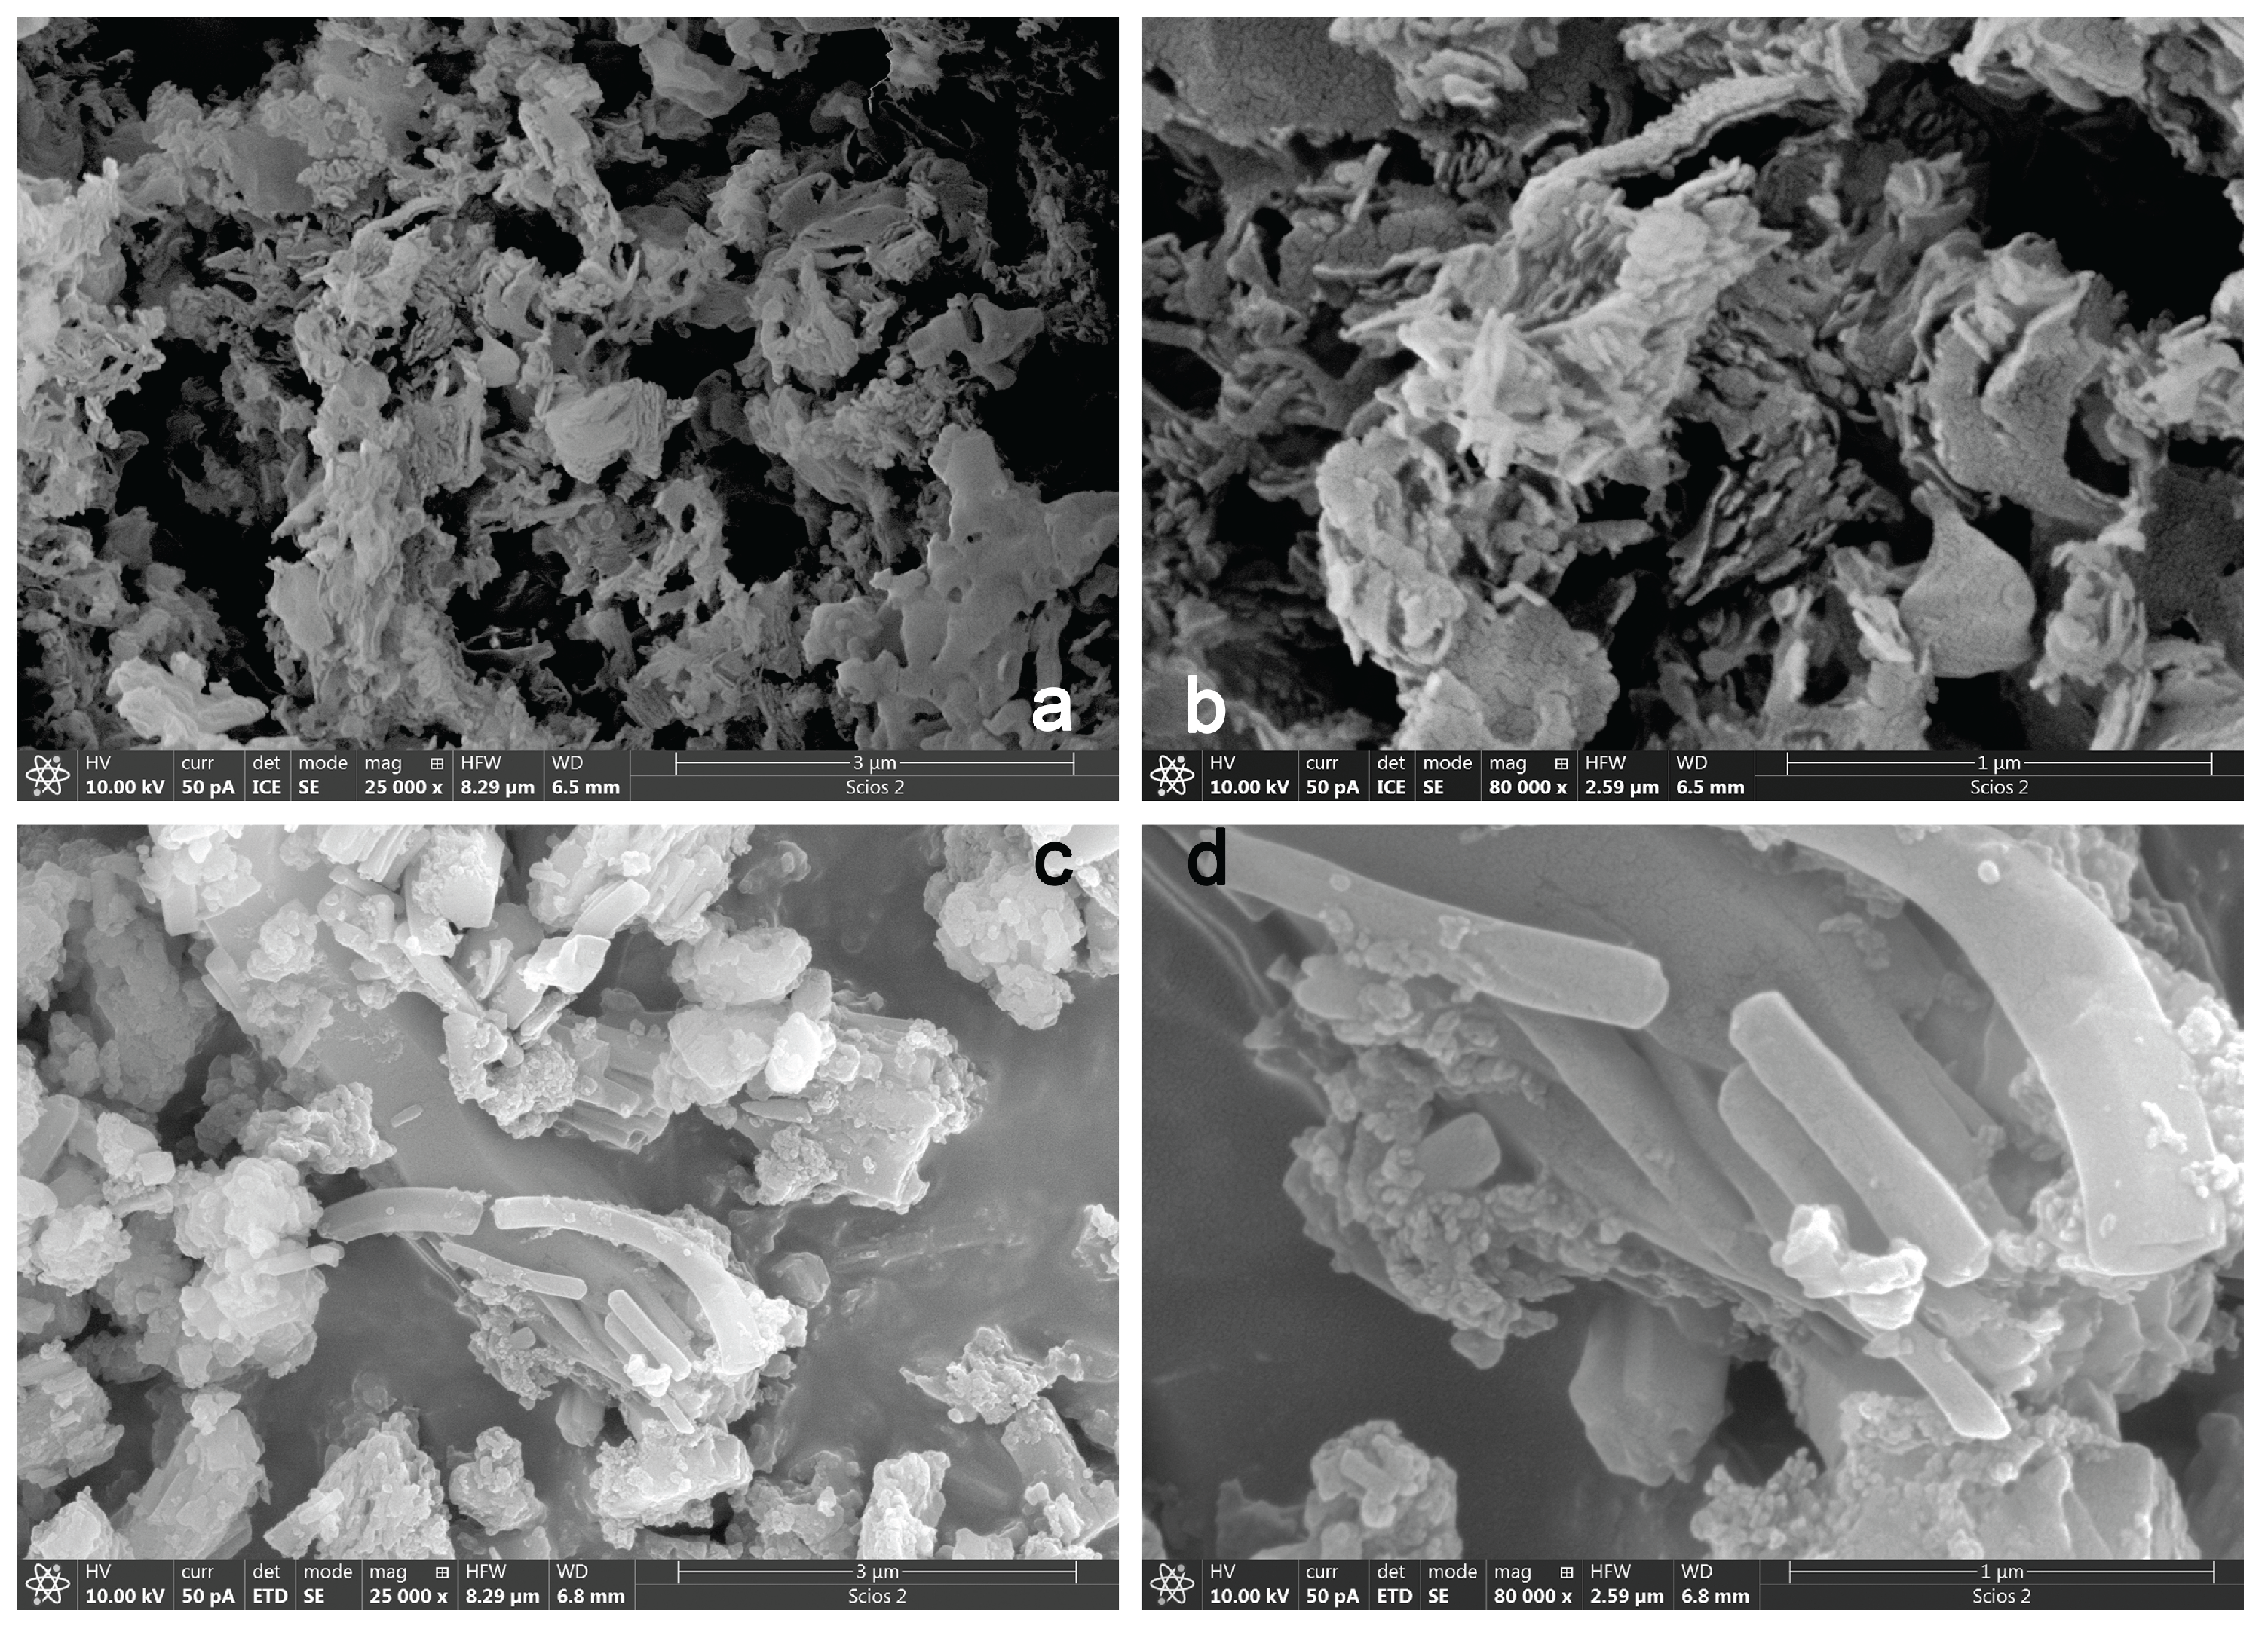
Figure 3.
High-resolution XPS spectra of core levels for (a-c) GCN and (d-f) ACN.
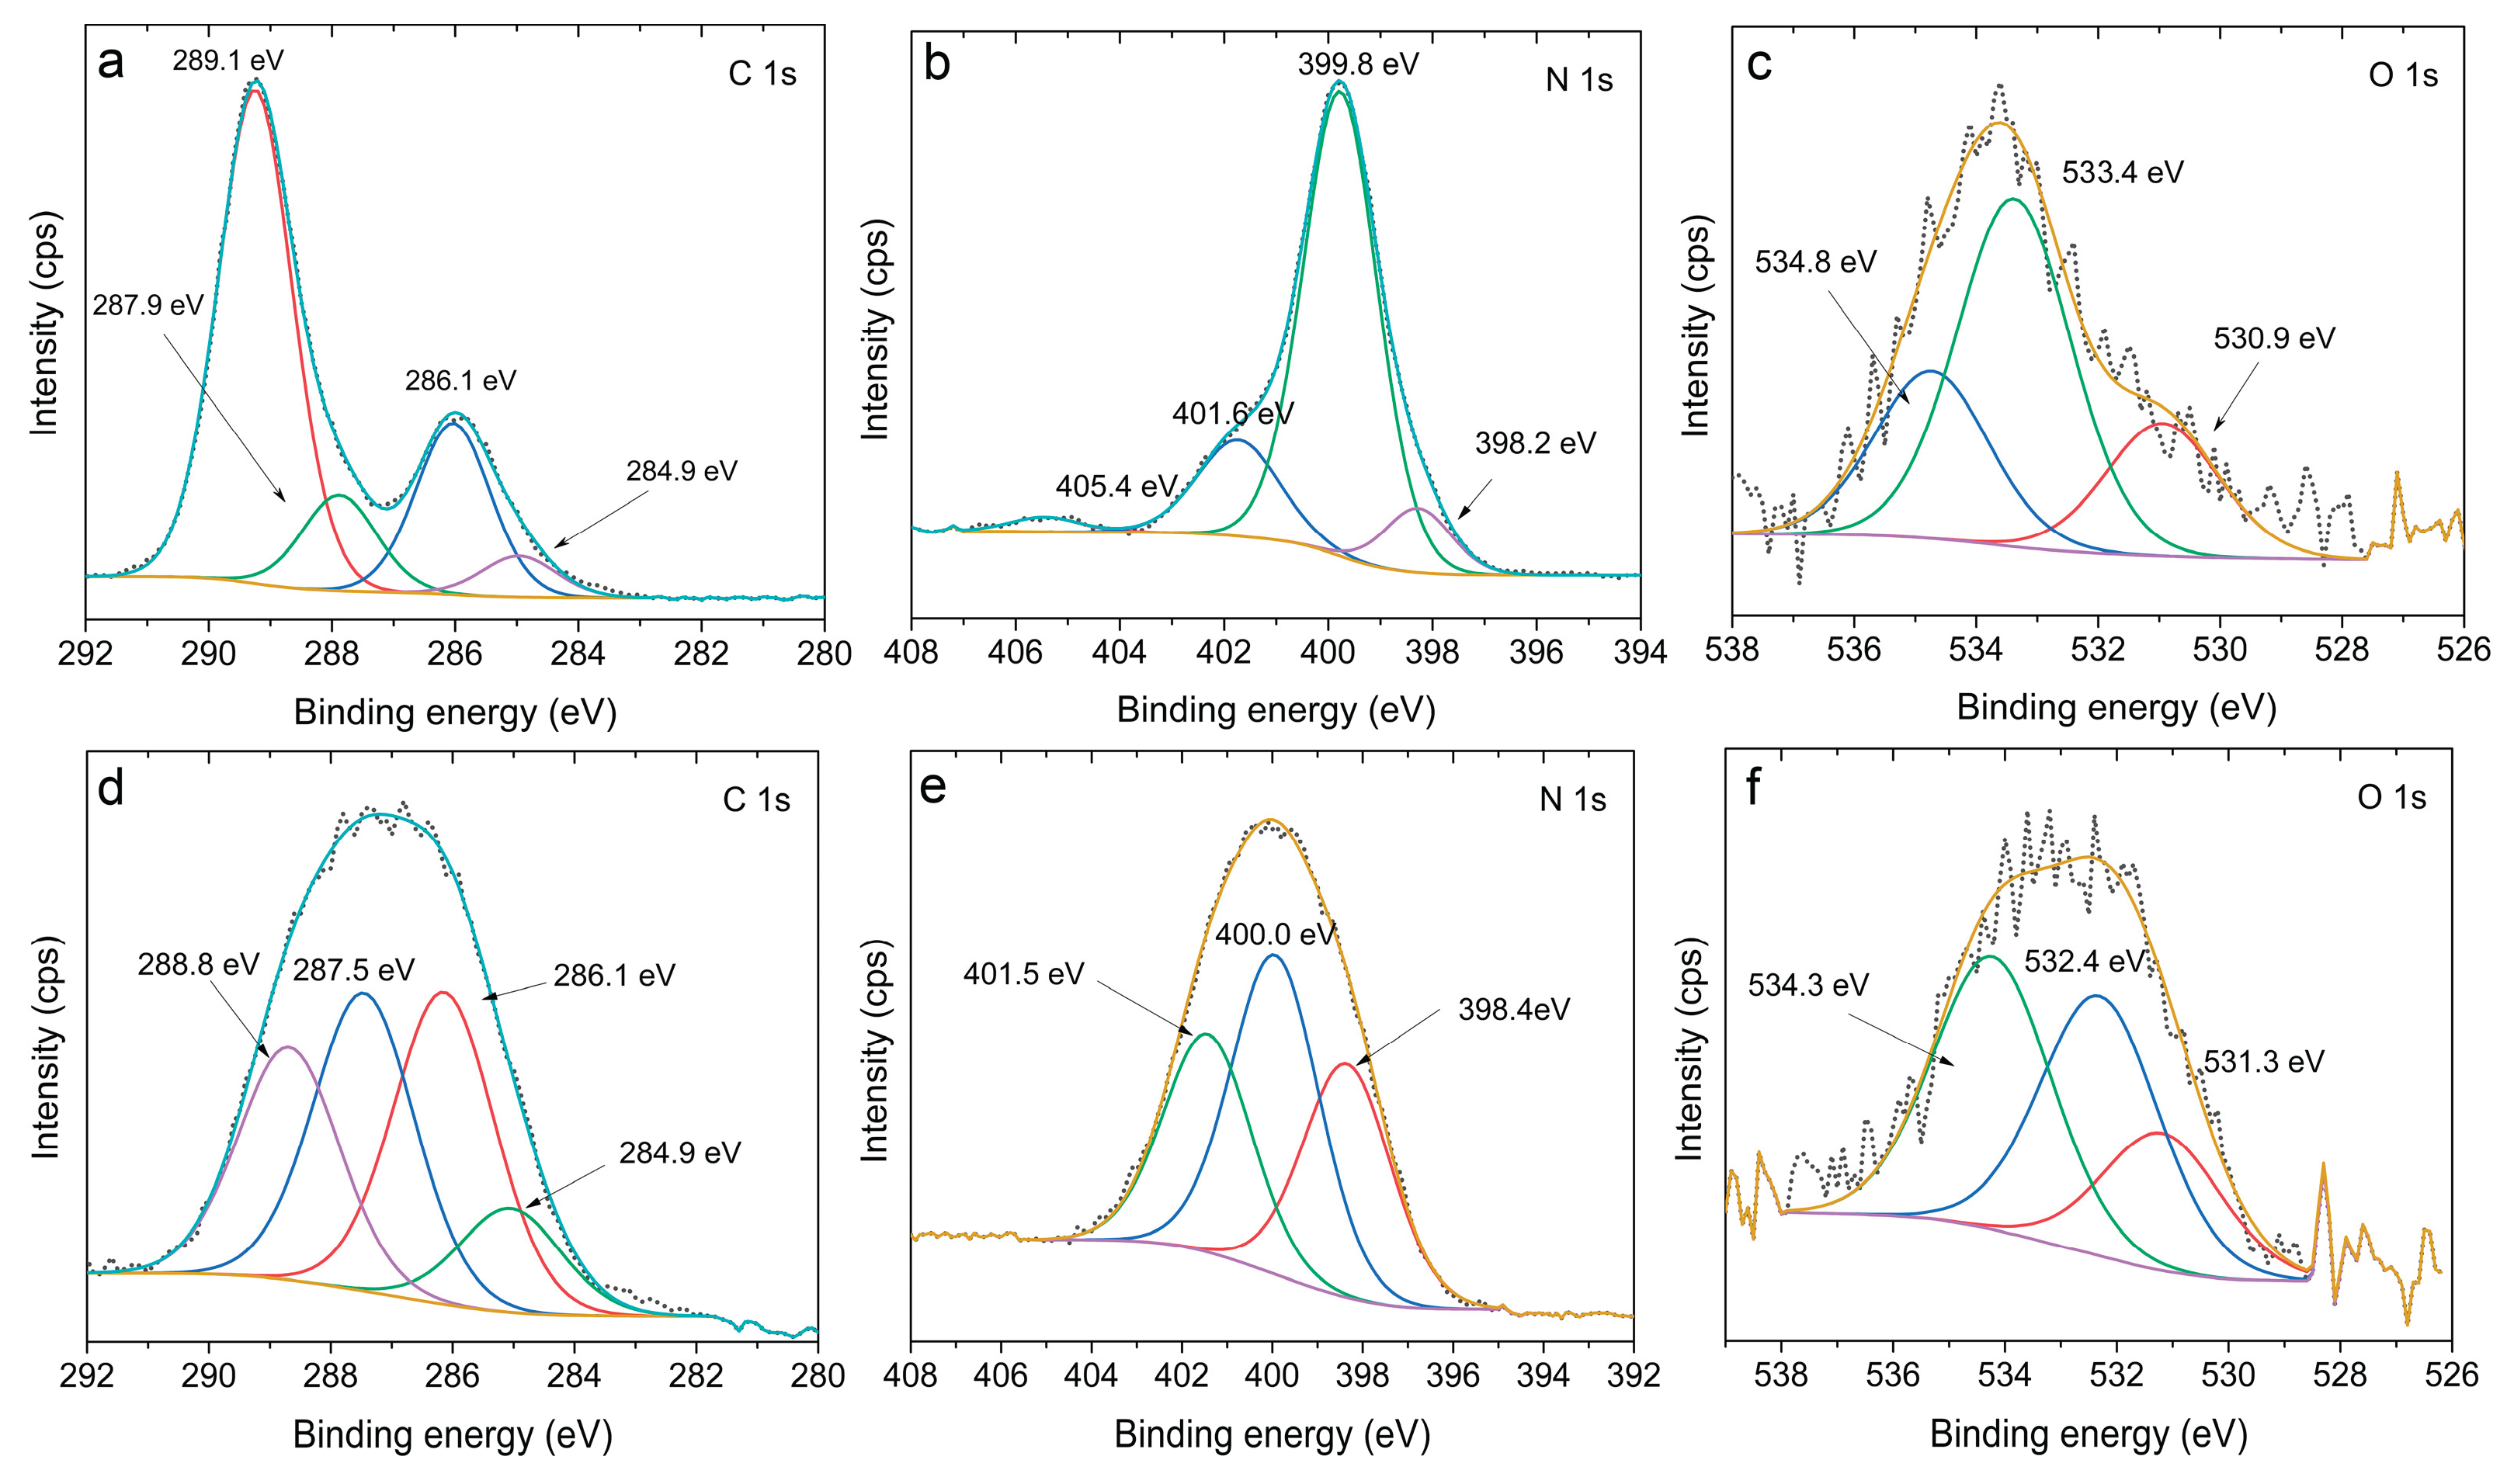
Figure 4.
N2 adsorption/desorption isotherms of a) GCN and b) ACN.
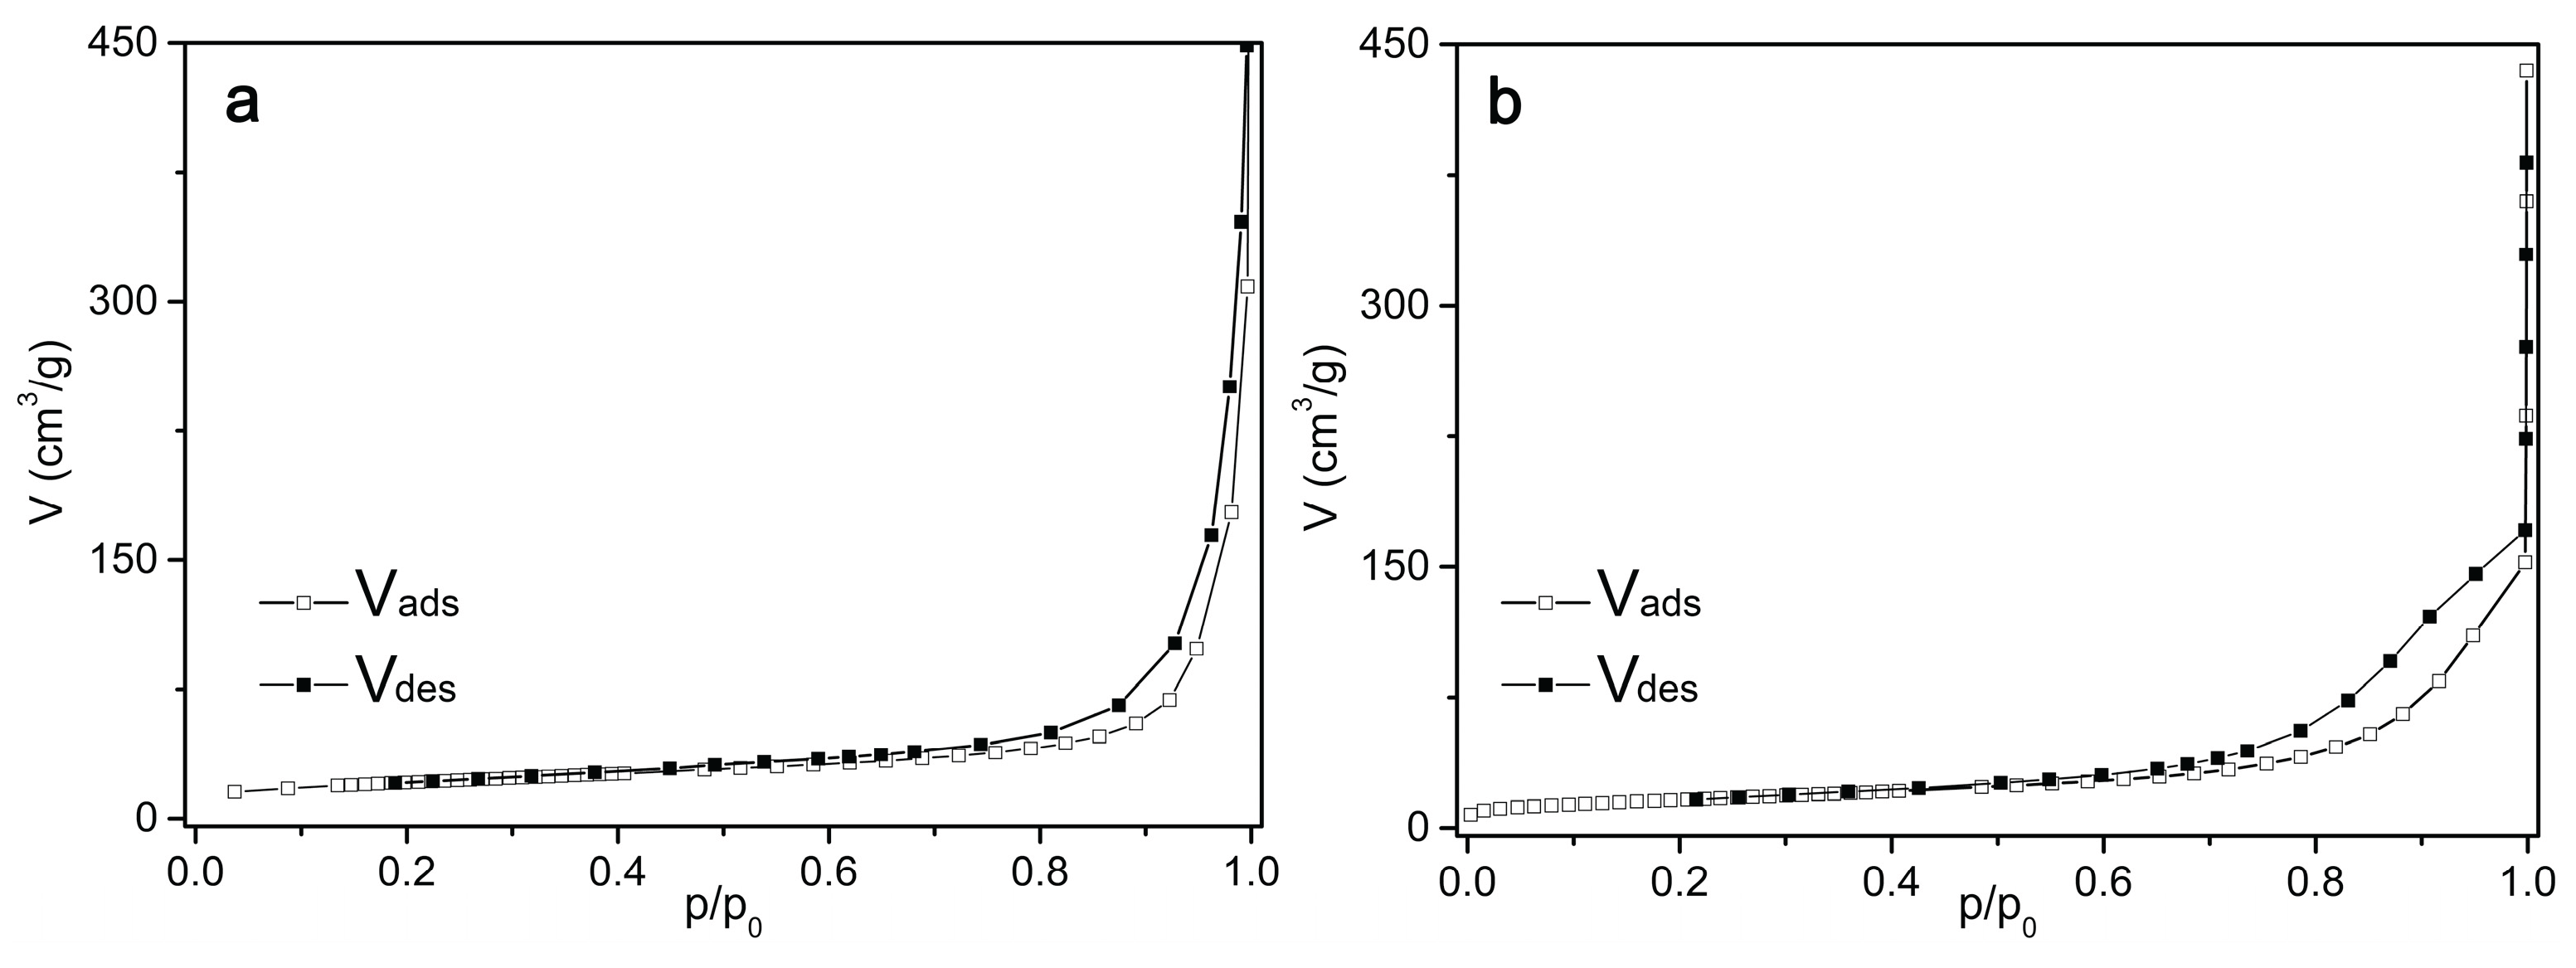
Figure 5.
a) Kubelka-Munk transformed UV-vis DR spectra of GCN (black line) and ACN (red line) and b) Tauc plots of GCN (black line) and ACN (red line).
Figure 5.
a) Kubelka-Munk transformed UV-vis DR spectra of GCN (black line) and ACN (red line) and b) Tauc plots of GCN (black line) and ACN (red line).
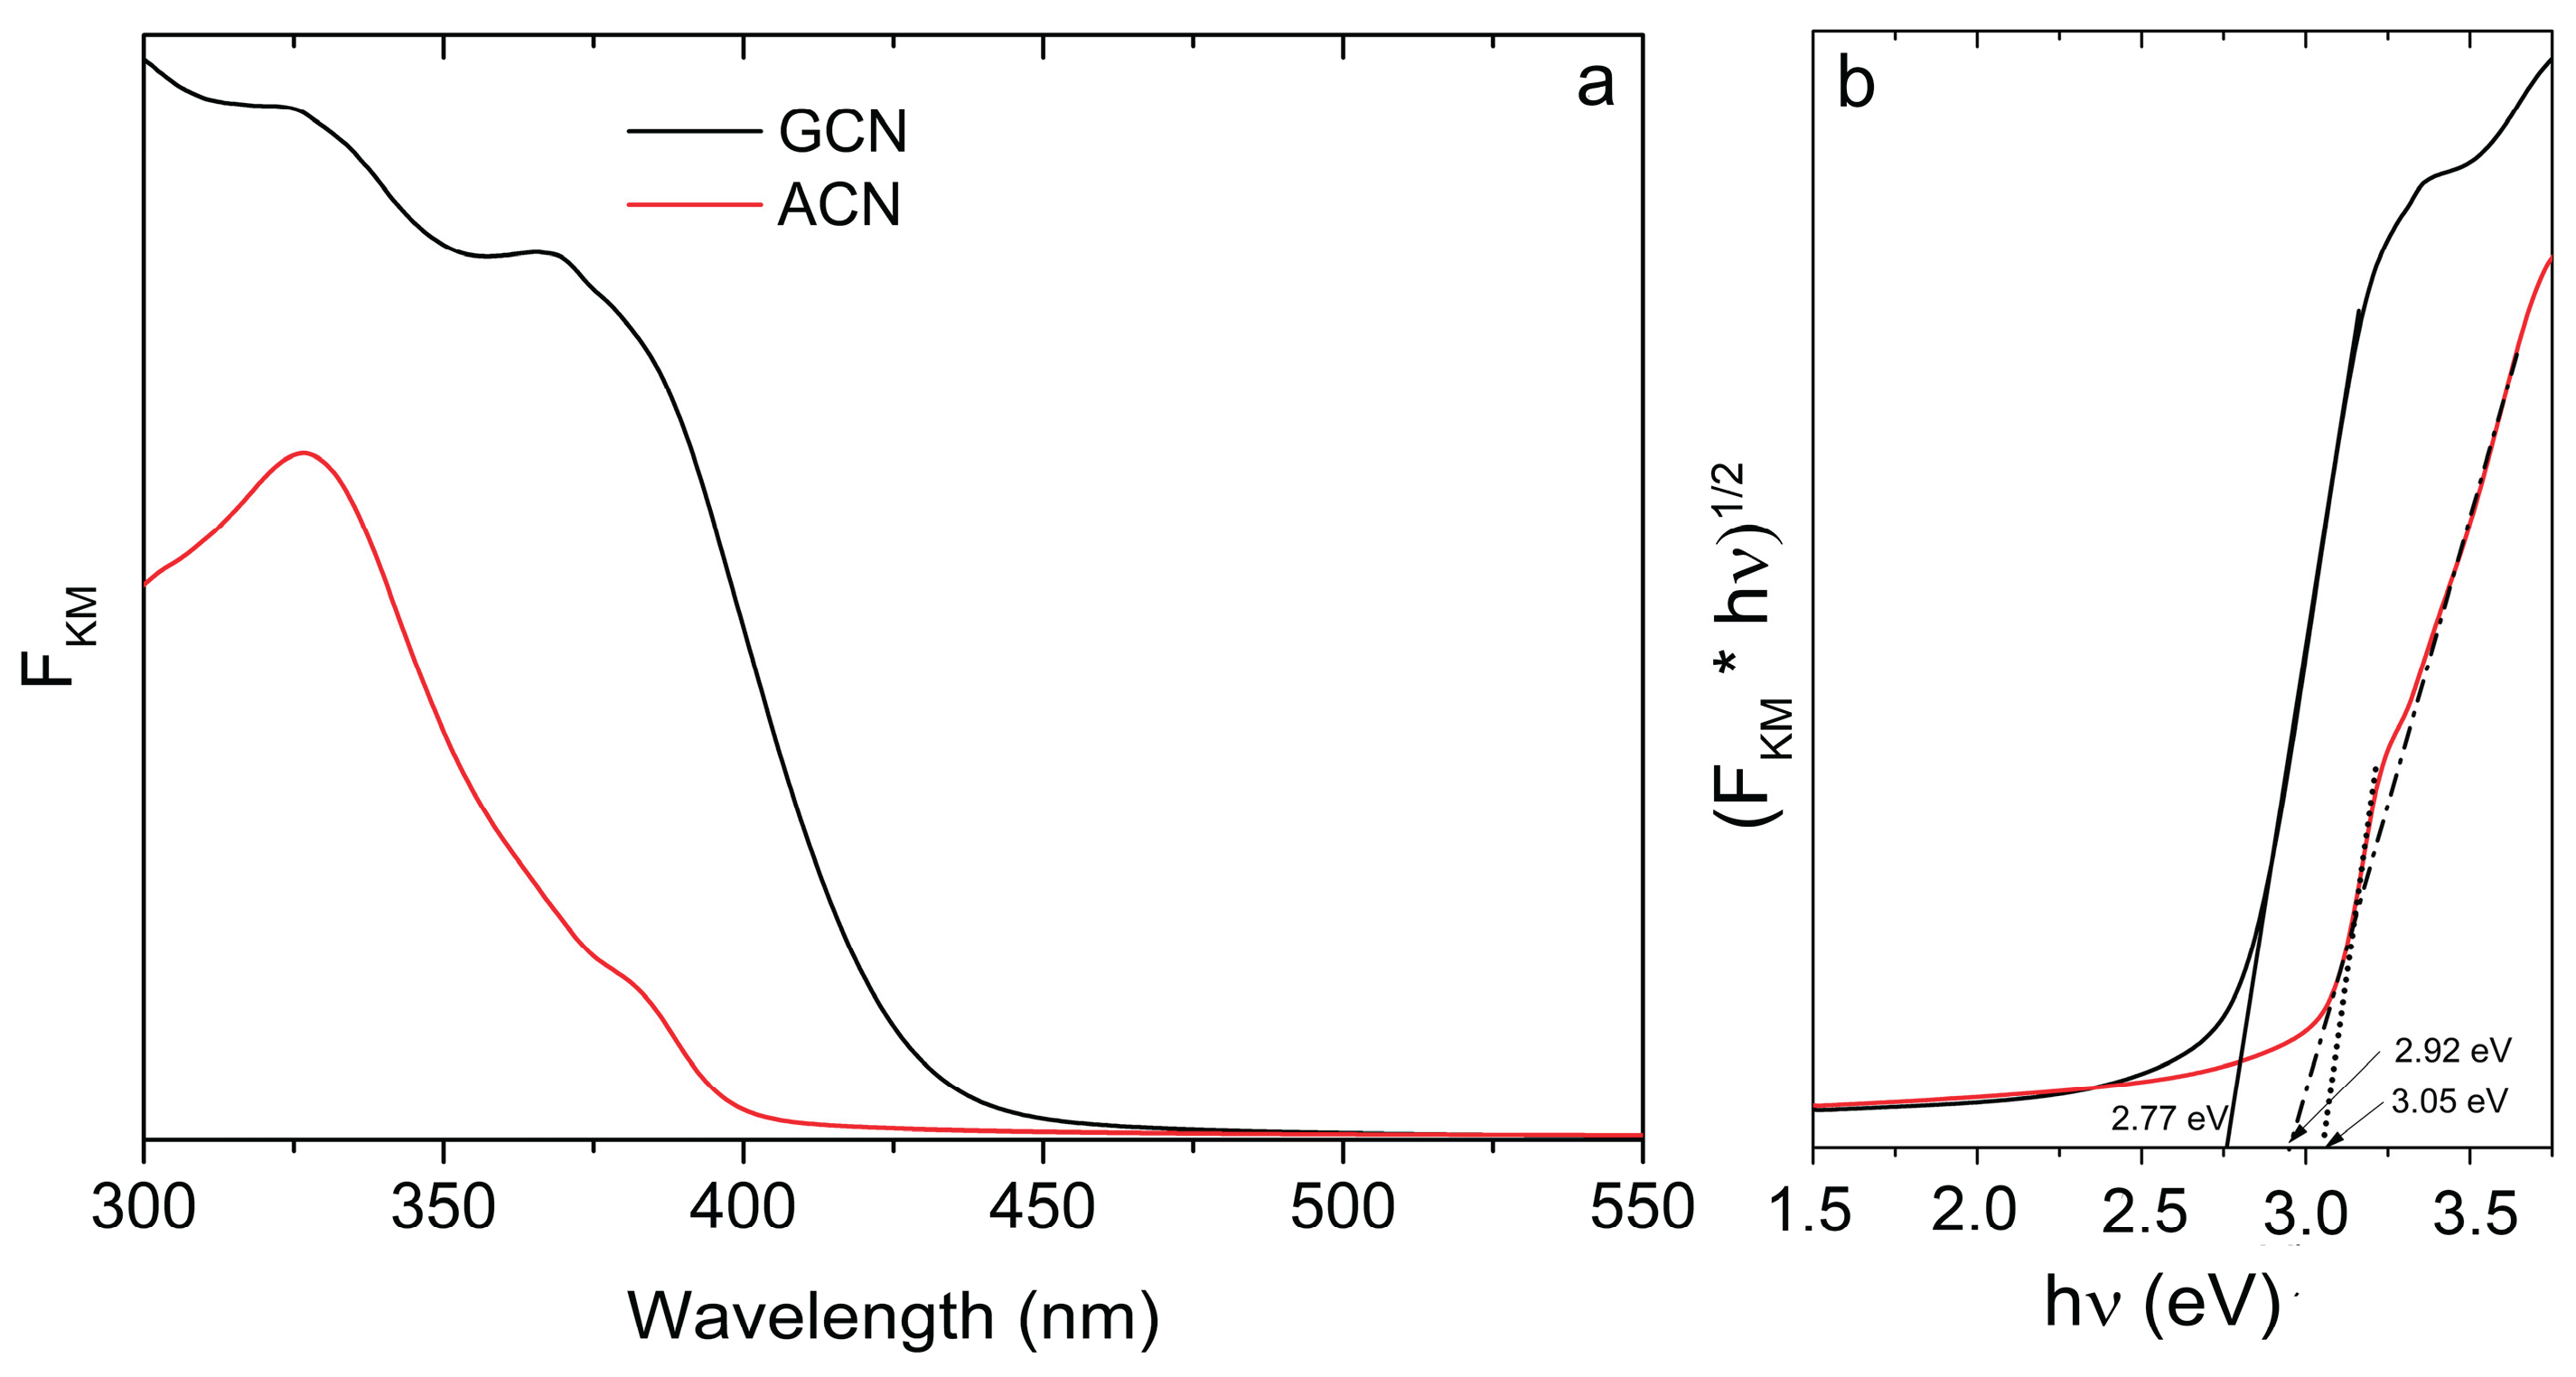
Figure 6.
a) Mott-Schottky plots of GCN (black) and ACN (red) measured at 1000 Hz in 0.1 M Na2SO4 solution (pH = 5.6) and b) Nyquist plots of GCN (black) and ACN (red). Inset: Equivalent electric circuit used to fit EIS data.
Figure 6.
a) Mott-Schottky plots of GCN (black) and ACN (red) measured at 1000 Hz in 0.1 M Na2SO4 solution (pH = 5.6) and b) Nyquist plots of GCN (black) and ACN (red). Inset: Equivalent electric circuit used to fit EIS data.
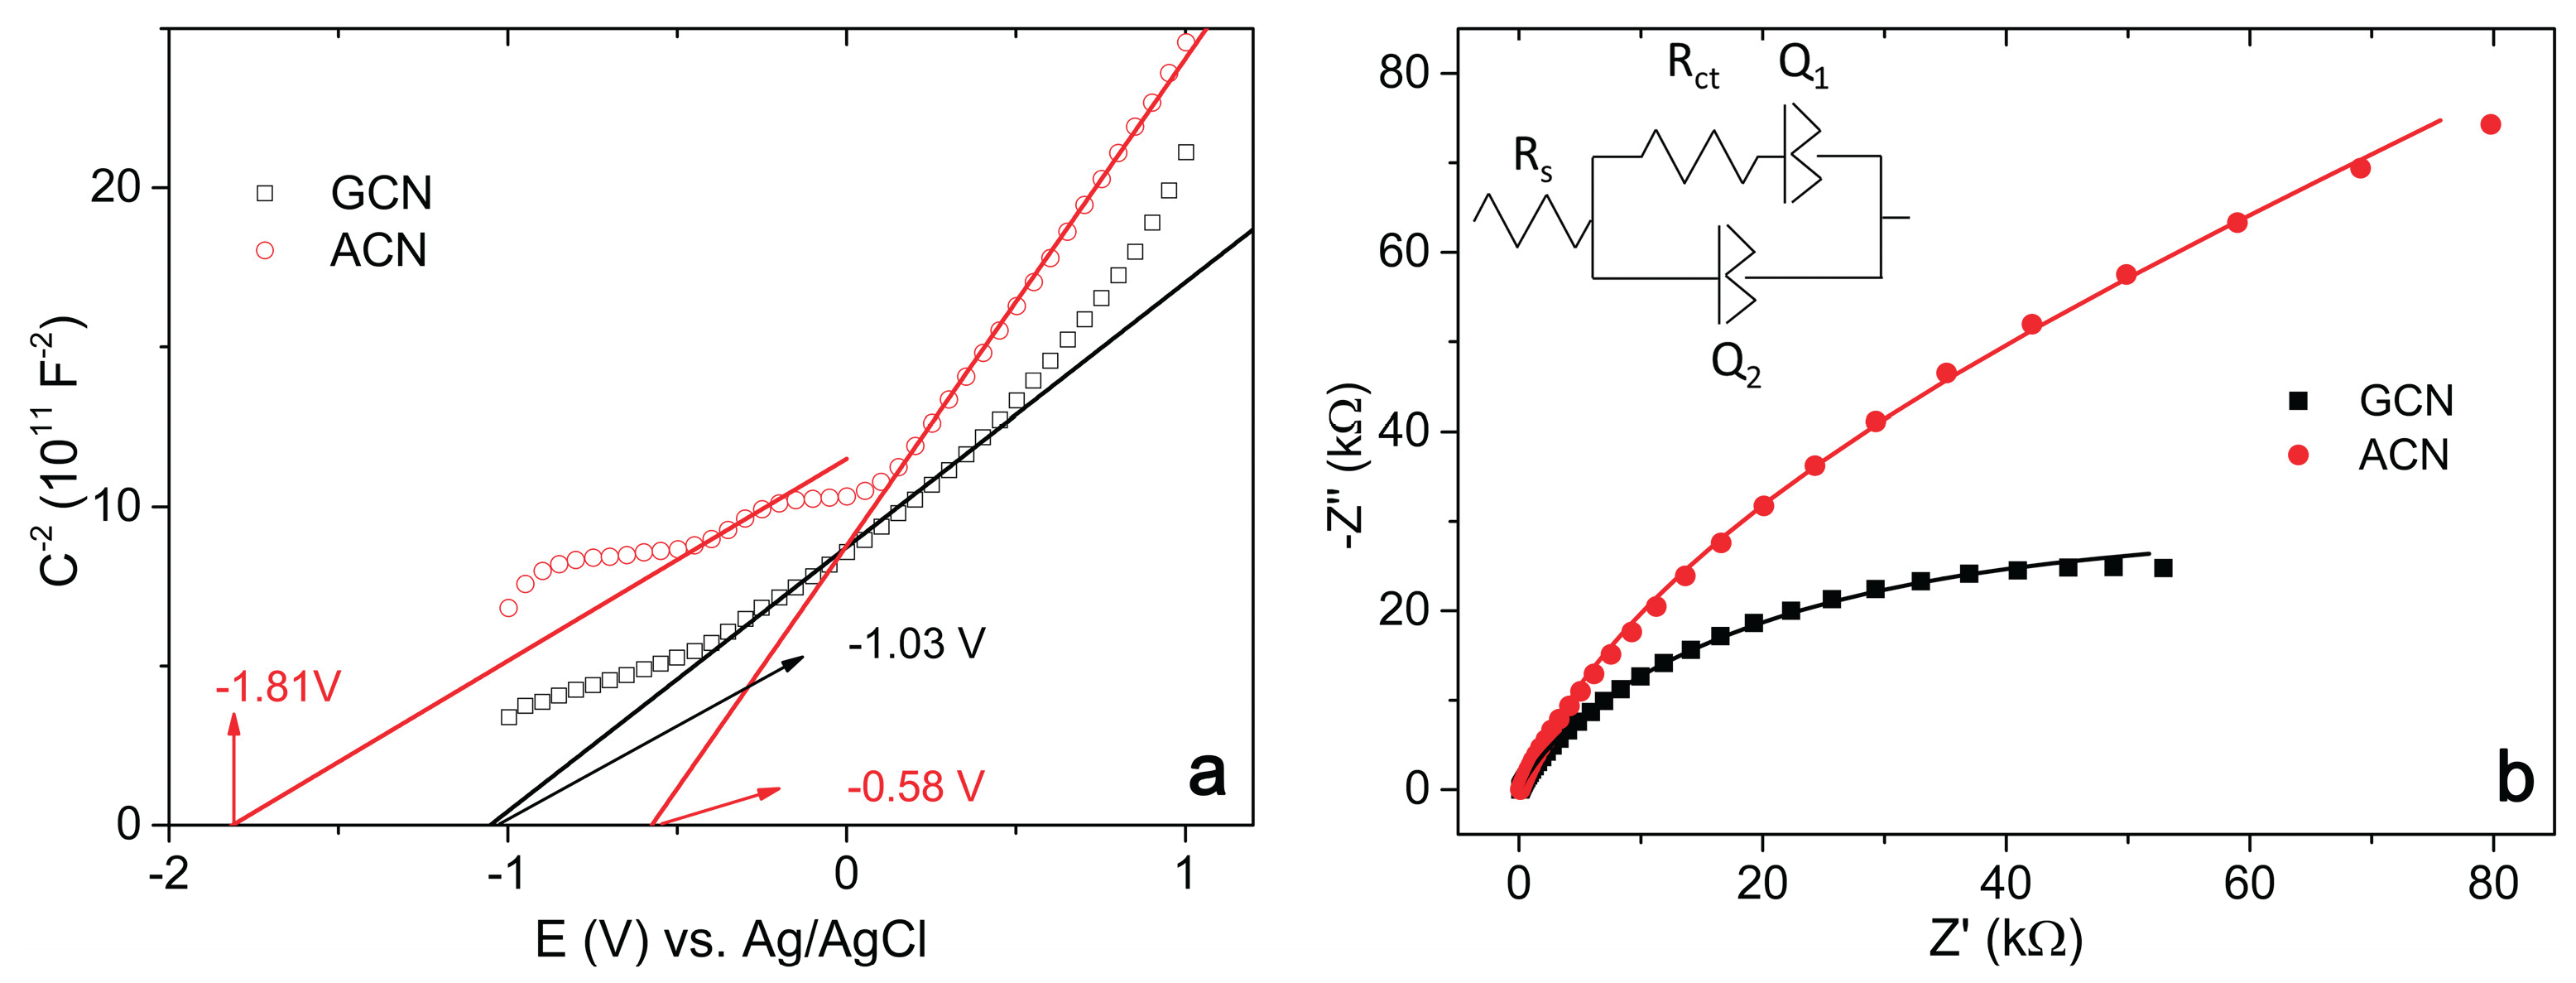
Figure 7.
EPR spectra of (a) GCN and (b) ACN as dry powders, (c) GCN and (d) ACN in aqueous suspension with the DEPMPO spin-trap, and (e) comparison of the DEPMPO/OOH adduct signals obtained after 10 minutes of visible light irradiation of GCN (black) and ACN (red).
Figure 7.
EPR spectra of (a) GCN and (b) ACN as dry powders, (c) GCN and (d) ACN in aqueous suspension with the DEPMPO spin-trap, and (e) comparison of the DEPMPO/OOH adduct signals obtained after 10 minutes of visible light irradiation of GCN (black) and ACN (red).
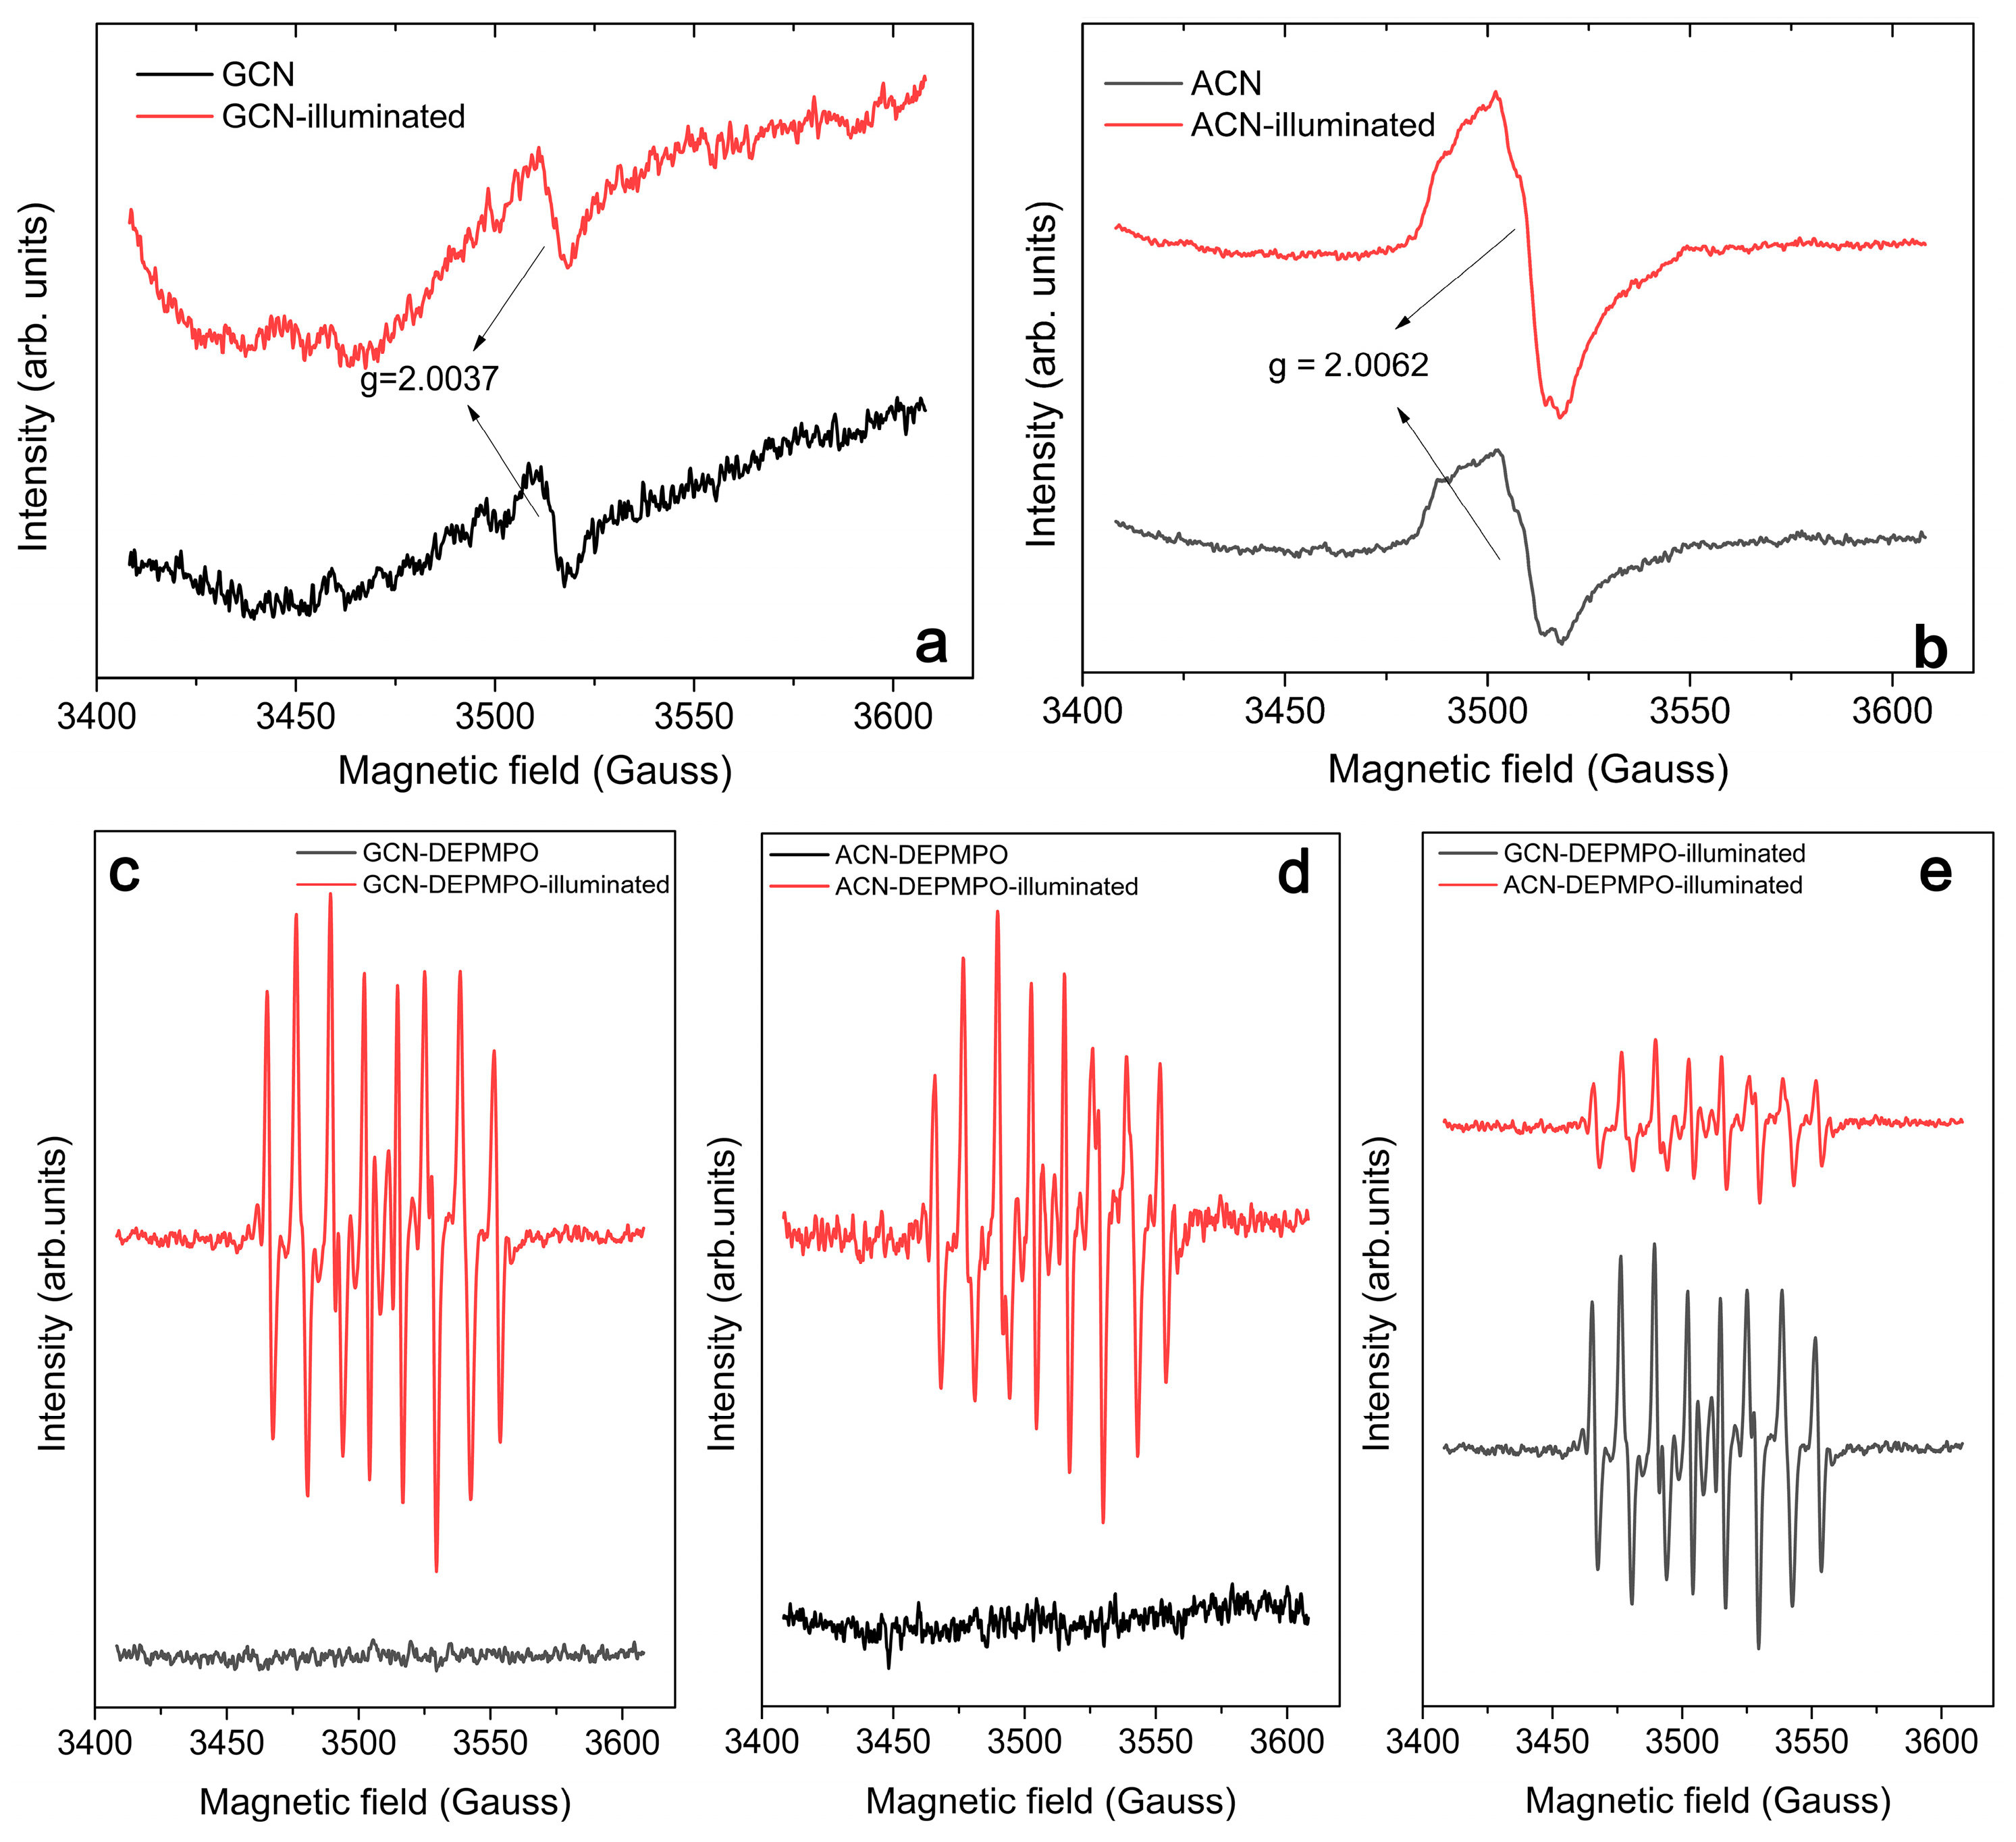

Table 1.
Textural properties of GCN and ACN samples determined by N2 sorption measurements.
| Sample | SSABET, (m2/g) | CBET | Vmes,(cm3/g) | Dmes,(nm) |
| GCN | 75 | 114 | 0.234 | 24.7 |
| ACN | 59 | 74 | 0.232 | 14.1 |
Table 2.
Characteristic potentials derived from Mott-Schottky analysis.
| Sample | EMS (V) vs. Ag/AgCl | EMS (V) vs. RHE | EMS (V) vs. SHE |
| GCN | - 1.03 | - 0.49 | - 0.82 |
| ACN | - 0.58 | - 0.04 | - 0.37 |
| - 1.81 | - 1.27 | - 1.60 |
Disclaimer/Publisher’s Note: The statements, opinions and data contained in all publications are solely those of the individual author(s) and contributor(s) and not of MDPI and/or the editor(s). MDPI and/or the editor(s) disclaim responsibility for any injury to people or property resulting from any ideas, methods, instructions or products referred to in the content. |
© 2026 by the authors. Licensee MDPI, Basel, Switzerland. This article is an open access article distributed under the terms and conditions of the Creative Commons Attribution (CC BY) license (http://creativecommons.org/licenses/by/4.0/).
Copyright: This open access article is published under a Creative Commons CC BY 4.0 license, which permit the free download, distribution, and reuse, provided that the author and preprint are cited in any reuse.