

Submitted:
29 September 2026
Posted:
30 September 2026
You are already at the latest version
Abstract
Text classification systems are increasingly deployed in settings where a confident but incorrect prediction carries a real cost. Aggregate accuracy on a held-out split says little about whether such a system can be trusted. This systematic review examines how reliability is pursued and evidenced across emotion classification, sentiment analysis, and AI-generated text detection. Following PRISMA, seven electronic databases (ScienceDirect, Scopus, Web of Science, ACM Digital Library, IEEE Xplore, Compendex, and PubMed) were searched together with a supplementary Google Scholar search. The search covered text-only journal articles and conference papers published from January 2016 through July 2026 that addressed a relevant NLP task and evaluated or improved at least one reliability dimension. Of 1,797 records identified, 1,294 were screened after deduplication, 464 were assessed in full text, and 51 studies met all criteria. Each study was characterized using a five-dimensional taxonomy: Task Category, Model Type, Reliability Approaches, Reliability Evaluation Evidence, and Reliability Validation. Task Category is mutually exclusive; the remaining four dimensions are non-mutually exclusive. Dataset language was recorded separately. Across the 51 included studies, AI-generated text detection accounts for 28 studies, sentiment analysis for 15, and emotion classification for 8. Encoder-Based Pre-trained Language Models (PLMs) are the most common Model Type (35 studies), followed by Decoder-Based LLMs (25) and Other Deep-Learning Architectures (18). Reliability Approaches are led by Uncertainty Estimation (15 studies), followed by Selective Prediction (9), Calibration (7), Distance and Representation Methods (7), Statistical and Likelihood Methods (5), and Consistency and Agreement Methods (3). Their distribution differs sharply by task category: Under the operational coding definition used in this systematic review, Uncertainty Estimation appears in 12 sentiment studies and 3 emotion studies, while no AI-generated-text study met the criteria for this category. All 5 Statistical and Likelihood Methods studies occur in AI-generated text detection, a concentration that partly reflects the category definition, since likelihood-based provenance statistics are themselves a detection technique. Reliability Evaluation Evidence is most often Error-Rate and Operating-Point Evidence (19 studies), followed by Calibration Evidence (14), Selective Prediction and Coverage Evidence (10), and Uncertainty Evidence (9). Reliability Validation is also uneven: 24 studies include Out-of-Distribution Validation, 21 Adversarial and Perturbation Validation, 20 Cross-Generator Generalization, 4 Cross-Lingual Validation, while 18 are limited to In-Distribution testing. The review 2 contributes a unified five-dimensional framework that makes the application, model context, reliability mechanism, supporting evidence, and validation conditions directly comparable across the three task categories and exposes where evidence remains narrower than the reliability claim it is used to support.
Keywords:
text classification
; reliability
; trustworthiness
; confidence calibration
; uncertainty quantification
; conformal prediction
; selective prediction
; sentiment analysis
; emotion classification
; AI-generated text detection
; systematic review
1. Introduction
This systematic review examines how reliability is conceptualized, operationalized, evaluated, and validated across emotion classification, sentiment analysis, and AI-generated text detection. The Introduction establishes the motivation and terminology, traces the development of reliability-aware evaluation, defines the review’s scope and contributions, and concludes with the research questions.
1.1. Background and Motivation
Text classification is among the most widely applied capabilities in natural language processing. Assigning discrete labels or continuous scores to text underpins sentiment analysis, emotion recognition, topic categorization, content moderation, and the identification of machine-generated writing [1]. Successive advances in representation learning have raised reported performance on benchmark datasets, moving from feature-based classifiers to encoder-based pre-trained language models (PLMs) [2] and, more recently, to large decoder-based models [3]. The consequences of that progress are not confined to the literature. Classifiers of this kind now screen student submissions for authorship [4], triage user-generated content at platform scale [5], support inferences about mental health from social-media text [6], and inform service decisions through aspect-level analysis of online reviews [7]. Text classification has become an operational technology rather than an object of laboratory study alone.
Deployment changes what counts as a good classifier. In an educational integrity workflow, a clinical triage pipeline, or a social-media moderation queue, the consequence of a single prediction is borne by a person, and the system is trusted either to act or to defer. A human-in-the-loop grading pipeline makes that division operational: repeated prompting of large language models yields a self-consistency certainty estimate, low-certainty cases are routed to human graders, and this selective review improves grading accuracy while reducing manual grading time [8]. Aggregate accuracy on a held-out test split speaks to average behavior on data drawn from the same distribution as training [9]. It says nothing about whether a model’s confidence corresponds to its actual likelihood of being correct, whether a given prediction should be acted upon at all, or how the model behaves once the input no longer resembles what it was trained on. These are not hypothetical concerns. Modern neural classifiers assign high softmax confidence to predictions that are wrong [10,11], and the quality of their predictive uncertainty degrades substantially once the input distribution shifts [12]. A model can therefore be highly accurate and, at the same time, systematically overconfident in precisely the cases where it errs.
The difficulty is that the evaluation vocabulary in widest use was never designed to answer these questions. Accuracy, precision, recall, F1, and AUROC characterize how well a model separates classes on a fixed test set. They are silent on whether its confidence can be trusted, on how it should behave when it is uncertain, and on how far its measured performance travels beyond the distribution on which it was measured [9,13]. Benchmark performance is therefore a weaker proxy for operational dependability than its ubiquity suggests. What deployment demands is a distinct property, with its own failure modes and its own standards of evidence. The subsection that follows sets out what reliability means in the context of text classification, how it fails, and how the field has responded.
1.2. Reliability in Text Classification: Concepts and Terminology
Reliability, as the term is used in this review, refers to the dependability of a classifier’s output as a basis for action rather than to the correctness of its point predictions alone. Four properties are treated as central to the operational definition used in this review. Confidence quality is the correspondence between the confidence a model assigns to a prediction and the empirical frequency with which predictions of that confidence are correct. Coverage behavior is the model’s capacity to decline to predict, together with the accuracy it achieves on the predictions it does make. Stability under distribution shift is the extent to which both of these properties persist once the input no longer resembles the training data. Error asymmetry recognizes that different types of classification error are seldom equally costly. Reliability in this sense is distinct from adjacent properties that a responsible system is also expected to exhibit: fairness, interpretability, and privacy raise separate questions, and work addressing them without a confidence-, coverage-, or shift-related contribution falls outside the scope of this review. Although reliability is often discussed as one component of broader trustworthiness, trustworthiness is not treated here as a separate construct; the term was used only as a search keyword to capture studies that frame reliability contributions in those terms.
Each of these properties can fail in a characteristic way, and the reliability literature has grown up around those failures. Modern neural classifiers are poorly calibrated, producing high softmax confidence for predictions that are incorrect [10,11]. They degrade unpredictably under distribution shift, whether the shift is one of domain, of language, or of the generator producing the text [12]. Class imbalance compounds these problems, since learners tend to bias toward the majority class and may in extreme cases effectively ignore minority classes [14], while aggregate calibration measures can conceal substantially worse confidence quality on individual classes [15]. Label-space structure raises a parallel measurement problem: where emotion labels are organized in an affective hierarchy, evaluation measures designed for a finite set of isolated classes ignore the structure of the scheme, so performance is often reported inaccurately [16]. In detection settings they produce false positives whose cost is asymmetric and borne principally by the accused rather than by the operator of the system [4,17]. An audit framed explicitly around critical decision-making reports the same pattern, finding low detector precision across the tools it evaluates and individual verdicts that reverse under minor textual edits [18]. These failures are not independent. A shift in domain typically degrades calibration, and degraded calibration in turn undermines any abstention rule that depends on a confidence threshold.
Distinguishing reliability evidence from predictive-performance evidence is therefore a measurement problem before it is a methodological one. Accuracy, precision, recall, F1, and AUROC are computed either from hard decisions or from the ranking of scores. They are invariant to any monotone rescaling of confidence, so a model whose probabilities are uniformly inflated scores identically to one that is well calibrated. Reliability-specific evidence takes different forms. Proper scoring rules such as the Brier score evaluate the full predictive distribution and cannot be improved by misreporting confidence [19,20]. Calibration error, most commonly estimated by partitioning predictions into bins and comparing confidence with observed accuracy, measures the discrepancy directly [21]. Risk-coverage curves report accuracy as a function of the proportion of inputs on which a model elects to predict [22]. Empirical coverage compares the realized rate at which prediction sets contain the true label against a nominal target [23,24]. A study that reports only discriminative metrics has not produced reliability-specific evidence under the operational definition used in this review, whatever mechanism it proposes, and the distinction is recorded explicitly for every included study.
The mechanisms that address these failures are grouped here into six Reliability Approach categories used throughout the synthesis. Calibration methods explicitly adjust or optimize the correspondence between reported confidence and empirical correctness [10]. Uncertainty Estimation derives an uncertainty quantity, commonly through Bayesian approximations, stochastic inference, or ensembles [25,26]. Selective Prediction changes whether or how a prediction is issued by allowing abstention, rejection, deferral, or set-valued output; ordinary threshold tuning that still forces a binary decision is not treated as Selective Prediction. Distance and Representation Methods judge reliability using proximity or structure in a learned representation space. Consistency and Agreement Methods infer reliability from stability across perturbations, models, agents, or related predictions. Statistical and Likelihood Methods exploit distributional or likelihood properties of the text itself, particularly in AI-generated text detection. These six categories are non-mutually exclusive and form the Reliability Approaches dimension of the taxonomy. The six categories do not all play the same functional role. Calibration primarily transforms an existing confidence signal, while Selective Prediction governs how that signal is used to issue, defer, reject, or return a set-valued prediction. Uncertainty Estimation derives an uncertainty signal. Distance and Representation Methods and Statistical and Likelihood Methods construct a reliability-related signal from representations, distances, statistical properties, or likelihoods. Consistency and Agreement Methods infer reliability from stability across repeated or perturbed predictions. The dimension records the mechanism used to operationalize reliability, not a single uniform type of operation.
The four properties in the operational definition are represented across different dimensions of the taxonomy rather than mapped to a single axis. Confidence quality is evaluated primarily through Calibration Evidence, with Uncertainty Evidence providing additional information about the reliability of a model’s confidence signal. Coverage behavior is operationalized through Selective Prediction and Coverage Evidence. Stability under distribution shift is captured on the Reliability Validation axis through out-of-distribution, adversarial and perturbation, cross-generator, and cross-lingual testing. Error asymmetry is reflected primarily in Error-Rate and Operating-Point Evidence through operating-point measures such as false-positive rate, false-negative rate, and true-positive rate at a fixed false-positive rate. Uncertainty Evidence is therefore treated as supporting evidence for confidence quality rather than as a separate fifth defining property.
1.3. From Predictive Performance to Reliability-Aware Evaluation
For most of its history, progress in text classification has been measured by a single convention: a shared dataset, a held-out test split, and a headline score. The convention was productive because it made competing claims comparable and progress legible, and the survey literature on the field is organized around it [1]. Its limitation is that it evaluates only the correctness and ordering of decisions, and benchmark scores of this kind are routinely read as evidence of a general capability they cannot supply [13]. The reliability literature is best understood as a sequence of attempts to supplement that convention rather than to replace it. The principal milestones of that development are summarized in Figure 1.
The conceptual apparatus for doing so was largely in place before text classification adopted it, and it did not arrive in the order in which the modern literature encounters it. The option for a classifier to decline to predict was formalized in 1970, when Chow derived an optimum rejection rule and characterized recognition performance by its error-reject tradeoff [27]. Post-hoc recalibration of classifier scores into usable probabilities was established in the early 2000s [28], with a systematic comparison across model families following in 2005 [29]. The evaluative machinery is older still: the Brier score dates to 1950, and the theory of proper scoring rules that underwrites it was consolidated considerably later [19,20]. Bayesian treatments of uncertainty in neural networks were developed in the early 1990s [30], and conformal prediction, which supplies distribution-free coverage guarantees, was set out in book form in 2005 [23]. These strands were developed by largely separate communities, and none was framed as a problem in text classification. They matter here as the inheritance on which the modern literature drew, not as its origin.
The rise of deep neural classifiers renewed concern about whether model confidence could be treated as a reliable indicator of correctness. In 2017, Guo et al. showed that modern networks are substantially miscalibrated and that miscalibration tends to worsen as capacity grows [10]. Work from the same period established that softmax confidence is a weak, though non-trivial, signal for identifying errors and out-of-distribution inputs [11]. The response was rapid and largely concurrent rather than sequential: approximate Bayesian inference by dropout in 2016 [25], deep ensembles in 2017 [26], and, in the same year, selective classification for deep networks, which carried Chow’s reject option into the neural setting [22]. Together, these developments helped consolidate calibration, uncertainty estimation, and selective prediction as a more visible reliability-oriented research agenda in modern deep learning. The picture has since been qualified rather than overturned. Minderer et al. reported in 2021 that the most recent architectures, particularly those not built on convolutions, are among the better calibrated, and that the association between miscalibration and either model size or distribution shift is less pronounced in those models [31].
The transfer of these reliability concerns into modern NLP accelerated with the widespread adoption of pretrained transformers, which made these questions both tractable and consequential for text [2]. Desai and Durrett reported in 2020 that pretrained transformers are well calibrated in-domain and degrade markedly out-of-domain, while remaining better calibrated than non-pretrained baselines [32]. Selective prediction was taken up in the same year for question answering under domain shift, where the decision to abstain was tied explicitly to a change in the input distribution [33], and calibration was subsequently examined in the generative setting [34]. Robustness entered the same literature on comparable terms: pretrained transformers were shown to improve out-of-distribution robustness without eliminating the problem [35], and behavioral testing was proposed as a complement to held-out accuracy rather than a substitute for it [9]. Part of the residual gap has since been attributed to shortcut learning, with pre-trained language models relying on spurious cues that reduce effectiveness on out-of-distribution samples, and mitigation framed as separating shortcuts from causal keywords using language-model feedback [36].
Robustness under distribution shift is better understood as an evaluation dimension cutting across these methods than as a stage succeeding them. Ovadia et al. subjected calibration and uncertainty methods to shift simultaneously and found that the ranking of methods established in-distribution does not survive it [12]. Benchmark suites now treat in-the-wild shift as the setting in which reliability claims should be tested, rather than as an afterthought [37]. Shift also governs whether a threshold selected on development data remains meaningful in use, which ties it directly to selective behavior and abstention. Shift is also temporal: longitudinal experiments on datasets spanning between six and nineteen years show that classifier performance degrades as test data grow more distant in time from the training period, and that this persistence varies across language models and classification algorithms [38]. Scenario-adaptive evaluation of fine-tuned text models points in the same direction, reporting that robustness profiles are task-dependent rather than uniform and that weaker adapters show more pronounced cross-lingual safety gaps [39]. The most recent movement is toward reliability as a property of a deployed system: what a confidence score licenses, who bears the cost of an error, and how a model’s operating characteristics should be documented [13,40]. It is in this deployment-facing register that the two review branches examined by this review diverge most sharply, and the subsection that follows sets out that divergence, the two branches it produces, and the framework used to analyze them.
1.4. Scope and Rationale
This review examines reliability as it applies to two text-classification review branches in which it is a first-order concern rather than a refinement. The pairing is not one of convenience. Both branches assign labels to text in settings where point accuracy is insufficient on its own: confidence or operating-point behavior matters, errors may have asymmetric consequences, and performance must remain meaningful beyond the conditions represented in development data. What makes reliability difficult, however, differs between them, and the two developed around different parts of the reliability toolkit described in Section 1.3. Emotion and sentiment research drew on the calibration and uncertainty lineage, in which the object of study is the quality of a probability. Detection research drew on thresholding and robustness testing, in which the object of study is the behavior of a decision boundary under shifted or adversarial input. Two literatures that face a common problem structure with largely distinct methodological inheritances are precisely the configuration in which comparison is informative. A technique standard in one and absent from the other is often absent for reasons of research tradition rather than of principle.
Branch 1 covers reliability in emotion classification, emotion regression, and sentiment analysis, where subjective and frequently imbalanced label spaces make the quality of a model’s confidence difficult to establish. Branch 2 covers reliability in the analysis and detection of AI-generated or machine-generated text, where false-positive control, threshold selection, and generalization to generators, domains, and languages unseen during development determine whether a detector can responsibly be used at all. These two review branches form the top level of the review’s structure. Beneath them, the Task Category dimension of the taxonomy assigns each included study to exactly one of three mutually exclusive task categories: Emotion Classification and Sentiment Analysis, which together make up Branch 1, and AI-Generated Text Detection, which makes up Branch 2. Each study is assigned according to its primary task, so a secondary component, such as emotion regression within a study whose primary task is emotion classification, does not create a separate category. Throughout, “review branch” refers to the two broader groupings and “task category” to the three mutually exclusive categories.
Reviews of the individual components of reliability are well developed. Classifier calibration has been surveyed comprehensively, covering proper scoring rules, post-hoc methods, and evaluation practice [41], and uncertainty in deep neural networks has received comparable treatment [42]. On the task side, sentiment analysis [43,44] and text-based emotion detection [45] have both been reviewed at length, and the detection of machine-generated text has been surveyed from methodological, threat-model, and dataset perspectives [46,47,48]. These literatures are, however, largely disjoint. Calibration surveys are organized by technique and do not treat a detection threshold as a calibration problem. Detection surveys enumerate detectors, datasets, and evaluation practice, and recent reviews discuss reliability-related concerns such as robustness and generalization [48], but they rarely ask whether detector confidence is calibrated or treat reliability as the organizing axis. Task surveys of sentiment and emotion treat reliability, where they treat it at all, as one desideratum among several rather than as the organizing axis.
A second and more consequential problem is conceptual conflation. Because accuracy, precision, recall, F1, and AUROC are the metrics most readily available, they are frequently presented as evidence that a system is reliable. As Section 1.2 sets out, these metrics measure discriminative performance and are silent on confidence quality, coverage behavior, and stability under shift. The consequence is a body of work in which reliability claims and reliability evidence are not consistently aligned, and in which the misalignment is difficult to detect precisely because the two are reported together.
The framework adopted here responds directly to that misalignment by characterizing every included study along five dimensions. Task Category records what is being classified; Model Type records the modeling context; Reliability Approaches records how reliability is addressed; Reliability Evaluation Evidence records how the reliability claim is demonstrated; and Reliability Validation records the conditions under which that evidence is tested. Dataset language is recorded separately. Holding these dimensions apart makes a central distinction visible: using a reliability-oriented mechanism is not the same as supplying evidence that demonstrates the claimed reliability property, and evidence obtained only in distribution does not automatically establish reliability under shift. Figure 2 presents the same logic as a reliability-aware decision pipeline, from input and model output through reliability mechanism and evidence to the decision of whether an output is sufficiently reliable for use.
The second contribution follows from applying the same five-dimensional framework to all three task categories. Because application, model context, reliability mechanism, evidence, and validation are recorded consistently, emotion classification, sentiment analysis, and AI-generated text detection become directly comparable despite their different vocabularies and evaluation traditions. The contribution is therefore one of comparative synthesis and conceptual organization: the underlying reliability concerns exist across the literatures, but the five-dimensional taxonomy makes their similarities, asymmetries, and missing links explicit.
The third contribution concerns how unresolved problems are identified. Rather than asserting open problems on the reviewers’ authority, the review extracts the limitations and future directions stated by the authors of the included studies, grouped along the dimensions on which those studies were characterized: data, method, evaluation, generalizability, and deployment. Author-stated observations are distinguished from reviewer inference throughout, so that the resulting research agenda can be traced to its source.
1.5. Research Questions
The review is guided by the following seven research questions:
- RQ1. How has the volume of reliability research across the three task categories developed over time?
- RQ2. Which task categories, dataset languages, and Model Types are represented in the reliability evidence base?
- RQ3. Which Reliability Approaches are used to improve, estimate, or operationalize reliability?
- RQ4. Which forms of Reliability Evaluation Evidence are reported, and how do they align with the reliability claims being made?
- RQ5. Under which Reliability Validation conditions are reliability claims tested, including in-distribution, cross-domain, adversarial, cross-generator, and cross-lingual settings?
- RQ6. How do Model Type, Reliability Approaches, Reliability Evaluation Evidence, and Reliability Validation differ across the three task categories and interact with one another?
- RQ7. What limitations, research gaps, and future opportunities remain?
2. Methods
2.1. Design
This systematic review is reported in accordance with the Preferred Reporting Items for Systematic Reviews and Meta-Analyses (PRISMA) 2020 guidelines [49]. The completed PRISMA 2020 checklist is provided in Supplementary File 1. This review was not prospectively registered, and no separate protocol was published.
2.2. Search Strategy
Seven major electronic databases were searched for relevant studies: ScienceDirect, Scopus, Web of Science, ACM Digital Library, IEEE Xplore, Compendex, and PubMed. A supplementary search was also conducted using Google Scholar, with results retrieved and exported through Publish or Perish. For Google Scholar, the two core strategies were adapted into separate searches, and up to the first 100 results of each search were exported (428 records in total; Figure 3). Final searches were conducted on July 12, 2026 (ACM Digital Library, Compendex, and IEEE Xplore); July 17, 2026 (PubMed, ScienceDirect, Scopus, and Web of Science); and July 18, 2026 (Google Scholar).
The two review branches use different terminology. Separate core search strategies were therefore developed for each branch, combining task-related and reliability-related keyword sets with Boolean operators. For Branch 1, covering emotion classification and sentiment analysis, task-related terms included “emotion classification,” “emotion recognition,” “emotion detection,” “sentiment classification,” and “sentiment analysis.” Reliability-related terms included “confidence calibration,” “uncertainty estimation,” “uncertainty quantification,” “confidence estimation,” “selective prediction,” “abstention,” “reliability,” and “trustworthiness.”
For Branch 2, covering the analysis and detection of AI-generated text, task-related terms included “AI-generated text,” “machine-generated text,” “LLM-generated text,” and “ChatGPT-generated text.” The Branch 2 reliability keyword set was the same as the Branch 1 set with two differences: “confidence estimation” was not included, and “false positive” and “false negative” were added to capture reliability concerns specific to detection systems. Both core strategies are shown in Table 1.
Table 1 presents the two core search strategies that guided the searches. In each source, the terms, syntax, and query structure were adapted to that source’s search interface and query conventions. The eligibility criteria were English language, publication from 2016 through July 2026, and journal articles or conference proceedings; retrieved records were checked against these criteria during screening.The number of records returned by each source is reported in Section 3.1 and Figure 3.
2.3. Eligibility Criteria and Study Selection
The inclusion criteria for this systematic review were as follows: studies (1) published in English; (2) published from January 2016 through July 2026; (3) published in peer-reviewed journals or conference proceedings; (4) using natural-language text as the input modality; (5) addressing a task within Branch 1 (emotion classification, emotion regression, or sentiment analysis) or Branch 2 (analysis or detection of AI-generated text); and (6) making a reliability-related methodological contribution or reporting a systematic reliability evaluation, supported by quantitative evidence about classifier reliability. Criterion (6) was applied as a requirement for quantitative reliability evidence rather than for a dataset-level experiment specifically. Fifty of the 51 included studies satisfy it through empirical evaluation on at least one dataset. One study satisfies it instead through a quantitative diagnostic-accuracy analysis of reported detector error rates at realistic prevalence, and was retained because it evaluates detection reliability systematically and quantitatively rather than narratively. In the finalized coding, that study is assigned to In-Distribution Only on the validation dimension defined below, and it is therefore retained in the denominator wherever proportions on that dimension are reported.
Studies were excluded if they (1) did not include calibration, uncertainty estimation, selective prediction, or another systematic reliability-related method or evaluation; (2) used multimodal or non-text input; (3) were preprints, dissertations or theses, reviews, surveys, or other ineligible publication types; or (4) addressed a task or domain outside the scope of the review, including non-NLP or unrelated text-classification tasks.
Records retrieved from all sources were deduplicated before screening. Duplicate records were identified and removed in Microsoft Excel by filtering the combined records and manually checking repeated entries. Title and abstract screening then applied a two-condition rule: the record had to address a task within one of the two review branches, and it had to indicate a reliability-related methodological contribution or a systematic reliability evaluation. Both conditions had to be met. Records satisfying both conditions, together with records whose eligibility could not be determined from the title and abstract alone, were carried forward to full-text assessment and evaluated against the criteria above. Each excluded full-text report was assigned a single primary reason for exclusion, and the resulting counts are reported in Section 3.1.
Full-text reports meeting the eligibility criteria were additionally checked for the internal consistency and interpretability of the reported data and results. Reported counts, totals, and metric values were checked for internal agreement across the text, tables, and figures of each report. This check assessed only whether the reported data could be interpreted and extracted reliably; no formal risk-of-bias or quality-appraisal instrument was applied, and this check is not equivalent to, and is not reported as a substitute for, such an appraisal.
2.4. Data Extraction, Coding, and Synthesis
Data were extracted from the included studies into a structured extraction workbook using a predefined set of fields. Bibliographic fields included reference, publication year, and publication type, with dataset or text language recorded separately.
The taxonomy contains five dimensions: Task Category, Model Type, Reliability Approaches, Reliability Evaluation Evidence, and Reliability Validation. These five dimensions are held apart and are not interchangeable. Task Category is mutually exclusive and assigns each study to one primary task category: Emotion Classification, Sentiment Analysis, or AI-Generated Text Detection. The other four dimensions are multi-value because a study may compare multiple model types, use more than one reliability approach, report multiple forms of reliability evidence, or validate under several conditions. All 51 included studies were coded on each dimension, and the resulting study-level assignments are reported in Supplementary Tables S1–S8.
Reliability Approaches is the mechanism axis and contains six categories: Calibration, Uncertainty Estimation, Selective Prediction, Distance and Representation Methods, Consistency and Agreement Methods, and Statistical and Likelihood Methods. Calibration is assigned only where a study explicitly applies or optimizes a calibration method. Selective Prediction is assigned only where the system can abstain, reject, defer, or return a set-valued prediction; ordinary decision-threshold or operating-point tuning that still forces a class decision is treated as an implementation detail rather than as Selective Prediction. Reliability Evaluation Evidence is coded separately in four categories: Error-Rate and Operating-Point Evidence, Calibration Evidence, Selective Prediction and Coverage Evidence, and Uncertainty Evidence. This separation allows a study to use one reliability approach while demonstrating it with a different form of evidence, or to report reliability evidence without proposing a dedicated reliability approach. Because the evidence dimension records what a study reports rather than what a method formally guarantees, a formal coverage guarantee is coded as Selective Prediction and Coverage Evidence only where empirical coverage, prediction-set size, or an equivalent coverage quantity is actually reported; a guarantee reported solely through detector operating points is coded as Error-Rate and Operating-Point Evidence.
Reliability Validation records the testing conditions under which each study’s reliability evidence was produced. Five retained categories are used: In-Distribution Only; Out-of-Distribution Validation; Adversarial and Perturbation Validation; Cross-Generator Generalization; and Cross-Lingual. These categories are non-mutually exclusive except that In-Distribution Only denotes studies for which no validation beyond standard testing was documented. A model- or version-shift category was considered during coding but is not retained in the taxonomy because no included study directly performed longitudinal validation across model or tool versions; its absence is instead treated as a research gap.
The categories were derived iteratively from the included studies and then audited for conceptual consistency. The final codebook, with category definitions, decision rules for borderline cases, and exclusion examples, is provided in Appendix A (Table A1). During derivation, the operational definitions were narrowed where categories overlapped: ordinary threshold or operating-point tuning was excluded from Selective Prediction, Calibration was restricted to interventions that explicitly target confidence or probability calibration, and a candidate model- or version-shift validation category was not retained. The finalized definitions were applied to all 51 included studies. The included studies were synthesized narratively. In addition, the Discussion (Section 4) cites thirteen sources outside the 51 included studies [98]–[110] as a nonsystematic contextual synthesis. These sources were identified through exploratory Google Scholar searches conducted while the Discussion was being drafted, separately from the systematic Google Scholar search reported in Section 2.2 and Figure 3. One of them [110] concerns medical image classification rather than text. They were not screened against the eligibility criteria, were not coded in the taxonomy, and are not counted among the 51 included studies. No meta-analysis was performed because the corpus spans heterogeneous tasks, datasets, model types, reliability mechanisms, and validation protocols with no common effect measure. Accuracy, precision, recall, F1, AUROC, and AUCPR were retained as predictive-performance metrics but were analyzed separately from the four Reliability Evaluation Evidence categories because they do not, by themselves, establish confidence quality, selective behavior, or reliability under shift. Task Category, publication year, and publication type are counted exclusively; Model Type, Reliability Approaches, Reliability Evaluation Evidence, Reliability Validation, and language may be multi-value where applicable, so category totals on those dimensions may exceed 51.
Screening, eligibility assessment, data extraction, and taxonomy coding were conducted by one reviewer. To check coding consistency, the same reviewer independently re-examined the assignments across all five taxonomy dimensions for 10 included studies in two subsequent passes. The assignments matched the original coding in both passes for all 10 studies (100% within-reviewer agreement). No second reviewer participated, so inter-rater agreement was not calculated.
No formal reporting-bias assessment or certainty-of-evidence framework was applied. Because the review synthesized a heterogeneous methodological corpus without a common effect measure or pooled estimate, quantitative procedures for assessing small-study or publication bias were not undertaken. The certainty of the synthesized findings was not formally graded, and the reported patterns should therefore be interpreted as descriptive of the included corpus.
3. Results
This section reports the outcomes of the search and selection process, characterizes the included studies, and presents the five-dimensional taxonomy used to organize them across the three task categories.
3.1. PRISMA Process
Bibliographic records were retrieved from seven electronic databases: ScienceDirect, Scopus, Web of Science, ACM Digital Library, IEEE Xplore, Compendex, and PubMed. These searches returned 1,369 records in total. The distribution across sources was very uneven. ScienceDirect alone accounted for 919 records, followed by Scopus (182), Web of Science (118), ACM Digital Library (59), IEEE Xplore (44), Compendex (31), and PubMed (16). A supplementary Google Scholar search, executed and exported using Publish or Perish, yielded a further 428 records, bringing the total number of identified records to 1,797.
Records were deduplicated, which removed 503 duplicates and left 1,294 unique records for title/abstract screening. At this stage 830 records were excluded, leaving 464 full-text reports assessed for eligibility. Of these, 413 were excluded and 51 were included in the review. The single largest reason for full-text exclusion was the absence of any calibration, uncertainty, selective-prediction, or systematic reliability evaluation (145 reports). The remaining reasons were wrong modality, that is, multimodal rather than text-only NLP (135); wrong publication type (66); and wrong task or domain (67). These four categories account for all 413 full-text exclusions. These exclusion categories reflect the eligibility criteria defined in Section 2.3. The selection path from identification to inclusion is shown in Figure 3.
3.2. Overview of the Included Studies
The included studies span publication years 2019 to 2026. Output is minimal through the first four years: two studies in 2019, two in 2020, one in 2021, and three in 2022. Output then rises sharply, with nine studies in 2023, four in 2024, and eighteen in 2025, the peak year. A further twelve appeared in January–July 2026. Forty-three of the 51 included studies were published in 2023 or later. Because the final search was executed in July 2026, the 2026 count represents a partial year. The temporal distribution of the included studies is shown in Figure 4.
Review branch and publication type are both exclusive variables. The branch split follows directly from the task-dimension counts in Section 3.3: 23 studies fall in Branch 1 (Emotion and Sentiment) and 28 in Branch 2 (AI-Generated Text). Publication type is close to evenly divided, with 27 conference papers and 24 journal articles.
Dataset or text language is reported separately and is grouped into four categories in Figure 5. English is overwhelmingly dominant, appearing in 48 of the 51 included studies. Chinese appears in three studies and explicitly multilingual corpora in two, while 11 other individual-language assignments each occur once. The distribution is counted non-exclusively, so a multilingual study may contribute to more than one language category.
3.3. Taxonomy of the Included Studies
The 51 included studies are characterized using the five-dimensional taxonomy shown in Figure 6. The dimensions are ordered as an analytical sequence. Task Category identifies what is being classified. Model Type identifies the modeling context. Reliability Approaches records how reliability is addressed. Reliability Evaluation Evidence records how the reliability claim is demonstrated. Reliability Validation records the conditions under which that evidence is tested. Task Category is mutually exclusive, while the remaining four dimensions are non-mutually exclusive. This structure allows the corpus to be read both within each dimension and across dimensions in the Discussion. The corresponding study-level taxonomy assignments are reported in Supplementary Table S1–S8 (Supplementary File 2).
Task Category partitions the corpus into 28 AI-Generated Text Detection studies, 15 Sentiment Analysis studies, and 8 Emotion Classification studies. Model Type is multi-label. Encoder-Based PLMs are the most common category at 35 studies, followed by Decoder-Based LLM at 25 and Other Deep-Learning Architectures at 18. Proprietary or Unspecified Models appear in 11 studies, Traditional Machine Learning in 7, and Hybrid or Multiple Model Types in 5. These counts describe model usage rather than mutually exclusive generations of models, so a study may contribute to more than one Model Type category.
The Reliability Approaches dimension contains six non-mutually exclusive categories. Uncertainty Estimation is the largest at 15 studies. Selective Prediction appears in 9 studies, Calibration in 7, Distance and Representation Methods in 7, Statistical and Likelihood Methods in 5, and Consistency and Agreement Methods in 3. The finalized coding deliberately excludes ordinary threshold or operating-point tuning from Selective Prediction unless the system can abstain, reject, defer, or return a set-valued output, and it restricts Calibration to interventions that explicitly target confidence or probability calibration. Some studies therefore contribute reliability evaluation or validation evidence without receiving a Reliability Approach assignment. Seventeen of the 51 included studies receive no Reliability Approach assignment, 15 of them in AI-generated text detection.
Reliability Evaluation Evidence is grouped into four non-mutually exclusive categories. Error-Rate and Operating-Point Evidence appears in 19 studies, Calibration Evidence in 14, Selective Prediction and Coverage Evidence in 10, and Uncertainty Evidence in 9. Reliability Validation shows a similarly broad but uneven distribution: Out-of-Distribution Validation appears in 24 studies, Adversarial and Perturbation Validation in 21, Cross-Generator Generalization in 20, and Cross-Lingual validation in 4. Eighteen studies are classified as In-Distribution Only. No included study directly evaluates reliability longitudinally across successive model or tool versions, so model/version shift is treated as a research gap rather than displayed as a zero-count taxonomy category.
Reading Figure 6 from left to right separates five questions that are often conflated in reliability research: what is being classified, what type of model is involved, what reliability mechanism is used, what evidence is reported, and under what conditions that evidence is validated. The distinction is especially important between Reliability Approaches and Reliability Evaluation Evidence. A technically sophisticated reliability mechanism does not automatically imply that the study reports evidence capable of demonstrating the property the mechanism is intended to improve.
Reliability Approaches Across Task Categories
The distribution of Reliability Approaches across the three task categories is shown in Figure 7. Under the operational coding definition used in this systematic review, Uncertainty Estimation is concentrated entirely in Branch 1, with 12 sentiment and 3 emotion studies and no AI-generated-text study. Selective Prediction also concentrates in Branch 1, with 5 emotion, 3 sentiment, and 1 AI-generated-text study. Calibration is the most balanced approach across branches, with 3 emotion, 2 sentiment, and 2 AI-generated-text studies. Distance and Representation Methods appear in 3 sentiment and 4 AI-generated-text studies. Consistency and Agreement Methods appear in 1 emotion and 2 AI-generated-text studies. All 5 Statistical and Likelihood Methods studies occur in AI-generated text detection. These task-level distributions explain why marginal approach counts alone do not capture how differently the three task categories operationalize reliability.
The six Reliability Approach categories sum to 46 assignments, not 51 studies, because approach coding is non-exclusive and because some studies evaluate reliability without proposing or applying a mechanism that meets one of the six approach definitions. This is intentional: evaluation or stress testing is not treated as a seventh Reliability Approach, and ordinary thresholding is not promoted to an approach category solely because it sets an operating point.
Reliability Evaluation Evidence and Validation
Reliability-specific evidence is analyzed separately from predictive performance. Error-Rate and Operating-Point Evidence is the largest category at 19 studies, followed by Calibration Evidence at 14, Selective Prediction and Coverage Evidence at 10, and Uncertainty Evidence at 9. Predictive-performance metrics remain common across the corpus, but they are not treated as substitutes for these evidence categories. The Discussion examines where the evidence reported is narrower than the reliability claim being made.
Validation conditions determine how far the reported reliability evidence can reasonably generalize. Out-of-Distribution Validation is reported in 24 studies, Adversarial and Perturbation Validation in 21, Cross-Generator Generalization in 20, and Cross-Lingual validation in 4. Eighteen studies document only In-Distribution testing. Because validation categories are non-exclusive, a study may contribute to several of these counts, for example by testing both adversarial perturbations and unseen generators.
Accuracy remains the most frequently reported predictive-performance metric in the corpus, appearing in 33 of 51 studies, followed by F1 (23), AUROC (17), and precision and recall (16 each). These metrics are retained for context but are interpreted separately from reliability-specific evidence because a model can preserve ranking or classification performance while its confidence, selective behavior, or robustness under shift remains poorly characterized.
The values plotted in Figure 7 are non-exclusive task-category-by-approach assignments. Calibration has 3 emotion, 2 sentiment, and 2 AI-generated-text assignments. Uncertainty Estimation has 3 emotion and 12 sentiment assignments and no AI-generated-text assignment. Selective Prediction has 5 emotion, 3 sentiment, and 1 AI-generated-text assignment. Distance and Representation Methods have 3 sentiment and 4 AI-generated-text assignments. Consistency and Agreement Methods have 1 emotion and 2 AI-generated-text assignments. Statistical and Likelihood Methods have 5 AI-generated-text assignments and none in the other task categories.
4. Discussion
This section interprets the evidence reported in Section 3 rather than restating it. The discussion follows the five-dimensional taxonomy shown in Figure 6 in the same conceptual sequence used to characterize the corpus: Task Category, Model Type, Reliability Approaches, Reliability Evaluation Evidence, and Reliability Validation. Each dimensional subsection first introduces the dimension and then examines the categories it contains, using the included studies as the evidentiary basis for comparison and interpretation. Counts and distributions are cited only where an interpretation depends on them, and all counts cited here are drawn from the completed extraction of all 51 included studies.
The five dimensions form a connected analytical sequence rather than five independent descriptions. Task Category identifies what is being classified; Model Type identifies the modeling context; Reliability Approaches captures how reliability is addressed; Reliability Evaluation Evidence records how the resulting reliability claim is demonstrated; and Reliability Validation records the conditions under which that evidence is tested. Read this way, Figure 6 links the application, model, approach, evidence, and validation stages needed to judge whether a reliability claim is sufficiently supported.
Two features of the corpus condition everything that follows. First, 43 of the 51 included studies were published in 2023 or later, coinciding with the widespread adoption of large language models and a marked increase in attention to reliability. Second, Task Category is mutually exclusive, whereas the remaining four taxonomy dimensions are non-mutually exclusive, so their category counts may exceed 51. Section 4.1 to 4.5 examine the five dimensions and their constituent categories in sequence, and Section 4.6 reads them against one another to identify the cross-dimensional patterns that are most informative for the review. Study-level assignments underlying this synthesis are reported in Supplementary Tables S1–S8. Where the Discussion cites work outside the 51 included studies [98]–[110], that material is a nonsystematic contextual synthesis, identified as described in Section 2.4. It is used only to situate the review’s findings and is not part of the review’s evidence base.
4.1. Task Category
Task Category records what each included study is classifying, and it is the one dimension of the taxonomy on which every study holds a single value. Each study is assigned to the task category that names its primary object of study, read from its stated objective, its primary classification task, and the experiment on which its central claim rests, so the three categories partition the corpus rather than overlapping it. AI-generated text detection accounts for 28 of the 51 included studies, sentiment analysis for 15, and emotion classification for 8. The study-level task category assignments are provided in Supplementary Table S1. The imbalance in volume is the least informative property of that distribution. What matters is that the three task categories do not pose the same reliability question, and that the difference between them follows from what kind of object the target label is. This concern generalizes beyond the review corpus. Outside the review corpus, work on multi-label text classification for risk-sensitive systems has argued that a single aggregate confidence metric is inadequate once multiple labels and asymmetric error consequences are both in play [98]. This reinforces why category-specific reliability questions cannot be collapsed into one metric.
AI-Generated Text Detection
AI-generated text detection begins from a provenance label rather than a human judgment about affect. Reliability therefore centers less on annotator disagreement and more on the consequences of a wrong operating decision. False-positive behavior is a central concern because a human-authored text can be flagged as machine generated even when aggregate accuracy appears acceptable. The included studies show substantial variation across systems. [50] reports false-positive rates from 15.6% to 30.6% across five commercial tools, and [51] flags up to 8.6% of known-human abstracts. [52] reports a tool with 0.00% false positives, and [53] reports a false-positive rate of 1% (0.01 as a proportion). Other audits and detector studies reinforce the same point under different conditions [4,17,18,54,55]. The defensible conclusion is therefore not that detection is uniformly unreliable, but that reliability cannot be inferred from a headline aggregate score.
The operating point is consequently part of the reliability claim in this branch. Threshold choice determines the balance between false accusations and missed detections, and several studies treat the operating point explicitly: through distribution-free conformal control of the false-positive rate [61]; through likelihood-ratio or watermark decision rules [57,62,63]; and through representation- or distance-based scores read at a chosen operating point [56,58,59,60]. Generalization is equally central because the detector must confront paraphrases, changing domains, languages, and generators that may not have appeared during development. Stress-testing and benchmark studies document these exposures directly, including statistical stress tests [66], consistency- and calibration-based robustness detectors [67,68], and further detection studies evaluated across domains, generators, and perturbations [64,65,69,70,71,72]. Equity concerns emerge when the resulting false positives fall unevenly across author groups, with non-native writing examined explicitly in [52,58,73]. The specific mechanisms and validation protocols underlying these findings are examined in Section 4.3 and Section 4.5.
Looking at individual detector studies more closely, the central issue is not a single failure mode but instability across deployment conditions. [58] reports a supervised detector with 0.99 in-domain accuracy falling to 0.39–0.69 off-domain, while [64] finds that strong detectors weaken once domain, generator, and attack conditions are made more realistic. Paraphrase is a particularly revealing case: [59] shows that paraphrasing can evade detectors and proposes retrieval as a defense, whereas [66] stress-tests detectors under multiple attacks and reports increasing detection difficulty as generators are trained to mimic a target distribution. Not all evidence is negative. [61] uses multiscaled conformal prediction to place a distribution-free bound on false positives, demonstrating that reliability can be operationalized as an explicit error-control guarantee rather than only measured after failure. Taken together, these studies suggest that the strongest detection work is moving from asking only whether a detector performs well to specifying when its errors are controlled, under which shifts, and with what guarantees.
Sentiment Analysis
Sentiment analysis accounts for 15 studies and generally works with a coarser, polarity-oriented, and often ordinal label structure. Reliability in this task category is primarily a question about whether confidence and uncertainty are meaningful when the target is a human judgment rather than an objective fact. The included sentiment studies use sentiment mainly as a surface for broader reliability machinery: calibration [75,84]; Bayesian, dropout, ensemble, and related uncertainty estimation [74,77,78,79,80,83,85,87]; distance-based confidence [76]; selective prediction and abstention [81,82]; black-box uncertainty estimation [88]; and one further study reporting both calibration and uncertainty evidence [86]. This pattern suggests that sentiment analysis frequently functions as an evaluation surface for reliability machinery intended to generalize beyond a single task, with the task category assignments given in Supplementary Tables S1 and the corresponding Reliability Approach assignments in Supplementary Table S2–S7.
That methodological role does not make the reliability problem trivial. Calibration is computed against observed labels and therefore inherits whatever subjectivity or disagreement those labels contain. The recurring questions are whether a stated confidence corresponds to empirical correctness, whether uncertainty reflects the model’s own ignorance or ambiguity inherent in the data, and whether the signal remains informative after a domain change. Studies such as [78,83,85,88] examine uncertainty from different angles, while [75,76,79,84] illustrate how calibration or representation-based confidence can be adjusted rather than accepted at face value. These results motivate the more detailed approach-level discussion in Section 4.3.
Paper-level evidence also shows that reliability in sentiment analysis is not reducible to calibration alone. [84] reports strong predictive accuracy alongside poor calibration, illustrating that a classifier can be correct often while still assigning misleading confidence. [85] approaches the problem from an uncertainty perspective by benchmarking several uncertainty approximations with ECE, NLL, and Brier score rather than relying on accuracy alone, while [88] demonstrates uncertainty estimation for black-box sentiment classification where model internals are unavailable. Other studies broaden the reliability question beyond a single test distribution or a forced prediction: [75] uses nearest-neighbor information to enhance cross-lingual confidence calibration, and [81] treats abstention as an explicit decision option. Together, these studies show several complementary ways of asking whether sentiment-model confidence is actionable, but they also expose a broader limitation of the corpus: direct comparisons among competing reliability strategies under a common protocol remain uncommon.
Emotion Classification
Emotion classification accounts for 8 studies and shares the same broad confidence problem as sentiment analysis, but the label space is typically finer, more subjective, and more frequently multi-class or multi-label. The emotion studies make that distinction visible in different ways: annotator conflict and label ambiguity [90,95]; class-conditional coverage through conformal prediction [91,93]; confidence scoring and calibration [89,94,96]; and consistency under counterfactual perturbation [92]. [95], for example, finds that predictive uncertainty tracks annotator entropy only weakly while an oracle reference remains above every estimator tested, indicating that annotator disagreement is not a fixed ceiling on achievable confidence quality. Some studies represent disagreement in the output through distributional labels, prediction sets, or explicit conflict modeling [90,91,93,95], whereas others seek better-behaved confidence through confidence scoring or calibration-oriented methods [89,94,96].
Class imbalance compounds that ambiguity because a strong aggregate result can conceal poor reliability for minority emotions. [91] reports per-class accuracy falling from 0.83 on a majority neutral class to 0.03 on a minority emotion within a single corpus, and [94] identifies raw softmax scores as biased toward majority classes. An aggregate calibration figure therefore cannot distinguish a well-calibrated majority class from a badly miscalibrated minority one. The contrast with [74], which names imbalance while reporting no class-wise reliability evidence, also illustrates a recurring distinction in this review: holding a reliability concern is not the same as evidencing it.
Task-Category Synthesis
Read together, the three task categories ask one overarching question: whether the output of a classifier can be trusted. Sentiment analysis and emotion classification primarily operationalize trust through the meaning of confidence and uncertainty in subjective and potentially imbalanced label spaces. AI-generated text detection primarily operationalizes trust through error behavior at a chosen operating point and through whether that behavior survives changes in generator, domain, language, or input form. The branches differ in their center of gravity rather than in holding completely disjoint concerns: calibration error appears in detection [68,97], and out-of-distribution behavior appears on the sentiment and emotion side [87,88,89]. What each branch can do about those concerns depends in part on the models it works with, which is the focus of Section 4.2. Table 2 summarizes the key findings for each task category.
4.2. Model Type
Model Type records the class of model each study works with and is counted non-exclusively because a study may compare or combine more than one type. Encoder-Based PLMs are the most common, appearing in 35 studies, followed by Decoder-Based LLMs in 25 and Other Deep-Learning Architectures in 18. Proprietary or Unspecified Models appear in 11 studies, Hybrid or Multiple Model Types in 5, and Traditional Machine Learning in 7. The counts are descriptive; the more important question is how model type shapes access to logits, internal representations, training procedures, stochastic inference, and model weights, and therefore which reliability approaches can realistically be applied. Paper-level Model Type assignments are reported in Supplementary Table S8.
Encoder-Based PLMs
Encoder-based PLMs provide the broadest substrate for the reliability machinery represented in the corpus. They appear across all three task categories and support fine-tuning, access to logits and hidden representations, and repeated inference, spanning calibration [68,75,90], uncertainty estimation [95], selective prediction [81], and representation- or distance-based confidence [58,60,76], together with encoder-based detector auditing reported through false-positive evidence [51]. Their prevalence therefore matters for more than model popularity: it gives researchers the degree of access needed to intervene at training time, inspect representation spaces, or estimate uncertainty from repeated model behavior.
Decoder-Based LLMs
Decoder-based LLMs appear in 25 studies and are concentrated in AI-generated text detection, although they also occur in the sentiment and emotion categories (Supplementary Table S8). Their role is more complicated than that of encoders. Outside detection, a decoder LLM is itself the classifier being assessed, as in a conformal prediction study in emotion classification [93]. Within detection it is more often the generator whose output another system must judge, and studies engage that output in different ways: through likelihood, watermark, or statistical detection signals [57,62,63,66,73]; through retrieval-based and conformal error-control defenses [59,61]; through detectors evaluated under adversarial or back-translation conditions [69,72]; and through detection-tool audits applied to decoder-generated text [50,54]. This shifting role changes the reliability environment rather than merely increasing model scale: the population of models that creates the classification problem is itself evolving, which directly motivates cross-generator and version-sensitive validation.
Other Deep-Learning Architectures
Other Deep-Learning Architectures appear in 18 studies and record neural architectures not captured by the encoder/decoder transformer categories, including recurrent, convolutional, and other non-transformer neural components. Because Model Type is non-mutually exclusive, a study may be coded here while also using an encoder or decoder model in the same experiment. These studies occur on both sides of the review and integrate reliability mechanisms into training, architecture, or repeated inference in several distinct ways: uncertainty estimation in a non-transformer architecture [77]; variational Bayesian modeling [83]; self-ensembling and dropout-based uncertainty [79,80,81]; ensemble-based and label-distribution methods [84,85]; contrastive detection with score calibration [68]; and a post-hoc heteroscedastic wrapper for black-box outputs [88]. Their importance is that training-time interventions, stochastic uncertainty estimation, and architecture-level reliability mechanisms generally require more model access than output-only auditing.
Proprietary or Unspecified Models
The Proprietary or Unspecified Models category contains 11 studies and requires cautious interpretation because it includes both genuinely proprietary systems and studies for which the underlying model type is not specified sufficiently for a more precise assignment. Access constraints should therefore be inferred only where a model is known to be proprietary or externally controlled. In those cases, researchers may be unable to retrain the model, inspect internal representations, reproduce historical versions, or change the architecture, which shifts evaluation toward what can be inferred from outputs. This category is dominated by detection: detection-tool audits [4,50,52,54], a diagnostic-accuracy analysis [17], and further detection studies whose model type is unspecified or externally controlled [18,55,59,60,72]. The one non-detection case is a black-box sentiment study that estimates uncertainty without model internals [88]. This is particularly consequential for commercial detector audits, where a measured configuration can change without notice. External work outside the review corpus shows that this constraint is not absolute: conformal prediction can be adapted to API-only large language models that expose no logits, using sample-frequency and semantic-similarity signals in place of internal probabilities to retain a distribution-free coverage guarantee [99]. This suggests that output-only access narrows, rather than eliminates, the space of reliability procedures available under proprietary deployment.
Hybrid or Multiple Model Types
Hybrid or Multiple Model Types appear in 5 studies [73,74,80,86,96]. These studies combine or compare model types rather than treating a single architecture as the sole object of analysis. The small count does not support a broad generalization, but it is analytically useful because mixed-model designs can separate a reliability effect that is robust across architectures from one that depends on a particular model class. They also show that the taxonomy should be read non-exclusively: a study can contribute to both a specific model category and the hybrid-or-multiple-model category.
Traditional Machine Learning
Traditional Machine Learning remains present in 7 studies, in every case alongside at least one additional Model Type rather than as the sole model, typically as a feature-based or statistical baseline or comparator [55,56,58,72,74,94,96] (Supplementary Table S8). Its continued use is especially relevant where reliability is tied to an explicit decision boundary, hand-engineered or statistical features, or a comparison against neural baselines. Simpler models can make the operating point easier to inspect and manipulate, but they do not remove the need for reliability-specific evidence; the same questions about calibration, false positives, and transfer remain.
Model-Access Synthesis
Across these categories, model access appears to constrain the reliability toolkit. Approaches requiring retraining, internal representations, or repeated stochastic forward passes are easiest to deploy when researchers control the model, whereas output-level procedures remain feasible with substantially less access. Conformal prediction is an instructive exception because it can operate from a score function and held-out calibration data without requiring access to a model’s internals; [61] demonstrates that this kind of guarantee-bearing procedure can be applied in detection. The Proprietary or Unspecified Models category must nevertheless be interpreted carefully because not every study in it is necessarily a closed commercial system. Overall, the corpus suggests that some cross-branch differences in reliability methodology reflect model-access conditions as well as differences in the reliability problem itself. With the modeling context established, Section 4.3 examines the Reliability Approaches actually applied. Table 3 summarizes the key findings for each Model Type.
4.3. Reliability Approaches
The Reliability Approaches dimension records how studies attempt to improve, estimate, or operationalize reliability. The taxonomy contains six non-mutually exclusive categories: Selective Prediction (9 studies), Calibration (7), Uncertainty Estimation (15), Distance and Representation Methods (7), Consistency and Agreement Methods (3), and Statistical and Likelihood Methods (5). Figure 7 shows that these approaches are distributed unevenly across the three task categories, indicating that the field does not draw on a single shared reliability toolkit. Study-level methods and associated reliability evidence for the six Reliability Approach families are summarized in Supplementary Tables S2–S7.
Two coding boundaries are important for interpreting this dimension. First, ordinary decision-threshold tuning or operating-point selection is treated as a technical implementation detail, not as Selective Prediction, unless the system can abstain, reject, defer, or return a set-valued prediction. Second, general robustness-oriented or reliability-aware training is not coded as Calibration unless the intervention explicitly targets the calibration of confidence or probability outputs. These boundaries keep the Reliability Approach categories focused on distinct reliability mechanisms rather than broad training or decision procedures.
Selective Prediction
Selective Prediction appears in 9 studies: 5 in emotion classification, 3 in sentiment analysis, and 1 in AI-generated text detection (Supplementary Table S4, which reports the task category and the study-level mechanism for each Selective Prediction study). The category is reserved for mechanisms that change whether or how a prediction is issued, including abstention, rejection, uncertainty-based deferral, and set-valued or conformal prediction. It deliberately excludes detector studies that merely adjust a forced binary decision threshold. The distinction matters because choosing where to place a decision boundary is not the same reliability act as allowing the system to withhold or hedge a prediction.
Within this category, conformal prediction provides the clearest formal control. [91,93] use conformal or class-conditional prediction sets in affective tasks, while [61] uses a held-out set of human-written texts to place a distribution-free bound on detector false positives. [81] provides the clearest explicit abstention example, and the remaining studies use uncertainty or confidence to identify predictions that should be flagged, rejected, or treated selectively [82,88,90,95,96]. The single detection study in this category, [61], is therefore an exception to the broader detection practice of tuning an operating point while still forcing a binary output. Outside the review corpus, a recent field-wide survey situates these applications within the broader landscape of conformal methods for NLP, confirming both the formal coverage guarantees the approach offers and the open methodological challenges that remain in applying it to language tasks specifically [100]. A further example outside the review corpus applies post-hoc temperature scaling to a BERT-based emotion classifier, abstains when the predictive entropy of the calibrated probabilities exceeds a threshold selected on validation data, and reports risk-coverage results on a held-out test set [109].
Calibration
Calibration appears in 7 studies, each explicitly applying or optimizing a calibration mechanism (Supplementary Table S2, which reports the task category and the calibration method for each Calibration study). These comprise temperature scaling or other score correction [68,90,96,97], nearest-neighbor-enhanced confidence calibration [75], calibrated distillation [89], and a calibration-targeted label-distribution learning objective [84]. The category therefore covers both post-hoc score correction and training objectives whose stated target is calibrated confidence, but it excludes general robustness or reliability-aware training that does not directly address calibration. Outside the review corpus, a study of six-way emotion classification on a class-balanced subset found that focal loss did not significantly change macro-F1 relative to balanced subsampling but significantly increased ECE for both a BiLSTM and a DistilBERT model, and that post-hoc temperature scaling removed most of that increase [108].
This category is distributed across all three task categories, with 3 emotion studies, 2 sentiment studies, and 2 AI-generated-text studies. This balance is analytically useful because it shows that calibration is not confined to subjective-label tasks, even though the operational meaning differs by task category. Its main limitation remains dependence on the data used to fit or validate the calibration procedure: a correction that behaves well in distribution is not automatically reliable after a change in domain, language, or generator. Section 4.5 returns to that question when the calibration studies are read against the validation settings in which they were tested.
Uncertainty Estimation
Uncertainty Estimation appears in 15 studies and is confined in this taxonomy to sentiment and emotion. Although [56] describes its framework as uncertainty-aware, it was not classified as Uncertainty Estimation because it does not derive or evaluate a predictive-uncertainty quantity under this review’s operational definition. Its operative reliability mechanism is representation-space routing with reference-sample retrieval and conditional threshold estimation; it was therefore coded as Distance and Representation Methods. The uncertainty machinery falls into three method families (Supplementary Table S3): MC dropout and variational Bayesian sampling [74,77,80,81,83,90]; deep ensembles and self-ensembling [79,84,85,95]; and evidential, interval, sparse-coding, entropy, and stochastic-attention or heteroscedastic variants [78,82,87,88,96]. The conceptual appeal is the possibility of separating uncertainty caused by ambiguity in the data from uncertainty caused by model ignorance, but that decomposition is reported by only a minority of the studies using uncertainty machinery. [83] is one of the clearest examples of explicit decomposition, while [78,85] are unusual in comparing several uncertainty approximations directly. Contextual literature outside the review corpus provides context for the observation that estimate quality also depends on data regime and language. A broad comparison across low-resource languages found that the quality of uncertainty estimates can, counterintuitively, worsen as more training data becomes available. It also found that data uncertainty can dominate model uncertainty in low-resource settings [104].
Ensemble-based uncertainty appears in five studies [78,79,84,85,95]. Disagreement across models provides a practical uncertainty signal without explicit Bayesian inference, but the cost scales with the number of members trained and served. The corpus therefore shows a recurring trade-off between uncertainty fidelity and computational burden, with self-ensembling or partial stochastic inference used in some studies to reduce that cost [79,80]. This trade-off is echoed outside the review corpus: work on Monte Carlo dropout for Transformer-based models has shown that comparatively inexpensive, single-model uncertainty estimates can still improve detection of error-prone predictions without the full cost of a multi-member ensemble [105].
Distance and Representation Methods
Distance and Representation Methods appear in 7 studies [56,58,59,60,75,76,79] (Supplementary Table S5). They derive a reliability signal from proximity to training examples, cached demonstrations, or a reference corpus rather than relying only on the model’s own probability. In Branch 1, [75,76,79] use neighborhood or representation-space information to rescale or complement confidence. In detection, [56,58,59,60] compare inputs against reference representations or retrieval-based signals. Their attraction is model-output independence; their limitation is that the reliability signal is only as stable as the representation space and reference set on which it is computed.
Consistency and Agreement Methods
Consistency and Agreement Methods are rare, appearing in only 3 studies [67,68,92] (Supplementary Table S6). They infer reliability from stability across agents, perturbations, denoising views, or related predictions. This captures a failure mode that ordinary softmax confidence cannot: a model can be highly confident and still reverse its decision after a small meaning-preserving change. The scarcity of this approach is notable given the strength of the perturbation evidence discussed in Section 4.5.
Statistical and Likelihood Methods
Statistical and Likelihood Methods appear in 5 studies and are confined to AI-generated text detection in the taxonomy [17,57,62,63,66] (Supplementary Table S7). Rather than estimating classifier confidence directly, they exploit statistical regularities, likelihood relationships, or detection statistics that are informative about text provenance. Their concentration in this branch reflects the structure of the detection problem itself: distributional properties of generated text can function as both the detection signal and the basis for a reliability-aware operating rule.
Approach-Level Synthesis
Read together, the six approaches trade off along at least three axes. Computational burden separates single-pass calibration or distance-based procedures from multi-pass Bayesian and ensemble methods. Model access separates mechanisms needing only output scores from those needing control over training, internal representations, or repeated forward passes. Evidence quality is the third axis: an approach can be technically sophisticated while still being evaluated with metrics too weak to demonstrate the reliability property it claims to improve. The taxonomy also makes an important negative distinction visible: threshold tuning and broad reliability-aware training may still be discussed as technical practices, but neither is automatically promoted to a Reliability Approach category. Figure 7 shows how the six retained approaches are distributed across the task categories. Table 4 summarizes the key findings for each approach.
4.4. Reliability Evaluation Evidence
The Reliability Evaluation Evidence dimension records how a reliability claim is demonstrated. The taxonomy groups reliability-specific evidence into four non-mutually exclusive categories: Error-Rate and Operating-Point Evidence (19 studies), Calibration Evidence (14), Selective Prediction and Coverage Evidence (10), and Uncertainty Evidence (9). Predictive-performance metrics such as accuracy, precision, recall, F1, AUROC, and AUCPR are retained in the manuscript but are treated separately because they do not, by themselves, establish confidence quality, coverage behavior, or reliability under shift. This distinction is central to the review: the approach describes what a study does about reliability, whereas the evidence determines what the study actually demonstrates. The complete study-level Reliability Evaluation Evidence assignments are provided in Supplementary Table S8. Throughout this article the 51 included studies are references [4,17,18], and [50]–[97]; all other references are background or contextual works outside the review corpus.
Error-Rate and Operating-Point Evidence
Error-Rate and Operating-Point Evidence is the largest reliability-specific evidence category, appearing in 19 studies. It includes evidence reported through false-positive rates, false-negative rates, false-accusation measures, true-positive rates at a fixed false-positive rate, or performance at another explicitly stated operating point. These measures capture asymmetric error costs and decision behavior that aggregate accuracy or AUROC can obscure. FPR is the most frequently reported named reliability metric in the corpus at 15 studies, and TPR at a fixed FPR appears in 10. Studies such as [57,58,59,61,62,66,71] report operating-point evidence directly, while [4,50,51,52,72] show how detector audits expose reliability through false-positive behavior. [54] is an instructive boundary case within this category: its finding is substantively about false accusations, and it is coded here as Error-Rate and Operating-Point Evidence because the false-positive behavior on human-authored text is reported directly. [18] is the converse case and is not coded in this category. Its finding is equally about false accusations, but the result is expressed through accuracy, precision, and recall rather than through a reliability-specific metric, so it is one of the nine studies coded with no reliability-specific evidence discussed below.
Calibration Evidence
Calibration Evidence appears in 14 studies and is concentrated most strongly in sentiment and emotion, although it also occurs in detection. ECE is the most frequently reported named calibration metric at 13 studies, with Brier score, MCE, ACE, NLL, and reliability diagrams used less often. [91] reports class-level calibration behavior, while [68,76,85,90,94] pair ECE-family measures with Brier score and [93] adds class-conditional evidence. The recurring limitation is aggregation: a single ECE value can conceal severe miscalibration for a minority class or a specific label. This limitation is not specific to the review corpus. Methodological work on class-wise conformal calibration shows that marginal coverage can hold in aggregate while minority-class coverage remains invalid. This is the same aggregation failure recast in a distribution-free rather than a calibration-error framing, and it motivates class-conditional reporting as a general remedy [102]. A related practice appears in medical image classification, which lies outside the text-focused scope of this review: a cervical cytology study included worst-class ECE alongside aggregate ECE in the composite ranking used to select ensemble members [110]. It is cited only to illustrate class-level calibration reporting and not as evidence about the included text studies.
The corpus also separates studies that demonstrate overconfidence from those that merely invoke it as motivation. [91] shows majority-biased and overconfident predictions in the high-confidence region, [84] reports strong accuracy alongside poor calibration, and [85] compares uncertainty approximations on ECE, NLL, and Brier score. By contrast, studies including [82,87,96] motivate their intervention through overconfidence without reporting the same depth of calibration evidence. The reliability concern is present in both groups; the evidentiary strength is not.
Selective Prediction and Coverage Evidence
Selective Prediction and Coverage Evidence appears in 10 studies and is the evidence category most directly tied to deciding when a system should abstain or return a set rather than a single label. Empirical coverage, prediction-set size, class-conditional coverage, coverage gap, risk-coverage curves, and AURC/E-AURC form this evidence base. [91,93] report empirical coverage and prediction-set size in conformal settings, while [78] reports interval width under a quantile-regression framing. AURC/E-AURC and risk-coverage appear in a small group of Branch 1 studies [76,79,80,81,82,90]. No detection study in the corpus reports risk-coverage or AURC evidence, even though referral of borderline cases to human review is one of the most consequential abstention decisions represented by the review. The broader selective-classification literature makes a related distinction that bears on this evidence: a model can abstain effectively on average while still retaining overconfident errors among the cases it accepts, a property distinct from ordinary selective accuracy and termed selective calibration [106].
Uncertainty Evidence
Uncertainty Evidence appears in 9 studies (Supplementary Table S8). Predictive entropy is the most visible named measure, but explicit decomposition remains rare: aleatoric, epistemic, and total uncertainty are reported in only a small subset, most clearly [77,83]. That matters because a single uncertainty score cannot tell a downstream user whether the input is genuinely ambiguous or whether the model is outside what it knows. The evidence category is therefore smaller than the Uncertainty Estimation approach category itself, illustrating the broader distinction between applying an uncertainty mechanism and reporting evidence that explains what the resulting uncertainty means.
Predictive-Performance Evidence Versus Reliability-Specific Evidence
The clearest cross-cutting finding on this dimension is the frequency with which predictive-performance evidence is reported. Accuracy appears in 33 of 51 studies, F1 in 23, AUROC in 17, and precision and recall in 16 each. Nine studies report no reliability-specific metric at all despite addressing a reliability concern (Supplementary Table S8). Their topics differ, but their evidentiary pattern is the same: the reliability claim is expressed entirely through accuracy, precision, recall, F1, AUROC, MCC, or related predictive measures. In several cases the substantive result is reliability-relevant, such as false accusations, threshold transfer, or cross-domain failure, but the metric does not isolate the reliability property itself.
This is not an argument against reporting accuracy or F1 alongside reliability metrics. The diagnostic issue is their use in place of a metric capable of supporting the scope of the claim. A reliability-specific measure can also be too coarse: aggregate calibration may be offered where the claim is class-conditional, or in-distribution evidence may be offered where the claim is about generalization. The central contribution of this dimension is therefore the separation between what a study claims about reliability and what its evidence actually demonstrates. Section 4.5 extends that distinction by asking under what conditions the evidence was validated. Table 5 summarizes the key findings for each evidence category.
4.5. Reliability Validation
Reliability Validation records the conditions under which reliability evidence is tested and therefore how far a reliability claim can reasonably travel beyond its original benchmark. The categories are non-mutually exclusive: 24 studies report Out-of-Distribution Validation, 21 Adversarial and Perturbation Validation, 20 Cross-Generator Generalization, and 4 Cross-Lingual validation. A further 18 studies are classified as In-Distribution Only, meaning that no validation beyond standard testing was documented. The key distinction is therefore not whether a model was evaluated at all, but whether the claimed reliability was challenged under conditions that differ from those used to develop or tune the system. Study-level Reliability Validation assignments are reported in Supplementary Table S8.
In-Distribution Only
Eighteen studies provide no validation beyond standard or in-distribution testing (Supplementary Table S8). Most are in the sentiment and emotion categories: emotion studies applying calibration, selective prediction, or uncertainty methods [90,91,93,94,95,96], and sentiment studies doing the same [74,77,79,81,82,83,84,86]. A smaller number are detection studies [53,55,97], together with [17], which is a boundary case because it provides a quantitative diagnostic-accuracy analysis rather than a dataset-level shifted evaluation. In-distribution evidence is necessary, but by itself it establishes reliability only under the conditions most similar to development data. It cannot demonstrate that confidence, coverage, or false-positive behavior remains stable after the data-generating process changes.
Out-of-Distribution Validation
Out-of-Distribution Validation is the most common non-standard category at 24 studies (Supplementary Table S8). In AI-generated text detection, cross-dataset, cross-genre, or cross-domain evaluation spans likelihood and watermark detectors [57,63,66]; representation- or distance-based detectors [58,59,60]; a consistency-based detector [67]; a conformal error-control detector [61]; and further detection studies with cross-domain evaluation [64,65,69,71,72]. The results often show that strong in-domain performance does not guarantee transfer: [58], for example, reports a supervised classifier falling from 0.99 in-domain accuracy to 0.39–0.69 off-domain, and [64] finds detectors weakening once domain, generator, and attack conditions are made realistic. Cross-domain reliability is much less common on the sentiment and emotion side, although [76,78,85,87,88,89] provide important exceptions. This concern generalizes beyond the review corpus: a benchmark-construction study spanning multiple NLP tasks found that many previously used distribution shifts were insufficiently challenging to support robust conclusions about OOD performance, and proposed a stricter construction protocol to address the gap [101].
Adversarial and Perturbation Validation
Adversarial and Perturbation Validation appears in 21 studies and is concentrated heavily in AI-generated text detection (Supplementary Table S8). The protocols include recursive or controllable paraphrasing [59,66], back-translation [72], character- and word-level edits [18,67], and generation-side manipulations [57]. Broader attack or perturbation evaluations divide by detector type: watermark or likelihood signals [62,63]; representation- or distance-based detection [58]; contrastive detection with score calibration [68]; conformal error control [61]; detection-tool audits under perturbation [4,50,51]; and further detection studies with adversarial or perturbation evaluation [64,65,69,70,71]. The corresponding scarcity in Branch 1 is striking; [92] is the clearest direct example of perturbation-oriented validation there, with [80] also contributing adversarial or perturbation evidence in the present coding. The imbalance does not establish that Branch 1 methods are fragile, only that the corpus rarely tests whether their confidence signals survive meaning-preserving changes.
Cross-Generator Generalization
Cross-Generator Generalization appears in 20 studies and is specific to the structure of AI-generated text detection (Supplementary Table S8). The detector must recognize output from a generator population that changes over time, so evidence from one model family cannot be assumed to transfer automatically. The included studies test cross-generator transfer across detector types: likelihood and watermark detectors [57,62,63,66]; representation- or distance-based detectors [58,59,60]; consistency- and calibration-based detectors [67,68]; a conformal error-control detector [61]; detection-tool audits across generators [52,54]; and further detection studies with cross-generator evaluation [64,65,69,70,71,72,73]. The evidence supports neither universal failure nor complacency: some studies document degradation, while others show that cross-generator robustness can be improved by design [58,60,67,71]. Recent work applying a leave-one-generator-out protocol outside the review corpus reinforces this pattern: classical stylometric detectors degrade sharply against a held-out generator, while transformer-based detectors generalize comparatively better, with the residual failures concentrated in false negatives [103].
Cross-Lingual Validation
Cross-Lingual validation is the least populated retained category at 4 studies [57,58,65,75]. This scarcity is especially consequential because English appears in 48 of the 51 included studies. [65] evaluates Chinese alongside English, [57] includes Chinese and English, and [58] spans ten languages while cautioning that only relatively high-resource languages are represented. [75] provides the principal Branch 1 example of cross-lingual calibration and neighbor-based confidence. The Persian-language detector audit [54] is a deliberate exclusion from this category rather than a fifth member of it. It applies English-centric detectors to a Persian corpus and reports that they underperform, but it has no English arm, so the language shift is present by construction rather than measured within the study. Evaluating a non-English dataset is not the same as demonstrating transfer across languages, and the category is therefore confined to studies that test at least two language conditions directly. On that criterion the evidence base for cross-lingual reliability is narrower still than the presence of multilingual data alone would suggest. This pattern is corroborated by cross-lingual calibration research outside the review corpus. That research finds that models calibrated in a source language become miscalibrated after zero-shot transfer to a target language. The degree of miscalibration is linked to task difficulty, data sparsity, and linguistic distance from the source language [107].
Additional Deployment-Relevant Validation Gaps
Two related issues sit outside the five retained validation categories but matter for interpretation. First, non-native writing is an important testing condition in AI-generated text detection even when the language remains English; it is examined in [52,58,73] and is where equity consequences of detector errors become directly observable. Second, no included study performs a longitudinal evaluation across successive generator or commercial-tool versions. [52] notes that proprietary tools change without notice and [51] emphasizes the speed of change in the field, but these observations do not amount to measured temporal decay. The absence of model/version-shift studies is therefore treated as a research gap rather than retained as a zero-count taxonomy subcategory.
Validation-Level Synthesis
Taken together, Reliability Validation exposes the gap between reliability established on a benchmark and reliability under deployment conditions. The recurring mismatch is in-distribution evidence offered in support of a claim that is substantively about generalization, robustness, or transfer. Several studies state the limitation themselves: [96] reports evaluation only on English tweets and [93] notes that adversarial robustness of its coverage remains untested. Other cases reveal the mismatch through synthesis: [60] pursues robustness and generalization without accompanying calibration analysis, while [88] models aleatoric uncertainty but leaves the epistemic component that would signal unfamiliar domains to future work. The asymmetry is clear: shifted and adversarial validation is routine in much of AI-generated text detection but remains occasional in sentiment and emotion. Section 4.6 examines what follows when the five dimensions are read together. Table 6 summarizes the key findings for each validation category.
4.6. Cross-Dimensional Synthesis and Comparison of the Review Branches
The preceding five subsections examine the five taxonomy dimensions individually. The main contribution of the discussion emerges when those dimensions are read together: patterns that are descriptive on one axis become explanatory when related to the task category, model context, reliability approach, evidence, and validation conditions. The synthesis below therefore focuses directly on the cross-dimensional relationships that distinguish the three task categories and reveal where reliability practice is shared, uneven, or transferable across the two review branches. The study-level coding in Supplementary Tables S1–S8 enables the cross-dimensional comparisons that follow.
Task Category × Reliability Approaches
Task Category read against Reliability Approaches shows that the difference hardens into distinct toolkits. Under the operational coding definition used in this systematic review, Uncertainty Estimation appears in 12 sentiment and 3 emotion studies and in no AI-generated-text study, while all 5 Statistical and Likelihood Methods studies fall in AI-generated text detection. Calibration is the most balanced approach across the three task categories, with 3 emotion, 2 sentiment, and 2 AI-generated-text studies. Selective Prediction appears mainly in Branch 1, with 5 emotion and 3 sentiment studies, and only 1 AI-generated-text study. Distance and Representation Methods appear in 3 sentiment and 4 detection studies, while Consistency and Agreement Methods appear in 1 emotion and 2 detection studies. Figure 7 therefore shows both shared machinery and strong category-specific emphasis without treating ordinary threshold tuning as Selective Prediction.
Cross-dimensional analysis confirms that Reliability Approaches, Reliability Evaluation Evidence, and Reliability Validation capture distinct aspects of reliability. The study-level coding (Supplementary Tables S2–S4 and Table S8) shows that 6 of the 7 Calibration studies report Calibration Evidence, 8 of the 15 Uncertainty Estimation studies report Uncertainty Evidence, and 6 of the 9 Selective Prediction studies report Selective Prediction and Coverage Evidence. Validation remains comparatively narrow: 4 Calibration, 10 Uncertainty Estimation, and 7 Selective Prediction studies are limited to in-distribution conditions. These patterns do not show that the approaches fail under distribution shift; rather, they show that their transfer beyond familiar conditions has seldom been tested.
Transferable Practices Between the Two Review Branches
Three practices are therefore candidates for wider adoption in Branch 2, a synthesis drawn from the asymmetries above rather than a recommendation any included study makes. Two of them already have a precedent inside Branch 2 and are under-adopted there rather than genuinely absent. The first is calibration of detector scores, so that a detector’s confidence corresponds to an empirical probability rather than an uninterpretable raw score. [68,97] establish that this is feasible in detection, and [68] reports that removing its calibration step doubles calibration error while barely changing F1. The second is conformal prediction for guaranteed error control at a chosen risk level, which would let a detector state a formal bound on its false-positive rate rather than reporting one after the fact. This is underused rather than untried: [61] already does it and reports its widest margins at the tightest false-positive constraints, which is evidence that the transfer works rather than that it is speculative. The third is abstention as an alternative to forcing a binary human or AI verdict in borderline cases, which addresses the asymmetric-cost problem directly. Abstention has the thinnest precedent of the three. One detection study [61] already returns a set-valued conformal output, but no detection study in the corpus reports risk-coverage or AURC evidence, so what is missing is the evidence form rather than the mechanism itself. Three practices run in the opposite direction and are likewise part of this synthesis. The first is systematic shift testing as standard practice rather than an occasional addition. The second is adversarial and perturbation protocols, adapted from paraphrase-attack testing to probe whether emotion and sentiment confidence is stable under meaning-preserving edits, where Branch 1 offers the single precedent of [92]. The third is reporting error rates at a fixed, named operating point rather than only in aggregate, which would make a Branch 1 calibration claim as operationally legible as a Branch 2 detection claim.
Overall Cross-Dimensional Synthesis
The synthesis yields a single overarching conclusion. The three task categories address the common overarching question of whether a text classifier can be trusted, but they work with different Model Types, emphasize different Reliability Approaches, accept different forms of Reliability Evaluation Evidence, and validate those claims under different conditions. Read on their own terms, the literatures can appear only loosely commensurable. Read through the same five-dimensional framework, they become directly comparable. That comparison reveals where a method is concentrated in one branch, and where evidence is weaker than the scope of the claim. It also reveals where model access appears to shape the available toolkit, and where validation practices established in one branch have not yet been adopted in another. Some differences reflect genuinely different reliability problems; others appear to reflect research convention rather than necessity. The research directions in Section 6 build on that distinction.
5. Research Gaps and Limitations
The gaps below synthesize author-stated limitations and patterns inferred during the review recorded in the extraction workbook. They are presented separately for each review branch and then jointly so that branch-specific gaps are not treated as common to both. Recommendations arising from these gaps are reserved for Section 6.
5.1. Gaps in Emotion and Sentiment Classification
The principal gaps in emotion and sentiment classification concern data and annotation, class-conditional reliability, integration of reliability mechanisms, transfer beyond familiar settings, and deployment. The specific gaps discussed below are summarized in Figure 8.
Branch 1 remains constrained by English-dominant datasets, limited low-resource validation, and incomplete treatment of annotation subjectivity. The cross-lingual calibration study [75] limits its claims to the high-resource languages tested, while the Arabic multi-label emotion study [90] calls for cultural validation of its corpus-specific polarity-conflict taxonomy. Annotator disagreement is also rarely reported alongside reliability evidence; [95] is the closest exception, comparing predictive uncertainty with annotator entropy. Class-conditional evidence remains similarly sparse. Calibration and coverage are commonly reported in aggregate despite imbalanced label spaces, and [91] notes that its class-spectrum calibration analysis does not account for class frequencies in the hold-out set.
Calibration and uncertainty methods are seldom compared head to head on the same benchmark, and uncertainty components are rarely connected to the errors they are intended to explain. Of the 15 Uncertainty Estimation studies, only 3 report aleatoric uncertainty, 2 epistemic uncertainty, and 1 total uncertainty. Selective Prediction is also underdeveloped as an operational decision: only 8 of the 23 Branch 1 studies are coded in this category, and fewer implement explicit abstention. Studies therefore tend to report confidence, uncertainty, or calibration without integrating these signals into a pipeline that determines whether a prediction should be acted upon.
Transfer and deployment evidence remain limited. Cross-language and cross-domain testing are uncommon, with [75] providing only a partial exception. Computational cost is acknowledged but rarely benchmarked against a lighter-weight reliability baseline; for example, [92] notes the training and inference burden of its 70B backbone. Human-oversight and referral pathways are likewise discussed more often than they are implemented, leaving the practical consequences of low-confidence predictions weakly connected to the evidence reported.
5.2. Gaps in AI-Generated Text Detection
The main gaps in AI-generated text detection concern dataset realism, operating-point selection, transfer to new generators and domains, robustness to manipulation, and the role of human oversight. The specific gaps discussed below are summarized in Figure 9.
Detection evidence is limited by the representativeness of both human-written and AI-generated corpora. Generator coverage is often narrow, and mixed or lightly edited human-AI text receives little attention relative to the wholly human or wholly generated setting. The Persian abstract study [54], for example, draws its human comparison set from seven journals and does not claim that this sample represents Persian academic writing broadly. Such constraints make it difficult to determine whether a reported detector property reflects the intended task or the particular sources used to construct the benchmark.
Operating-point evidence also lacks a shared deployment standard. Across the full corpus, 15 studies report a false-positive rate; the detection literature does not identify an agreed acceptable level, and aggregate accuracy or AUROC is often reported without an error rate at a named threshold. Generalization remains incomplete as well. The zero-shot detector study [57] identifies continuing evaluation against new model releases as future work, but no included study measures detector decay longitudinally as generators change. Cross-domain and cross-language evaluation occurs only in a minority of the branch. The Persian study [54] raises cross-language concerns but has no English comparison arm and therefore does not itself demonstrate cross-lingual transfer.
Robustness studies generally address one attack surface at a time. The stress-testing study [66] evaluates paraphrase and distribution-mimicking behavior, whereas [67] focuses on minor character- and word-level perturbations and explicitly excludes paraphrasing attacks. Deployment practice is narrower still: most detectors force a binary human-or-AI verdict and provide no abstention or referral pathway. [18] cautions that detector output should be treated as evidence rather than a verdict, particularly when moderate accuracy coexists with very low precision. This gap is consequential because false accusations are frequently invoked as motivation but are not consistently tied to a decision protocol that includes human review.
5.3. Cross-Branch Gaps
Across both branches, the clearest shared gap is the use of predictive-performance metrics as evidence of reliability. Accuracy appears in 33 of 51 studies, and 9 studies report no reliability-specific evidence. The corpus also lacks a shared benchmark or minimum reporting standard, so competing methods are rarely compared under identical conditions. Restricted model access further narrows the available toolkit, particularly for Bayesian and ensemble methods that require repeated inference or control over model internals. The five-dimensional framework proposed in this review offers a shared vocabulary for separating the application, model context, reliability mechanism, supporting evidence, and validation conditions, but it remains to be tested as a reporting standard beyond this corpus.
These findings should be read against four limitations of the review process. First, searches were restricted to English-language journal articles and conference proceedings. Second, no formal risk-of-bias or quality-appraisal instrument was applied; reports were checked for internal consistency and interpretability instead. Third, the heterogeneous corpus was synthesized narratively because no common effect measure supported statistical pooling. Fourth, screening, eligibility assessment, data extraction, and taxonomy coding were conducted without independent duplicate assessment, increasing the possibility of missed studies or subjective coding decisions. Excluding preprints may underrepresent a rapidly changing detection literature, and excluding multimodal inputs may underrepresent the emotion branch. The reported counts are therefore descriptive of the coded corpus and should not be interpreted as effect estimates.
6. Future Research Directions
Building on the gaps identified in Section 5, the review points to two research directions, one for each review branch. The first concerns an integrated reliability-aware pipeline for emotion and sentiment classification, and the second concerns adapting and evaluating the same pipeline for AI-generated text detection. Both are presented as evidence-based directions available to future studies, grounded in the gaps synthesized in this review. The recurring recommendation across both branches is that calibration, uncertainty estimation, and selective prediction be evaluated together, so that confidence scores are interpretable, doubtful cases are identified, and systems can abstain or recommend expert review when a prediction is not sufficiently reliable to act upon.
The recommendations below target methodological gaps that individual studies could address within their own evaluation designs. Gaps that require broader community coordination, including shared benchmarks, larger representative corpora, and comprehensive generator coverage, are identified in Section 5 but are not the focus of these recommendations.
6.1. Addressing Reliability Gaps in Emotion and Sentiment Classification
Section 5.1 found the three reliability mechanisms already present in this branch, but rarely connected: studies tend to report confidence, uncertainty, or calibration without integrating these signals into a pipeline that determines whether a prediction should be acted upon. Within Branch 1, Calibration appears in 5 studies, Uncertainty Estimation in 15, and Selective Prediction in 8, and where they co-occur they are typically reported as separate contributions rather than as stages of one decision procedure. The direction is therefore integrative rather than additive: future studies could evaluate calibration, uncertainty estimation, and selective prediction as a single pipeline, assessed end to end, to test whether the combination supports a more dependable decision than any component does in isolation.
Calibration could also be reported at the class level and not only in aggregate. Section 4.4 showed that an aggregate calibration figure can conceal substantially worse confidence quality on individual classes, and Section 5.1 noted that calibration and coverage are commonly reported in aggregate despite imbalanced label spaces, with one included study acknowledging that its class-spectrum calibration analysis does not account for class frequencies in the hold-out set. Reporting per-class calibration error alongside the aggregate figure would prevent a well-calibrated majority class from standing in for the reliability of the label space as a whole.
Uncertainty estimation could be evaluated with computational cost in view. Section 5.1 noted that computational cost is acknowledged but rarely benchmarked against a lighter-weight reliability baseline, and Section 5.3 noted that restricted model access narrows the use of Bayesian and ensemble methods that require repeated inference or control over model internals. Future studies could therefore test whether lightweight, low-overhead uncertainty signals carry enough information to support the downstream decision, comparing them directly with the multi-pass procedures they would replace rather than evaluating them in isolation.
Uncertainty signals could also be evaluated for a specific purpose rather than reported as quantities of interest in their own right. Section 5.1 noted that annotator disagreement is rarely reported alongside reliability evidence, with one included study comparing predictive uncertainty with annotator entropy as the closest exception, and that uncertainty components are rarely connected to the errors they are intended to explain. Future studies could examine whether an uncertainty signal separates genuinely ambiguous cases, in the sense of attracting disagreement among annotators, from cases on which the model is simply wrong. Where that separation holds, ambiguous or low-confidence cases need not receive a forced prediction, and risk-coverage behavior could be reported in place of a single accuracy figure.
Finally, the reliability signal could be carried into the decision itself. Section 5.1 noted that only 8 of the 23 Branch 1 studies are coded as Selective Prediction, that fewer implement explicit abstention, and that human-oversight and referral pathways are discussed more often than they are implemented. Rather than returning a label alone, a system could return a label together with a reliability flag and recommend expert review when that flag indicates that the prediction is not sufficiently reliable to be acted upon. Reporting the proportion of cases referred and the accuracy of the cases retained as outcomes would make the referral decision explicit and measurable.
6.2. Addressing Reliability Gaps in AI-Generated Text Detection
Adapting the same pipeline to detection begins from a different starting point. Section 4.4 showed that the evidence in this branch is concentrated in detector operating points, with calibration and uncertainty evidence largely absent. Section 4.6 identified this as the clearest transfer available in the corpus: calibration, uncertainty estimation, and abstention are present in the emotion and sentiment literature, but are not yet standard in detection. Future detection studies could therefore assess detector outputs with calibration and uncertainty evidence rather than with accuracy, AUROC, or a fixed binary threshold alone.
False-positive behavior warrants particular attention. Section 4.1 established that the cost of a detection error is asymmetric and borne principally by the person whose writing is flagged, rather than by the operator of the system. Section 5.2 noted the absence of an agreed acceptable false-positive rate in detection studies, and that aggregate accuracy or AUROC is often reported without an error rate at a named threshold. Future studies could report error rates at a stated operating point rather than in aggregate, and treat the choice of that point as an explicit decision with a stated tolerance rather than as a fixed property of the detector.
Calibrated scores and lightweight uncertainty could serve the same purpose as in the other branch: identifying cases in which a detector output is not sufficiently reliable for an automatic decision. Section 5.2 noted that most detectors force a binary human-or-AI verdict with no abstention or referral pathway, and that one included study cautions that detector output should be treated as evidence rather than a verdict. Selective behavior would allow uncertain cases to be flagged rather than decided, with a reliability flag and an expert-review recommendation carrying that outcome to the person responsible for the consequence. Expert review is understood here as a recommendation about how a detector output should be used at deployment, not as a human-subject experimental component.
These reliability properties could be evaluated under the conditions this branch already tests well. Section 4.5 showed cross-domain, adversarial, and cross-generator validation to be more common in detection than anywhere else in the corpus, while Section 5.2 noted that no included study measures detector decay longitudinally as generators change, that cross-domain and cross-language evaluation occurs only in a minority of the branch, and that robustness studies generally address one attack surface at a time. Future studies could retain those practices rather than replace them, assessing calibration, uncertainty, and selective behavior under changes of domain, generator, and input perturbation, so that a reliability property established in one condition is not assumed to hold in another. This is the reciprocal half of the transfer identified in Section 4.6, in which systematic shift testing and operating-point reporting move in the opposite direction, from detection into emotion and sentiment reliability.
7. Conclusion
This review examined how reliability is pursued and evidenced across three text-classification task categories: emotion classification, sentiment analysis, and AI-generated text detection. It covered 51 studies selected from 1,797 records through a PRISMA-guided process. AI-generated text detection is the largest task category with 28 studies, followed by sentiment analysis with 15 and emotion classification with 8.Encoder-Based PLMs are the most common Model Type (35 studies), followed by Decoder-Based LLMs (25) and Other Deep-Learning Architectures (18).
Across Reliability Approaches, Uncertainty Estimation is the largest category at 15 studies, followed by Selective Prediction at 9, Calibration and Distance and Representation Methods at 7 each, Statistical and Likelihood Methods at 5, and Consistency and Agreement Methods at 3. The distributions across task categories are highly uneven: under the review’s operational coding definition, Uncertainty Estimation occurs only in sentiment and emotion, whereas all Statistical and Likelihood Methods studies occur in AI-generated text detection. Reliability Evaluation Evidence is led by Error-Rate and Operating-Point Evidence (19 studies), Calibration Evidence (14), Selective Prediction and Coverage Evidence (10), and Uncertainty Evidence (9). Reliability Validation shows that shifted and adversarial testing is common in detection but much less common for the reliability mechanisms concentrated in sentiment and emotion.
The three task categories are united by the question of whether a classifier output can be trusted, but they operationalize that question differently. Sentiment and emotion emphasize confidence quality, uncertainty, ambiguity, and class imbalance. AI-generated text detection emphasizes false-positive behavior, operating-point consequences, and generalization across generators, domains, languages, and perturbations. The taxonomy makes those differences directly comparable without treating ordinary detector thresholding as Selective Prediction or general reliability-oriented training as Calibration.
Across both branches, the most critical evidence gaps are overreliance on predictive-performance metrics as evidence of reliability and the absence of a shared reliability benchmark across studies. A third is limited testing of whether a reliability claim established in one language, domain, or generator population transfers to another. Within Branch 1 specifically, class-conditional reliability evidence for minority emotion and sentiment classes is rare. Within Branch 2, error rates are seldom reported at an operationally meaningful, named threshold.
The review’s organizing contribution is the five-dimensional taxonomy itself. Task Category identifies the application context, Model Type the modeling context, Reliability Approaches the mechanism used, Reliability Evaluation Evidence what is demonstrated, and Reliability Validation the conditions under which that demonstration is tested. Keeping these dimensions separate exposes mismatches that disappear when methods, metrics, and testing conditions are pooled together. It also provides a shared vocabulary for comparing reliability practices across NLP tasks that have developed under different research traditions.
For researchers, the implication is a reporting practice rather than a single preferred technique. Future studies should state the Task Category and Model Type clearly, define the Reliability Approach used if one is present, report reliability-specific evidence capable of supporting the claim, and describe the validation conditions under which that evidence was obtained. Predictive-performance metrics should not be allowed to stand in for reliability evidence by default, and a threshold chosen for a forced binary decision should not be described as selective prediction unless the system can actually abstain, defer, reject, or return a set-valued output.
For practitioners, the implication is that calibrated confidence, robustness testing under the shift conditions expected at deployment, and abstention or human review for high-risk decisions are not optional extensions to a text-classification system. They are the minimum evidence base for deciding whether that system can be trusted with a consequential decision.
Supplementary Materials
Supplementary File 1 Completed PRISMA 2020 checklist. [Supplementary File 1] Supplementary File 2 Study-level taxonomy and reliability categorization of the 51 included studies (Table S1–S8). [Supplementary File 2].
Author Contributions
Nisreen Albzour: Conceptualization, Methodology, Investigation, Data curation, Formal analysis, Visualization, Writing – original draft. Sarah S. Lam: Conceptualization, Methodology, Supervision, Writing – review and editing.
Funding
This research received no external funding.
Data Availability Statement
The data supporting the findings of this review are provided in the article and its supplementary materials. The study-level extraction workbook is available from the corresponding author upon reasonable request.
Conflicts of Interest
None declared.
Appendix A. Taxonomy Codebook
Table A1 presents the codebook used to assign the 51 included studies to the five taxonomy dimensions. Definitions and decision rules are those applied in the final coding; study-level assignments are reported in Supplementary Tables S1–S8.

Table A1.
Taxonomy codebook: category definitions and decision rules.
| Dimension | Category | Definition (assign when) | Decision rule for borderline cases, with exclusion examples |
| Task Category (one per study) | Emotion Classification | The primary task is classifying text into emotion categories. | A study that addresses more than one task is assigned only to its primary task. |
| Sentiment Analysis | The primary task is classifying text by sentiment, using coarser, polarity-oriented, and often ordinal labels. | As above. | |
| AI-Generated Text Detection | The primary task is distinguishing AI-generated text from human-written text. | As above. | |
| Model Type (multi-value) | Encoder-Based PLMs | The study uses an encoder-based pretrained language model. | Coded alongside any other Model Type the study uses. |
| Decoder-Based LLMs | The study uses a decoder-based large language model; outside detection, the decoder LLM is itself the classifier being assessed. | Coded alongside any other Model Type the study uses. | |
| Other Deep-Learning Architectures | The study uses a neural architecture not captured by the encoder or decoder transformer categories, such as recurrent or convolutional components. | May be coded together with an encoder or decoder category. | |
| Proprietary or Unspecified Models | The study uses a proprietary system, or does not specify the model type well enough for a more precise assignment. | Coded alongside any other Model Type that can be identified (e.g., a proprietary decoder-based detector); access constraints are not inferred from this category alone. | |
| Hybrid or Multiple Model Types | The study combines or compares model types rather than treating a single architecture as the sole object of analysis. | Assigned only for a genuinely combined architecture across model families (e.g., encoder representations fused with BiLSTM layers) and coded alongside the individual families. Baselines contribute their own Model Type but do not make a study Hybrid. | |
| Traditional Machine Learning | The study uses a feature-based or statistical machine-learning model. | In the included corpus, this category is always coded alongside at least one other Model Type, typically as a baseline or comparator. | |
| Reliability Approaches (multi-value; may be none) | Calibration | The study explicitly applies or optimizes a method that targets confidence or probability calibration. | Reporting calibration metrics without a calibration intervention is coded as Calibration Evidence. Training-time reliability-aware objectives that do not explicitly target calibration (e.g., class reweighting, robust or adversarial training) are not coded as Calibration. |
| Uncertainty Estimation | The study derives or evaluates a predictive-uncertainty quantity. | A framework described as uncertainty-aware is not coded here unless it derives or evaluates such a quantity (e.g., [56]). | |
| Selective Prediction | The system can abstain, reject, defer, or return a set-valued prediction. | Decision-threshold or operating-point tuning that still forces a class decision is treated as an implementation detail and not coded here; a fixed operating point (e.g., 1% FPR) used as an evaluation protocol is likewise not coded here. | |
| Distance and Representation Methods | A reliability signal is derived from proximity to training examples, cached demonstrations, or a reference corpus rather than only from the model’s own probability. | Includes nearest-neighbor or retrieval signals over reference examples and representation-geometry signals (e.g., intrinsic dimension of the embedding space). | |
| Consistency and Agreement Methods | Reliability is inferred from stability across agents, perturbations, denoising views, or related predictions. | Includes agreement across agents, counterfactual or denoised views, and paragraph- and token-level predictions. | |
| Statistical and Likelihood Methods | The study exploits statistical regularities, likelihood relationships, or detection statistics as the reliability mechanism. | Includes likelihood ratios, hypothesis tests (e.g., watermark z-scores), Bayesian posteriors over human and model hypotheses, and diagnostic-accuracy modeling. Likelihood, log-probability, or entropy values used only as input features to a learned classifier are not coded here; the statistical quantity must itself be the decision score or the object of the reliability analysis. | |
| (No approach) | The study evaluates or stress-tests reliability without a mechanism meeting any of the six definitions. | Approaches are coded by the mechanism a study proposes or applies, not by its stated goal. Evaluation or stress testing, and methods that appear only as comparison baselines, receive no Reliability Approach assignment. | |
| Reliability Evaluation Evidence (multi-value) | Error-Rate and Operating-Point Evidence | The study reports false-positive or false-negative rates, false-accusation measures, true-positive rate at a fixed false-positive rate, or performance at another explicitly stated operating point. | A formal coverage guarantee reported only through detector operating points is coded here. |
| Calibration Evidence | The study reports a calibration measure, such as ECE, MCE, ACE, Brier score, NLL, or reliability diagrams. | Coded regardless of whether the study applies a calibration method. | |
| Selective Prediction and Coverage Evidence | The study reports empirical coverage, prediction-set size, class-conditional coverage, coverage gap, risk–coverage curves, or AURC/E-AURC. | A formal coverage guarantee is coded here only where an empirical coverage quantity is actually reported. | |
| Uncertainty Evidence | The study reports an uncertainty quantity, such as predictive entropy or aleatoric, epistemic, or total uncertainty. | Predictive-performance metrics (accuracy, precision, recall, F1, AUROC, AUCPR) are not coded as reliability evidence on this dimension. | |
| Reliability Validation (multi-value) | In-Distribution Only | The study documents no validation beyond standard or in-distribution testing. | Not combined with any other Reliability Validation category. |
| Out-of-Distribution Validation | Reliability is evaluated under cross-dataset, cross-genre, or cross-domain shift. | Coded alongside other validation categories where several conditions are tested. | |
| Adversarial and Perturbation Validation | Reliability is evaluated under paraphrasing, back-translation, character- or word-level edits, or generation-side manipulations. | Coded alongside other validation categories where several conditions are tested. | |
| Cross-Generator Generalization | A detector is evaluated on text from generators other than those used for training or development. | Specific to AI-generated text detection. | |
| Cross-Lingual | Reliability is evaluated across languages, such as transfer from a source to a target language or explicit generalization across languages. | A multilingual corpus alone, or evaluation in a single non-English language, is not sufficient. Non-native English writing is not coded as Cross-Lingual; it is discussed separately as a deployment-relevant condition. | |
| Model or version shift (not retained) | Considered during coding: reliability evaluated longitudinally across successive model or tool versions. | Not retained as a category because no included study performed such validation; treated as a research gap. |
References
- Minaee, S.; Kalchbrenner, N.; Cambria, E.; Nikzad, N.; Chenaghlu, M.; Gao, J. Deep learning based text classification: A comprehensive review. ACM Comput. Surv. 2021, vol. 54(no. 3), Art. no. 62. [Google Scholar] [CrossRef]
- Devlin, J.; Chang, M.-W.; Lee, K.; Toutanova, K. BERT: Pre-training of deep bidirectional transformers for language understanding. Proc. 2019 Conf. North American Chapter of the Association for Computational Linguistics: Human Language Technologies (NAACL-HLT), Minneapolis, MN, 2019; pp. 4171–4186. [Google Scholar] [CrossRef]
- Brown, T. B.; Mann, B.; Ryder, N.; Subbiah, M.; Kaplan, J.; Dhariwal, P.; et al. Language models are few-shot learners. Proc. 34th Conf. Neural Information Processing Systems (NeurIPS), 2020; pp. 1877–1901. Available online: https://arxiv.org/abs/2005.14165.
- Weber-Wulff, D.; Anohina-Naumeca, A.; Bjelobaba, S.; Foltýnek, T.; Guerrero-Dib, J.; Popoola, O.; Šigut, P.; Waddington, L. Testing of detection tools for AI-generated text. Int. J. Educ. Integr. 2023, vol. 19(no. 1, Art. no. 26). [Google Scholar] [CrossRef]
- Gorwa, R.; Binns, R.; Katzenbach, C. Algorithmic content moderation: Technical and political challenges in the automation of platform governance. Big Data Soc. 2020, vol. 7(no. 1). [Google Scholar] [CrossRef]
- Chancellor, S.; De Choudhury, M. Methods in predictive techniques for mental health status on social media: A critical review. npj Digit. Med. 2020, vol. 3, Art.(no. 43). [Google Scholar] [CrossRef] [PubMed]
- Nawawi, I.; Ilmawan, K. F.; Maarif, M. R.; Syafrudin, M. Exploring tourist experience through online reviews using aspect-based sentiment analysis with zero-shot learning for hospitality service enhancement. Information 2024, vol. 15(no. 8, Art. no. 499). [Google Scholar] [CrossRef]
- Korthals, L.; Akrong, E.; Geller, G.; Rosenbusch, H.; Grasman, R.; Visser, I. Towards reliable LLM grading through self-consistency and selective human review: Higher accuracy, less work. Mach. Learn. Knowl. Extr. 2026, vol. 8(no. 3, Art. no. 74). [Google Scholar] [CrossRef]
- Ribeiro, M. T.; Wu, T.; Guestrin, C.; Singh, S. Beyond accuracy: Behavioral testing of NLP models with CheckList. Proc. 58th Annual Meeting of the Association for Computational Linguistics (ACL), 2020; pp. 4902–4912. [Google Scholar] [CrossRef]
- Guo, C.; Pleiss, G.; Sun, Y.; Weinberger, K. Q. On calibration of modern neural networks. Proc. 34th Int. Conf. Machine Learning (ICML), Sydney, Australia, 2017; pp. 1321–1330. Available online: https://proceedings.mlr.press/v70/guo17a.html.
- Hendrycks, D.; Gimpel, K. A baseline for detecting misclassified and out-of-distribution examples in neural networks. Proc. 5th Int. Conf. Learning Representations (ICLR), Toulon, France, 2017; Available online: https://arxiv.org/abs/1610.02136.
- Ovadia, Y.; Fertig, E.; Ren, J.; Nado, Z.; Sculley, D.; Nowozin, S.; Dillon, J.; Lakshminarayanan, B.; Snoek, J. Can you trust your model’s uncertainty? Evaluating predictive uncertainty under dataset shift. Proc. 33rd Conf. Neural Information Processing Systems (NeurIPS), Vancouver, Canada, 2019; pp. 13991–14002. Available online: https://arxiv.org/abs/1906.02530.
- Raji, I. D.; Bender, E. M.; Paullada, A.; Denton, E.; Hanna, A. AI and the everything in the whole wide world benchmark. Proc. 35th Conf. Neural Information Processing Systems (NeurIPS) Datasets and Benchmarks Track, 2021; Available online: https://arxiv.org/abs/2111.15366.
- Johnson, J. M.; Khoshgoftaar, T. M. Survey on deep learning with class imbalance. J. Big Data 2019, vol. 6, Art.(no. 27). [Google Scholar] [CrossRef]
- Kull, M.; Perello-Nieto, M.; Kängsepp, M.; Silva Filho, T.; Song, H.; Flach, P. Beyond temperature scaling: Obtaining well-calibrated multi-class probabilities with Dirichlet calibration. Advances in Neural Information Processing Systems 32 (NeurIPS); Vancouver, BC, Canada, 2019; pp. 12295–12305. Available online: https://proceedings.neurips.cc/paper/2019/hash/8ca01ea920679a0fe3728441494041b9-Abstract.html.
- Williams, L.; Anthi, E.; Burnap, P. Comparing hierarchical approaches to enhance supervised emotive text classification. Big Data Cogn. Comput. 2024, vol. 8(no. 4), Art. no. 38. [Google Scholar] [CrossRef]
- Tsigaris, P.; Teixeira da Silva, J. A. AI detecting AI in academic writing: Why most AI detector findings are false. Next Res. 2026, vol. 7, Art.(no. 101396). [Google Scholar] [CrossRef]
- Wakjira, T. G.; Tijani, I. A.; Alam, M. S.; Mashal, M.; Hasan, M. K. Can we trust AI content detection tools for critical decision-making? Information 2025, vol. 16(no. 10, Art. no. 904). [Google Scholar] [CrossRef]
- Brier, G. W. Verification of forecasts expressed in terms of probability. Mon. Weather Rev. vol. 78(no. 1), 1–3, 1950. [CrossRef]
- Gneiting, T.; Raftery, A. E. Strictly proper scoring rules, prediction, and estimation. J. Am. Stat. Assoc. 2007, vol. 102(no. 477), 359–378. [Google Scholar] [CrossRef]
- Naeini, M. P.; Cooper, G. F.; Hauskrecht, M. Obtaining well calibrated probabilities using Bayesian binning. Proc. 29th AAAI Conf. Artificial Intelligence (AAAI), Austin, TX, USA, 2015; pp. 2901–2907. [Google Scholar] [CrossRef]
- Geifman, Y.; El-Yaniv, R. Selective classification for deep neural networks. Advances in Neural Information Processing Systems 30 (NeurIPS); Long Beach, CA, USA, 2017; pp. 4878–4887. Available online: https://arxiv.org/abs/1705.08500.
- Vovk, V.; Gammerman, A.; Shafer, G. Algorithmic Learning in a Random World; Springer: New York, NY, USA, 2005. [Google Scholar] [CrossRef]
- Angelopoulos, A. N.; Bates, S. Conformal prediction: A gentle introduction. Found. Trends Mach. Learn. 2023, vol. 16(no. 4), 494–591. [Google Scholar] [CrossRef]
- Gal, Y.; Ghahramani, Z. Dropout as a Bayesian approximation: Representing model uncertainty in deep learning. Proc. 33rd Int. Conf. Machine Learning (ICML), New York, NY, USA, 2016; pp. 1050–1059. Available online: https://proceedings.mlr.press/v48/gal16.html.
- Lakshminarayanan, B.; Pritzel, A.; Blundell, C. Simple and scalable predictive uncertainty estimation using deep ensembles. Advances in Neural Information Processing Systems 30 (NeurIPS); Long Beach, CA, USA, 2017; pp. 6402–6413. Available online: https://arxiv.org/abs/1612.01474.
- Chow, C. K. On optimum recognition error and reject tradeoff. IEEE Trans. Inf. Theory 1970, vol. 16(no. 1), 41–46. [Google Scholar] [CrossRef]
- Zadrozny, B.; Elkan, C. Transforming classifier scores into accurate multiclass probability estimates. Proc. 8th ACM SIGKDD Int. Conf. Knowledge Discovery and Data Mining (KDD), Edmonton, AB, Canada, 2002; pp. 694–699. [Google Scholar] [CrossRef]
- Niculescu-Mizil, A.; Caruana, R. Predicting good probabilities with supervised learning. Proc. 22nd Int. Conf. Machine Learning (ICML), Bonn, Germany, 2005; pp. 625–632. [Google Scholar] [CrossRef]
- MacKay, D. J. C. A practical Bayesian framework for backpropagation networks. Neural Comput. 1992, vol. 4(no. 3), 448–472. [Google Scholar] [CrossRef]
- Minderer, M.; Djolonga, J.; Romijnders, R.; Hubis, F.; Zhai, X.; Houlsby, N.; Tran, D.; Lucic, M. Revisiting the calibration of modern neural networks. Adv. Neural Inf. Process. Syst. 34 (NeurIPS) 2021, 15682–15694. Available online: https://proceedings.neurips.cc/paper_files/paper/2021/hash/8420d359404024567b5aefda1231af24-Abstract.html.
- Desai, S.; Durrett, G. Calibration of pre-trained transformers. Proc. 2020 Conf. Empirical Methods in Natural Language Processing (EMNLP), 2020; pp. 295–302. [Google Scholar] [CrossRef]
- Kamath, A.; Jia, R.; Liang, P. Selective question answering under domain shift. Proc. 58th Annu. Meeting Assoc. Computational Linguistics (ACL), 2020; pp. 5684–5696. [Google Scholar] [CrossRef]
- Jiang, Z.; Araki, J.; Ding, H.; Neubig, G. How can we know when language models know? On the calibration of language models for question answering. Trans. Assoc. Comput. Linguist. 2021, vol. 9, 962–977. [Google Scholar] [CrossRef]
- Hendrycks, D.; Liu, X.; Wallace, E.; Dziedzic, A.; Krishnan, R.; Song, D. Pretrained transformers improve out-of-distribution robustness. Proc. 58th Annu. Meeting Assoc. Computational Linguistics (ACL), 2020; pp. 2744–2751. [Google Scholar] [CrossRef]
- Song, R.; Li, Y.; Tian, M.; Wang, H.; Giunchiglia, F.; Xu, H. Causal keyword driven reliable text classification with large language model feedback. Inf. Process. Manag. 2025, vol. 62(no. 2), Art. no. 103964. [Google Scholar] [CrossRef]
- Koh, P. W.; Sagawa, S.; Marklund, H.; Xie, S. M.; Zhang, M.; Balsubramani, A.; et al. WILDS: A benchmark of in-the-wild distribution shifts. Proc. 38th Int. Conf. Machine Learning (ICML), 2021; pp. 5637–5664. Available online: https://proceedings.mlr.press/v139/koh21a.html.
- Alkhalifa, R.; Kochkina, E.; Zubiaga, A. Building for tomorrow: Assessing the temporal persistence of text classifiers. Inf. Process. Manag. 2023, vol. 60(no. 2), Art. no. 103200. [Google Scholar] [CrossRef]
- Lipianina-Honcharenko, K.; Bykovyy, P.; Krysovatyy, A.; Komar, M.; Yazlyuk, B. Scenario-adaptive evaluation of trustworthy fine-tuned text models across knowledge-grounded generation and misinformation detection. Mach. Learn. Knowl. Extr. vol. 8(no. 6, Art. no. 161), 2026. [CrossRef]
- Mitchell, M.; Wu, S.; Zaldivar, A.; Barnes, P.; Vasserman, L.; Hutchinson, B.; Spitzer, E.; Raji, I. D.; Gebru, T. Model cards for model reporting. Proc. Conf. Fairness, Accountability, and Transparency (FAT*), Atlanta, GA, USA, 2019; pp. 220–229. [Google Scholar] [CrossRef]
- Silva Filho, T.; Song, H.; Perello-Nieto, M.; Santos-Rodriguez, R.; Kull, M.; Flach, P. Classifier calibration: A survey on how to assess and improve predicted class probabilities. Mach. Learn. 2023, vol. 112(no. 9), 3211–3260. [Google Scholar] [CrossRef]
- Gawlikowski, J.; Tassi, C. R. N.; Ali, M.; Lee, J.; Humt, M.; Feng, J.; et al. A survey of uncertainty in deep neural networks. Artif. Intell. Rev. 2023, vol. 56 suppl. 1, 1513–1589. [Google Scholar] [CrossRef]
- Wankhade, M.; Rao, A. C. S.; Kulkarni, C. A survey on sentiment analysis methods, applications, and challenges. Artif. Intell. Rev. 2022, vol. 55(no. 7), 5731–5780. [Google Scholar] [CrossRef]
- Chandan, M. K.; Mandal, S. A comprehensive survey on sentiment analysis: Framework, techniques, and applications. Comput. Sci. Rev. 2025, vol. 58, Art.(no. 100777). [Google Scholar] [CrossRef]
- Acheampong, F. A.; Wenyu, C.; Nunoo-Mensah, H. Text-based emotion detection: Advances, challenges, and opportunities. Eng. Rep. 2020, vol. 2(no. 7), e12189. [Google Scholar] [CrossRef]
- Tang, R.; Chuang, Y.-N.; Hu, X. The science of detecting LLM-generated text. Commun. ACM 2024, vol. 67(no. 4), 50–59. [Google Scholar] [CrossRef]
- Crothers, E.; Japkowicz, N.; Viktor, H. L. Machine-generated text: A comprehensive survey of threat models and detection methods. IEEE Access 2023, vol. 11, 70977–71002. [Google Scholar] [CrossRef]
- Kehkashan, T.; Riaz, R. A.; Al-Shamayleh, A. S.; Akhunzada, A.; Ali, N.; Hamza, M.; Akbar, F. AI-generated text detection: A comprehensive review of methods, datasets, and applications. Comput. Sci. Rev. vol. 58, Art.(no. 100793), 2025. [CrossRef]
- Page, M. J.; McKenzie, J. E.; Bossuyt, P. M.; Boutron, I.; Hoffmann, T. C.; Mulrow, C. D.; et al. The PRISMA 2020 statement: An updated guideline for reporting systematic reviews. BMJ 2021, vol. 372, Art.(no. n71). [Google Scholar] [CrossRef] [PubMed]
- Alaqad, M. H.; Alkindi, G.; Hussin, M.; Sapar, A. A.; Alaggad, L. A. Benchmarking AI-generated text detection tools in academic writing: An experimental evaluation. Proc. 2026 8th Int. Congr. Hum.-Comput. Interact. Optim. Robot. Appl. (ICHORA) 2026, 1–4. [Google Scholar] [CrossRef]
- Rashidi, H. H.; Fennell, B. D.; Albahra, S.; Hu, B.; Gorbett, T. The ChatGPT conundrum: Human-generated scientific manuscripts misidentified as AI creations by AI text detection tool. J. Pathol. Inform. 2023, vol. 14, Art.(no. 100342). [Google Scholar] [CrossRef] [PubMed]
- Pratama, A. R. The accuracy-bias trade-offs in AI text detection tools and their impact on fairness in scholarly publication. PeerJ Comput. Sci. 2025, vol. 11, Art.(no. e2953). [Google Scholar] [CrossRef] [PubMed]
- An, R.; Yang, Y.; Yang, F.; Wang, S. Use prompt to differentiate text generated by ChatGPT and humans. Mach. Learn. With Appl. 2023, Art. no. 100497. [Google Scholar] [CrossRef]
- Shamsi, A.; Wang, T.; Amraei, M.; Raju, N. V. Evaluating AI text detection tools for distinguishing human-written from AI-generated abstracts in Persian-language journals of library and information science. Acta Inform. Pragensia 2026, vol. 15(no. 1), 126–134. [Google Scholar] [CrossRef]
- Cingillioglu. Detecting AI-generated essays: The ChatGPT challenge. Int. J. Inf. Learn. Technol. 2023, vol. 40(no. 3), 259–268. [Google Scholar] [CrossRef]
- Wu, J.; Wang, J.; Liu, Z.; Chen, B.; Hu, D.; Wu, H.; Xia, S.-T. MoSEs: Uncertainty-aware AI-generated text detection via mixture of stylistics experts with conditional thresholds. Proc. 2025 Conf. Empirical Methods in Natural Language Processing (EMNLP), Suzhou, China, 2025; pp. 5786–5805. [Google Scholar] [CrossRef]
- Chen, Z.; Liu, H.; Tang, J. Zero-shot detection of LLM-generated text via dual-network preference divergence. Expert Syst. With Appl. 2026, vol. 309, Art.(no. 131212). [Google Scholar] [CrossRef]
- Tulchinskii, E.; Kuznetsov, K.; Kushnareva, L.; Cherniavskii, D.; Barannikov, S.; Piontkovskaya, I.; Nikolenko, S.; Burnaev, E. Intrinsic dimension estimation for robust detection of AI-generated texts. Proc. 37th Conf. Neural Information Processing Systems (NeurIPS), 2023; Available online: https://proceedings.neurips.cc/paper_files/paper/2023/hash/7baa48bc166aa2013d78cbdc15010530-Abstract-Conference.html.
- Krishna, K.; Song, Y.; Karpinska, M.; Wieting, J.; Iyyer, M. Paraphrasing evades detectors of AI-generated text, but retrieval is an effective defense. Proc. 37th Conf. Neural Information Processing Systems (NeurIPS), 2023; Available online: https://proceedings.neurips.cc/paper_files/paper/2023/hash/575c450013d0e99e4b0ecf82bd1afaa4-Abstract-Conference.html.
- Fu, J.; Guo, C.-L.; Li, C. DetectAnyLLM: Towards generalizable and robust detection of machine-generated text across domains and models. Proc. 33rd ACM Int. Conf. Multimedia (MM), Dublin, Ireland, 2025; pp. 11229–11238. [Google Scholar] [CrossRef]
- Zhu, X.; Ren, Y.; Cao, Y.; Lin, X.; Fang, F.; Li, Y. Reliably bounding false positives: A zero-shot machine-generated text detection framework via multiscaled conformal prediction. Proc. 63rd Annual Meeting of the Association for Computational Linguistics (ACL), Vienna, Austria, 2025; pp. 12298–12319. [Google Scholar] [CrossRef]
- Kirchenbauer, J.; Geiping, J.; Wen, Y.; Shu, M.; Saifullah, K.; Kong, K.; Fernando, K.; Saha, A.; Goldblum, M.; Goldstein, T. On the reliability of watermarks for large language models. Proc. 12th Int. Conf. Learning Representations (ICLR), 2024; Available online: https://openreview.net/forum?id=DEJIDCmWOz.
- Zhang, Y.; Jiang, X.; Sun, H.; Zhang, Y.; Tong, D. CurveMark: Detecting AI-generated text via probabilistic curvature and dynamic semantic watermarking. Entropy 2025, vol. 27(no. 8, Art. no. 784). [Google Scholar] [CrossRef] [PubMed]
- Wu, J.; Zhan, R.; Wong, D. F.; Yang, S.; Yang, X.; Yuan, Y.; Chao, L. S. DetectRL: Benchmarking LLM-generated text detection in real-world scenarios. Proc. 38th Conf. Neural Information Processing Systems (NeurIPS) Datasets and Benchmarks Track, 2024; Available online: https://proceedings.neurips.cc/paper_files/paper/2024/hash/b61bdf7e9f64c04ec75a26e781e2ad51-Abstract-Datasets_and_Benchmarks_Track.html.
- Tao, Z.; Chen, Y.; Xi, D.; Li, Z.; Xu, W. Toward reliable detection of LLM-generated texts: A comprehensive evaluation framework with CUDRT. ACM Trans. Intell. Syst. Technol. 2026, vol. 17(no. 2, Art. no. 28), 1–35. [Google Scholar] [CrossRef]
- Sadasivan, V. S.; Kumar, A.; Balasubramanian, S.; Wang, W.; Feizi, S. Can AI-generated text be reliably detected? Stress testing AI text detectors under various attacks. Transactions on Machine Learning Research. 2025. Available online: https://openreview.net/forum?id=OOgsAZdFOt.
- Huang, G.; Zhang, J.; Zhang, Y.; Xie, X.; Yang, W.; Cui, Z. Are AI-generated text detectors robust to adversarial perturbations? Proc. 62nd Annual Meeting of the Association for Computational Linguistics (ACL), 2024. [Google Scholar]
- Yin, Z.; Wang, S. Span-level detection of AI-generated scientific text via contrastive learning and structural calibration. Knowl.-Based Syst. 2026, vol. 334, Art.(no. 115123). [Google Scholar] [CrossRef]
- Hu, X.; Chen, P.-Y.; Ho, T.-Y. RADAR: Robust AI-text detection via adversarial learning. Proc. 37th Conf. Neural Information Processing Systems (NeurIPS), 2023. [Google Scholar]
- Lau, H. T.; Zubiaga, A. Understanding the effects of human-written paraphrases in LLM-generated text detection. Nat. Lang. Process. J. vol. 11, Art.(no. 100151), 2025. [CrossRef]
- Wu, C.; Cheung, Y.-M.; Han, B.; Lian, D. Advancing machine-generated text detection from an easy to hard supervision perspective. Proc. 39th Conf. Neural Information Processing Systems (NeurIPS), San Diego, CA, USA, 2025; Available online: https://openreview.net/forum?id=BUkXhMb7ml.
- Ayoobi, N.; et al. ESPERANTO: Evaluating synthesized phrases to enhance robustness in AI detection for text origination. Proc. 36th ACM Conf. Hypertext and Social Media (HT), Chicago, IL, USA, 2025; pp. 1–10. [Google Scholar] [CrossRef]
- Abburi, H.; Pudota, N.; Veeramani, B.; Bowen, E.; Bhattacharya, S. Toward robust generative AI text detection: Generalizable neural model. Proc. 2024 Int. Conf. Machine Learning and Applications (ICMLA), 2024; pp. 1651–1656. [Google Scholar]
- Jaffali, S. Robust sentiment analysis through Bayesian dropout-enhanced RoBERTa-LSTM. BRAIN Broad Res. Artif. Intell. Neurosci. 2025, vol. 16(no. 4), 113–129. [Google Scholar] [CrossRef]
- He, J.; Yu, S.; Gutiérrez-Basulto, V.; Pan, J. Z. N2C2: Nearest neighbor enhanced confidence calibration for cross-lingual in-context learning. Procedia Comput. Sci. 2025, vol. 264, 94–103. [Google Scholar] [CrossRef]
- Hashimoto, W.; Kamigaito, H.; Watanabe, T. Efficient nearest neighbor based uncertainty estimation for natural language processing tasks. Find. Assoc. Comput. Linguist. NAACL 2025 2025, 4350–4366. [Google Scholar] [CrossRef]
- Andersen, J. S.; Schöner, T.; Maalej, W. Word-level uncertainty estimation for black-box text classifiers using RNNs. Proc. 28th Int. Conf. Computational Linguistics (COLING), Barcelona, Spain, 2020; pp. 5541–5546. [Google Scholar]
- Wu, Y.; Shi, B.; Chen, J.; Liu, Y.; Dong, B.; Zheng, Q.; Wei, H. Rethinking sentiment analysis under uncertainty. Proc. 32nd ACM Int. Conf. Information and Knowledge Management (CIKM), Birmingham, U.K., 2023; pp. 2775–2784. [Google Scholar] [CrossRef]
- He, J.; Zhang, X.; Lei, S.; Chen, Z.; Chen, F.; Alhamadani, A.; Xiao, B.; Lu, C.-T. Towards more accurate uncertainty estimation in text classification. Proc. 2020 Conf. Empirical Methods in Natural Language Processing (EMNLP), 2020; pp. 8362–8372. [Google Scholar] [CrossRef]
- Holm, A. N.; Wright, D.; Augenstein, I. Revisiting softmax for uncertainty approximation in text classification. Information 2023, vol. 14(no. 7, Art. no. 420). [Google Scholar] [CrossRef]
- Xin, J.; Tang, R.; Yu, Y.; Lin, J. The art of abstention: Selective prediction and error regularization for natural language processing. Proc. 59th Annual Meeting of the Association for Computational Linguistics and 11th Int. Joint Conf. Natural Language Processing (ACL-IJCNLP), 2021; pp. 1040–1051. [Google Scholar]
- Ficsor, T.; Berend, G. SUE: Sparsity-based uncertainty estimation via sparse dictionary learning. Proc. 2025 Conf. Empirical Methods in Natural Language Processing (EMNLP), Suzhou, China, 2025; pp. 32912–32929. [Google Scholar]
- Xiao, Y.; Wang, W. Y. Quantifying uncertainties in natural language processing tasks. Proc. AAAI Conf. Artif. Intell. 2019, vol. 33(no. 1), 7322–7329. [Google Scholar] [CrossRef]
- Liu, Z.; Si, S.; Gu, J. Calibrating sentiment analysis: A unimodal-weighted label distribution learning approach. IEEE Access 2025, vol. 13, 148816–148826. [Google Scholar] [CrossRef]
- Van Landeghem, J.; Blaschko, M.; Anckaert, B.; Moens, M.-F. Benchmarking scalable predictive uncertainty in text classification. IEEE Access 2022, vol. 10, 43703–43737. [Google Scholar] [CrossRef]
- Chai, Y.; Xie, H.; Qin, J. S. Semantic-preserved augmentation with reliability-aware fine-tuning for aspect category sentiment analysis. Pattern Recognit. 2026, vol. 179, pt. B, Art.(no. 113629). [Google Scholar] [CrossRef]
- Pei, J.; Wang, C.; Szarvas, G. Transformer uncertainty estimation with hierarchical stochastic attention. Proc. AAAI Conf. Artif. Intell. 2022, vol. 36(no. 10), 11147–11155. [Google Scholar] [CrossRef]
- Mena, J.; Brando, A.; Pujol, O.; Vitrià, J. “Uncertainty estimation for black-box classification models: A use case for sentiment analysis,” in Pattern Recognition and Image Analysis (IbPRIA 2019). In Lecture Notes in Computer Science; Madrid, Spain, 2019; vol. 11867, pp. 29–40. [Google Scholar] [CrossRef]
- Hosseini, M.; Caragea, C. Calibrating student models for emotion-related tasks. Proc. 2022 Conf. Empirical Methods in Natural Language Processing (EMNLP), Abu Dhabi, UAE, 2022; pp. 9266–9278. [Google Scholar]
- Alrasheedy, M. N.; Tiun, S.; Fauzi, F. When emotions conflict: A reliability-aware framework for Arabic multi-label emotion detection. Technologies 2026, vol. 14(no. 7, Art. no. 404). [Google Scholar] [CrossRef]
- Roohi, S.; Skarbez, R.; Nguyen, H. D. Reliable uncertainty estimation in emotion recognition in conversation using conformal prediction framework. Nat. Lang. Process. 2025, vol. 31(no. 5), 1163–1186. [Google Scholar] [CrossRef]
- Dong, H.; Bao, Z.; Li, M.; Yang, Z. Emotion meets coordination: Designing multi-agent LLMs for fine-grained user sentiment detection on social media. PLoS ONE vol. 21(no. 2), Art. no. e0342053, 2026. [CrossRef] [PubMed]
- Roohi, S.; Skarbez, R.; Nguyen, H. Enhancing the reliability of affect recognition in social platforms with conformal prediction. Intell. Comput. 2026, vol. 5, Art.(no. 0527). [Google Scholar] [CrossRef]
- Jakhete, S. A.; Kulkarni, N. Weighted confidence scoring for context-aware emotion recognition using fine-tuned DeBERTa. Proc. 2025 IEEE Int. Conf. Blockchain and Distributed Systems Security (ICBDS), Kolhapur, India, 2025. [Google Scholar] [CrossRef]
- Alies, R.; Merdjanovska, E.; Akbik, A. Measuring label ambiguity in subjective tasks using predictive uncertainty estimation. Proc. 19th Linguistic Annotation Workshop (LAW-XIX), Vienna, Austria, 2025; pp. 21–34. [Google Scholar] [CrossRef]
- Kulkarni, P. R.; Agrawal, A. Hybrid transformer–logistic regression framework with uncertainty modeling for fine-grained emotion classification. Proc. 2026 2nd Int. Conf. Computing, Communication and Green Engineering (CCGE), Pune, India, 2026. [Google Scholar] [CrossRef]
- Hazim, L. R.; Ata, O. HQML-NLP: A hybrid quantum machine learning framework for scholarly AI-text detection. Appl. Soft Comput. 2026, vol. 191, Art.(no. 114634). [Google Scholar] [CrossRef]
- Hwang, J.; Gudumotu, C. E.; Ahmadnia, B. Uncertainty quantification of text classification in a multi-label setting for risk-sensitive systems. Proc. 14th Int. Conf. Recent Advances in Natural Language Processing (RANLP), Varna, Bulgaria, 2023; pp. 541–547. [Google Scholar]
- Su, J.; Luo, J.; Wang, H.; Cheng, L. API is enough: Conformal prediction for large language models without logit-access. Find. Assoc. Comput. Linguist. EMNLP 2024 2024, 979–995. [Google Scholar] [CrossRef]
- Campos, M. M.; Farinhas, A.; Zerva, C.; Figueiredo, M. A. T.; Martins, A. F. T. Conformal prediction for natural language processing: A survey. Trans. Assoc. Comput. Linguist. 2024, vol. 12, 1497–1516. [Google Scholar] [CrossRef]
- Yuan, L.; Chen, Y.; Cui, G.; Gao, H.; Zou, F.; Cheng, X.; Ji, H.; Liu, Z.; Sun, M. Revisiting out-of-distribution robustness in NLP: Benchmark, analysis, and LLMs evaluations. Proc. 37th Conf. Neural Information Processing Systems (NeurIPS) Datasets and Benchmarks Track, 2023; Available online: https://proceedings.neurips.cc/paper_files/paper/2023/hash/b6b5f50a2001ad1cbccca96e693c4ab4-Abstract-Datasets_and_Benchmarks.html.
- Shi, Y.; Ghosh, S.; Belkhouja, T.; Doppa, J. R.; Yan, Y. Conformal prediction for class-wise coverage via augmented label rank calibration. Proc. 38th Conf. Neural Information Processing Systems (NeurIPS), 2024; Available online: https://proceedings.neurips.cc/paper_files/paper/2024/hash/ee66188f019df7199c4c06320f698fa1-Abstract-Conference.html.
- Petryshak, T.; Vysotska, V. Evaluating the generalization ability of AI-generated text detectors to unseen generators. Bull. Natl. Tech. Univ. “KhPI”. Ser. Syst. Anal. Control Inf. Technol. 2026, no. 1(15), 99–103. [Google Scholar] [CrossRef]
- Ulmer, D.; Frellsen, J.; Hardmeier, C. Exploring predictive uncertainty and calibration in NLP: A study on the impact of method & data scarcity. Find. Assoc. Comput. Linguist. EMNLP 2022 2022, 2707–2735. [Google Scholar] [CrossRef]
- Shelmanov, A.; Tsymbalov, E.; Puzyrev, D.; Fedyanin, K.; Panchenko, A.; Panov, M. How certain is your Transformer? Proc. 16th Conf. European Chapter of the Association for Computational Linguistics (EACL), Online, 2021; pp. 1833–1840. [Google Scholar] [CrossRef]
- Fisch, I.I.; Jaakkola, T.; Barzilay, R. Calibrated selective classification. Transactions on Machine Learning Research. 2022. Available online: https://openreview.net/forum?id=zFhNBs8GaV.
- Jiang, Z.; Liu, A.; Van Durme, B. Calibrating zero-shot cross-lingual (un-)structured predictions. Proc. 2022 Conf. Empirical Methods in Natural Language Processing (EMNLP), Abu Dhabi, UAE, 2022; pp. 2648–2674. [Google Scholar] [CrossRef]
- Albzour, N. Beyond accuracy: Reliability of imbalance-handling strategies for fine-grained emotion classification. SSRN Prepr. 2026. [Google Scholar] [CrossRef]
- Albzour, N. Reliability-aware BERT-based emotion classification via probability calibration and selective prediction. SSRN Prepr. 2026. [Google Scholar] [CrossRef]
- Albzour, N.; Lam, S. S. Reliability-aware Hybrid-K ensemble selection for cervical cytology classification: Integrating discrimination, calibration, and selective prediction. arXiv 2026, arXiv:2609.09189. [Google Scholar] [CrossRef]
Figure 1.
Evolution of reliability-aware evaluation in text classification.
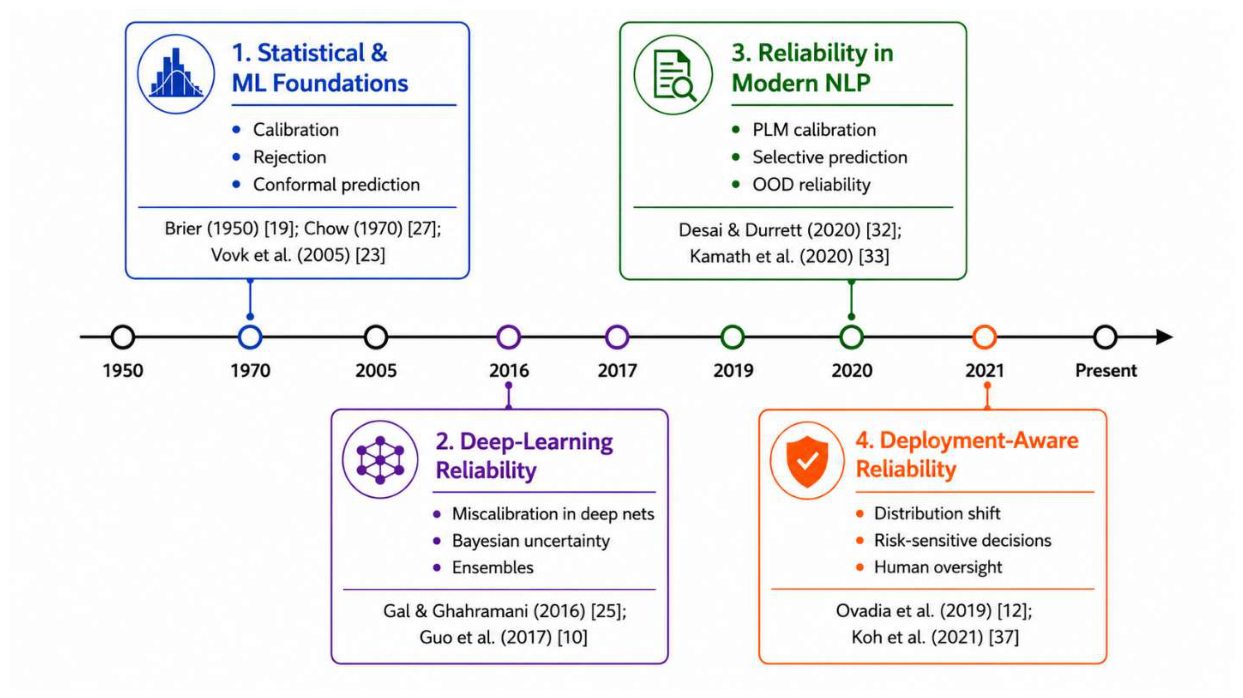
Figure 2.
Conceptual framework for reliability-aware text classification across the two review branches: emotion and sentiment analysis and AI-generated text detection.
Figure 2.
Conceptual framework for reliability-aware text classification across the two review branches: emotion and sentiment analysis and AI-generated text detection.
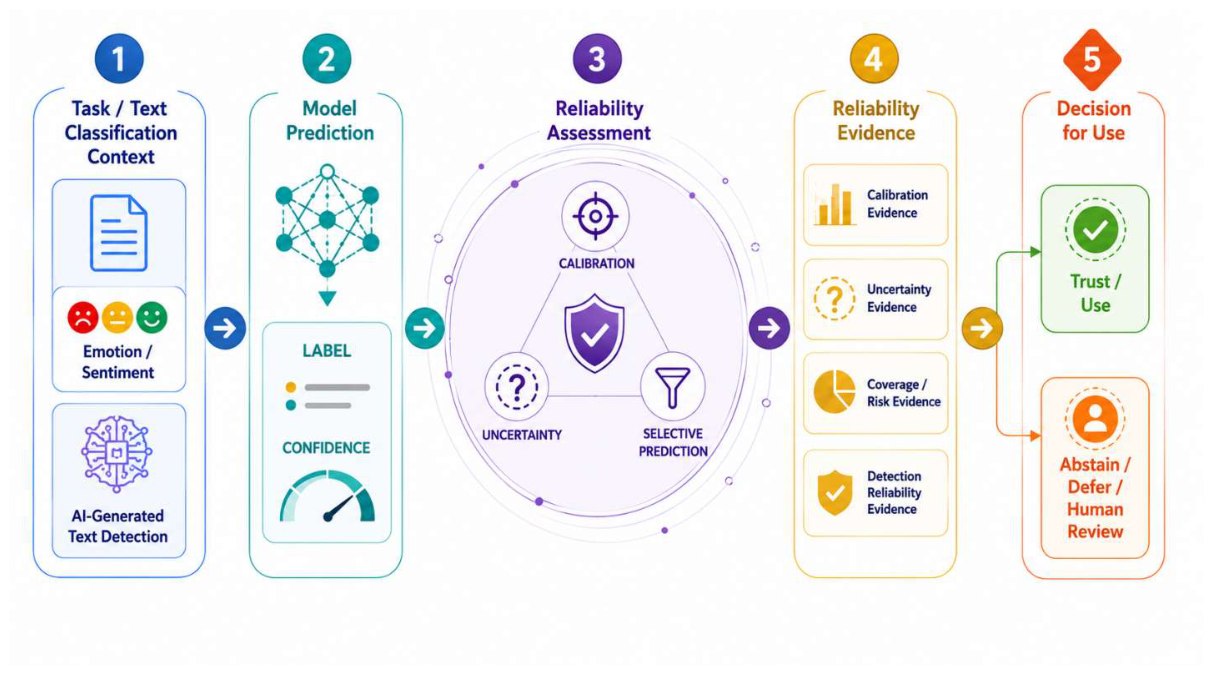
Figure 3.
PRISMA study-selection flow (n = 51).
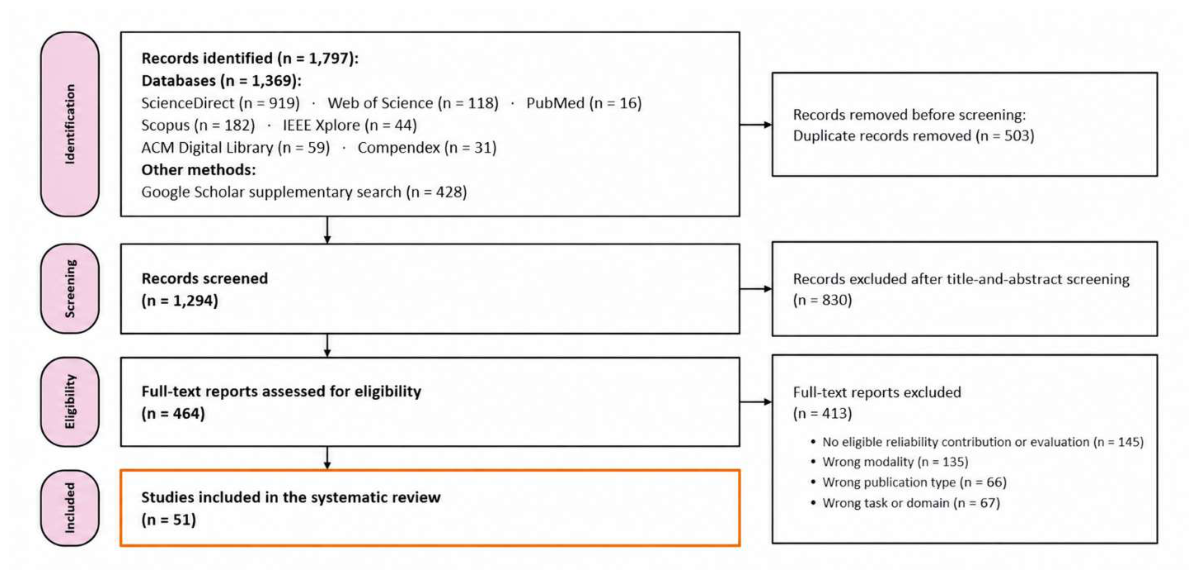
Figure 4.
Eligible publications per year (n = 51; 2026 is a partial year, January–July).
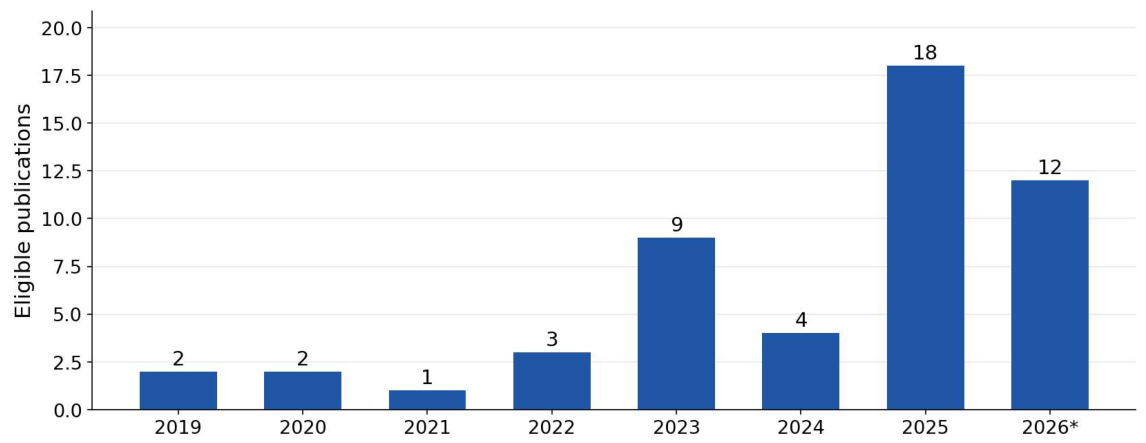
Figure 5.
Dataset/text-language distribution across the included studies (n = 51; counts non-exclusive). A study may contribute to more than one language category. Other individual languages (11 language assignments; each language appears once): Persian, Arabic, Algerian Arabic, French, German, Italian, Japanese, Polish, Russian, Spanish, and Ukrainian.
Figure 5.
Dataset/text-language distribution across the included studies (n = 51; counts non-exclusive). A study may contribute to more than one language category. Other individual languages (11 language assignments; each language appears once): Persian, Arabic, Algerian Arabic, French, German, Italian, Japanese, Polish, Russian, Spanish, and Ukrainian.
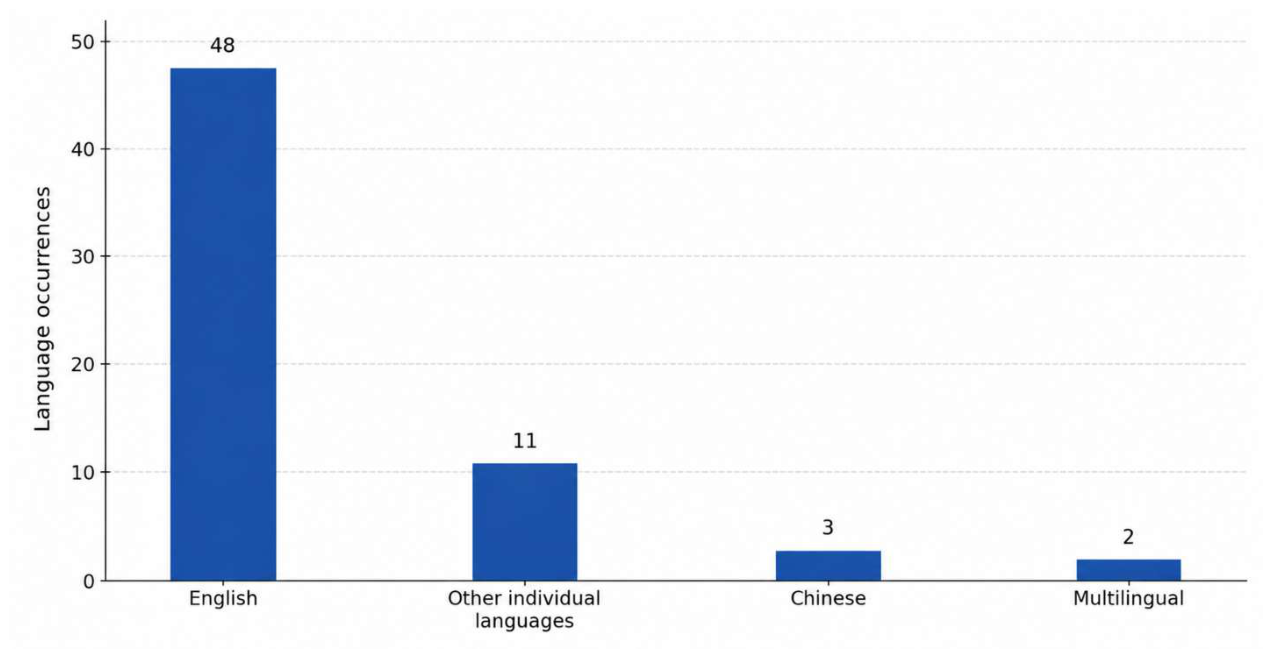
Figure 6.
Five-dimensional taxonomy of reliability evaluation in NLP across 51 included studies. Task Category is mutually exclusive, whereas Model Type, Reliability Approaches, Reliability Evaluation Evidence, and Reliability Validation are non-mutually exclusive. Model/version shift is treated as a research gap rather than a taxonomy category.
Figure 6.
Five-dimensional taxonomy of reliability evaluation in NLP across 51 included studies. Task Category is mutually exclusive, whereas Model Type, Reliability Approaches, Reliability Evaluation Evidence, and Reliability Validation are non-mutually exclusive. Model/version shift is treated as a research gap rather than a taxonomy category.
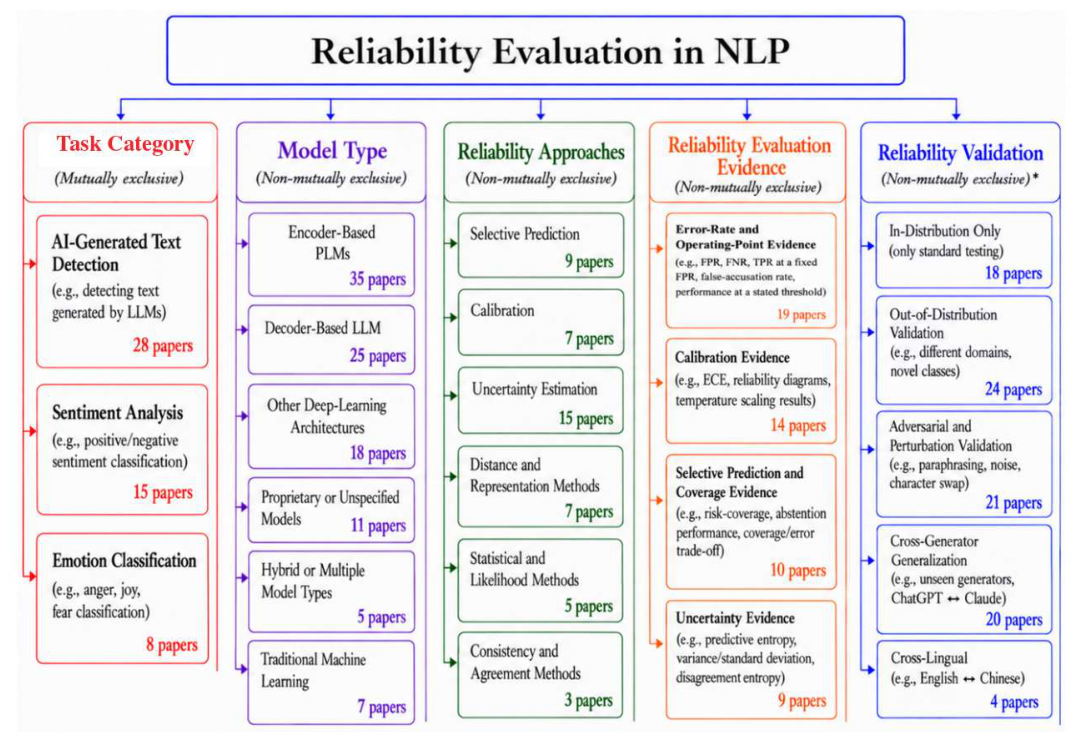
Figure 7.
Distribution of Reliability Approaches across task categories (n = 51 studies; approach assignments counted non-exclusively).
Figure 7.
Distribution of Reliability Approaches across task categories (n = 51 studies; approach assignments counted non-exclusively).
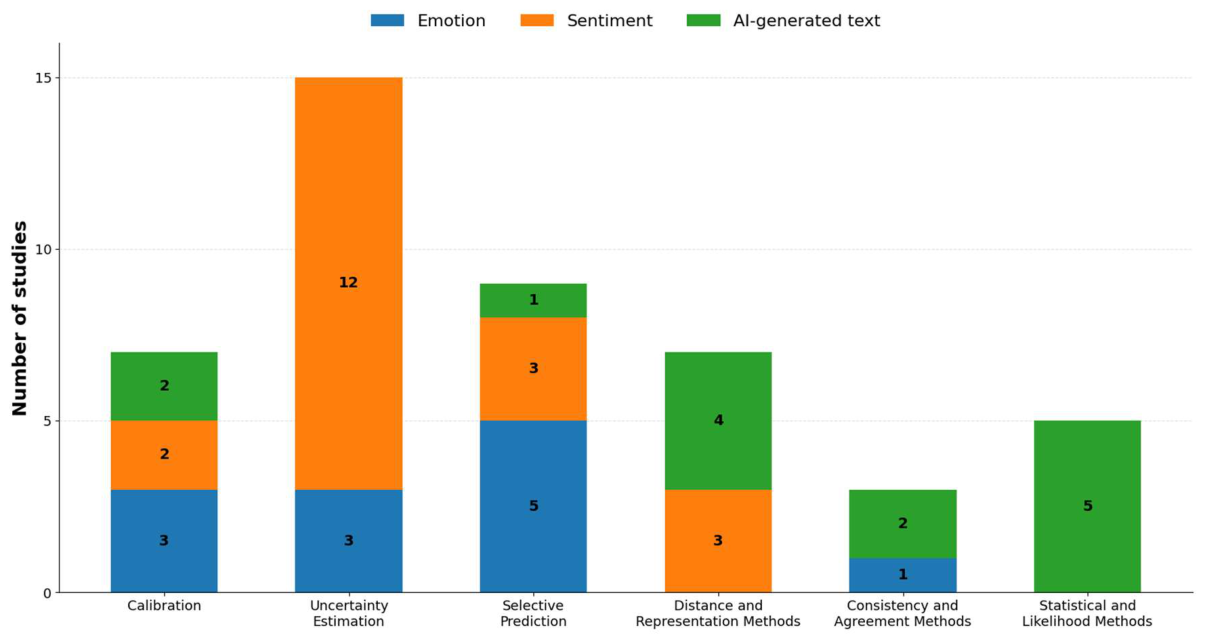
Figure 8.
Key reliability gaps in emotion and sentiment classification (Branch 1).
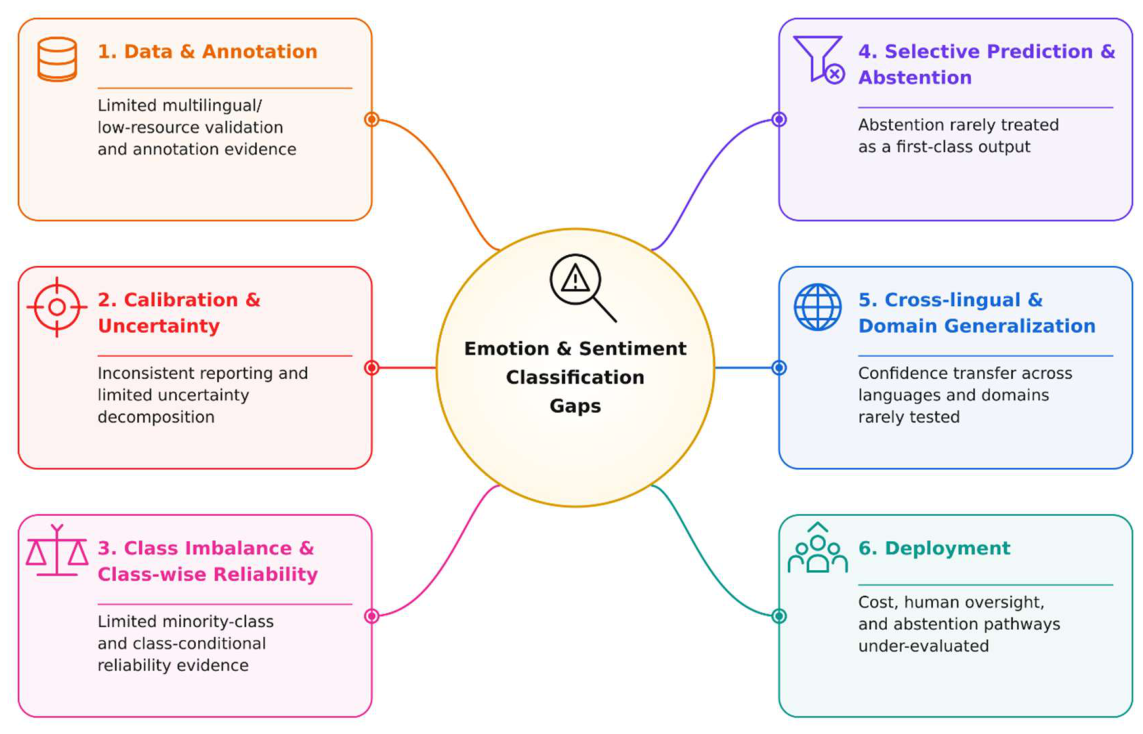
Figure 9.
Key reliability gaps in AI-generated text detection (Branch 2).
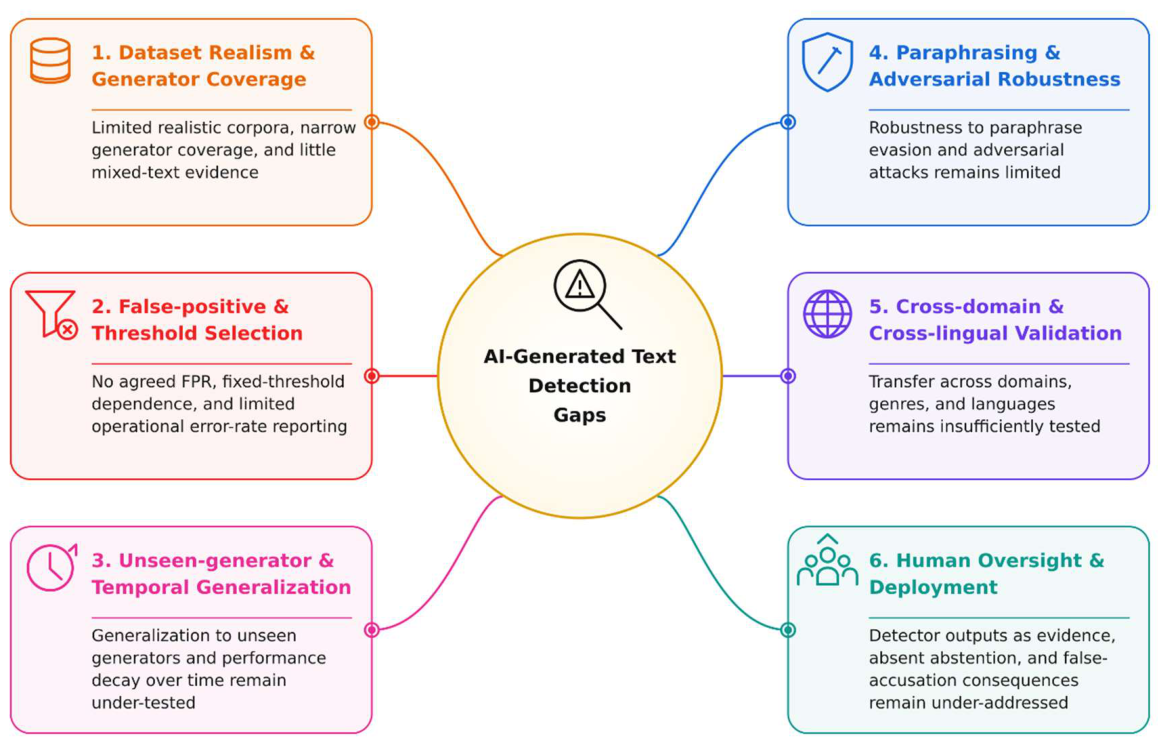
Table 1.
Core Boolean search strategies by review branch.
| Review branch | Core Boolean search strategy |
| Branch 1: Emotion classification and sentiment analysis | (“emotion classification” OR “emotion recognition” OR “emotion detection” OR “sentiment classification” OR “sentiment analysis”) AND (“confidence calibration” OR “uncertainty estimation” OR “uncertainty quantification” OR “confidence estimation” OR “selective prediction” OR abstention OR reliability OR trustworthiness) |
| Branch 2: AI-generated text detection | (“AI-generated text” OR “machine-generated text” OR “LLM-generated text” OR “ChatGPT-generated text”) AND (“confidence calibration” OR “uncertainty estimation” OR “uncertainty quantification” OR “selective prediction” OR abstention OR reliability OR trustworthiness OR “false positive” OR “false negative”) |
Table 2.
Summary of key findings by task category (Section 4.1).
Table 2.
Summary of key findings by task category (Section 4.1).
| Task category (n) | Key findings | Reliability implication |
| AI-Generated Text Detection (28) | False-positive rates vary widely across tools, from 15.6% to 30.6% across five commercial detectors [50] and up to 8.6% of known-human abstracts [51]. A detector with 0.99 in-domain accuracy falls to 0.39–0.69 off-domain [58], paraphrasing evades detectors [59,66], and conformal prediction can bound false positives [61]. | Reliability depends on the operating point and on generalization across domains, generators, and attacks; it cannot be inferred from a headline aggregate score. |
| Sentiment Analysis (15) | Sentiment is used mainly as an evaluation surface for calibration, uncertainty estimation, distance-based confidence, and abstention [74,75,76,77,78,79,80,81,82,83,84,85,86,87,88]. Strong predictive accuracy can coexist with poor calibration [84]. | Confidence is judged against human labels that may contain disagreement; direct comparisons of competing reliability strategies under a common protocol remain uncommon. |
| Emotion Classification (8) | Label spaces are finer, more subjective, and often multi-label. Predictive uncertainty tracks annotator entropy only weakly [95], and per-class accuracy falls from 0.83 on a majority class to 0.03 on a minority emotion [91]. | Aggregate calibration can conceal poor reliability for minority emotions; naming a reliability concern is not the same as evidencing it [74]. |
| Across task categories (51) | Detection centers on error behavior at a chosen operating point; sentiment and emotion center on the meaning of confidence in subjective label spaces. The concerns overlap, with calibration error in detection [68,97] and out-of-distribution behavior in sentiment and emotion [87,88,89]. | The task categories differ in their center of gravity rather than in holding disjoint reliability concerns. |
Table 3.
Summary of key findings by Model Type (Section 4.2).
Table 3.
Summary of key findings by Model Type (Section 4.2).
| Model Type (n) | Key findings | Reliability implication |
| Encoder-Based PLMs (35) | Appear across all three task categories and support calibration [68,75,90], uncertainty estimation [95], selective prediction [81], distance-based confidence [58,60,76], and detector auditing [51]. | Fine-tuning and access to logits and hidden representations make encoders the broadest substrate for reliability interventions. |
| Decoder-Based LLMs (25) | Concentrated in detection, where the decoder is usually the generator whose output is judged [50,54,57,59,61,62,63,66,69,72,73]; outside detection, the decoder can be the classifier being assessed [93]. | The evolving population of generators changes the reliability problem and motivates cross-generator and version-sensitive validation. |
| Other Deep-Learning Architectures (18) | Recurrent, convolutional, and other non-transformer components carrying variational, dropout, ensemble, label-distribution, and calibration mechanisms [68,77,79,80,81,83,84,85,88]. | Training-time, stochastic, and architecture-level mechanisms generally require more model access than output-only auditing. |
| Proprietary or Unspecified Models (11) | Dominated by detection-tool audits and detection studies [4,17,18,50,52,54,55,59,60,72]; one black-box sentiment study estimates uncertainty without model internals [88]. | Output-only access shifts evaluation to what outputs reveal, and commercial configurations can change without notice; access constraints apply only where a model is known to be proprietary. |
| Hybrid or Multiple Model Types (5) | Studies combine or compare model types [73,74,80,86,96]. | The count is too small for broad generalization, but mixed designs can separate architecture-robust reliability effects from model-specific ones. |
| Traditional Machine Learning (7) | Always used alongside another Model Type, typically as a feature-based or statistical baseline [55,56,58,72,74,94,96]. | Simpler models make operating points easier to inspect but do not remove the need for reliability-specific evidence. |
| Model-access synthesis | Retraining, internal representations, and repeated stochastic passes require model control, whereas output-level procedures such as conformal prediction need only scores and calibration data [61]. | Some cross-branch differences in reliability methodology reflect model-access conditions as well as the reliability problem itself. |
Table 4.
Summary of key findings by Reliability Approach (Section 4.3).
Table 4.
Summary of key findings by Reliability Approach (Section 4.3).
| Reliability Approach (n) | Key findings | Reliability implication |
| Selective Prediction (9) | 5 emotion, 3 sentiment, and 1 detection study. Conformal prediction sets [91,93] and a distribution-free false-positive bound [61] give the clearest formal control; [81] is the clearest abstention example. | Allowing a system to withhold or hedge a prediction is a different reliability act from tuning a forced decision threshold. |
| Calibration (7) | 3 emotion, 2 sentiment, and 2 detection studies, using temperature scaling or score correction [68,90,96,97], nearest-neighbor calibration [75], calibrated distillation [89], and a calibration-targeted training objective [84]. | Calibration is not confined to subjective-label tasks, but a correction fitted in distribution is not automatically reliable after domain, language, or generator shift. |
| Uncertainty Estimation (15) | Confined to sentiment and emotion: MC dropout and variational Bayesian methods, ensembles and self-ensembling, and evidential, interval, entropy, and heteroscedastic variants [74,77,78,79,80,81,82,83,84,85,87,88,90,95,96]. Few studies decompose data and model uncertainty [83] or compare approximations directly [78,85]. | Uncertainty fidelity trades off against computational cost, particularly for ensembles [78,79,84,85,95]. |
| Distance and Representation Methods (7) | Branch 1 studies rescale or complement confidence with neighborhood information [75,76,79]; detection studies compare inputs against reference representations or retrieval signals [56,58,59,60]. | The signal is independent of model outputs but only as stable as the representation space and reference set. |
| Consistency and Agreement Methods (3) | Reliability is inferred from stability across agents, perturbations, or denoising views [67,68,92]. | The approach captures confident decisions that reverse under meaning-preserving change, yet it remains rare despite strong perturbation evidence. |
| Statistical and Likelihood Methods (5) | Confined to detection; likelihood relationships and detection statistics inform text provenance [17,57,62,63,66]. | Distributional properties of generated text can serve as both the detection signal and the basis of a reliability-aware operating rule. |
| Approach-level synthesis | Approaches trade off along computational burden, model access, and evidence quality; threshold tuning and broad reliability-aware training are not counted as Reliability Approaches. | A technically sophisticated approach may still be evaluated with metrics too weak to demonstrate the reliability property it claims. |
Table 5.
Summary of key findings by Reliability Evaluation Evidence category (Section 4.4).
Table 5.
Summary of key findings by Reliability Evaluation Evidence category (Section 4.4).
| Evidence category (n) | Key findings | Reliability implication |
| Error-Rate and Operating-Point Evidence (19) | The largest reliability-specific category. FPR is the most frequently reported named reliability metric (15 studies) and TPR at a fixed FPR appears in 10 [57,58,59,61,62,66,71]; detector audits expose reliability through false-positive behavior [4,50,51,52,72]. | These measures capture asymmetric error costs and decision behavior that aggregate accuracy or AUROC can obscure. |
| Calibration Evidence (14) | Concentrated in sentiment and emotion; ECE is reported in 13 studies, with Brier score, MCE, ACE, NLL, and reliability diagrams used less often. Some studies demonstrate overconfidence [84,85,91], whereas others only invoke it as motivation [82,87,96]. | A single aggregate ECE value can conceal severe miscalibration for a minority class or specific label. |
| Selective Prediction and Coverage Evidence (10) | Empirical coverage and prediction-set size in conformal settings [91,93], interval width [78], and AURC/E-AURC or risk-coverage in Branch 1 studies [76,79,80,81,82,90]. | No detection study reports risk-coverage or AURC evidence, although referral to human review is a consequential abstention decision. |
| Uncertainty Evidence (9) | Predictive entropy is the most visible measure; aleatoric, epistemic, and total uncertainty are reported in only a small subset [77,83]. | Without decomposition, an uncertainty score cannot show whether an input is ambiguous or outside the model’s knowledge. |
| Predictive-performance versus reliability-specific evidence | Accuracy appears in 33 studies, F1 in 23, AUROC in 17, and precision and recall in 16 each; 9 studies report no reliability-specific metric despite addressing a reliability concern. | The key distinction is between what a study claims about reliability and what its evidence actually demonstrates. |
Table 6.
Summary of key findings by Reliability Validation category (Section 4.5).
Table 6.
Summary of key findings by Reliability Validation category (Section 4.5).
| Validation category (n) | Key findings | Reliability implication |
| In-Distribution Only (18) | Mostly sentiment and emotion studies [74,77,79,81,82,83,84,86,90,91,93,94,95,96], plus a smaller number of detection studies [17,53,55,97]. | In-distribution evidence establishes reliability only under conditions most similar to development data. |
| Out-of-Distribution Validation (24) | Common in detection [57,58,59,60,61,63,64,65,66,67,69,71,72]; a detector falls from 0.99 in-domain accuracy to 0.39–0.69 off-domain [58]. Less common in sentiment and emotion [76,78,85,87,88,89]. | Strong in-domain performance does not guarantee transfer. |
| Adversarial and Perturbation Validation (21) | Concentrated in detection, including paraphrasing [59,66], back-translation [72], character- and word-level edits [18,67], and generation-side manipulation [57]; rare in Branch 1 [80,92]. | The corpus rarely tests whether Branch 1 confidence signals survive meaning-preserving changes, which is not evidence that those methods are fragile. |
| Cross-Generator Generalization (20) | Specific to detection and tested across likelihood, watermark, distance-based, consistency, calibration, and conformal detectors and tool audits [52,54,57,58,59,60,61,62,63,64,65,66,67,68,69,70,71,72,73]. | Evidence from one generator family cannot be assumed to transfer; some studies show that cross-generator robustness can be improved by design [58,60,67,71]. |
| Cross-Lingual Validation (4) | The least populated category [57,58,65,75]; English appears in 48 of 51 studies. A single non-English dataset without a second language condition is excluded [54]. | The evidence base for cross-lingual reliability is narrower than the presence of multilingual data suggests. |
| Additional deployment-relevant gaps | Non-native writing is examined in [52,58,73]; no study evaluates reliability across successive generator or tool versions [51,52]. | Equity consequences of detector errors and model/version shift remain untested gaps rather than taxonomy categories. |
| Validation-level synthesis | In-distribution evidence is often offered for claims about generalization, robustness, or transfer [60,88,93,96]. | Shifted and adversarial validation is routine in detection but occasional in sentiment and emotion. |
Disclaimer/Publisher’s Note: The statements, opinions and data contained in all publications are solely those of the individual author(s) and contributor(s) and not of MDPI and/or the editor(s). MDPI and/or the editor(s) disclaim responsibility for any injury to people or property resulting from any ideas, methods, instructions or products referred to in the content. |
© 2026 by the authors. Licensee MDPI, Basel, Switzerland. This article is an open access article distributed under the terms and conditions of the Creative Commons Attribution (CC BY) license.
Copyright: This open access article is published under a Creative Commons CC BY 4.0 license, which permit the free download, distribution, and reuse, provided that the author and preprint are cited in any reuse.