
Submitted:
21 September 2026
Posted:
30 September 2026
You are already at the latest version
Abstract
This study examines the effects of cutting speed, feed rate, and depth of cut on cutting force, vibra-tion, surface roughness, and geometric accuracy during dry turning of C45 steel (EN 1.0503) using a Taguchi L9 orthogonal design. Cutting force, RMS acceleration, surface roughness (Ra and Rz), and form deviations (straightness, roundness, and cylindricity) were measured for nine machining conditions. Vibration decreased with increasing cutting speed and increased with increasing depth of cut, whereas cutting force showed no consistent dependence on cutting speed and increased at the largest depth of cut. Ra and Rz were generally lower at higher cutting speeds. The maximum active cutting force was 730.60 N in Experiment 7, while the maximum RMS vibration was 19.09 m/s² in Experiment 3. Exploratory Pearson analysis across the nine conditions indicated r = 0.678 between vibration and Ra, r = −0.769 between vibration and cylindricity deviation, and r = 0.329 between cutting force and vibration. Because no independent machining repetitions were performed, these relationships are descriptive and do not establish causality, statistical factor significance, or a vali-dated predictive model. The study therefore presents the integrated force–vibration–surface–geometry measurements as a process-screening framework and identifies methodological re-quirements for subsequent replicated and frequency-resolved experiments.
Keywords:
turning of C45
; cutting force
; vibration
; surface roughness
; cylindricity
; process monitoring
; MPU6050 sensor
1. Introduction
Among engineering materials, medium-carbon steels occupy an important position because they offer a favorable balance between strength, toughness, wear resistance, and economic viability. One of the most widely used grades is C45 steel (EN 1.0503), which contains approximately 0.45% carbon and is commonly employed in the manufacture of shafts, gears, bushings, pins, connecting rods, and other mechanical components subjected to moderate and high loads[1]. Unlike alloyed steels, the properties of C45 are primarily determined by its carbon content and heat-treatment condition rather than by significant additions of alloying elements such as chromium, nickel, or molybdenum [2]. In the normalized condition, C45 typically exhibits a ferritic–pearlitic microstructure, while quenching and tempering produce a tempered martensitic structure with improved hardness and strength [3]. These characteristics make C45 steel particularly suitable for applications requiring a balance between mechanical performance and machinability, such as cutting forces, vibration behavior, surface roughness, and geometric accuracy during turning operations.
C45 steel is popular for its mechanical properties and suitability for heat-treatment processes such as quenching and tempering [2]. Although C45 steel is generally considered machinable, cutting conditions, tool geometry, chip formation, thermal effects, and tool wear can still affect practical machining performance [4,5]. These factors can influence surface roughness, dimensional accuracy, geometric tolerances, and tool life. Consequently, understanding C45 steel behavior during turning operations is important for selecting favorable machining conditions and ensuring consistent product quality. Cutting force is one of the most important indicators of machining performance. Cutting forces arise from the interaction between the cutting tool and the workpiece material and drive material removal during turning. The magnitude of these forces directly influences power consumption, tool wear, vibration, dimensional accuracy, and surface integrity [6]. Therefore, analyzing cutting forces provides valuable information regarding machinability and process stability. During turning, the resultant cutting force can be resolved into three orthogonal components, as illustrated in Figure 1. These components are the tangential cutting force, the axial force, and the radial force. Figure 1. These components are the tangential cutting force , the axial force , and the radial force .
The tangential force (, acts in the direction of workpiece rotation and represents the primary cutting force responsible for material shearing. This force accounts for the largest proportion of energy consumption during machining and strongly influences tool wear and cutting power requirements. The axial forceacts parallel to the workpiece axis and opposite to the feed direction. It affects the feed mechanism and contributes to the longitudinal loading of both the cutting tool and the workpiece. Excessive axial forces can cause tool deflection and dimensional inaccuracies. The radial force acts perpendicular to the machined surface toward the workpiece’s center. Although it does not directly contribute to material removal, it plays a significant role in process stability by influencing tool deflection, vibration generation, and geometric accuracy. High radial forces often increase chatter, degrade surface finish, and cause dimensional errors. The combined effect of these three force components is represented by the resultant cutting force , which can be calculated using Equation (1):
The resultant force represents the total mechanical load acting on the cutting tool during machining and provides an overall indication of cutting severity. In addition to cutting forces, vibration is another critical factor affecting machining performance. Machining vibrations, often referred to as chatter, can significantly reduce process stability and product quality. Excessive vibration may lead to increased tool wear, poor surface finish, dimensional inaccuracies, reduced tool life, and even damage to machine tool components [7].
Taylor conducted the earliest investigations of machining vibrations and identified vibration as a major limitation to machining productivity [8]. Subsequently, researchers such as Arnold [9], Tobias and Fishwick [10], and Tlusty et al. [11] established the theoretical foundations of machining stability and regenerative chatter phenomena. Their work showed that variations in chip thickness and cutting forces can lead to self-excited vibrations that compromise machining quality. Like cutting forces, machining vibration can be resolved into three orthogonal directions: tangential vibration (Vt), radial vibration (Vr), and axial vibration (Va). In the present study, Vt, Vr, and Va denote measured acceleration components, expressed in m/s². The reported effective vibration is defined from the tangential and radial acceleration components as the resultant acceleration magnitude (Ve), as given by Equation (2). Accordingly, Equation (2) represents acceleration rather than displacement or velocity.
In this study, we excluded the axial acceleration component from the reported vibration magnitude because the analysis focused on the tangential and radial directions. We calculated the effective vibration magnitude from these two acceleration components and then obtained the RMS value over the recorded time history. We use this RMS acceleration as a scalar process-monitoring indicator; it is not interpreted as vibration displacement. Because the original measurement workflow did not include frequency-domain processing, we did not derive frequency-specific displacement or chip-formation-frequency amplitudes. This distinction is important when interpreting the relationship between vibration and surface roughness. Numerous studies have investigated how machining parameters affect cutting force, vibration, and surface quality. The present work therefore treats vibration as one component of a combined monitoring framework rather than assuming a one-to-one relationship between vibration amplitude and cutting force or surface roughness.
Recent advances in tool condition monitoring have also enabled the integration of sensors and intelligent data-acquisition systems into machining environments. Modern monitoring systems employ force sensors, accelerometers, acoustic emission sensors, and machine-learning techniques to detect process abnormalities and improve manufacturing efficiency [12,13]. Low-cost MEMS accelerometers have attracted attention because they can provide real-time vibration measurements at substantially lower implementation cost than conventional piezoelectric systems [14,15]. Previous studies have used accelerometer signals for process monitoring and for cutting-force or surface-quality assessment [16,17,18]. However, relatively few studies have examined cutting force, vibration, surface roughness, and geometric deviations together in a single C45 turning configuration. This motivates the present study. This work therefore does not claim that the relationships among these responses are new in themselves, but that it examines them together under the specific C45 dry-turning configuration, using simultaneous force and MEMS vibration monitoring alongside surface and form measurements.
- a)
- Experimentally evaluate the effects of cutting speed, feed rate, and depth of cut on cutting force, vibration, surface roughness, and cylindricity during the turning of C45 steel.
- b)
- Investigate the observed associations among cutting force, vibration, surface roughness, and cylindricity under the tested machining conditions using descriptive analysis and an exploratory correlation analysis.
- c)
- Develop qualitative recommendations for favorable machining conditions that may improve machining performance, process stability, and product quality in the turning of C45 steel.
Based on these objectives, the study addresses the following hypotheses:
- H1: Cutting speed, feed rate, and depth of cut produce observable differences in cutting force, vibration, surface roughness, and cylindricity during the turning of C45 steel.
- H2: Observable associations exist among cutting force, vibration, surface roughness, and cylindricity in the tested turning conditions, such that their combined consideration may provide useful information for assessing machining performance and quality.
Alternatively, these hypotheses may be expressed as the following research questions:
- Q1: How do cutting speed, feed rate, and depth of cut influence cutting force, vibration, surface roughness, and cylindricity in turning C45 steel?
- Q2: What relationships exist among cutting force, vibration, surface roughness, and cylindricity, and how can these relationships be utilized to improve machining performance and product quality, as reflected in the hypotheses?
2. Materials and Methods
2.1. Workpiece Material
The material selected for this investigation was C45 steel (EN 1.0503), a medium-carbon, non-alloy structural steel widely used in mechanical engineering applications for its favorable combination of strength, toughness, wear resistance, and cost-effectiveness [19]. Therefore, the nominal chemical composition of C45 steel, as specified in EN 10083, used in this study is presented in Table 1.
Experimental workpieces were manufactured from C45 steel shafts with an initial diameter of 60 mm and a total length of 240 mm. Each shaft was divided into five 40-mm-long machining sections, separated by 5-mm-wide grooves. A 35-mm reduced-diameter segment was machined at one end to ensure secure clamping in the machine chuck. Four identical shafts were produced, yielding twenty machining sections, of which eighteen were used in the experimental trials. Each section was assigned to a machining condition in the experimental program. The use of separate sections reduced overlap between successive cutting conditions; however, the exact axial position of each experimental section relative to the chuck was not treated as an experimental factor. Because workpiece stiffness and dynamic response can vary with the distance from the clamping point, this positional effect remains a limitation of the present study. Figure 2 shows the geometry and dimensions of the workpiece.
2.2. Machine Tool and Cutting Tool
All experiments used a DSDNN 2020K 12 right-hand tool holder with a Sandvik Coromant SNMG 120416-PR 4425 carbide insert. This tool configuration was selected for its stiffness and suitability for rough and semi-finish turning of carbon steels. The tool holder had a 20 mm × 20 mm cross-section and the SNMG insert had a square geometry with a 1.6 mm nose radius. The insert was secured with a double-clamp mechanism to ensure stable positioning under the investigated cutting loads. The cutting-edge condition was not quantitatively characterized before and after each experimental condition; no microscopic wear measurement or systematic flank-wear record was available for the present dataset. Therefore, tool-wear progression cannot be excluded as an uncontrolled source of variation and is recognized as a limitation of the study. Table 2 provides detailed specifications of the cutting tool.
2.3. Experimental Design
Figure 3 illustrates the experimental setup. All turning experiments were conducted on a CNC lathe equipped with a DSDNN 2020K 12 tool holder and Sandvik Coromant SNMG 120416-PR 4425-coated carbide inserts. The experimental design applied the specified machining conditions to segmented C45 steel shafts. A three-component piezoelectric dynamometer was installed between the tool holder and the machine turret to simultaneously acquire tangential, radial, and feed force components during turning. The resulting signals were amplified with three Kistler 5011A charge amplifiers and acquired via a National Instruments CompactDAQ-9171 data acquisition system. We monitored, visualized, and recorded force signals in real time using LabVIEW software.
Machining vibrations were monitored using an MPU6050 MEMS accelerometer integrated into a custom-designed electronic measurement unit developed for this research. The sensor was mounted directly on the cutting tool holder to capture tool vibrations during machining. Vibration data were continuously recorded and stored for subsequent signal processing and analysis. The sensor configuration and nominal sensitivity were based on the MPU6050 manufacturer’s specifications [21].
Figure 3 presents the principal components of the experimental setup: (a) the CNC turning lathe used for machining trials, (b) the cutting-force acquisition system consisting of Kistler charge amplifiers, an NI CompactDAQ-9171 module, and a computer-based monitoring interface, and (c) the force and vibration monitoring arrangement, which includes the Kistler 9257A dynamometer, an MPU6050 accelerometer, and a custom electronic measurement unit mounted on the machine tool. This integrated setup enabled simultaneous monitoring of cutting forces and vibrations, facilitating the investigation of their relationships to surface roughness and cylindricity during turning of C45 steel.
2.4. Force and Vibration Measurement
Machining vibrations were monitored using an MPU6050 MEMS accelerometer integrated into a custom-designed, 3D-printed monitoring device developed for this study. The sensor was mounted directly on the cutting tool holder to capture vibrations generated during turning. The accelerometer was operated in the ±2 g full-scale range, with a nominal sensitivity of 16,384 LSB/g and a sampling frequency of 1000 Hz. According to the manufacturer, the accelerometer has a specified nonlinearity of approximately 0.5% and an initial sensitivity calibration tolerance of ±3% for the ±2 g range [21]. The manufacturer specifies a programmable accelerometer low-pass-filter range of 5–260 Hz and an output-data-rate range up to 1000 Hz; however, the actual internal filter setting used in the original experimental acquisition was not documented. The available manufacturer specification does not provide an accelerometer mechanical-resonance frequency in the accelerometer specification table; therefore, no resonance value is assumed or reported here. The 1000-Hz sampling rate gives a Nyquist frequency of 500 Hz, so the dataset can represent only frequency content below 500 Hz and cannot support claims about higher-frequency vibration components. The sensor axes were aligned with the dynamometer coordinate system, where the X-, Y-, and Z-axes corresponded to the tangential, radial, and axial (feed) directions, respectively. The nominal sensor sensitivity and operating specifications were taken from the manufacturer’s documentation [21]. The available experimental documentation does not contain an independent traceable calibration certificate for the complete sensor-and-electronics assembly; consequently, the vibration values are treated as comparative process-monitoring measurements rather than fully traceable metrological quantities.
2.4.1. Sensor Calibration and Measurement Verification
The MPU6050 accelerometer was checked before testing using static gravitational reference measurements along each sensor axis. The sensor response was evaluated under stationary conditions to verify the expected gravitational response, stable zero-level behavior, and correct axis response. The measurement chain was configured with the manufacturer-specified ±2 g range and nominal sensitivity of 16,384 LSB/g [21]. The available experimental records do not include recorded offset values or a traceable calibration certificate for the complete sensor-and-electronics assembly. Accordingly, no experimentally determined calibration factor or uncertainty budget is reported. Acceleration data were converted from sensor output using the manufacturer’s nominal sensitivity and were used for comparative process monitoring across the nine machining conditions. This distinction is important because the reported vibration values should not be interpreted as independently traceable metrological measurements.
For signal verification, the sensor axes were aligned with the intended tangential, radial, and axial directions during installation. Raw acceleration signals were converted from digital counts (LSB) to acceleration units (m/s²) using the manufacturer’s nominal sensitivity. The DC component associated with gravity and sensor offset was removed before calculation of the effective vibration magnitude. No additional digital filtering or frequency-domain transformation was applied or documented. Consequently, the present analysis is intentionally based on the time-domain RMS acceleration and does not claim to identify vibration frequencies, chip-formation frequencies, or frequency-specific displacement amplitudes. With a 1000-Hz sampling rate, the theoretical Nyquist limit is 500 Hz. A complete spectral assessment of all nine experiments would require the original time histories to be processed consistently using a documented frequency-domain procedure; such an analysis was outside the scope of the original measurement workflow. The effective vibration magnitude was calculated from the tangential and radial acceleration components, and the reported result is the RMS value over the complete machining pass. The RMS calculation was performed according to Equation (3), where xᵢ is the instantaneous resultant vibration acceleration in m/s² and N is the number of acquired samples.
The experimental program was designed using a Taguchi L9 orthogonal array to screen the combined influence of cutting speed (Vc), feed rate (f), and depth of cut (ap) on cutting force, vibration, surface roughness, and cylindricity (Table 3) [22,23]. Each factor was evaluated at three levels: cutting speed (150, 200, and 250 m/min), feed rate (0.10, 0.20, and 0.30 mm/rev), and depth of cut (0.5, 1.0, and 1.5 mm). The L9 design comprised nine experimental conditions and provided a structured screening of the selected factor combinations with a reduced number of machining trials. A one-factor-at-a-time program was not used because the objective of this preliminary study was to examine combined machining conditions rather than isolate a single parameter while holding all others constant. This design choice also means that the present results should be interpreted as condition-level observations; independent repetitions and dedicated one-factor or factorial experiments would be required to separate factor effects statistically.
Figure 4 illustrates the experimental setup used to simultaneously measure cutting forces and machining vibrations during the turning of C45 steel. The workpiece was clamped in a three-jaw chuck to ensure accurate centering and stable positioning throughout machining. Cutting forces were measured using a Kistler 9257A three-component piezoelectric dynamometer mounted between the cutting tool holder and the machine turret, enabling real-time measurement of tangential, radial, and axial force components. The simultaneous acquisition of force and vibration signals enabled investigation of the relationship between machining dynamics and process performance under different cutting conditions.
2.5. Surface Roughness and Form Measurement
After the turning experiments, the surface quality of the machined C45 steel specimens was evaluated using an AltiSurf 520 surface measurement system, as illustrated in Figure 5. This system was equipped with a CL2 confocal chromatic sensor, a non-contact optical device capable of high-resolution three-dimensional surface characterization. The workpieces were positioned on the measuring stage, and surface profiles were acquired under controlled laboratory conditions to minimize environmental variation and ensure measurement consistency. For each experimental condition, surface roughness measurements were taken over a 10 mm sampling length. To reduce the influence of local surface variation, five measurements were taken from each machined section and averaged. These five measurements are repeated measurements of the same machined surface, not independent machining repeats; they characterize within-section measurement variation only. The mean values were subsequently used for comparison among the experimental conditions and are reported in the results section. Surface profiles were recorded with a vertical measurement scale of 100 μm. The surface quality evaluation focused on Ra and Rz, established profile parameters for characterizing surface texture [24]. Ra represents the arithmetic mean height of the roughness profile, whereas Rz describes the maximum profile height parameter as defined by the applicable surface-texture standard [24].
2.6. Geometric Accuracy Measurement
After the turning experiments, the geometric accuracy of the machined workpieces was evaluated using a Taylor Hobson Talyrond 365 roundness and form measurement system, as illustrated in Figure 6. This instrument assessed the cylindricity and concentricity of the machined sections, delivering high-precision measurements of form deviations produced during turning. For each experimental condition, the workpiece was precisely mounted on the Talyrond 365 rotary table and aligned to ensure accurate measurement of the cylindrical surfaces. A high-resolution stylus probe scanned the surface as the workpiece rotated about its axis. The instrument’s analysis software processed the resulting data to generate form profiles and quantify geometric deviations from the ideal cylindrical geometry. The geometric terminology and interpretation are consistent with the principles of geometrical product specification [20].
Cylindricity measurements assessed the overall deviation of the machined surface from a perfect cylinder, accounting for variations in roundness, straightness, and taper along the measured length. Concentricity measurements assessed the alignment of the machined sections with respect to the workpiece’s reference axis. These parameters are essential indicators of dimensional and geometric accuracy, especially for components that require precise rotational motion and assembly fit. The Talyrond 365 system provided detailed profile information and reliable quantification of form errors, facilitating investigation of the effects of cutting parameters, cutting forces, and machining vibrations on the geometric quality of the turned C45 steel specimens. The experimental setup for cylindricity and concentricity measurements is shown in Figure 6.
2.7. Statistical and Correlation Analysis
Descriptive statistics were used to evaluate the responses under the nine L9 machining conditions. Each condition involved a single machining pass, so the nine condition-level observations were treated as individual experimental realizations rather than repeated machining samples. Mean surface roughness was calculated from five measurements on the same machined section; these repeated measurements characterize within-section measurement variation and do not constitute independent machining replicates. In addition to descriptive comparisons, an exploratory Pearson correlation analysis was performed across the nine condition-level observations for the principal responses (active force, vibration, Ra, Rz, and cylindricity). A smaller-is-better Taguchi S/N ratio was also calculated descriptively for each response to summarize condition-level variation; because each condition has only one machining realization, the S/N results are not used to estimate repeatability or establish statistically optimal factor levels. No inferential ANOVA or p-value-based factor significance analysis was performed because an independent estimate of experimental error was unavailable.
3. Results
The vibration, cutting forces, surface roughness, and cylindricity were measured in each experiment to understand the relationships among and behavior of the machining parameters.
3.1. Vibration Analysis
The vibration results in Table 4 are the RMS values calculated from the continuous acceleration signal recorded during a single machining pass for each experimental condition. Consequently, the reported values represent individual experimental realizations rather than means across repeated machining trials. Vibration magnitude was determined from the resultant acceleration in the tangential and radial directions and expressed as RMS acceleration. Recorded vibration magnitudes ranged from 5.38 m/s² to 19.09 m/s². The highest vibration level occurred in Experiment 3 (Vc = 150 m/min, f = 0.30 mm/rev, ap = 1.5 mm), with an RMS value of 19.09 m/s². The lowest vibration magnitude was observed in Experiment 9 (Vc = 250 m/min, f = 0.30 mm/rev, ap = 1.0 mm), at 5.38 m/s². Because the acquisition rate was 1000 Hz, the corresponding Nyquist frequency was 500 Hz. The present study therefore uses RMS acceleration as a time-domain process indicator and does not interpret the results as a complete spectral characterization of the machining vibration.
Figure 7 presents the recorded active cutting-force signals for the nine experimental conditions. The duration of signal acquisition varied with the machining time required for each cutting condition (10.7–22.1 s).
3.2. Active Cutting-Force Analysis
Table 5 summarizes the active cutting-force results from the turning experiments, and Figure 7 presents the corresponding force signals. The active force (AF) was calculated from the measured components and reported as the RMS value. Recorded cutting-force values ranged from 257.07 N to 730.60 N. The highest cutting force occurred in Experiment 7 (Vc = 250 m/min, f = 0.10 mm/rev, ap = 1.5 mm), reaching 730.60 N. The lowest cutting force was observed in Experiment 9 (Vc = 250 m/min, f = 0.30 mm/rev, ap = 1.0 mm), at 257.07 N. At 150 m/min, cutting force increased from 300.79 N to 522.86 N across Experiments 1–3. At 200 m/min, force values ranged from 410.71 N to 590.85 N, whereas at 250 m/min they ranged from 257.07 N to 730.60 N. Thus, cutting force did not exhibit a consistent monotonic dependence on cutting speed alone. The stronger increase observed at the 1.5 mm depth-of-cut level is consistent with the larger material-removal load, but the individual condition results also show that feed rate and cutting speed jointly affect the measured force.
3.3. Surface Roughness Analysis
Table 6 presents the surface roughness measurements from the turning experiments. Surface quality was assessed using Ra and Rz. The reported values are the means of five measurements taken from each machined section; they do not represent repeated machining trials. The measured Ra values ranged from 2.13 μm to 3.66 μm, and Rz values ranged from 10.78 μm to 19.14 μm. The highest Ra value, 3.66 μm, was recorded in Experiment 4 (Vc = 200 m/min, f = 0.10 mm/rev, ap = 1.0 mm), while the lowest Ra value, 2.13 μm, occurred in Experiments 6 and 8. The lowest Rz value, 10.78 μm, was observed in Experiment 8. At 150 m/min, Ra increased from 2.60 μm to 3.38 μm across Experiments 1–3. At 200 m/min, Ra ranged from 2.13 μm to 3.66 μm, and at 250 m/min it ranged from 2.13 μm to 2.30 μm. The corresponding Rz values were 16.98–18.34 μm, 14.78–19.14 μm, and 10.78–12.17 μm, respectively. Thus, higher cutting speed was associated with lower roughness in the tested dataset, although the effect cannot be attributed to cutting speed alone, as the nine conditions also differed in feed rate and depth of cut.
3.4. Geometric Accuracy Analysis
Geometric accuracy of the machined workpieces was evaluated using straightness deviation (STRt), roundness deviation (RONt), and cylindricity deviation (CYLt), as shown in Table 7. These parameters were used to assess the form accuracy of the turned C45 steel specimens. Measured cylindricity deviations ranged from 21.18 μm to 37.40 μm. The lowest CYLt occurred in Experiment 3 (Vc = 150 m/min, f = 0.30 mm/rev, ap = 1.5 mm), with CYLt = 21.18 μm, while the highest occurred in Experiment 8 (Vc = 250 m/min, f = 0.20 mm/rev, ap = 0.5 mm), at 37.40 μm. Straightness deviation ranged from 0.40 μm to 5.27 μm, and roundness deviation ranged from 2.56 μm to 9.21 μm. Across the three cutting-speed levels, cylindricity did not follow a single monotonic trend: the mean CYLt increased from 22.96 μm at 150 m/min to 25.15 μm at 200 m/min and 30.79 μm at 250 m/min. These results indicate that geometric accuracy is more sensitive to the combined machining condition and the machine-tool/workpiece system than to vibration or cutting force alone.

Table 8.
Mean response values at each factor level across the nine L9 machining conditions.
| Factor | Level | Vibration (m/s²) | AF RMS (N) | Ra (μm) | Rz (μm) | STRt (μm) | RONt (μm) | CYLt (μm) |
| Vc | 150 | 14.41 | 393.25 | 2.97 | 17.65 | 1.39 | 3.82 | 22.96 |
| Vc | 200 | 9.90 | 529.78 | 2.69 | 16.52 | 2.48 | 4.64 | 25.15 |
| Vc | 250 | 7.93 | 450.90 | 2.21 | 11.26 | 1.49 | 6.26 | 30.79 |
| f | 0.1 | 11.14 | 480.70 | 2.82 | 16.31 | 1.83 | 4.29 | 24.90 |
| f | 0.2 | 10.33 | 436.30 | 2.45 | 14.92 | 2.46 | 6.07 | 27.19 |
| f | 0.3 | 10.77 | 456.93 | 2.60 | 14.20 | 1.07 | 4.35 | 26.82 |
| ap | 0.5 | 7.71 | 418.89 | 2.29 | 14.39 | 1.71 | 5.86 | 29.61 |
| ap | 1 | 10.65 | 341.29 | 2.96 | 16.10 | 1.54 | 5.02 | 27.70 |
| ap | 1.5 | 13.88 | 613.75 | 2.62 | 14.93 | 2.11 | 3.84 | 21.60 |
3.5. Exploratory Correlation Analysis
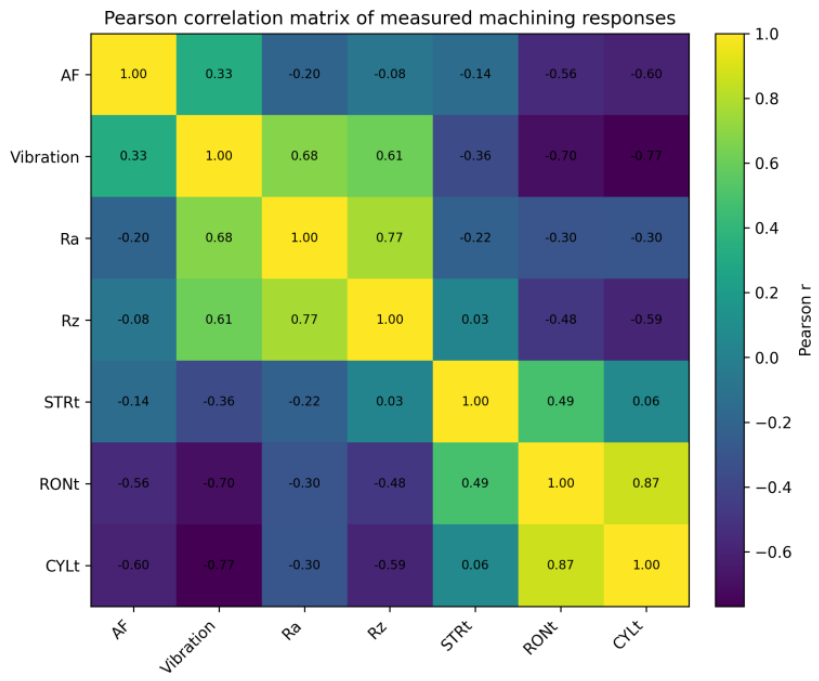
Pearson correlation analysis was performed using the nine condition-level observations. For variables X and Y, Pearson’s coefficient is calculated as in equation (4):
Values near +1 or −1 indicate strong positive or negative linear associations, respectively, whereas values near zero indicate weak linear associations. For example, the Pearson correlation coefficient between active cutting force and vibration, based on nine paired observations, was r = 0.329. Because only nine machining conditions were evaluated and no independent machining repetitions were performed, the correlation coefficients should be treated as exploratory. Therefore, they should not be interpreted as evidence of causal relationships or as support for statistically validated predictive models. The correlation results are presented in Table 9.
The strongest absolute correlation is between RONt and CYLt (r = 0.865), indicating that these two geometric-error measures tend to vary together across the tested conditions. Vibration also shows a comparatively strong association with Ra (r = 0.678). Some correlations are weak because force, vibration, surface roughness, and geometric accuracy respond to different mechanisms. Cutting force is strongly affected by chip cross-sectional area and cutting conditions, whereas vibration additionally depends on structural dynamics and tool–workpiece interaction. Ra and Rz depend on profile geometry and cutting dynamics, whereas STRt, RONt, and CYLt also reflect workpiece stiffness, machine-tool alignment, and geometric behavior. The L9 design also changes several factors simultaneously, so a simple pairwise coefficient can be weak even when a response is physically influenced by a parameter.
Table 10.
Exploratory linear regression summaries for selected response relationships (n = 9).
| Relationship | Linear regression equation | Pearson r | R² |
| Ra vs Vibration | Ra = 1.666 + 0.089Vibration | 0.678 | 0.460 |
| Rz vs Vibration | Rz = 10.316 + 0.449Vibration | 0.610 | 0.372 |
| Vibration vs AF | Vibration = 6.579 + 0.009AF | 0.329 | 0.108 |
| CYLt vs RONt | CYLt = 15.400 + 2.222RONt | 0.865 | 0.749 |
Figure 8.
Pearson correlation matrix for active cutting force, vibration, surface roughness, and geometric accuracy parameters during turning of C45 steel.
Figure 8.
Pearson correlation matrix for active cutting force, vibration, surface roughness, and geometric accuracy parameters during turning of C45 steel.
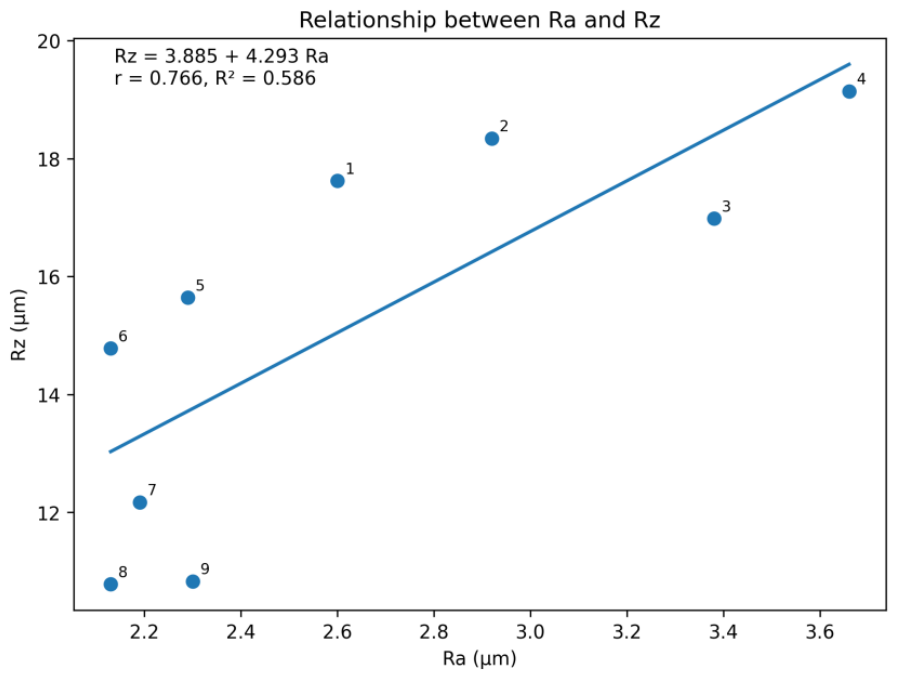
Rz = 3.885 + 4.293Ra; R² = 0.586
Figure 9.
Ra versus Rz with a linear trendline.
4. Additional Analysis
4.1. Relationship Between Ra and Rz
Ra is the arithmetic mean of the absolute profile deviations, whereas Rz is a peak-to-valley-type height parameter and is more sensitive to pronounced individual peaks and valleys. In the present dataset, Ra and Rz have a positive linear association (r = 0.766, R² = 0.586), with the fitted equation (6).
Rz = 3.885 + 4.293Ra
The relationship is not perfect because isolated high peaks or deep valleys can change Rz more strongly than they change the average absolute deviation.
4.8. Taguchi S/N Ratio Analysis
For Experiment 1 are calculated by equation (7):
Ra = 2.60 μm, so
Table 11.
Condition-level Taguchi S/N ratios using the smaller-is-better criterion (dB).
| Exp | AF | Vibration | Ra | Rz | STRt | RONt | CYLt |
| 1 | -49.57 | -19.37 | -8.30 | -24.92 | -9.99 | -14.58 | -28.23 |
| 2 | -51.03 | -23.43 | -9.31 | -25.27 | 4.29 | -9.74 | -26.82 |
| 3 | -54.37 | -25.62 | -10.58 | -24.60 | 7.96 | -9.60 | -26.52 |
| 4 | -52.27 | -21.38 | -11.27 | -25.64 | -4.51 | -13.91 | -28.80 |
| 5 | -55.38 | -20.12 | -7.20 | -23.88 | -14.44 | -15.48 | -26.95 |
| 6 | -55.43 | -17.90 | -6.57 | -23.39 | 6.38 | -9.60 | -28.18 |
| 7 | -57.27 | -21.88 | -6.81 | -21.71 | 3.61 | -8.16 | -26.59 |
| 8 | -51.25 | -15.55 | -6.57 | -20.65 | -3.52 | -19.29 | -31.46 |
| 9 | -48.20 | -14.62 | -7.23 | -20.69 | -7.31 | -16.93 | -30.53 |
The S/N ratios are reported descriptively. Since each condition has only one machining result, they cannot quantify within-condition repeatability.
Table 12.
Mean S/N ratios by factor level for the smaller-is-better criterion.
| Factor | Level | AF | Vibration | Ra | Rz | STRt | RONt | CYLt |
| Vc | 150 | -51.65 | -22.81 | -9.40 | -24.93 | 0.75 | -11.31 | -27.19 |
| Vc | 200 | -54.36 | -19.80 | -8.34 | -24.31 | -4.19 | -13.00 | -27.98 |
| Vc | 250 | -52.24 | -17.35 | -6.87 | -21.02 | -2.41 | -14.79 | -29.53 |
| f | 0.1 | -53.04 | -20.87 | -8.79 | -24.09 | -3.63 | -12.22 | -27.87 |
| f | 0.2 | -52.55 | -19.70 | -7.69 | -23.27 | -4.55 | -14.83 | -28.41 |
| f | 0.3 | -52.67 | -19.38 | -8.13 | -22.89 | 2.34 | -12.04 | -28.41 |
| ap | 0.5 | -52.08 | -17.61 | -7.14 | -22.99 | -2.38 | -14.49 | -29.29 |
| ap | 1 | -50.50 | -19.81 | -9.27 | -23.87 | -2.51 | -13.53 | -28.72 |
| ap | 1.5 | -55.68 | -22.54 | -8.19 | -23.40 | -0.96 | -11.08 | -26.69 |
5. Discussion
The results indicate that machining responses depend on the combined settings of cutting speed, feed rate, and depth of cut rather than on any single parameter. The clearest effect in the present dataset is the reduction in vibration with increasing cutting speed: the mean vibration decreased from 14.41 m/s² at 150 m/min to 7.93 m/s² at 250 m/min. This tendency is consistent with recent C45 turning studies reporting that cutting speed can influence process stability and surface quality [25,26]. The depth-of-cut response was also more pronounced: mean vibration increased from 7.71 m/s² at ap = 0.5 mm to 13.88 m/s² at ap = 1.5 mm, while mean active force increased from 418.89 N to 613.75 N. This is physically plausible because a larger depth of cut increases the material-removal cross-section and therefore the mechanical load on the tool-workpiece system. Previous C45 investigations likewise identify cutting parameters, particularly feed and depth of cut, as important contributors to cutting load and chip deformation [5,27]. However, the present L9 results do not show a monotonic feed-rate effect on force or vibration, so a stronger statement would require repeated experiments and formal factor-effect analysis.
The exploratory correlation analysis also highlights the complex relationship between cutting force and vibration. Across the nine conditions, the Pearson correlation between active force and vibration was r = 0.329. This indicates only a weak-to-moderate positive linear association within the tested conditions and does not imply that higher vibration necessarily produces higher cutting force. In machining, force and vibration are coupled through the dynamic tool–workpiece–machine system, while structural stiffness, damping, excitation frequency, workpiece geometry, and cutting conditions can modify that relationship. The present data therefore support combined force and vibration monitoring as a descriptive approach, but they do not support a one-to-one force-to-vibration model.
Surface roughness showed a moderate positive Pearson correlation with vibration for both Ra (r = 0.678) and Rz (r = 0.610). Thus, within the nine tested conditions, higher vibration tended to occur with higher roughness. This observation is consistent with the general machining mechanism in which dynamic motion can be transferred to the generated surface and contribute to surface texture. It is also compatible with previous C45 turning studies reporting that cutting parameters influence Ra and Rz and that suitable cutting speeds can improve surface quality [25,26,28,29]. Nevertheless, the present data cannot establish vibration as the cause of the roughness differences. Built-up edge formation, tool wear, thermal effects, chip formation, and tool geometry may also contribute to surface generation [30], but none of these phenomena was directly measured in this study. They should therefore be described as possible contributing mechanisms rather than demonstrated explanations.
Geometric accuracy behaved differently from surface roughness. The Pearson correlation between vibration and cylindricity deviation was negative (r = −0.769), whereas the correlation between active force and cylindricity was also negative but weaker (r = −0.595). These signs do not support the simple assumption that greater vibration or greater force necessarily produces larger cylindricity error in the present dataset. The lowest cylindricity deviation occurred in Experiment 3, which also had the highest vibration, while the largest cylindricity deviation occurred in Experiment 8, which had relatively low vibration. This inconsistency underscores the roles that tool deflection, workpiece stiffness, spindle alignment, machine-tool geometric accuracy, thermal effects, and other geometric influences may play in form error. Previous research has similarly shown that cylindricity and other geometric tolerances can respond differently from surface roughness to machining conditions [19,31]. Consequently, a satisfactory surface finish should not be interpreted as evidence of satisfactory form accuracy.
Taken together, the results support an integrated monitoring perspective based on cutting force, vibration, surface roughness, and geometric accuracy. The contribution of the present study is the combined examination of these responses in the specific C45 dry- turning configuration rather than a claim that their relationships are novel in isolation. The L9 design provides a practical screening framework for the tested parameter combinations, while the descriptive and exploratory analyses identify promising patterns for future work. The L9 design is used only as an experimental design and does not provide a statistically validated optimum; the recommended conditions should therefore be regarded as favorable or promising within the tested parameter window.
The selected linear regressions provide an additional quantitative description of these associations. For vibration versus Ra, r = 0. 678 and R² = 0. 460; thus, approximately 46% of the observed variation in Ra is associated with the linear relationship with vibration. For vibration versus Rz, R² = 0. 372, while the force–vibration relationship gives R² = 0.108. The strongest selected relationship was between RONt and CYLt, with R² = 0. 749. These R² values describe associations within the nine tested conditions and should not be interpreted as causal effects or statistically validated predictive models.
5.1. Achievement of Objectives
Objective (a)
To experimentally evaluate the effects of cutting speed, feed rate, and depth of cut on cutting force, vibration, surface roughness, and cylindricity during the turning of C45 steel.
Achieved descriptively. The nine L9 conditions produced distinct responses. Higher cutting speed was associated with lower vibration and lower roughness, while the largest depth of cut was associated with the highest mean active force and vibration. Cutting force did not show a consistent monotonic dependence on cutting speed, and feed rate did not show a monotonic effect across the nine observations. These results therefore support descriptive evaluation of the tested parameter combinations rather than a statistical ranking of factor significance.
Objective (b)
To investigate the observed associations among cutting force, vibration, surface roughness, and cylindricity under varying cutting conditions.
Achieved through exploratory analysis. Pearson correlations were calculated for the nine condition-level observations. The results showed a weak-to-moderate association between active force and vibration, moderate positive associations between vibration and surface roughness, and an inverse association between vibration and cylindricity deviation. Because n = 9 and there were no independent machining repeats, these associations are exploratory and not predictive or causal.
Objective (c)
To develop qualitative recommendations for improving machining performance, process stability, and product quality in the turning of C45 steel.
Achieved qualitatively. The results suggest that higher cutting speed combined with moderate feed rate and depth of cut can be a promising region for surface quality and vibration reduction within the tested parameter window. Because geometric accuracy did not follow the same trend as vibration or roughness, the recommendation should be treated as a favorable condition for further validation rather than an optimized setting.
5.2. Verification of Hypotheses
H1: Cutting speed, feed rate, and depth of cut produce observable differences in cutting force, vibration, surface roughness, and cylindricity during the turning of C45 steel.
Descriptively supported. The nine experimental conditions produced different response levels, and clear trends were observed for some responses, particularly the decrease in vibration with cutting speed and the increase in force and vibration at the largest depth of cut. However, the small number of conditions and absence of independent machining repeats prevent statistical claims about factor significance or general effects.
H2: Observable associations exist among cutting force, vibration, surface roughness, and cylindricity in the tested turning conditions, such that their combined consideration may provide useful information for assessing machining performance and quality.
Partially supported. The exploratory correlations indicate associations among several responses, particularly vibration with Ra, Rz, and cylindricity. However, the active-force/vibration association was only r = 0.329, and the direction of the vibration-cylindricity association was opposite to the simple expectation that higher vibration should produce larger cylindricity error. H2 is therefore supported only as an exploratory observation of response associations, not as evidence of a general or causal relationship.
5.3. Answer to the Research Question
The findings show that cutting speed, feed rate, and depth of cut jointly influence the measured machining responses, but their effects are not uniform across all outputs. Higher cutting speed was associated with lower vibration and lower roughness in the tested conditions, while the largest depth of cut was associated with the highest mean force and vibration. The feed-rate response was not monotonic across the nine conditions. The exploratory correlations indicate that vibration and surface roughness tended to increase together, whereas geometric accuracy followed a different pattern. These results support considering cutting force, vibration, surface roughness, and geometric accuracy together when screening machining conditions for C45 steel, while recognizing that the present evidence is limited to the tested parameter combinations.
5.4. Study Limitations
The findings of the present work should be interpreted in light of the following limitations. (1) Only nine experimental conditions were evaluated using a Taguchi L9 orthogonal design. (2) No independent machining repetitions were performed; therefore, experimental variability could not be quantified. The five roughness measurements per condition are repeated measurements on the same machined section and do not represent independent machining replicates. (3) Because independent machining replicates were unavailable, an independent experimental-error term could not be estimated and inferential ANOVA, confidence intervals for factor effects, and formal significance testing were not performed. (4) The Pearson correlation and linear regression analyses are exploratory and based on only nine condition-level observations; no validated predictive model was established. (5) The S/N ratios are descriptive only and cannot establish statistically optimal parameter levels without independent replication. (6) The 1000-Hz vibration sampling rate imposes a 500-Hz Nyquist limit. No frequency-domain analysis was performed, so chip-formation-frequency amplitudes, spectral peaks, and frequency-specific displacement were not evaluated. (7) The MPU6050 was checked using static gravitational reference measurements and manufacturer’s nominal sensitivity, but the available records do not contain a traceable calibration certificate or complete uncertainty budget for the sensor-and-electronics assembly. (8) The cutting-edge condition was not systematically measured for each experiment; therefore, tool-wear progression remains an uncontrolled factor. (9) The axial position of each 40-mm machining section relative to the chuck was not included as an experimental factor, so changes in workpiece dynamic stiffness along the shaft may contribute to the measured response. (10) Potential mechanisms including built-up-edge formation, cutting temperature, chip morphology, and machine-tool dynamic behavior were not measured directly. (11) The study does not include the one-factor-at-a-time experiments or independent confirmatory trials that would be required to isolate individual parameter effects. Future work should therefore include independent machining replicates, documented section-position control, traceable multi-point vibration calibration, spectral analysis of the raw acceleration signals, systematic tool-wear characterization, and confirmatory experiments over an expanded parameter region.
6. Conclusions
The combined effects of cutting speed, feed rate, and depth of cut produced distinct machining responses under the investigated C45 turning conditions. Higher cutting speed was associated with lower vibration and surface roughness, whereas the largest depth of cut was linked to the highest mean active force and vibration. Cutting force did not show a consistent monotonic dependence on cutting speed, and the feed-rate effect was not monotonic across the nine experimental conditions. Exploratory Pearson correlations showed a moderate positive association between vibration and Ra (r = 0.678), a moderate positive association between vibration and Rz (r = 0.610), and a strong negative association between vibration and cylindricity deviation (r = −0.769). The active force-vibration association was weak to moderate (r = 0.329). These findings indicate that surface quality and geometric accuracy should not be inferred from vibration or cutting force alone. The combined examination of cutting force, vibration, surface roughness, and geometric accuracy in the present C45 dry-turning configuration provides a useful contribution to process monitoring and condition screening. Within the tested parameter window, higher cutting speed with moderate feed rate and depth of cut can be considered a promising region for further validation, but these conditions should not be described as globally best. Future studies should include repeated machining trials, traceable sensor calibration, documented signal preprocessing, formal statistical analysis, validated predictive modeling, and confirmatory experiments to establish robust parameter-selection guidelines.
Based on the tested conditions, the following qualitative recommendations are made: (a) higher cutting speed combined with moderate feed rate and depth of cut may be considered a promising region for reducing vibration and improving surface finish; (b) depth of cut should be selected cautiously because the highest tested level produced the largest cutting-force and vibration responses; (c) cutting-force, vibration, roughness, and geometric measurements should be considered together when evaluating machining performance; and (d) the reported conditions should be regarded as favorable within the investigated parameter window rather than as statistically validated optimum settings.
Author Contributions
Conceptualization, I.M.J. and C.F.; methodology, I.M.J. and C.F.; software, I.M.J.; validation, I.M.J.; formal analysis, I.M.J.; investigation, I.M.J.; resources, C.F.; data curation, I.M.J.; writing—original draft preparation, I.M.J.; writing—review and editing, I.M.J. and C.F.; visualization, I.M.J.; supervision, C.F. All authors have read and agreed to the published version of the manuscript.
Funding
This research received no external funding.
Institutional Review Board Statement
Not applicable.
Informed Consent Statement
Not applicable.
Data Availability Statement
The experimental data supporting the findings of this study are contained in the manuscript. The underlying condition-level dataset and MATLAB analysis procedure can be made available by the corresponding author upon reasonable request.
Acknowledgments
The authors acknowledge the technical and laboratory support provided by the Institute of Manufacturing Science, University of Miskolc. During the preparation of this manuscript, the authors used ChatGPT (OpenAI) for the purposes of language editing and improving clarity. The authors have reviewed and edited the output and take full responsibility for the content of this publication.
Conflicts of Interest
The authors declare no conflict of interest.
Abbreviations
| Abbreviation | Definition |
| AF | Active cutting force |
| C45 | Medium-carbon steel EN 1.0503 |
| CYLt | Total cylindricity deviation |
| MEMS | Micro-electromechanical system |
| MPU6050 | Three-axis MEMS accelerometer/gyroscope sensor |
| Ra | Arithmetic mean surface roughness |
| RONt | Total roundness deviation |
| Rz | Maximum height of the roughness profile |
| S/N | Signal-to-noise ratio |
| STRt | Total straightness deviation |
| Vc | Cutting speed |
| f | Feed rate |
| ap | Depth of cut |
References
- Woźniak, W.; et al. Studies on the mechanical properties of C45 steel with martensitic structure after a high tempering process. Adv. Sci. Technol. Res. J. 2022, 16(3). [Google Scholar] [CrossRef]
- Schlegel, J. Correction to: The World of Steel, in The World of Steel: On the History, Production and Use of a Basic Material; Springer, 2023; pp. C1–C1. [Google Scholar]
- Schlegel, J. The Material Steel, in The World of Steel: On the History, Production and Use of a Basic Material; Springer, 2023; pp. 9–61. [Google Scholar]
- Ivchenko, O.; et al. Method for an effective selection of tools and cutting conditions during precise turning of non-alloy quality steel C45. Materials 2022, 15(2), 505. [Google Scholar] [CrossRef] [PubMed]
- Wang, S.; et al. Analytical modeling and prediction of cutting forces in orthogonal turning: a review. Int. J. Adv. Manuf. Technol. 2022, 119(3-4), 1407–1434. [Google Scholar] [CrossRef]
- Rivin, E. Machine-tool vibration, in Harris’ shock and vibration handbook; McGraw-Hill, 2002. [Google Scholar]
- Taylor, F.W. On the art of cutting metals; American society of mechanical engineers, 1907; Vol. 28. [Google Scholar]
- Arnold, R.; Hankins, G. The mechanics of the cutting operation. Proc. Inst. Mech. Eng. 1946, 155(1), 238–240. [Google Scholar] [CrossRef]
- Tobias, S.A. Machine-tool vibration; Blackie (London / Glasgow), 1965; p. 380. [Google Scholar]
- Tlusty, J. Stability of machine tool against self-excited vibration in machining. Int Prod Eng Res Conf-Proc, 1963. 1963. [Google Scholar]
- Huynh, T.T.; et al. Investigating effects of cutting parameters on surface roughness machined by turning of C45 steel based on Taguchi methodology and ANOVA. CTU J. Innov. Sustain. Dev. (Special issue: ETMD). 2025. 17, 53–58. [Google Scholar] [CrossRef]
- Kasiviswanathan, S.; et al. Machine-learning-and internet-of-things-driven techniques for monitoring tool wear in machining process: a comprehensive review. J. Sens. Actuator Netw. 2024, 13(5), 53. [Google Scholar] [CrossRef]
- Fan, Z.; et al. New sensing technologies for monitoring machinery, structures, and manufacturing processes. J. Dyn. Monit. Diagn. 2023. 2, 2, 69–88. [Google Scholar] [CrossRef]
- Li, C.; et al. Assessment of a three-axis on-rotor sensing performance for machining process monitoring: a case study. Sci. Rep. 2022, 12(1), 16813. [Google Scholar] [CrossRef] [PubMed]
- Suresh, S.; et al. Preliminary investigation on the development of low-cost vibration based condition monitoring DAQ system in industry 4.0. Manuf. Technol. Today 2024, 23(5-6), 1–7. [Google Scholar] [CrossRef]
- Vogl, G.; et al. Cutting force estimation from machine learning and physics-inspired data-driven models utilizing accelerometer measurements; Oak Ridge National Laboratory (ORNL): Oak Ridge, TN (United States), 2023. [Google Scholar]
- Schmucker, B.; et al. Wide-bandwidth cutting force monitoring via motor current and accelerometer signals. CIRP Ann. 2023, 72(1), 309–312. [Google Scholar] [CrossRef]
- Hanchate, A.; et al. Explainable AI (XAI)-driven vibration sensing scheme for surface quality monitoring in a smart surface grinding process. J. Manuf. Process. 2023. 99, 184–194. [Google Scholar] [CrossRef]
- Masoudi, S.; et al. Comparison the effect of MQL, wet and dry turning on surface topography, cylindricity tolerance and sustainability. Int. J. Precis. Eng. Manuf.-Green Technol. 2019, 1–13. [Google Scholar] [CrossRef]
- European Committee for Standardization. EN 10083-2:2006; Steels for quenching and tempering — Part 2: Technical delivery conditions for non-alloy steels. 2006.
- InvenSense, MPU-6000 and MPU-6050 Product Specification, Revision 3.4. 2013. Available online: https://invensense.tdk.com/wp-content/uploads/2015/02/MPU-6000-Datasheet.pdf.
- Truong, T.-P. A Taguchi Approach for Evaluating Surface Roughness in Turning of C45 Steel. Int. J. Adv. Multidiscip. Res. Stud. 2026. 6, 2, 1553–1555. [Google Scholar] [CrossRef]
- Rifelino, R.; Rahim, B.; Indrawan, E. Optimization of CNC Turning Parameters Using Taguchi Method. Teknomekanik 2021, 4(1), 42–48. [Google Scholar] [CrossRef]
- Şap, E.; et al. Evaluation of machinability and energy consumption of CK45 steel using synthetic-based nanofluid and minimum quantity lubrication cutting fluid. Metals 2025, 15(1), 36. [Google Scholar] [CrossRef]
- Vopát, T.; et al. The selection of cutting speed to prevent deterioration of the surface in internal turning of C45 steel by small-diameter boring bars. Machines 2024, 12(1), 68. [Google Scholar] [CrossRef]
- Santos, H.O.; et al. Machinability of Normalized and Stress-Relieved C45 Steel in Dry Internal Turning. Tribol. Ind. 2025, 47(4), 792. [Google Scholar] [CrossRef]
- Kuruc, M.; et al. The influence of cutting parameters on plastic deformation and chip compression during the turning of C45 medium carbon steel and 62SiMnCr4 tool steel. Materials 2022, 15(2), 585. [Google Scholar] [CrossRef] [PubMed]
- Duong, Dinh-Thuy. Experimental Research to Determine the Optimal Cutting Parameters for Reducing Roughness in Turning of C45 Steel. Int. J. Adv. Multidiscip. Res. Stud. 2024, 4(3), 440–442. [Google Scholar]
- Tran, C.C. Surface roughness prediction for CNC-turned C45 steel utilising adaptive neuro-fuzzy inference systems. J. Mech. Eng. Sci. 2024, 10222–10232. [Google Scholar] [CrossRef]
- Desaigues, J.-E.; Bomont-Arzur, A.; Dudzinski, D.; Bomont, O.; Lescalier, C. Experimental study of Built-Up Layer formation during machining of high strength free-cutting steel. J. Mater. Process. Technol. 2016, 236, 204–215. [Google Scholar] [CrossRef]
- Akyıl, H.H.; Bican, O. Experimental Investigation of the Effects of Cutting Parameters on Geometric Tolerances in Machining. Aksaray University ACCURACY.
Figure 1.
Cutting-force components in the turning operation.
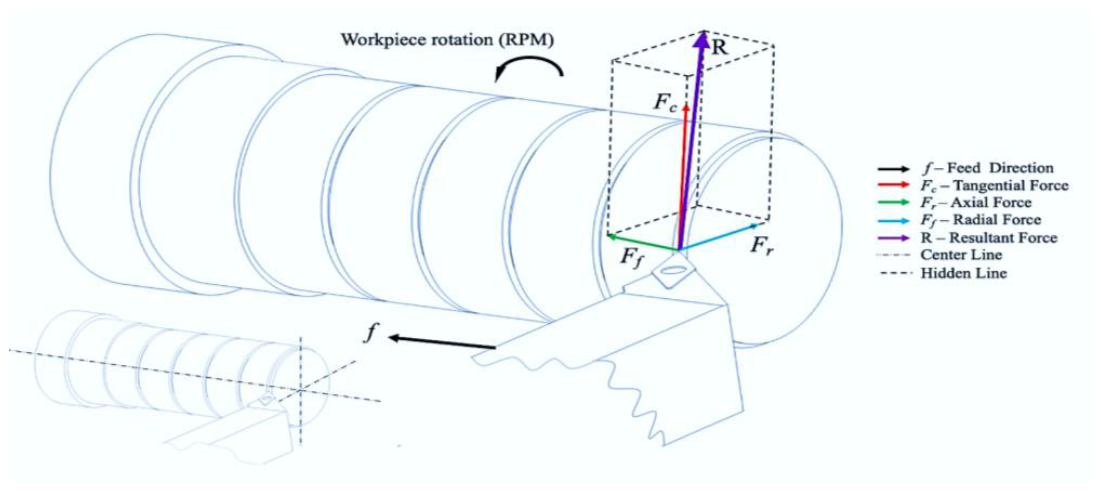
Figure 2.
Drawing of workpiece specimen.
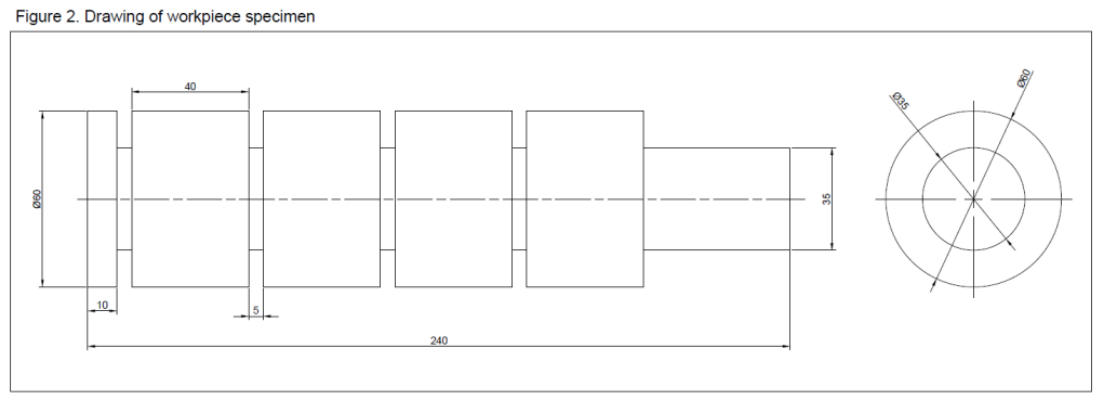
Figure 3.
CNC turning lathe, cutting-force acquisition system, and electronic vibration-monitoring setup.
Figure 3.
CNC turning lathe, cutting-force acquisition system, and electronic vibration-monitoring setup.
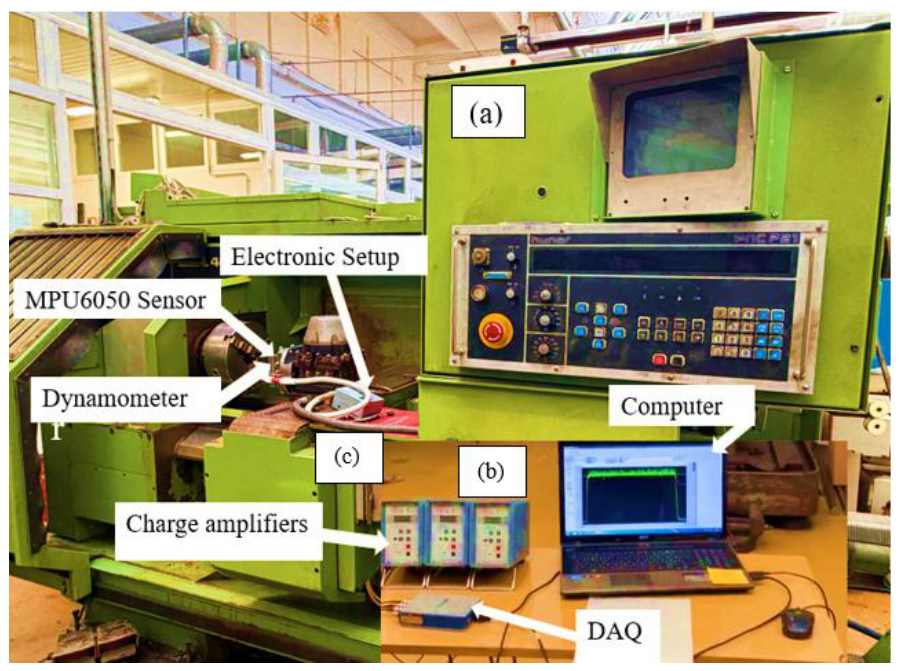
Figure 4.
Simultaneous cutting-force and vibration measurement arrangement: (a) experimental setup; (b) sensor and dynamometer mounting.
Figure 4.
Simultaneous cutting-force and vibration measurement arrangement: (a) experimental setup; (b) sensor and dynamometer mounting.
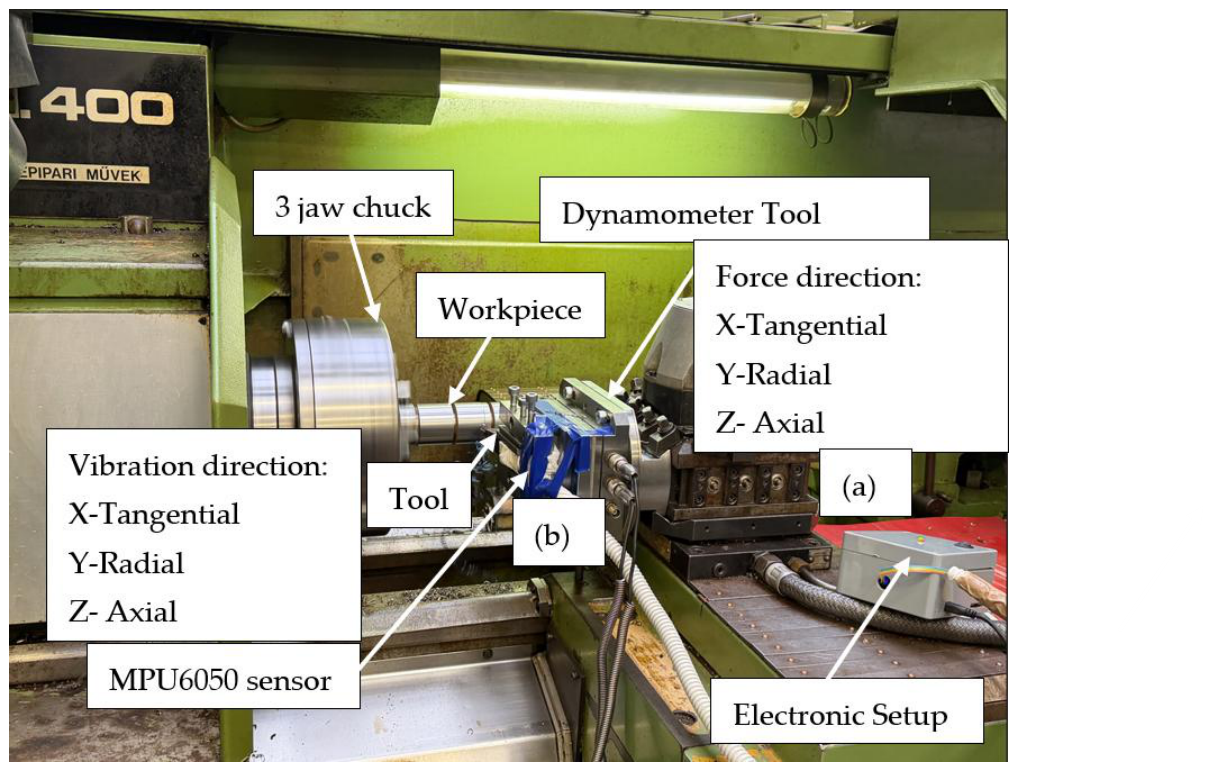
Figure 5.
AltiSurf 520 surface measurement setup for roughness characterization.
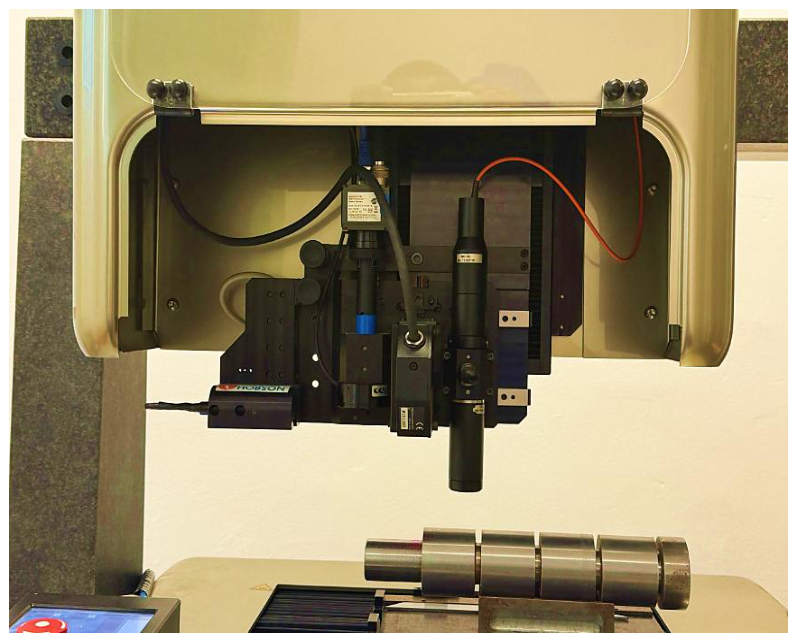
Figure 6.
Taylor Hobson Talyrond 365 setup for cylindricity and concentricity measurement.
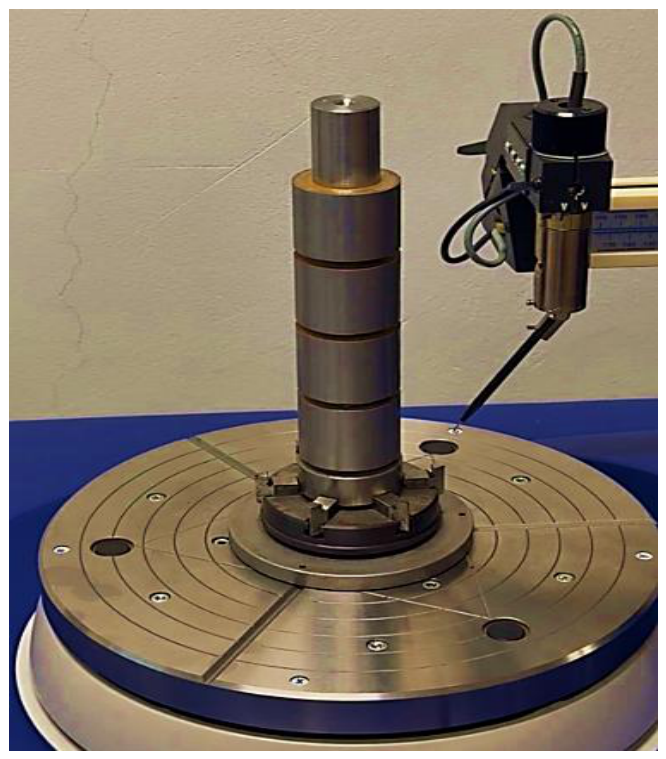
Figure 7.
Recorded active cutting force as a function of time for the nine L9 machining conditions.
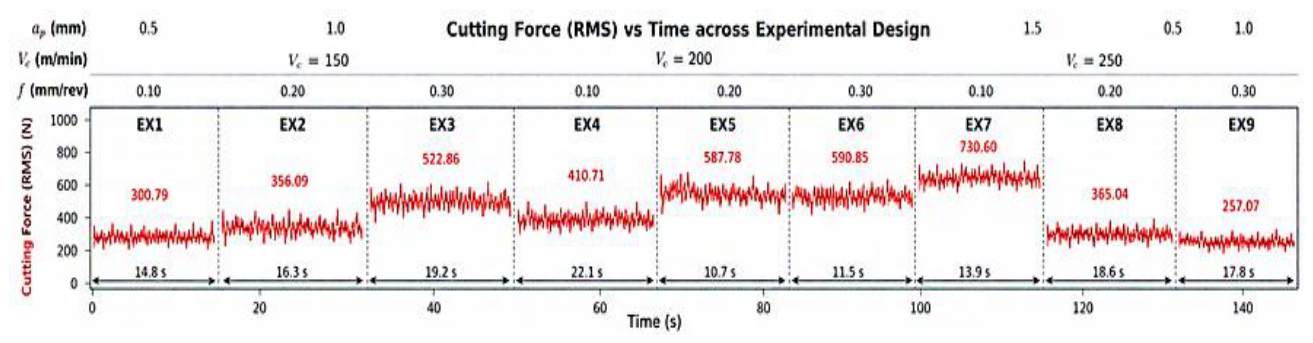
Table 1.
Chemical composition of C45 steel (1.0503) according to EN 10083-2 [20].
Table 1.
Chemical composition of C45 steel (1.0503) according to EN 10083-2 [20].
| Element | C | Si | Mn | P max | S max | Cr max | Ni | Mo |
| Weight (%) | 0.42-0.50 | ≤0.40 | 0.50-0.80 | ≤0.045 | ≤0.045 | ≤0.40 | ≤0.40 | ≤0.10 |
Table 2.
Tool description of DSDNN 2020K 12 with insert SNMG 12 04 16-PR 4425.
| Tool Holder Code | Insert Code | Shank Height (H) | Shank Width (B) | Holder Type | Insert Shape | Nose Radius | Clamping System | Cutting Edge Length |
| DSDNN 2020K 12 | SNMG120416-PR 4425 | 20 mm | 20 mm | Right-hand | Square (S) | 1.6 mm | Double clamp | 12 mm |
Table 3.
L9 orthogonal experimental design and tested cutting conditions.
| Experiment No. |
Cutting Speed (V) (m/min) |
Feed Rate (f) (mm/rev) | Depth of Cut (ap) (mm) |
| 1 | 150 | 0.10 | 0.5 |
| 2 | 150 | 0.20 | 1.0 |
| 3 | 150 | 0.30 | 1.5 |
| 4 | 200 | 0.10 | 1.0 |
| 5 | 200 | 0.20 | 1.5 |
| 6 | 200 | 0.30 | 0.5 |
| 7 | 250 | 0.10 | 1.5 |
| 8 | 250 | 0.20 | 0.5 |
| 9 | 250 | 0.30 | 1.0 |
Table 4.
Experimental conditions and vibration RMS magnitude.
| No. | Depth of Cut (ap) mm | Cutting Speed (Vc) m/min | Feed Rate(f) mm/rev | Coolant | Time (s) | Vibration magnitude (RMS) (m/s²) |
| 1 | 0.5 | 150 | 0.10 | Dry | 14.80 | 9.30 |
| 2 | 1.0 | 150 | 0.20 | Dry | 16.30 | 14.85 |
| 3 | 1.5 | 150 | 0.30 | Dry | 19.20 | 19.09 |
| 4 | 1.0 | 200 | 0.10 | Dry | 22.10 | 11.72 |
| 5 | 1.5 | 200 | 0.20 | Dry | 10.70 | 10.14 |
| 6 | 0.5 | 200 | 0.30 | Dry | 11.50 | 7.85 |
| 7 | 1.5 | 250 | 0.10 | Dry | 13.90 | 12.41 |
| 8 | 0.5 | 250 | 0.20 | Dry | 18.60 | 5.99 |
| 9 | 1.0 | 250 | 0.30 | Dry | 17.80 | 5.38 |
Table 5.
Experimental conditions and active cutting force (AF RMS).
| No. | Depth of Cut (ap) mm | Cutting Speed (Vc) m/min | Feed Rate(f) mm/rev | Coolant | Time (s) | AF (RMS) (N) |
| 1 | 0.5 | 150 | 0.10 | Dry | 14.80 | 300.79 |
| 2 | 1.0 | 150 | 0.20 | Dry | 16.30 | 356.09 |
| 3 | 1.5 | 150 | 0.30 | Dry | 19.20 | 522.86 |
| 4 | 1.0 | 200 | 0.10 | Dry | 22.10 | 410.71 |
| 5 | 1.5 | 200 | 0.20 | Dry | 10.70 | 587.78 |
| 6 | 0.5 | 200 | 0.30 | Dry | 11.50 | 590.85 |
| 7 | 1.5 | 250 | 0.10 | Dry | 13.90 | 730.60 |
| 8 | 0.5 | 250 | 0.20 | Dry | 18.60 | 365.04 |
| 9 | 1.0 | 250 | 0.30 | Dry | 17.80 | 257.07 |
Table 6.
Mean surface roughness parameters (Ra and Rz) obtained from five surface measurements for each machining condition.
Table 6.
Mean surface roughness parameters (Ra and Rz) obtained from five surface measurements for each machining condition.
| No. | Depth of Cut (ap) mm | Cutting Speed (Vc) m/min | Feed Rate(f) mm/rev | Coolant | Time (s) | Mean Ra (µm) |
Mean Rz (µm) |
| 1 | 0.5 | 150 | 0.10 | Dry | 14.80 | 2.60 | 17.62 |
| 2 | 1.0 | 150 | 0.20 | Dry | 16.30 | 2.92 | 18.34 |
| 3 | 1.5 | 150 | 0.30 | Dry | 19.20 | 3.38 | 16.98 |
| 4 | 1.0 | 200 | 0.10 | Dry | 22.10 | 3.66 | 19.14 |
| 5 | 1.5 | 200 | 0.20 | Dry | 10.70 | 2.29 | 15.64 |
| 6 | 0.5 | 200 | 0.30 | Dry | 11.50 | 2.13 | 14.78 |
| 7 | 1.5 | 250 | 0.10 | Dry | 13.90 | 2.19 | 12.17 |
| 8 | 0.5 | 250 | 0.20 | Dry | 18.60 | 2.13 | 10.78 |
| 9 | 1.0 | 250 | 0.30 | Dry | 17.80 | 2.30 | 10.83 |
Table 7.
Experimental conditions and measured form deviations: straightness (STRt), roundness (RONt), and cylindricity (CYLt).
Table 7.
Experimental conditions and measured form deviations: straightness (STRt), roundness (RONt), and cylindricity (CYLt).
| No. | Depth of Cut (ap) mm | Cutting Speed (Vc) m/min | Feed Rate(f) mm/rev | Coolant | Time (s) | STRt (μm) | RONt (μm) | CYLt (μm) |
| 1 | 0.5 | 150 | 0.10 | Dry | 14.80 | 3.16 | 5.36 | 25.79 |
| 2 | 1.0 | 150 | 0.20 | Dry | 16.30 | 0.61 | 3.07 | 21.92 |
| 3 | 1.5 | 150 | 0.30 | Dry | 19.20 | 0.40 | 3.02 | 21.18 |
| 4 | 1.0 | 200 | 0.10 | Dry | 22.10 | 1.68 | 4.96 | 27.55 |
| 5 | 1.5 | 200 | 0.20 | Dry | 10.70 | 5.27 | 5.94 | 22.26 |
| 6 | 0.5 | 200 | 0.30 | Dry | 11.50 | 0.48 | 3.02 | 25.65 |
| 7 | 1.5 | 250 | 0.10 | Dry | 13.90 | 0.66 | 2.56 | 21.35 |
| 8 | 0.5 | 250 | 0.20 | Dry | 18.60 | 1.50 | 9.21 | 37.40 |
| 9 | 1.0 | 250 | 0.30 | Dry | 17.80 | 2.32 | 7.02 | 33.63 |
Table 9.
Pearson correlation matrix for measured machining responses (n = 9).
| Variable | AF | Vibration | Ra | Rz | STRt | RONt | CYLt |
| AF | 1.000 | 0.329 | -0.197 | -0.076 | -0.143 | -0.561 | -0.595 |
| Vibration | 0.329 | 1.000 | 0.678 | 0.610 | -0.360 | -0.699 | -0.769 |
| Ra | -0.197 | 0.678 | 1.000 | 0.766 | -0.217 | -0.304 | -0.299 |
| Rz | -0.076 | 0.610 | 0.766 | 1.000 | 0.028 | -0.481 | -0.586 |
| STRt | -0.143 | -0.360 | -0.217 | 0.028 | 1.000 | 0.485 | 0.061 |
| RONt | -0.561 | -0.699 | -0.304 | -0.481 | 0.485 | 1.000 | 0.865 |
| CYLt | -0.595 | -0.769 | -0.299 | -0.586 | 0.061 | 0.865 | 1.000 |
Disclaimer/Publisher’s Note: The statements, opinions and data contained in all publications are solely those of the individual author(s) and contributor(s) and not of MDPI and/or the editor(s). MDPI and/or the editor(s) disclaim responsibility for any injury to people or property resulting from any ideas, methods, instructions or products referred to in the content. |
© 2026 by the authors. Licensee MDPI, Basel, Switzerland. This article is an open access article distributed under the terms and conditions of the Creative Commons Attribution (CC BY) license (http://creativecommons.org/licenses/by/4.0/).
Copyright: This open access article is published under a Creative Commons CC BY 4.0 license, which permit the free download, distribution, and reuse, provided that the author and preprint are cited in any reuse.