
Submitted:
29 September 2026
Posted:
30 September 2026
You are already at the latest version
Abstract
Background/Objectives: Bangladesh carries one of the world's highest estimated childhood lead burdens alongside a substantial undernutrition burden, yet no nationally representative study has examined the association of blood lead levels (BLLs) with anthropometric failure.
Methods: We analysed data from the 2025 Bangladesh Multiple Indicator Cluster Survey, including 10,495 children aged 12–59 months with BLLs and anthropometric measurements. Venous blood lead, arsenic, cadmium, and mercury were measured alongside anthropometry. Associations of BLLs with height-for-age (HAZ), weight-for-age (WAZ), and weight-for-height (WHZ) z-scores were estimated using linear regression; associations with stunting, wasting, underweight, and the Composite Index of Anthropometric Failure (CIAF, comprising six disaggregated failure categories) were estimated using modified Poisson regression yielding adjusted prevalence ratios (APRs). Models considered continuous standardised log-transformed BLLs and elevated BLLs (≥5 µg/dL), with and without adjustment for arsenic, cadmium, mercury, and covariates.
Results: The prevalence of stunting, wasting, underweight, and CIAF was 25.9%, 14.1%, 26.6%, and 38.2%, respectively. Elevated blood lead prevalence was 38.6 Higher BLLs were significantly associated with lower HAZ (β=-0.075), WAZ (β=-0.062), and WHZ (β=-0.029), and with higher prevalence of stunting (APR=1.09), wasting (APR=1.08), underweight (APR=1.08), and CIAF (APR=1.07), largely unchanged after adjustment for co-exposure. The association of WHZ was not significant with elevated BLLs. BLLs were associated with several CIAF patterns, most strongly the combined stunting-wasting-underweight category (APR =1.18), with significant associations present across every category involving stunting. In exploratory analyses, elevated BLLs were also significantly associated with household soil lead concentration (APR=1.20), occupational contact with lead-related work (APR=1.08), and child pica behaviour (APR=1.18), and were inversely associated with solid fuel use for cooking (APR=0.78). Elevated BLL prevalence varied substantially by district (range 4.4–93.7%), with higher burden concentrated in the central-eastern region.
Conclusions: BLLs are independently associated with impaired growth and specific patterns of CIAF among Bangladeshi children. These findings support prioritising lead-specific source control and integrating growth monitoring with environmental exposure surveillance in national child health programming, and suggest CIAF-based surveillance may capture lead's population-level nutritional burden more fully than single indicators alone. Household soil lead, occupational exposure, and child pica behaviour represent modifiable targets for source-control interventions.
Keywords:
blood lead level
; child undernutrition
; composite index of anthropometric failure
; stunting
; wasting
; underweight
; heavy metal exposure
; Bangladesh
; Multiple Indicator Cluster Survey
1. Introduction
Child undernutrition remains one of the most persistent global public health challenges. In 2024, an estimated 150.2 million children under five years of age were stunted and 42.8 million were wasted worldwide [1]. Undernutrition is a leading underlying contributor to child morbidity and mortality. Despite decades of global nutrition programming, progress toward the 2030 Sustainable Development Goal targets remains insufficient in most countries [1].
Alongside this nutritional burden, environmental lead exposure represents a pervasive and preventable threat to child health. Lead has no known beneficial biological function and can adversely affect the nervous, hematological, cardiovascular, renal, and immune systems. Children are particularly vulnerable because of their developing physiology and greater susceptibility to lead absorption, and no blood lead levels (BLLs) have been identified as safe: evidence of adverse neurodevelopmental effects extends to relatively low exposure levels [2]. Globally, approximately one in three children—up to 800 million—have been estimated to have BLLs ≥5 µg/dL, with a substantial proportion of affected children living in South Asia [3]. The consequences extend beyond individual health. Global modelling has estimated large losses in cognitive potential and substantial economic costs attributable to lead exposure (US$6·0 trillion globally in 2019), with a disproportionate share of this burden borne by low- and middle-income countries (LMICs) [4].
Bangladesh exhibits this dual burden at a national scale. In 2025, stunting, wasting, and underweight affected approximately 24%, 12.9%, and 23% of children under five years of age, respectively [5], and a substantial proportion of Bangladeshi children experience more than one form of anthropometric failure simultaneously in 2022[6]. Bangladesh also carries one of the largest population-level burdens of childhood lead exposure documented globally. UNICEF previously estimated that approximately 35.5 million Bangladeshi children had BLLs ≥5 µg/dL, placing Bangladesh among the countries with the largest absolute numbers of lead-exposed children globally [3]. Around 38.4% of children aged 12–59 months had elevated BLLs (≥5 µg/dL), with a mean BLLs of 5.21 µg/dL in 2025 [5]. This exposure has been attributed to dietary contamination, most notably lead-adulterated turmeric, alongside informal used lead-acid battery recycling, lead-containing paints, soldered food containers, and other occupational and environmental sources [3,7,8,9].
Both lead exposure and childhood undernutrition can have lasting consequences for physical growth and human capital across the life course, and a growing body of epidemiological evidence links childhood lead exposure to impaired physical growth. Existing Bangladeshi studies of lead and child growth, however, have relied on geographically selected samples, limiting ability to yield nationally generalisable estimates [10,11]. Furthermore, previous research has primarily focused on single anthropometric indicators, rather than examining whether lead exposure is associated with multiple, co-occurring dimensions of growth impairment, such as those captured by the Composite Index of Anthropometric Failure (CIAF). The 2025 Bangladesh Multiple Indicator Cluster Survey (MICS), which incorporated venous blood lead measurement alongside standard anthropometry, provides a nationally representative opportunity to address this gap. Therefore, this study aimed to examine the associations of BLLs among Bangladeshi children aged 12–59 months with height-for-age, weight-for-age, and weight-for-height z-scores; the corresponding binary undernutrition indicators; and composite anthropometric failure as defined by the CIAF.
2. Materials and Methods
2.1. Study Design and Participants
This study was a secondary analysis of data from the 2025 Bangladesh MICS (7th round), a nationally representative household survey implemented by the Bangladesh Bureau of Statistics. This survey employed a two-stage, stratified cluster sampling design using the sampling frame developed from the 2022 Population and Housing Census. In the first stage, 3,149 enumeration areas (EAs) were selected as primary sampling units using probability-based sampling. In the second stage, 20 households were systematically selected from each sampled EA, resulting in a total of 62,980 selected households. The sampling design comprised 131 sampling strata to ensure geographic representativeness, including urban and rural areas within the eight administrative divisions, the 64 districts, and Dhaka North City Corporation, Dhaka South City Corporation, and Chattogram City Corporation. Details of the sampling can be found elsewhere [5].
Among 24,680 children in the children's file, 10,661 had a blood sample collected for heavy metal testing. Of these, 10,634 had valid laboratory results. For undernutrition outcomes, the analytic sample was 10,495 children aged 12–59 months and followed complete case analysis. The detailed sample selection procedure is shown in Supplementary Figure S1.
2.2. Outcome Variables
Child anthropometry (height/length and weight) was converted to height-for-age (HAZ), weight-for-age (WAZ), and weight-for-height (WHZ) z-scores using the WHO Child Growth Standards, excluding biologically implausible values per the WHO flagging algorithm [12]. Stunting, underweight, and wasting were defined as HAZ, WAZ, and WHZ below -2 SD, respectively [12]. The CIAF classified each child into one of seven mutually exclusive groups (no failure; wasting only; wasting and underweight; stunting, wasting, and underweight; stunting and underweight; stunting only; underweight only) [13]. CIAF was additionally collapsed into a binary indicator (any failure vs. no failure).
2.3. Exposure Variables
BLLs (µg/dL) were natural-log transformed to reduce right-skewness and standardised to a z-score, and analysed continuously as the primary exposure. BLLs were additionally dichotomised at ≥5 µg/dL as elevated BLLs, consistent with the MICS7 protocol threshold [5], and examined in parallel models. Blood arsenic, cadmium, and mercury concentrations (µg/L) were similarly log-transformed and standardised. These three metals were included in mutually-adjusted models as co-occurring exposures, rather than as independently confounder-adjusted exposures in their own right, to test whether the lead-outcome association was robust to co-exposure.
2.4. Covariates and Confounding Framework
Covariates were selected a priori based on prior literature establishing pathways to both blood lead exposure and child undernutrition [5,6,14,15,16,17,18]. The primary model was adjusted for child sex, child age group in months (12-23, 24-35, 36-47, 48-59), maternal education (pre-primary/none, primary, secondary, higher), place of residence (rural, urban), administrative division (Barishal, Chattogram, Dhaka, Khulna, Mymensingh, Rajshahi, Rangpur, Sylhet), and household wealth quintile (poorest, poorer, middle, richer, richest).
2.5. Statistical Analysis
Descriptive characteristics were summarised as unweighted frequencies and survey-weighted percentages. Bivariate associations between background characteristics and each anthropometric outcome were assessed using Rao–Scott design-based chi-square tests. Metal co-exposure was described by classifying each child according to the number of metals (0–4) with concentrations in the highest quartile of the sample distribution. Pairwise Spearman correlation coefficients were determined among the four log-transformed metal concentrations to assess the degree of inter-metal correlation. Variance inflation factors (VIF) were calculated for all exposure and covariates; all values were below 10, indicating no substantial multicollinearity.
Associations between BLLs and the three continuous anthropometric outcomes (HAZ, WAZ, and WHZ) were estimated using linear regression, with coefficients representing the adjusted mean difference in z-score per 1-SD increase in log-transformed metal concentration. For each outcome, two models were fitted: Model 1 included BLLs alone with covariates; Model 2 additionally included arsenic, cadmium, and mercury as mutually-adjusted co-occurring exposures. This two-model structure was repeated using elevated BLLs (≥5 µg/dL) as the primary exposure.
Associations with binary anthropometric outcomes (stunting, wasting, underweight, and CIAF) were estimated using modified Poisson regression with robust variance estimation, yielding adjusted prevalence ratios (PRs). This approach was selected because outcome prevalence was common [19,20,21]. The same Model 1/Model 2 structure was applied for continuous and elevated BLLs exposure.
The six disaggregated CIAF failure categories were each modelled as a separate binary outcome (category vs. no failure) using modified Poisson regression, consistent with the modelling approach used for the primary binary indicators, for both continuous and elevated BLLs exposure, in covariate-adjusted and mutually metal-adjusted specifications.
As a supplementary analysis to contextualise Bangladesh’s national BLL burden, household, environmental, and demographic correlates of elevated BLLs were examined using modified Poisson regression. Candidate determinants included household soil lead concentration (quartile), neighbourhood informal lead-related industry proximity, household occupational contact with lead-related work, paint condition, child pica behaviour, cooking-fuel type, and sanitation access, together with the demographic and socioeconomic covariates described above; variable definitions and categorisation are provided in Table S1. District-level prevalence of elevated BLLs, mean BLLs, and each growth-failure indicator (stunting, wasting, underweight, CIAF) was mapped spatially.
All analyses accounted for the complex survey design, including primary sampling unit clustering, stratification, and blood-specimen sampling weights. Statistical significance was defined as two-sided p<0.05. Analyses were conducted in RStudio (R version 4.6.1).
3. Results
3.1. Participant Characteristics
Among 10,634 children aged 12–59 months with a valid blood metal laboratory result, 10,495 (98.7%) had complete data and were included in the analytic sample. The prevalence of elevated BLLs (≥5 µg/dL) was 38.6%. Over half of the children were male (52.5%), and the largest proportion were aged 48–59 months (28.2%). More than half of mothers had completed secondary education (54.6%). The sample was predominantly rural (70.7%), with the largest proportions of children in Dhaka (24.1%) and Chattogram (23.2%) divisions (Table 1).
Among the four metals, 28.3% of children were not in the highest exposure quartile for any metal, 39.6% were in the highest quartile for one metal, 24.2% for two metals, 7.1% for three metals, and 0.8% for all four metals simultaneously (Supplementary Table S2). Spearman correlations among the four metals were weak to modest; the strongest correlation was observed between lead and cadmium (ρ=0.23), while correlations among the remaining metal pairs ranged from -0.03 to 0.07 (Figure S2).
3.2. Household, Environmental, and Demographic Determinants of Elevated Blls
Children in the highest quartile of household soil lead concentration had a significantly higher adjusted prevalence of elevated BLLs than those in the lowest quartile (APR=1.20, 95% CI: 1.09–1.31, p<0.001), with a corresponding dose–response relationship across quartiles. Household occupational contact with lead-related work was associated with a modestly higher prevalence of elevated BLLs (APR=1.08, 95% CI: 1.00–1.17, p=0.048), and children with the most frequent pica behaviour had a higher prevalence than those with none (APR=1.18, 95% CI: 1.05–1.33, p=0.006). Solid fuel use for cooking was associated with a lower prevalence of elevated BLLs (APR=0.78, 95% CI: 0.72–0.85, p<0.001). Several demographic and socioeconomic covariates were also independently associated with elevated BLLs in the adjusted model: male sex (APR=1.15, 95% CI: 1.09–1.22, p<0.001), younger child age (APR=1.18, 95% CI: 1.08–1.28, p<0.001), lower maternal education (APR=1.46, 95% CI: 1.30–1.65, p<0.001), urban residence (APR=1.09, 95% CI: 1.00–1.17, p=0.038), and administrative division, with Dhaka and Sylhet divisions showing higher prevalence and Khulna and Rajshahi divisions markedly lower prevalence relative to Barishal (all p<0.001) (Table S3).
3.3. Distribution of Undernutrition
Overall, the prevalence of stunting, wasting, underweight, and CIAF was 25.9%, 14.1%, 26.6%, and 38.2%, respectively (Table 2). Elevated BLLs were associated with a higher prevalence of stunting (27.5% vs. 24.8%, p=0.014) but not with wasting, underweight, or CIAF prevalence in bivariate analysis. Stunting prevalence decreased with increasing child age (p<0.001), whereas wasting (p=0.018) and underweight (p=0.034) increased. Maternal education and household wealth showed strong inverse gradients with all four undernutrition indicators. Undernutrition prevalence also varied significantly by division, ranging from 21.9% (Dhaka) to 40.0% (Sylhet) for stunting, 11.7% (Dhaka) to 17.3% (Rajshahi) for wasting, 19.8% (Dhaka) to 35.4% (Sylhet) for underweight, and 32.4% (Dhaka) to 50.9% (Sylhet) for CIAF.
3.4. Geographic Distribution of Elevated Blls and Anthropometric Failure at District Level
District-level elevated-BLL prevalence ranged from 4.4% to 93.7%, with the highest burden concentrated in the central-eastern region. Stunting prevalence was higher in the north-eastern region, whereas wasting and underweight were more prevalent in peripheral districts (Figure 1).
3.5. Associations of Blls with Continuous Anthropometric Outcomes
Higher BLLs were significantly associated with lower HAZ (β=-0.075, 95% CI: -0.103, -0.046, p<0.001), WAZ (β=-0.062, 95% CI: -0.088, -0.036, p<0.001), and WHZ (β=-0.029, 95% CI: -0.055, -0.003, p=0.031). The lead coefficient was almost unchanged in the mutually-adjusted models across all three anthropometric outcomes (Table 3). Furthermore, children with BLLs ≥5 µg/dL had significantly lower HAZ (β=-0.10, 95% CI: -0.17, -0.04, p=0.001), and WAZ (β=-0.07, 95% CI: -0.13, -0.01, p=0.015) than children below this threshold. The association with WHZ was not statistically significant (Table S4).
Model 1 included BLLs as exposure and was adjusted for covariates (child sex, child age, maternal education, place of residence, division, and household wealth).
Model 2 is a mutually metal adjusted model including BLLs as exposure, and arsenic, cadmium, and mercury as co-occurring exposures, and adjusting for covariates (child sex, child age, maternal education, place of residence, division, and household wealth).
3.6. Associations of Blls with Binary Anthropometric Outcomes
In the modified Poisson regression models, higher BLLs were associated with a significantly higher prevalence of stunting (APR=1.09, 95% CI: 1.05, 1.14, p<0.001), wasting (APR=1.08, 95% CI: 1.02, 1.15, p=0.012), underweight (APR=1.08, 95% CI: 1.04, 1.13, p<0.001), and CIAF (APR=1.07, 95% CI: 1.04, 1.11, p<0.001). These associations were essentially unchanged in mutually-adjusted models (Table 4). Furthermore, children with elevated BLLs were associated with a significantly higher prevalence of stunting (APR=1.13, 95% CI: 1.04, 1.23, p=0.003), underweight (APR=1.11, 95% CI: 1.01, 1.21, p= 0.023), and CIAF (APR=1.10, 95% CI: 1.03, 1.17, p= 0.004), but were not significantly associated with wasting (Table S5).
Model 1 included BLLs as exposure and was adjusted for covariates (child sex, child age, maternal education, place of residence, division, and household wealth).
Model 2 is a mutually metal adjusted model including BLLs as exposure, and arsenic, cadmium, and mercury as co-occurring exposures, and adjusting for covariates (child sex, child age, maternal education, place of residence, division, and household wealth).
3.7. Associations of Blls with Composite Anthropometric Failure (Ciaf)
Higher BLLs were associated with several CIAF patterns, including wasting with underweight (APR=1.14, 95% CI: 1.04–1.25, p=0.008), stunting with wasting and underweight (APR=1.18, 95% CI: 1.06–1.31, p=0.003), stunting with underweight (APR=1.11, 95% CI: 1.04–1.19, p=0.003), and stunting alone (APR=1.12, 95% CI: 1.03–1.21, p=0.007). These associations remained unchanged after adjustment for co-occurring metals (Table 5). Elevated BLLs were significantly associated with several CIAF patterns, including wasting with underweight (APR=1.24, 95% CI: 1.02–1.51, p=0.031), stunting with underweight (APR=1.17, 95% CI: 1.02–1.33, p=0.024), and stunting alone (APR=1.22, 95% CI: 1.05–1.42, p=0.010) (Table S6).
Model 1 included BLLs as exposure and was adjusted for covariates (child sex, child age, maternal education, place of residence, division, and household wealth).
Model 2 is a mutually metal adjusted model including BLLs as exposure, and arsenic, cadmium, and mercury as co-occurring exposures, and adjusting for covariates (child sex, child age, maternal education, place of residence, division, and household wealth).
4. Discussion
This study examined the associations of BLLs with linear and ponderal growth, and CIAF among Bangladeshi children aged 12–59 months. In this nationally representative sample, elevated BLLs (≥5 µg/dL) affected 38.6% of children. Higher BLLs were independently and consistently associated with anthropometric failure, including lower HAZ, WAZ, and WHZ, and a higher prevalence of stunting, wasting, underweight, and specific CIAF patterns. These associations persisted after adjustment for co-exposure to arsenic, cadmium, and mercury.
The prevalence of elevated BLLs observed here is lower than reported in earlier Bangladeshi studies that sampled convenience groups or known contamination hotspots. In a multi-site study of children in Dhaka and Dinajpur, 54% had BLLs >10 µg/dL [16]. In a Dhaka slum, 86.6% of children under two years had BLLs ≥5 µg/dL [11]. A rural birth cohort reported a prevalence at 20–40 months of age of 79% at one site and 14% at another [10]. Comparable, or higher, BLLs have been reported elsewhere in South Asia. A comprehensive review of BLLs across India, Bangladesh, Pakistan, Nepal, and Sri Lanka found that reported BLLs frequently exceeded the current US Centers for Disease Control and Prevention reference value of 3.5 µg/dL across the region [22]. A systematic review and meta-analysis of Indian children estimated a considerably higher pooled mean BLLs of 10.4 µg/dL, rising to 14.3 µg/dL among children with known lead-exposure sources [23]. Together, these findings position Bangladesh's national BLLs burden as substantial within South Asia, reflecting a shared, region-wide exposure problem.
Several overlapping pathways plausibly explain this high prevalence despite growing policy attention in Bangladesh [24,25]. Dietary contamination has been particularly well documented. Lead-chromate adulteration of turmeric, added to improve its colour and weight, was identified as a major source of childhood lead exposure in rural Bangladesh [7,9]. Other studies have implicated soldered food containers and metal cookware as additional dietary-contact sources [7,8]. Encouragingly, a coordinated food-safety enforcement effort combining rapid on-site lead detection with market-level regulatory action reduced detectable lead in turmeric from 47% to virtually none at Bangladesh's largest wholesale market between 2019 and 2021. This effort was accompanied by a corresponding 30% decline in the BLLs of exposed mill workers [26], demonstrating that source-specific intervention can meaningfully reduce population exposure. Environmental sources have proved harder to control. Informal recycling of used lead-acid batteries (ULAB) is widespread in Bangladesh and generates severely contaminated soil around recycling sites, with soil lead concentrations exceeding 100,000 mg/kg documented near one abandoned site. Children's BLLs fell substantially only after soil remediation [27,28]. Consistent with this evidence, household soil lead concentration, occupational contact with lead-related work, and child pica behaviour were each independently associated with elevated BLLs in the present national sample, extending the informal-recycling and soil-ingestion pathways described above directly into the home. Beyond these point sources, broader environmental pollution from vehicle traffic, industrial emissions, and lead-containing paints and consumer products contributes to ambient and household-level exposure [8]. Solid fuel use for cooking was, conversely, associated with a lower adjusted prevalence of elevated BLLs, a counterintuitive finding that may reflect its inverse correlation with the soldered metal cookware and imported products implicated in dietary lead contamination [7,8] rather than a protective effect.
In this study, BLLs were inversely associated with HAZ, and elevated BLLs were associated with significantly higher stunting prevalence. This is consistent with two previous Bangladeshi studies. A two-site birth cohort of 618 children found that concurrent BLLs were associated with stunting at 20–40 months of age [10], and a cross-sectional study of children under two years in a Dhaka slum reported a similar association [11]. Comparable South Asian evidence beyond Bangladesh is limited. The regional review [22] and the Indian meta-analysis [23] discussed above both confirm widespread elevated exposure but do not directly model growth outcomes, indicating a gap in South Asian evidence linking BLLs to anthropometric failure outside Bangladesh. Evidence from other LMICs is broadly consistent. In Benin, children in the highest lead-exposure quartile had higher odds of stunting among girls in sex-specific analyses [29]. In Uganda, concurrent BLLs were inversely associated with HAZ among children aged 6–59 months [30]. Associations between lead exposure and impaired linear growth have also been reported among children in the Peruvian Amazon [31], Mexico [32], and Indonesia [33].
BLLs modelled continuously were also significantly associated with lower WHZ, and higher BLLs were similarly associated with a higher prevalence of wasting in this study. This association did not persist when lead was dichotomised at ≥5 µg/dL, and a similar null finding using a threshold-based definition was reported in the same Dhaka slum cohort [11]. No other Bangladeshi or South Asian study has modelled lead continuously against WHZ, limiting direct regional comparison. Among other LMICs, a cohort study from Benin found no overall association between lead-exposure quartiles and WHZ or wasting [29], and comparable continuous-exposure analyses were not identified in the literature. This divergence between continuous and threshold-based findings may reflect how exposure was modelled. Dichotomising BLLs at a single cut-point assumes an abrupt change in risk and discards variation within each group, which may attenuate a modest, gradual association toward the null. The larger sample size of this study relative to prior work may also have provided greater precision to detect a small effect. Nevertheless, the magnitude of the WHZ association was small, and this inconsistency should be interpreted cautiously and replicated in other large populations.
Furthermore, this study found that the lead–WAZ association remained significant and stable across model specifications, with a corresponding increase in underweight prevalence. Among Bangladeshi children, this corroborates a previous cross-sectional study reporting associations between lead exposure and lower body mass index or underweight in a Dhaka slum [11]. No other nationally representative or South Asian study has examined this association directly. Evidence from other LMICs and developed-country settings assessing lead exposure alongside anthropometric or weight-related indicators has been mixed [29,31,34,35,36,37]. Differences in study populations, children's ages, exposure levels, nutritional conditions, and analytical approaches may partly explain these inconsistent findings.
In addition, we also found that higher BLLs were also associated with several patterns of CIAF. The association was strongest for the most complex failure pattern (stunting, wasting, and underweight combined; APR=1.18) and was present across every CIAF category that included a stunting component. To our knowledge, no prior study—in Bangladesh, South Asia, or elsewhere—has examined the association between BLLs, or any heavy metal, and CIAF specifically. Prior applications of CIAF in Bangladesh have characterised its association with sociodemographic determinants [6] and with infectious exposures. Asymptomatic Shigella infection, for example, was significantly associated with the CIAF in a Bangladeshi birth cohort [38], and the present findings extend this precedent to an environmental exposure. This pattern was consistent with the single-indicator findings. Every CIAF category reaching statistical significance included a stunting component, while isolated wasting and isolated underweight, without concurrent stunting, were both null. This corroborates the continuous-outcome findings, in which lead's association was strongest for HAZ and WAZ and weakest for WHZ. Together, these results suggest that lead's principal anthropometric signature in this population may operate through impaired linear growth. Given the cross-sectional design, however, these findings should be interpreted cautiously.
The association between lead exposure and different forms of undernutrition observed here can plausibly be explained through several biological pathways. First, lead has been shown to suppress growth hormone release and reduce circulating insulin-like growth factor-1 (IGF-1) in both children and animal models [39,40,41]. This could impair osteoblast function and bone mineralisation [42], providing biological plausibility for the observed effect on linear growth. A meta-analysis of prenatal lead exposure and birth weight found a significant inverse association [43], and low birth weight is an established risk factor for later stunting, offering one plausible early-life pathway. Second, lead exposure has been associated with gastrointestinal disturbance and reduced food intake in experimental and observational studies [44,45,46]. This pathway may be particularly relevant in Bangladesh, given the high background prevalence of environmental enteric dysfunction among young children. A recent Bangladeshi cohort found biomarkers of intestinal inflammation elevated in over 90% of infants, with poorer ponderal growth among children with greater intestinal inflammation [47]. Concurrent gut dysfunction could therefore compound any appetite-suppressing effect of lead on ponderal growth. Third, the relationship between lead exposure and nutritional status may be bidirectional. Iron deficiency can increase gastrointestinal lead absorption [48,49], and iron and other micronutrient deficiencies are common among Bangladeshi children, whose complementary diets frequently cannot affordably meet recommended micronutrient requirements [50]. Fourth, lead-associated immune dysfunction could contribute to a cycle of microbial infection, diarrhoea, and undernutrition [51]. This pathway may be reinforced in Bangladesh by concurrent arsenic exposure from groundwater, which has itself been associated with wasting and underweight in rural Bangladeshi children [52] and co-occurred with lead in the exposure patterns observed in this sample. Because of the cross-sectional design, the temporal direction and relative contribution of these pathways cannot be established here. Longitudinal studies with repeated measures of lead exposure, gut health, micronutrient status, and growth are needed to disentangle them in the Bangladeshi context.
This study has several strengths. It draws on the first nationally representative survey in Bangladesh to combine venous blood metal biomarkers with concurrent anthropometry, yielding a large analytic sample with survey-weighted estimates generalisable to the national child population. It also assessed lead's association with growth after adjustment for co-exposure to arsenic, cadmium, and mercury, and extended single-indicator analyses to composite anthropometric failure, identifying overlapping failure patterns associated with lead exposure. Several limitations also warrant consideration. First, the cross-sectional design means that exposure and outcomes were measured concurrently. Temporality therefore cannot be established, and the findings should not be interpreted as demonstrating causality. Reverse causation is also possible, particularly for nutritional outcomes, whereby undernourished children absorb proportionally more ingested lead. Second, BLLs reflect recent exposure given its relatively short half-life, and may not capture cumulative exposure most relevant to outcomes that develop over months to years. Third, although the study adjusted for several important sociodemographic factors, residual confounding cannot be excluded. Fourth, arsenic, cadmium, and mercury were included in mutually-adjusted models solely to test the robustness of the lead-outcome association to co-exposure. Their own coefficients are not reported and should not be interpreted as evidence of an absent or present independent effect of these metals, as the covariate set used was not constructed to satisfy confounder-adjustment criteria specific to their individual exposure pathways.
Bangladesh has established several platforms relevant to lead exposure, including clinical guidance for lead poisoning, environmental regulations governing ULAB recycling, and national biomarker surveillance through MICS 2025 [5,24,25]. The observed inverse associations between BLLs and anthropometric indicators indicate that lead exposure should be considered within Bangladesh's child growth and nutrition agenda. Rather than implementing universal screening, blood lead testing and environmental investigation could initially be prioritised in communities with known or suspected sources, including informal ULAB recycling and contaminated food or consumer products. Equitable access to blood lead testing remains important, however, given the limited availability of reference laboratories equipped to measure BLLs in Bangladesh [24]. Geographic targeting could therefore help optimise scarce diagnostic resources while expanding testing capacity. Integrating growth monitoring with environmental source control in high-burden areas may provide a more efficient approach to reducing both lead exposure and its potential nutritional consequences than nutrition-focused interventions operating independently of environmental measures. The present determinants analysis offers additional, actionable targets for source-control efforts. Household soil lead testing, prioritised in areas near informal battery-recycling and industrial sites, could identify homes where soil remediation, already shown to reduce children’s BLLs at contaminated point sources [27,28], would most benefit exposed children. Occupational health measures for household members engaged in battery manufacturing, repair, or recycling, jewellery recycling, e-waste processing, or automobile repair, such as workplace hygiene practices, protective clothing, and avoiding take-home contamination through changing clothes and washing before contact with children, could reduce household-level exposure from these informal industries. Given the association between child pica behaviour — reported as ingestion of dirt or paint chips — and elevated BLLs, caregiver education on safe play environments, handwashing, and addressing underlying iron deficiency, a known risk factor for pica, may help reduce direct dirt and paint-chip ingestion, particularly in homes with peeling, chipping, or cracking paint or elevated household soil lead. Finally, a coordinated approach linking source control, environmental surveillance, food-safety monitoring, clinical management, and population-level biomonitoring could strengthen Bangladesh's existing systems for addressing childhood lead exposure and its potential contribution to poor growth.
5. Conclusions
In this nationally representative sample of Bangladeshi children, BLLs were independently associated with impaired linear and ponderal growth, elevated stunting, wasting, and underweight prevalence, and specific patterns of composite anthropometric failure, particularly those involving stunting. Household soil lead concentration, occupational contact with lead-related work, and child pica behaviour emerged as significant, modifiable correlates of elevated BLLs, highlighting concrete targets for exposure-reduction efforts. These findings position lead exposure as a nutritionally relevant public health concern in Bangladesh and support prioritising source-control interventions, integrating growth surveillance with environmental exposure monitoring.
Supplementary Materials
The following supporting information can be downloaded at the website of this paper posted on Preprints.org. Figure S1: Sample selection procedure; Table S1: Definitions and categorisation of variables included in this study; Table S2: Metal co-occurrence according to the number of metals in the highest exposure quartile; Figure S2: Spearman correlations among blood metal concentrations (unweighted analysis); Table S3: Household, environmental, and demographic determinants of elevated BLLs (≥5 µg/dL) among children aged 12–59 months, Bangladesh; Table S4: Associations of elevated BLLs (≥5 µg/dL) with anthropometric outcomes; Table S5: Associations of elevated BLLs (≥5 µg/dL) with binary anthropometric outcomes; Table S6: Associations of elevated BLLs (≥5 µg/dL) with specific patterns of composite anthropometric failure.
Author Contributions
Conceptualization: R.H.; Data curation: R.H.; Formal analysis: R.H.; Investigation: R.H.; Methodology: R.H.; Project administration: R.H.; Resources: R.H.; Software: R.H.; Supervision: S.S., M.R.A. and M.A.; Validation: R.H., S.S., M.A. and M.R.A.; Visualization: R.H.; Writing—original draft: R.H., A.H.B.K., T.A., M.A., M.R.A. and S.S.; Writing—review and editing: R.H., A.H.B.K., T.A., M.A., M.R.A. and S.S.; All authors have read and agreed to the published version of the manuscript.
Funding
This research received no external funding.
Institutional Review Board Statement
The study was conducted in accordance with the Declaration of Helsinki. The 2025 Bangladesh Multiple Indicator Cluster Survey was approved by the icddr,b Ethical Review Committee (Protocol No. PR-24113). This study is a secondary analysis of de-identified, publicly available survey data; therefore, no additional institutional review board approval was required.
Informed Consent Statement
Verbal informed consent was obtained from all respondents in the parent survey, and written informed consent was obtained for the blood testing component. Not applicable for this secondary analysis of de-identified data.
Data Availability Statement
The data presented in this study were derived from the 2025 Bangladesh Multiple Indicator Cluster Survey (MICS), which is publicly available from UNICEF's MICS Data Archive (https://mics.unicef.org) following registration and data request procedures.
Acknowledgments
The authors thank the Bangladesh Bureau of Statistics and UNICEF for conducting the 2025 Multiple Indicator Cluster Survey and making the dataset available for secondary analysis.
Conflicts of Interest
The authors declare no conflicts of interest.
References
- United Nations Children’s Fund (UNICEF); World Health Organization; International Bank for Reconstruction and Development/The World Bank. Levels and trends in child malnutrition: UNICEF/WHO/World Bank Group joint child malnutrition estimates: key findings of the 2025 edition; World Health Organization: Geneva, 2025. [Google Scholar]
- World Health Organization. Lead poisoning. Available online: https://www.who.int/news-room/fact-sheets/detail/lead-poisoning-and-health (accessed on 9 September 2026).
- UNICEF; Pure Earth. The toxic truth: children’s exposure to lead pollution undermines a generation of future potential. 2020. Available online: https://www.unicef.org/media/73246/file/the-toxic-truth-children%e2%80%99s-exposure-to-lead-pollution-2020.pdf (accessed on 9 September 2026).
- Larsen, B.; Sánchez-Triana, E. Global health burden and cost of lead exposure in children and adults: a health impact and economic modelling analysis. Lancet Planet Health 2023, 7(10), e831–e840. [Google Scholar] [CrossRef] [PubMed]
- Bangladesh Bureau of Statistics (BBS); UNICEF. Bangladesh Multiple Indicator Cluster Survey 2025; BBS/UNICEF: Dhaka, 2026. [Google Scholar]
- Hassan, R.; Hossain, S.; Alam, M.M.; Saha, S.; Akter, T.; Ali, M.; Amin, M.R. Prevalence and Determinants of the Composite Index of Anthropometric Failure in Children Under Five Years in Bangladesh: Insights From a National Survey. Food Sci. Nutr. 2025, 13(6), e70499. [Google Scholar] [CrossRef] [PubMed]
- Forsyth, J.E.; Weaver, K.L.; Maher, K.; Islam, M.S.; Raqib, R.; Rahman, M.; Fendorf, S.; Luby, S.P. Sources of Blood Lead Exposure in Rural Bangladesh. Environ. Sci. Technol. 2019, 53, 11429–11436. [Google Scholar] [CrossRef] [PubMed]
- Majumder, A.K.; Al Nayeem, A.; Islam, M.; Akter, M.M.; Carter, W.S. Critical review of lead pollution in Bangladesh. J. Health Pollut. 2021, 11(31), 210902. [Google Scholar] [CrossRef] [PubMed]
- Gleason, K.; Shine, J.P.; Shobnam, N.; Rokoff, L.B.; Suchanda, H.S.; Ibne Hasan, M.O.; Mostofa, G.; Amarasiriwardena, C.; Quamruzzaman, Q.; Rahman, M.; Kile, M.L.; Bellinger, D.C.; Christiani, D.C.; Wright, R.O.; Mazumdar, M. Contaminated turmeric is a potential source of lead exposure for children in rural Bangladesh. J. Environ. Public Health 2014, 2014, 730636. [Google Scholar] [CrossRef] [PubMed]
- Gleason, K.M.; Valeri, L.; Shankar, A.H.; Hasan, M.O.; Quamruzzaman, Q.; Rodrigues, E.G.; Christiani, D.C.; Wright, R.O.; Bellinger, D.C.; Mazumdar, M. Stunting is associated with blood lead concentration among Bangladeshi children aged 2-3 years. Environ. Health 2016, 15(1), 103. [Google Scholar] [CrossRef] [PubMed]
- Raihan, M.J.; Briskin, E.; Mahfuz, M.; Islam, M.M.; Mondal, D.; Hossain, M.I.; Ahmed, A.M.S.; Haque, R.; Ahmed, T. Examining the relationship between blood lead level and stunting, wasting and underweight- A cross-sectional study of children under 2 years-of-age in a Bangladeshi slum. PLoS ONE 2018, 13(5), e0197856. [Google Scholar] [CrossRef] [PubMed]
- World Health Organization. WHO child growth standards: length/height-for-age, weight-for-age, weight-for-length, weight-for-height and body mass index-for-age: methods and development; WHO: Geneva, 2006; Available online: https://www.who.int/publications/i/item/924154693X.
- Nandy, S.; Kelly-Irving, M.; Gordon, D.; Subramanian, S.V.; Davey Smith, G. Poverty, child undernutrition and morbidity: new evidence from India. Bull. World Health Organ 2005, 83, 210–216. [Google Scholar] [CrossRef]
- Rashid, M.; Rahman, M.; Siddiqi, N.A.; Islam, R.; Miah, S.; Roy, T.K.; Rahman, M. Spatial distribution and predictors of stunting, wasting, and underweight among under-five children in Bangladesh. BMC Public Health 2026, 26(1), 1504. [Google Scholar] [CrossRef] [PubMed]
- Machmud, P.B.; Prihartono, I.; Prihartono, N.A. Blood lead levels and their association with children’s factors, nutritional status, and daily dietary intake in used lead-acid battery (ULAB) recycling area. Narra J. 2025, 5(1), e2059. [Google Scholar] [CrossRef] [PubMed]
- Mitra, A.; Ahua, E.; Saha, P. Prevalence of and risk factors for lead poisoning in young children in Bangladesh. J. Health Popul Nutr. 2012, 30, 404–409. [Google Scholar] [CrossRef] [PubMed]
- Anik, A.I.; Chowdhury, M.R.K.; Khan, H.T.A.; Mondal, M.N.I.; Perera, N.K.P.; Kader, M. Urban-rural differences in the associated factors of severe under-5 child undernutrition based on the composite index of severe anthropometric failure (CISAF) in Bangladesh. BMC Public Health 2021, 21(1), 2147. [Google Scholar] [CrossRef] [PubMed]
- Sultana, J.; Nunna, T.T.; Hasan, S.S.; Shoab, A.K.; Wobil, P.; Vandenent, M.; Alam, D.; Ferdous, J.; Begum, F.; Rahman, M.; Khatun, F.; Rasheed, S. Knowledge, attitude, and practices related to lead pollution among adolescents and caregivers of young children living near Used Lead Acid Battery (ULAB) recycling sites in Bangladesh: a cross-sectional study. BMC Public Health 2024, 24(1), 2108. [Google Scholar] [CrossRef] [PubMed]
- Chen, W.; Qian, L.; Shi, J.; Franklin, M. Comparing performance between log-binomial and robust Poisson regression models for estimating risk ratios under model misspecification. BMC Med. Res. Methodol. 2018, 18(1), 63. [Google Scholar] [CrossRef] [PubMed]
- Zhang, J.; Yu, K.F. What’s the relative risk? A method of correcting the odds ratio in cohort studies of common outcomes. JAMA 1998, 280(19), 1690–1691. [Google Scholar] [CrossRef] [PubMed]
- Zou, G. A modified Poisson regression approach to prospective studies with binary data. Am. J. Epidemiol. 2004, 159, 702–706. [Google Scholar] [CrossRef]
- Roy, R.; Das, R. Blood lead levels (BLLs), exposure pathways and health impacts in South Asia: a comprehensive review. Crit. Rev. Toxicol. 2026, 56(6), 425–445. [Google Scholar] [CrossRef] [PubMed]
- Upadhyay, K.; Balachandar, R.; Bagepally, B.S.; Ravibabu, K.; Dhananjayan, V.; Raju, N.; Yadav, G.; Ravichandran, B.; Das, S. Estimation of the pooled mean blood lead levels of Indian children: Evidence from systematic review and meta-analysis. Toxicol. Rep. 2025, 14, 101975. [Google Scholar] [CrossRef] [PubMed]
- UNICEF Bangladesh. The dangers of lead poisoning in Bangladesh. Available online: https://www.unicef.org/bangladesh/en/stories/dangers-lead-poisoning-bangladesh (accessed on 11 September 2026).
- United Nations Environment Programme. National strategy for ULAB recycling in Bangladesh. Available online: https://www.unep.org/resources/policy-and-strategy/national-strategy-ulab-recycling-bangladesh (accessed on 11 September 2026).
- Forsyth, J.E.; Baker, M.; Nurunnahar, S.; Islam, S.; Islam, M.S.; Islam, T.; Plambeck, E.; Winch, P.J.; Mistree, D.; Luby, S.P.; Rahman, M. Food safety policy enforcement and associated actions reduce lead chromate adulteration in turmeric across Bangladesh. Environ. Res. 2023, 232, 116328. [Google Scholar] [CrossRef] [PubMed]
- Chowdhury, K.I.A.; Nurunnahar, S.; Kabir, M.L.; Islam, M.T.; Baker, M.; Islam, M.S.; Rahman, M.; Hasan, M.A.; Sikder, A.; Kwong, L.H.; Binkhorst, G.K.; Nash, E.; Keith, J.; McCartor, A.; Luby, S.P.; Forsyth, J.E. Child lead exposure near abandoned lead acid battery recycling sites in a residential community in Bangladesh: Risk factors and the impact of soil remediation on blood lead levels. Environ. Res. 2021, 194, 110689. [Google Scholar] [CrossRef] [PubMed]
- Rahman, M.; Sultana, J.; Sarker, S.; Hasan, S.S.; Parvez, S.M.; Das, M.; Binkhorst, G.K.; Forsyth, J.E.; Winch, P.J.; Raqib, R.; Luby, S.P.; Kippler, M.; Rahman, S.M. Effectiveness of soil remediation intervention of abandoned used lead-acid battery recycling sites to reduce lead exposure among children: A three-arm pretest-posttest non-equivalent comparison group trial. Int. J. Hyg. Environ. Health 2026, 273, 114756. [Google Scholar] [CrossRef] [PubMed]
- Ahmadi, S.; Botton, J.; Zoumenou, R.; Ayotte, P.; Fievet, N.; Massougbodji, A.; Alao, M.J.; Cot, M.; Glorennec, P.; Bodeau-Livinec, F. Lead Exposure in Infancy and Subsequent Growth in Beninese Children. Toxics 2022, 10(10), 595. [Google Scholar] [CrossRef] [PubMed]
- Moody, E.C.; Colicino, E.; Wright, R.O.; Mupere, E.; Jaramillo, E.G.; Amarasiriwardena, C.; Cusick, S.E. Environmental exposure to metal mixtures and linear growth in healthy Ugandan children. PLoS ONE 2020, 15(5), e0233108. [Google Scholar] [CrossRef] [PubMed]
- Anticona, C.; San Sebastian, M. Anemia and malnutrition in indigenous children and adolescents of the Peruvian Amazon in a context of lead exposure: a cross-sectional study. Glob. Health Action 2014, 7, 22888. [Google Scholar] [CrossRef] [PubMed]
- Cantoral, A.; Téllez-Rojo, M.M.; Levy, T.S.; Hernández-Ávila, M.; Schnaas, L.; Hu, H.; Peterson, K.E.; Ettinger, A.S. Differential association of lead on length by zinc status in two-year old Mexican children. Environ. Health 2015, 14, 95. [Google Scholar] [CrossRef] [PubMed]
- Zarmawi, R.; Haryanto, B. The Association of Children's Blood Lead Levels and Prevalence of Stunting in Tin Mining Area in Indonesia. Ann. Glob. Health 2023, 89(1), 55. [Google Scholar] [CrossRef] [PubMed]
- Nowak-Szczepanska, N.; Gomula, A.; Sebastjan, A.; Ignasiak, Z.; Koziel, S. Blood lead level and nutritional status indicators in preadolescent Polish schoolchildren. J. Trace Elem. Med. Biol. 2021, 68, 126847. [Google Scholar] [CrossRef] [PubMed]
- Ashley-Martin, J.; Dodds, L.; Arbuckle, T.E.; Lanphear, B.; Muckle, G.; Bouchard, M.F.; Fisher, M.; Asztalos, E.; Foster, W.; Kuhle, S. Blood metal levels and early childhood anthropometric measures in a cohort of Canadian children. Environ. Res. 2019, 179 Pt A, 108736. [Google Scholar] [CrossRef] [PubMed]
- Deierlein, A.L.; Teitelbaum, S.L.; Windham, G.C.; Pinney, S.M.; Galvez, M.P.; Caldwell, K.L.; Jarrett, J.M.; Gajek, R.; Kushi, L.H.; Biro, F.; Wolff, M.S. Breast Cancer and Environment Research Program. Lead exposure during childhood and subsequent anthropometry through adolescence in girls. Environ. Int. 2019, 122, 310–315. [Google Scholar] [CrossRef] [PubMed]
- Ballew, C.; Khan, L.K.; Kaufmann, R.; Mokdad, A.; Miller, D.T.; Gunter, E.W. Blood lead concentration and children's anthropometric dimensions in the Third National Health and Nutrition Examination Survey (NHANES III), 1988-1994. J. Pediatr. 1999, 134(5), 623–30. [Google Scholar] [CrossRef] [PubMed]
- Nasrin, S.; Haque, M.A.; Palit, P.; Das, R.; Mahfuz, M.; Faruque, A.S.G.; Ahmed, T. Incidence of Asymptomatic Shigella Infection and Association with the Composite Index of Anthropometric Failure among Children Aged 1-24 Months in Low-Resource Settings. Life 2022, 12(5), 607. [Google Scholar] [CrossRef] [PubMed]
- Xu, Y.; Liu, M.C.; Wang, P.; Xu, B.; Liu, X.Q.; Zhang, Z.P.; Ren, L.F.; Qin, Q.; Ma, Y.Y.; Luo, W.J.; Hao, X.K. Correlation between serum IGF-1 and blood lead level in short stature children and adolescent with growth hormone deficiency. Int. J. Clin. Exp. Med. 2014, 7(4), 856–64. [Google Scholar] [PubMed]
- Fleisch, A.F.; Burns, J.S.; Williams, P.L.; Lee, M.M.; Sergeyev, O.; Korrick, S.A.; Hauser, R. Blood lead levels and serum insulin-like growth factor 1 concentrations in peripubertal boys. Environ. Health Perspect. 2013, 121(7), 854–8. [Google Scholar] [CrossRef] [PubMed]
- Berry, W.D.; Moriarty, C.M.; Lau, Y.S. Lead attenuation of episodic growth hormone secretion in male rats. Int. J. Toxicol. 2002, 21(2), 93–98. [Google Scholar] [CrossRef] [PubMed]
- Ronis, M.J.; Aronson, J.; Gao, G.G.; Hogue, W.; Skinner, R.A.; Badger, T.M.; Lumpkin, C.K., Jr. Skeletal effects of developmental lead exposure in rats. Toxicol. Sci. 2001, 62(2), 321–9. [Google Scholar] [CrossRef] [PubMed]
- Vigeh, M.; Sahebi, L.; Yokoyama, K. Prenatal blood lead levels and birth weight: a meta-analysis study. J. Environ. Health Sci. Eng. 2022, 21(1), 1–10. [Google Scholar] [CrossRef] [PubMed]
- Ying, X.L.; Gao, Z.Y.; Yan, J.; Zhang, M.; Wang, J.; Xu, J.; Markowitz, M.; Yan, C.H. Sources, symptoms and characteristics of childhood lead poisoning: experience from a lead specialty clinic in China. Clin. Toxicol. (Phila) 2018, 56(6), 397–403. [Google Scholar] [CrossRef] [PubMed]
- Mohsenipour, R.; Aflatoonian, M.; Alimadadi, H.; Rahmani, P.; Esmaeili, N.; Yazdi, M.; Abbasi, F.; Solgi, F.; Sharifi, F.; Vafaii, N.; Mohebbi, A.; Khazdouz, M. Lead poisoning as a differential diagnosis in pediatric patients with chronic abdominal pain: a case-control study in Tehran-Iran. BMC Gastroenterol. 2024, 24(1), 344. [Google Scholar] [CrossRef] [PubMed]
- Hammond, P.B.; Chernausek, S.D.; Succop, P.A.; Shukla, R.; Bornschein, R.L. Mechanisms by which lead depresses linear and ponderal growth in weanling rats. Toxicol. Appl. Pharmacol. 1989, 99(3), 474–486. [Google Scholar] [CrossRef] [PubMed]
- Thompson, L.; Arnold, C.D.; Long, J.M.; Westcott, J.L.E.; Sthity, R.A.; Khandaker, A.M.; Islam, M.M.; Black, R.E.; Krebs, N.F.; McDonald, C.M. Prevalence and Correlates of Environmental Enteric Dysfunction Among Young Children in Bangladesh. Matern Child Nutr. 2026, 22(3), e70237. [Google Scholar] [CrossRef] [PubMed]
- Kwong, W.T.; Friello, P.; Semba, R.D. Interactions between iron deficiency and lead poisoning: epidemiology and pathogenesis. Sci. Total Environ. 2004, 330(1), 21–37. [Google Scholar] [CrossRef] [PubMed]
- Wright, R.O.; Tsaih, S.W.; Schwartz, J.; Wright, R.J.; Hu, H. Association between iron deficiency and blood lead level in a longitudinal analysis of children followed in an urban primary care clinic. J. Pediatr. 2003, 142(1), 9–14. [Google Scholar] [CrossRef] [PubMed]
- Ryckman, T.; Beal, T.; Nordhagen, S.; Murira, Z.; Torlesse, H. Affordability of nutritious foods for complementary feeding in South Asia. Nutr. Rev. 2021, 79 (Suppl 1), 52–68. [Google Scholar] [CrossRef] [PubMed]
- García-Lestón, J.; Roma-Torres, J.; Mayan, O.; Schroecksnadel, S.; Fuchs, D.; Moreira, A.O.; Pásaro, E.; Méndez, J.; Teixeira, J.P.; Laffon, B. Assessment of immunotoxicity parameters in individuals occupationally exposed to lead. J. Toxicol. Environ. Health A 2012, 75(13-15), 807–18. [Google Scholar] [CrossRef] [PubMed]
- Alao, M.E.; Perin, J.; Brooks, W.A.; Hossain, L.; Goswami, D.; Zaman, K.; Yunus, M.; Khan, M.A.; Jahan, Y.; Ahmed, D.; Slavkovich, V.; Graziano, J.; Prosperi, C.; Higdon, M.; Deloria-Knoll, M.; O' Brien, K.L.; George, C.M. Urinary arsenic is associated with wasting and underweight status in young children in rural Bangladesh. Environ. Res. 2021, 195, 110025. [Google Scholar] [CrossRef] [PubMed]
Figure 1.
District-level prevalence of elevated BLLs, continuous BLLs, and child growth-failure indicators, Bangladesh MICS 2025 (children 12–59 months): (A) Elevated BLLs prevalence (≥5 µg/dL), (B) Mean BLLs (continuous), (C) Stunting prevalence, (D) Wasting prevalence, (E) Underweight prevalence, (F) CIAF prevalence.
Figure 1.
District-level prevalence of elevated BLLs, continuous BLLs, and child growth-failure indicators, Bangladesh MICS 2025 (children 12–59 months): (A) Elevated BLLs prevalence (≥5 µg/dL), (B) Mean BLLs (continuous), (C) Stunting prevalence, (D) Wasting prevalence, (E) Underweight prevalence, (F) CIAF prevalence.
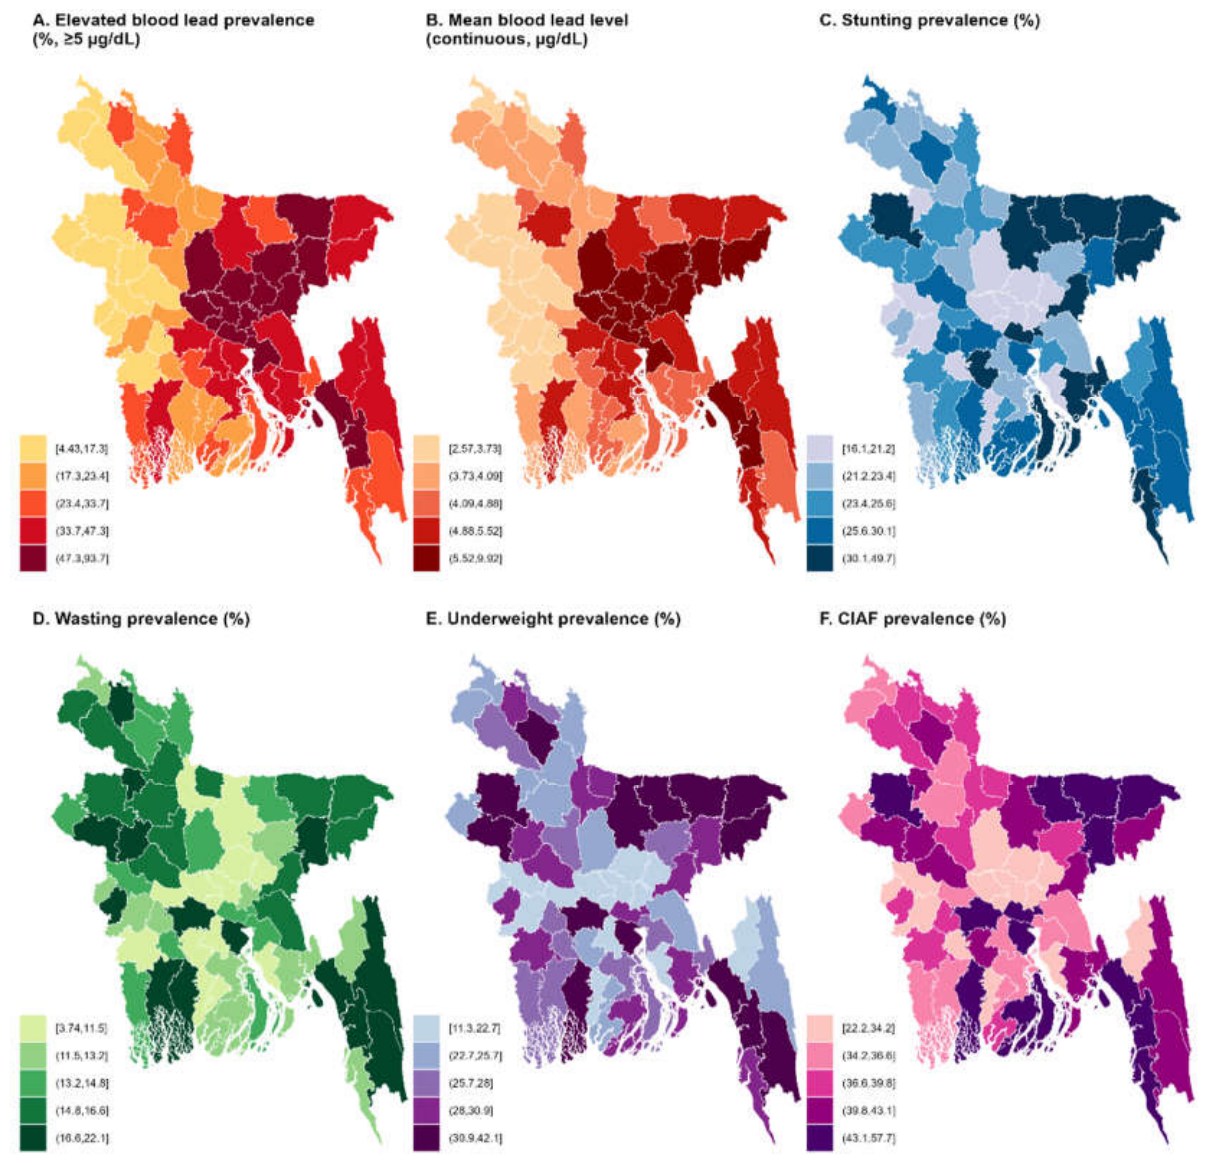

Table 1.
Characteristics of the analytic sample of Bangladeshi children aged 12–59 months (N = 10,495).
Table 1.
Characteristics of the analytic sample of Bangladeshi children aged 12–59 months (N = 10,495).
| Characteristic | Category | n | Weighted % |
|---|---|---|---|
| Elevated BLLs (≥5 μg/dL) | No | 7163 | 61.4 |
| Yes | 3332 | 38.6 | |
| Median BLLs (μg/dL)a | - | 10,495 | 4.3 (3.1, 6.2) |
| Median blood arsenic levels (μg/L)a | - | 10,495 | 1.9 (1.4, 2.9) |
| Median blood cadmium levels (μg/L)a | - | 10,495 | 0.4 (0.2, 0.6) |
| Median blood mercury levels (μg/L)a | - | 10,495 | 1.4 (0.9, 2.3) |
| Child sex | Male | 5503 | 52.5 |
| Female | 4992 | 47.5 | |
| Child age group | 12-23 | 1982 | 18.8 |
| 24-35 | 2684 | 26.0 | |
| 36-47 | 2916 | 27.0 | |
| 48-59 | 2913 | 28.2 | |
| Maternal education | Pre-primary/none | 738 | 7.0 |
| Primary | 2027 | 19.5 | |
| Secondary | 5716 | 54.6 | |
| Higher | 2014 | 18.8 | |
| Place of residence | Urban | 2609 | 29.3 |
| Rural | 7886 | 70.7 | |
| Division | Barishal | 1079 | 5.2 |
| Chattogram | 2102 | 23.2 | |
| Dhaka | 1765 | 24.1 | |
| Khulna | 1595 | 10.4 | |
| Mymensingh | 644 | 8.1 | |
| Rajshahi | 1135 | 11.4 | |
| Rangpur | 1505 | 11.3 | |
| Sylhet | 670 | 6.3 | |
| Household wealth index | Poorest | 2793 | 22.2 |
| Pooer | 2476 | 21.5 | |
| Middle | 2117 | 20.2 | |
| Richer | 1835 | 19.8 | |
| Richest | 1274 | 16.3 |
aValues were reported as median (IQR).
Table 2.
Distribution of stunting, wasting, underweight, and CIAF by background characteristics (N = 10,495).
Table 2.
Distribution of stunting, wasting, underweight, and CIAF by background characteristics (N = 10,495).
| Characteristic | Category | Stunting, n (%) | P value | Wasting, n (%) | P value | Underweight, n (%) | P value | CIAF, n (%) | P value |
|---|---|---|---|---|---|---|---|---|---|
| Overall | - | 2707 (25.9) | - | 1479 (14.1) | - | 2780 (26.6) | - | 4,040 (38.2) | - |
| Elevated blood lead (≥5 µg/dL) | No | 1772 (24.8) | 0.014 | 1014 (14.1) | 0.930 | 1877 (26.4) | 0.780 | 2,694 (37.4) | 0.102 |
| Yes | 945 (27.5) | 482 (14.2) | 923 (26.7) | 1,346 (39.4) | |||||
| Child sex | Male | 1432 (25.9) | 0.854 | 843 (15.2) | 0.004 | 1462 (26.9) | 0.428 | 2,119 (38.5) | 0.567 |
| Female | 1285 (25.8) | 653 (12.9) | 1338 (26.1) | 1,921 (37.8) | |||||
| Child age group | 12-23 | 553 (27.8) | <0.001 | 261 (13.4) | 0.018 | 482 (23.9) | 0.034 | 756 (37.9) | 0.583 |
| 24-35 | 763 (28.1) | 344 (12.4) | 714 (26.3) | 1,070 (39.5) | |||||
| 36-47 | 757 (26.0) | 427 (14.7) | 777 (26.6) | 1,116 (38.0) | |||||
| 48-59 | 644 (22.3) | 464 (15.7) | 827 (28.5) | 1,098 (37.3) | |||||
| Maternal education | Pre-primary/none | 266 (35.8) | <0.001 | 110 (14.0) | <0.001 | 248 (32.8) | <0.001 | 338 (45.1) | <0.001 |
| Primary | 671 (33.4) | 324 (16.2) | 658 (32.2) | 923 (45.2) | |||||
| Secondary | 1419 (24.8) | 851 (14.5) | 1500 (26.0) | 2,187 (37.9) | |||||
| Higher | 361 (17.3) | 211 (10.9) | 394 (20.0) | 592 (29.2) | |||||
| Place of residence | Urban | 620 (22.9) | <0.001 | 360 (13.5) | 0.343 | 644 (24.1) | 0.006 | 940 (35.3) | 0.003 |
| Rural | 2097 (27.1) | 1136 (14.4) | 2156 (27.6) | 3,100 (39.4) | |||||
| Division | Barishal | 280 (26.6) | <0.001 | 128 (12.0) | 0.001 | 276 (25.9) | <0.001 | 410 (38.3) | <0.001 |
| Chattogram | 579 (27.3) | 308 (15.5) | 596 (29.0) | 844 (40.4) | |||||
| Dhaka | 419 (21.9) | 212 (11.7) | 378 (19.8) | 612 (32.4) | |||||
| Khulna | 357 (22.9) | 226 (14.2) | 410 (26.4) | 564 (36.1) | |||||
| Mymensingh | 181 (28.7) | 84 (11.9) | 198 (31.5) | 266 (41.3) | |||||
| Rajshahi | 287 (25.2) | 203 (17.3) | 320 (27.9) | 452 (39.0) | |||||
| Rangpur | 358 (24.2) | 223 (14.9) | 389 (26.3) | 560 (37.6) | |||||
| Sylhet | 256 (40.0) | 112 (15.8) | 233 (35.4) | 332 (50.9) | |||||
| Household wealth index | Poorest | 930 (34.6) | <0.001 | 435 (15.3) | 0.001 | 917 (33.7) | <0.001 | 1,273 (46.3) | <0.001 |
| Poorer | 679 (27.7) | 393 (16.3) | 743 (30.3) | 1,041 (42.1) | |||||
| Middle | 513 (25.2) | 282 (13.3) | 513 (25.6) | 765 (36.6) | |||||
| Richer | 409 (23.4) | 243 (14.0) | 415 (24.1) | 632 (36.3) | |||||
| Richest | 186 (15.3) | 143 (10.8) | 212 (16.0) | 329 (26.2) |
n represents the unweighted number of children. Percentages are survey-weighted row percentages within each background-characteristic category. P values were from Rao–Scott chi-square tests.
Table 3.
Associations of BLLs with continuous anthropometric outcomes.
| Outcome | Model 1 Adjusted β (95% CI) |
P value | Model 2 Adjusted β (95% CI) |
P value |
|---|---|---|---|---|
| HAZ | −0.075 (−0.103, −0.046) | <0.001 | −0.078 (−0.107, −0.048) | <0.001 |
| WAZ | −0.062 (−0.088, −0.036) | <0.001 | −0.064 (−0.091, −0.037) | <0.001 |
| WHZ | −0.029 (−0.055, −0.003) | 0.031 | −0.029 (−0.056, −0.002) | 0.034 |
Note: Values were adjusted β coefficients and 95% confidence intervals from linear regression models. β represents the adjusted mean difference in the outcome associated with a 1-SD increase in the natural log-transformed concentration of the specified metal. HAZ = height-for-age z-score; WAZ = weight-for-age z-score; WHZ = weight-for-height z-score; CI = confidence interval; SD = standard deviation. .
Table 4.
Associations of BLLs with binary anthropometric outcomes.
| Outcome | Model 1: Adjusted PR (95% CI) |
P value | Model 2: Adjusted PR (95% CI) |
P value |
|---|---|---|---|---|
| Stunting | 1.09 (1.05, 1.14) | <0.001 | 1.10 (1.05, 1.14) | <0.001 |
| Wasting | 1.08 (1.02, 1.15) | 0.012 | 1.09 (1.02, 1.16) | 0.011 |
| Underweight | 1.08 (1.04, 1.13) | <0.001 | 1.08 (1.04, 1.13) | <0.001 |
| CIAF | 1.07 (1.04, 1.11) | <0.001 | 1.08 (1.04, 1.11) | <0.001 |
Note: Values were adjusted prevalence ratios (PRs) and 95% confidence intervals from modified Poisson regression models. PRs represent the ratio of outcome prevalence associated with a 1-SD increase in the natural log-transformed concentration of the specified metal. PR = prevalence ratio; CI = confidence interval; SD = standard deviation.
Table 5.
Associations of blood lead concentrations with specific patterns of composite anthropometric failure.
Table 5.
Associations of blood lead concentrations with specific patterns of composite anthropometric failure.
| CIAF category vs. no failurea | Model 1: Adjusted PR (95% CI) |
P value | Model 2: Adjusted PR (95% CI) |
P value |
|---|---|---|---|---|
| Wasting only | 1.00 (0.86–1.17) | 0.984 | 1.00 (0.85–1.18) | 0.971 |
| Wasting + underweight | 1.14 (1.04–1.25) | 0.008 | 1.14 (1.04–1.26) | 0.007 |
| Stunting + wasting + underweight | 1.18 (1.06–1.31) | 0.003 | 1.18 (1.06–1.32) | 0.003 |
| Stunting + underweight | 1.11 (1.04–1.19) | 0.002 | 1.11 (1.03–1.19) | 0.003 |
| Stunting only | 1.12 (1.03–1.21) | 0.007 | 1.13 (1.04–1.22) | 0.004 |
| Underweight only | 1.05 (0.91–1.20) | 0.515 | 1.03 (0.89–1.20) | 0.656 |
Note: Values were adjusted prevalence ratios (PRs) and 95% confidence intervals from modified Poisson regression models. PRs represent the ratio of outcome prevalence associated with a 1-SD increase in the natural log-transformed concentration of the specified metal. PR = prevalence ratio; CI = confidence interval; SD = standard deviation; CIAF = composite index of anthropometric failure. aSeparate model for each of the six CIAF categories.
Disclaimer/Publisher’s Note: The statements, opinions and data contained in all publications are solely those of the individual author(s) and contributor(s) and not of MDPI and/or the editor(s). MDPI and/or the editor(s) disclaim responsibility for any injury to people or property resulting from any ideas, methods, instructions or products referred to in the content. |
© 2026 by the authors. Licensee MDPI, Basel, Switzerland. This article is an open access article distributed under the terms and conditions of the Creative Commons Attribution (CC BY) license (http://creativecommons.org/licenses/by/4.0/).
Copyright: This open access article is published under a Creative Commons CC BY 4.0 license, which permit the free download, distribution, and reuse, provided that the author and preprint are cited in any reuse.