
Submitted:
28 September 2026
Posted:
29 September 2026
You are already at the latest version
Preprints on COVID-19 and SARS-CoV-2
Abstract
COVID-19-related stigma may compound psychological distress, yet evidence from Central Asia remains limited. We conducted an exploratory secondary analysis of baseline data from 399 adults hospitalized with PCR-confirmed COVID-19 in Ulaanbaatar, Mongolia. Two study-specific 12-item indices represented social discrimination/stigma and self-stigma/self-exclusion. We examined score distributions, internal consistency, exploratory internal structure, multivariable correlates, and concurrent associations with PHQ-9, GAD-7, ISI, and PCL-5 scores. Mean scores were 32.14 (SD 6.96) and 29.62 (SD 6.77), with Cronbach's alpha values of 0.903 and 0.891, respectively. The indices were moderately correlated (r = 0.451, 95% CI 0.369-0.526). Parallel analysis suggested two dimensions for the social discrimination/stigma items and one for self-stigma/self-exclusion. In residence-adjusted HC3 models, larger household size was associated with higher self-stigma (B = 0.59, 95% CI 0.18-1.00), although the demographic and clinical models explained little variance. In adjusted sensitivity analyses, self-stigma remained associated with depressive, anxiety, and PTSD symptom burden. Findings are exploratory because original item wording, response anchors, and translation procedures were unavailable; formal cultural adaptation and validation are required before clinical or prevalence use.
Keywords:
COVID-19
; stigma
; self-stigma
; social discrimination
; mental health
; infectious disease
; Central Asia
; Mongolia
1. Introduction
Stigma is a social process in which labeling and stereotyping are linked to separation, status loss, and discrimination [1]. Internalized or self-stigma occurs when individuals absorb devaluing social beliefs and apply them to themselves, potentially contributing to shame, withdrawal, and reduced self-worth [2,3]. Infectious-disease outbreaks can intensify both processes because fear of contagion and uncertainty may transform a health condition into a socially discrediting identity.
During the COVID-19 pandemic, patients and survivors reported social rejection and internalized stigma in diverse settings. Studies from Lebanon, China, Korea, Indonesia, Malaysia, Thailand, and Nepal linked COVID-19-related stigma with psychological distress, depression, anxiety, post-traumatic stress symptoms, and reduced quality of life [4,5,6,7,8,9,10,11,12]. Investigators have used instruments adapted from HIV-, MERS-, and general illness-related stigma scales, while newer COVID-19 and post-COVID instruments have undergone explicit reliability and construct-validity testing [9,13,14,15]. These studies underscore the importance of context-specific measurement rather than assuming that cut-offs or factor structures transfer across populations.
Evidence from Central Asia remains comparatively sparse, but Mongolia is not entirely unstudied. Munkh et al. examined discrimination and self-stigma among 339 people treated for COVID-19 in Mongolia, and Sattler et al. included Mongolia in a multinational study linking COVID-19 stigma with post-traumatic stress [16,17]. The present study extends this literature by analyzing the full baseline PCR-confirmed COVID-19 case group from the same parent hospital cohort, with complete item-level stigma data for 399 cases and concurrent validated mental-health measures. The same parent cohort has also been used to describe longitudinal depression, anxiety, insomnia, and post-traumatic stress outcomes after COVID-19 [18]; stigma was not the primary focus of that publication.
This study therefore used the baseline COVID-19 case group from the parent cohort to (1) describe the distributions and internal consistency of two study-specific 12-item indices labeled social discrimination/stigma and self-stigma/self-exclusion; (2) examine their exploratory internal structure and quantify their association; (3) explore sociodemographic and clinical correlates of each continuous score; and (4) examine concurrent associations with depression, anxiety, insomnia, and PTSD symptom burden. The baseline stigma-focused scope was selected to minimize analytic overlap with the published longitudinal mental-health study [18]. Because the original stigma-item documentation was incomplete, all measurement and determinant analyses were treated as exploratory.
2. Materials and Methods
2.1. Study Design and Setting
This was a secondary cross-sectional analysis of baseline data from a prospective hospital-based cohort conducted in Ulaanbaatar, Mongolia, from 2021 to 2023. The parent cohort enrolled 552 adults aged 18 years or older who were hospitalized at institutions affiliated with the Mongolian National University of Medical Sciences, including the Mongolian-Japanese Hospital, the Central Hospital, and the National Center for Maternal and Child Health. Participants provided written informed consent and were able to participate in follow-up assessments. COVID-19 cases had RT-PCR-confirmed SARS-CoV-2 infection during hospitalization; comparison participants were hospitalized for other conditions and tested negative. Trained mental-health researchers administered baseline questionnaires within 48 hours of hospitalization [18].
The parent study used standardized data-collection procedures. Case-report forms were double-entered, and incomplete or inconsistent entries were checked against source records [18]. The present analysis used the de-identified archived dataset.
2.2. Participants and Analytic Sample
The raw dataset contained 399 PCR-confirmed COVID-19 cases and 153 non-COVID comparison participants (N = 552). The present analysis was restricted to the 399 COVID-19 cases because both stigma indices were recorded in that group. All 399 cases had complete responses to the 24 stigma items, so no additional exclusion was required for the primary stigma analyses (Figure 1). The baseline symptom-score exclusions used to define the previously published longitudinal mental-health cohort were not applied here because the present objective was a cross-sectional analysis of stigma and concurrent symptoms [18]. No a priori sample-size calculation was performed; all eligible COVID-19 cases in the archived cohort were included.
Prior Publication and Dataset Overlap: The present study is a secondary analysis of the same parent hospital cohort previously used to investigate longitudinal changes in depression, anxiety, insomnia, and post-traumatic stress symptoms after COVID-19 [18]. Selected baseline demographic and clinical variables therefore overlap with those reported previously and are included here solely to characterize the current stigma-analysis sample. The present analysis addresses a distinct research question and uses stigma-specific outcomes, item-level measurement analyses, exploratory internal-structure analyses, determinant models, and concurrent stigma–mental-health associations that were not reported in the prior publication. No previously published longitudinal outcome analyses, figures, or primary inferential results are reproduced.
2.3. Study-Specific Stigma Indices
Two 12-item stigma-related indices were available. The first was labeled in Mongolian as "Нийгэм дэх ялгаварлан гадуурхах" (database prefix YGUA) and is provisionally termed the social discrimination/stigma index. The second was labeled "Өөрийгөө гадуурхах байдал" (database prefix OGBU) and is provisionally termed the self-stigma/self-exclusion index. Each item was stored as an integer from 1 to 4, and each total was the unweighted sum of 12 items (theoretical range 12-48). According to the archived labels and coding, higher totals were interpreted as more of the named construct. Recomputed sums exactly matched the stored totals for all 399 participants.
The archived thesis and data dictionary available for this secondary analysis did not retain the exact item wording, verbal response anchors, translation or adaptation procedures, or evidence linking either item set to a named externally validated instrument. The labels are therefore treated as provisional, the measures are reported as study-specific indices rather than validated scales, and no categorical cutoffs or prevalence estimates are used. Internal-consistency estimates are presented as descriptive measurement properties and do not establish unidimensionality or construct validity.
2.4. Covariates
Candidate covariates were selected before model fitting from baseline variables with plausible relationships to stigma: age (years); sex; education (higher/university, technical/vocational, complete secondary, or incomplete secondary); employment; marital/partnership status; household size; residence type (apartment, traditional ger, or house); body mass index (BMI, kg/m²); COVID-19 severity (mild, moderate, or severe/critical); and any recorded chronic condition. The chronic-condition composite indicated at least one recorded diagnosis of hypertension, obesity as a comorbidity, liver disease, chronic respiratory disease, tuberculosis, gastrointestinal disease, diabetes, cancer, or another chronic disease. Education and residence type were modeled categorically with higher/university education and apartment residence as reference categories, respectively. Because tuberculosis can itself be stigmatizing, its frequency was reported separately and a sensitivity analysis excluded participants with recorded tuberculosis.
2.5. Concurrent Mental-Health Measures
Continuous baseline symptom scores were available for depression (Patient Health Questionnaire-9; PHQ-9) [19], generalized anxiety (Generalized Anxiety Disorder-7; GAD-7) [20], insomnia (Insomnia Severity Index; ISI) [21], and post-traumatic stress symptoms (PTSD Checklist for DSM-5; PCL-5) [22]. These scores were used for concurrent association analyses only. Longitudinal outcomes were excluded to maintain a clear publication boundary from the parent trajectory analysis [18].
2.6. Statistical Analysis
Analyses were performed from the raw SPSS dataset using Python 3.13.5 with pandas 2.2.3, NumPy 2.3.5, SciPy 1.17.0, statsmodels 0.14.6, and scikit-learn 1.8.0. Continuous variables are summarized as mean (SD) and, when informative, median [interquartile range]; categorical variables as n (%). For each stigma index, Cronbach's alpha, a bootstrap 95% confidence interval (3000 resamples with a fixed seed), corrected item-total correlations, mean inter-item correlation, and proportions at the theoretical floor and ceiling were calculated. As an exploratory internal-structure check, sampling adequacy was assessed with the Kaiser-Meyer-Olkin statistic and Bartlett's test of sphericity; parallel analysis (2000 random permutations) informed the number of factors, followed by maximum-likelihood factor analysis of standardized items with varimax rotation when more than one factor was retained. Because item content was unavailable, latent factors were not named and this analysis was not treated as construct validation.
The relationship between the indices was evaluated with Pearson's correlation and a 95% confidence interval based on Fisher's z transformation; Spearman's rho was used as a robustness check. An adjusted linear model with self-stigma/self-exclusion as the outcome and social discrimination/stigma as the primary predictor used the same covariates as the determinant models, including residence type.
Separate multivariable linear regressions explored correlates of each continuous stigma score. All prespecified covariates were entered simultaneously, and heteroskedasticity-consistent HC3 standard errors were used. Model fit is reported as R² and adjusted R². Variance inflation factors (VIFs) were calculated for all predictors; VIF < 5 was considered acceptable. Residual-versus-fitted and Q-Q plots were inspected for gross departures from linear-model assumptions. Robust omnibus Wald tests were used for the education and residence factors. Sensitivity analyses (i) excluded the 11 severe/critical cases and (ii) excluded the 7 participants with recorded tuberculosis. Because these determinant analyses were exploratory and involved multiple coefficients, interpretation emphasizes effect estimates, confidence intervals, overall factor tests, and robustness rather than isolated p-values.
Pearson correlations were calculated between each stigma index and the four baseline mental-health scores, with Benjamini-Hochberg false-discovery-rate (FDR) correction across the eight tests. As a sensitivity analysis, each mental-health score was standardized and regressed separately on a standardized stigma score with adjustment for the same demographic and clinical covariates used in the determinant models; FDR correction was again applied across the eight stigma coefficients. Two-sided p < 0.05 was used as the nominal statistical threshold. All primary analyses included N = 399.
2.7. Ethical Considerations
The parent study was reviewed and approved by the Research Ethics Review Committee of the Mongolian National University of Medical Sciences (approval No. 2021/3-08; 18 June 2021). All participants provided written informed consent after receiving information about study objectives, confidentiality, and use of their data [18]. The present work is a secondary analysis of the de-identified dataset collected under that approved protocol and involved no new participant contact or data collection. Personal identifiers had been replaced with unique codes, and the analysis was conducted in accordance with the Declaration of Helsinki.
2.8. Use of Generative Artificial Intelligence
ChatGPT (OpenAI; GPT-5.6 Sol) was used for code drafting, statistical cross-checking, and language editing. All final numerical analyses reported in this manuscript were re-executed from the raw de-identified study dataset using the software specified above; references and manuscript claims were checked against source materials. The authors reviewed and edited AI-assisted outputs and take full responsibility for the final content.
3. Results
3.1. Participant Flow and Baseline Characteristics
The parent dataset comprised 552 hospitalized adults: 399 PCR-confirmed COVID-19 cases and 153 non-COVID comparison participants. All 399 cases had complete responses to both 12-item stigma indices and formed the analytic sample (Figure 1). Their mean age was 40.5 years (SD 14.3); 225 (56.4%) were female, 190 (47.6%) had higher/university education, 264 (66.2%) were employed, and 268 (67.2%) were married or partnered. Mean household size was 3.89 (SD 1.61), and mean BMI was 25.0 kg/m² (SD 3.8). Most participants had mild COVID-19 (291, 72.9%); 97 (24.3%) had moderate disease and 11 (2.8%) had severe/critical disease. At least one recorded chronic condition was present in 205 participants (51.4%); tuberculosis was recorded in 7 participants (1.8%) (Table 1).
3.2. Distribution and Internal Consistency of the Stigma Indices
The social discrimination/stigma index had a mean of 32.14 (SD 6.96), median 33.0 [IQR 29.0-36.0], and observed range 12-48. The distribution was mildly negatively skewed (skewness -0.631); 7 participants (1.8%) had the minimum score and 5 (1.3%) the maximum. Cronbach's alpha was 0.903 (bootstrap 95% CI 0.882-0.920); corrected item-total correlations ranged from 0.359 to 0.785, and the mean inter-item correlation was 0.442.
The self-stigma/self-exclusion index had a mean of 29.62 (SD 6.77), median 30.0 [IQR 26.0-34.0], and observed range 12-48. Skewness was -0.396; 10 participants (2.5%) had the minimum score and 2 (0.5%) the maximum. Cronbach's alpha was 0.891 (bootstrap 95% CI 0.867-0.909); corrected item-total correlations ranged from 0.507 to 0.697, and the mean inter-item correlation was 0.403 (Table 2). Item-level statistics are given in Supplementary Table S1.
Sampling adequacy was high for both item sets (KMO = 0.927 for social discrimination/stigma and 0.907 for self-stigma/self-exclusion), and Bartlett's tests were significant for each (χ²(66) = 2516.8 and 1868.7, respectively; both p < 0.001). Parallel analysis retained two factors for the social discrimination/stigma items (observed first and second eigenvalues 6.07 and 1.28) and one factor for the self-stigma/self-exclusion items (first eigenvalue 5.46). The two-factor social solution showed cross-loadings and could not be substantively labeled without item wording; the one-factor self-stigma loadings ranged from 0.536 to 0.747. Full exploratory loadings are provided in Supplementary Table S2. These findings reinforce the decision to treat both totals as study-specific composite indices rather than validated unidimensional scales.
3.3. Relationship Between Social Discrimination/Stigma and Self-Stigma
The two indices were moderately correlated (Pearson r = 0.451, 95% CI 0.369-0.526, p < 0.001; Spearman rho = 0.372, p < 0.001), corresponding to approximately 20% shared variance (Figure 2). This degree of association indicates related but clearly nonredundant scores. In the residence-adjusted model, each 1-point increase in social discrimination/stigma was associated with a 0.457-point higher self-stigma/self-exclusion score (HC3 SE = 0.055, 95% CI 0.350-0.564, p < 0.001) after adjustment for age, sex, education, employment, marital status, household size, residence type, COVID-19 severity, chronic conditions, and BMI. The adjusted R² was 0.230.
3.4. Multivariable Correlates of the Stigma Indices
The multivariable models are summarized in Table 3. After adding residence type to the prespecified model, social discrimination/stigma had R² = 0.057 and adjusted R² = 0.022. The robust omnibus test provided insufficient evidence of an overall education association (Wald χ² = 5.69, df = 3, p = 0.128). Within this exploratory factor, the incomplete-secondary contrast was -2.91 points relative to higher/university education (95% CI -5.67 to -0.15; p = 0.039). The residence factor was not significant overall (p = 0.659). Given the nonsignificant education omnibus test and multiple coefficients examined, the isolated education contrast is considered hypothesis-generating rather than confirmatory.
The self-stigma/self-exclusion model had R² = 0.050 and adjusted R² = 0.016. Each additional household member was associated with a 0.59-point higher score (95% CI 0.18-1.00; p = 0.005). Neither education (omnibus p = 0.328) nor residence type (omnibus p = 0.313) showed evidence of an overall association. Multicollinearity was minimal in both models (maximum VIF = 1.52). Excluding severe/critical cases yielded a similar household-size association (B = 0.56, 95% CI 0.14-0.97; p = 0.009), as did excluding the seven participants with tuberculosis (B = 0.55, 95% CI 0.14-0.96; p = 0.009). Sensitivity results are provided in Supplementary Table S3.
3.5. Concurrent Associations with Mental-Health Symptom Scores
In zero-order analyses, social discrimination/stigma had small positive correlations with PHQ-9 and PCL-5 scores after FDR correction, while self-stigma/self-exclusion correlated with PHQ-9, GAD-7, and PCL-5 scores (Table 4). After multivariable adjustment for age, sex, education, employment, marital status, household size, residence type, BMI, COVID-19 severity, and chronic conditions, self-stigma remained independently associated with PHQ-9 (standardized β = 0.227, 95% CI 0.120-0.333, FDR q < 0.001), GAD-7 (β = 0.130, 95% CI 0.023-0.238, q = 0.035), and PCL-5 scores (β = 0.267, 95% CI 0.161-0.372, q < 0.001). Social discrimination/stigma remained associated only with PCL-5 after adjustment (β = 0.138, 95% CI 0.039-0.236, q = 0.016). Adjusted associations are shown in Supplementary Table S3.
4. Discussion
4.1. Principal Findings
In this exploratory secondary analysis of 399 adults hospitalized with PCR-confirmed COVID-19 in Mongolia, the two study-specific stigma indices showed high internal consistency but different exploratory internal structures: parallel analysis suggested two dimensions within the social discrimination/stigma items and one within self-stigma/self-exclusion. The indices were moderately related but nonredundant. Larger household size was the most robust demographic correlate of self-stigma and remained similar after excluding severe/critical cases and participants with tuberculosis. However, the determinant models explained little overall variance, indicating that routinely collected demographic and clinical variables captured only a small portion of stigma heterogeneity. Concurrent mental-health associations were modest; after covariate adjustment, self-stigma remained associated with depression, anxiety, and PTSD symptoms, while social discrimination/stigma remained associated with PTSD symptoms.
4.2. Stigma in the Context of COVID-19
COVID-19-related stigma has been documented across Asian and middle-income settings, although observed levels vary with sampling, timing, and measurement [4,5,6,7,8,9,10,11,12,13,14,15]. Mongolia-specific evidence also exists: Munkh et al. reported discrimination and self-stigma among people treated for COVID-19, while Sattler et al. linked COVID-19 stigma with post-traumatic stress in a multinational sample that included Mongolia [16,17]. The present study should therefore be viewed as an extension rather than the first Mongolian stigma study: it contributes an independently analyzed baseline stigma sample from the same parent hospital cohort, with complete item-level data for 399 PCR-confirmed cases and concurrent standardized mental-health measures. Because the archived indices lack validated cut-offs and complete measurement documentation, the present results are intentionally expressed as continuous scores rather than prevalence estimates.
4.3. Related but Distinct Study-Specific Indices
The moderate correlation is compatible with the conceptual distinction between externally experienced discrimination and internalized self-devaluation [1,2,3]. The adjusted association persisted after demographic and clinical adjustment, yet substantial variation in self-stigma remained unexplained. Exploratory factor analysis added an important caution: parallel analysis favored two dimensions for the social discrimination/stigma items but one for self-stigma/self-exclusion. Because the underlying item wording is unavailable, these dimensions cannot be named or interpreted, and the analysis cannot establish construct validity. Future work should preserve complete item documentation and evaluate content validity, dimensionality, measurement invariance, convergent/discriminant validity, and test-retest reliability using culturally adapted instruments.
4.4. Sociodemographic and Clinical Correlates
Household size was the clearest adjusted correlate of self-stigma/self-exclusion. The absolute effect was modest—approximately 0.6 points on a 12-48 composite range per additional household member—but it was stable after excluding severe/critical cases and participants with tuberculosis. Larger households may heighten perceived responsibility for transmission or make illness more socially salient, but household size may also proxy unmeasured socioeconomic or family characteristics. Residence type itself was not associated with either stigma score after adjustment. These findings are hypothesis-generating and support direct measurement of household roles, crowding, social support, and family responses in future studies.
The education result requires even greater caution. Although the incomplete-secondary contrast was negative relative to higher/university education, the education factor was not statistically significant overall after residence adjustment (p = 0.128). The subgroup was also relatively small (n = 39). Prior studies report heterogeneous education associations [5,8,11,14], and the observed contrast may reflect reporting behavior, occupational/social context, or residual confounding rather than a true protective effect of lower education. It should not be interpreted causally.
4.5. Concurrent Mental-Health Correlates
The concurrent mental-health findings were more consistent for self-stigma than for social discrimination. Self-stigma remained associated with depressive, anxiety, and PTSD symptom burden after adjustment for demographic and clinical factors, whereas social discrimination retained an adjusted association only with PTSD symptoms. Similar relationships have been reported internationally [6,7,10,14] and in Mongolia [17]. Even the largest adjusted effect was modest, supporting the interpretation of stigma as one psychosocial dimension rather than a proxy for psychiatric symptom severity. Concurrent measurement and common-method reporting preclude conclusions about directionality.
4.6. Public-Health Implications
The results support treating stigma as a psychosocial consideration in infectious-disease preparedness, but they do not establish a screening instrument or intervention effect. For Mongolia, practical next steps include nondiscriminatory risk communication, confidential psychosocial enquiry during hospitalization, and research that directly measures family context and social support rather than using household size as a proxy. Health services and public communication should also be attentive to intersectional stigma—for example, tuberculosis co-morbidity—even though excluding the seven participants with tuberculosis did not materially change the main association in this dataset. Any future stigma tool intended for screening or surveillance should undergo documented translation, cultural adaptation, cognitive interviewing, and formal validity testing before thresholds are used.
4.7. Strengths and Limitations
Strengths include complete stigma-item data for all 399 COVID-19 cases, direct re-audit of the raw dataset, PCR-confirmed case status, separate analysis of social and self-stigma scores, exploratory internal-structure testing, HC3 robust inference, low multicollinearity, residence-adjusted models, FDR correction, and sensitivity analyses excluding severe/critical cases and tuberculosis. Restricting the work to baseline stigma-focused questions also minimizes overlap with the previously published longitudinal mental-health analysis [18]. Selected baseline demographic and clinical descriptors necessarily overlap with that parent-cohort report and are included only to characterize the current analytic sample; the stigma outcomes, measurement analyses, determinant models, and concurrent association analyses are distinct.
The principal limitation is incomplete measurement documentation: exact item wording, response anchors, translation/adaptation procedures, administration mode, and the source instrument were unavailable. Internal consistency and exploratory factor analysis cannot substitute for content, construct, or criterion validity, and the two-factor signal for the social discrimination/stigma items cautions against assuming a single latent construct. Second, the hospital-based Ulaanbaatar sample may not represent community-managed, asymptomatic, rural, or nonhospitalized infections. Third, cross-sectional measurement prevents temporal or causal inference. Fourth, all stigma and mental-health measures were self-reported, creating potential reporting and common-method bias. Fifth, recruitment spanned 2021-2023, but vaccination status, viral variant, exact calendar phase, income, social support, perceived threat, family dynamics, and prior discrimination were unavailable for adjustment. Sixth, the determinant models explained only about 5% of score variance, suggesting that the most important contextual drivers were not measured. Finally, subgroup and sensitivity findings are exploratory and the single-country setting limits generalizability.
5. Conclusions
Among 399 adults hospitalized with COVID-19 in Mongolia, two study-specific stigma indices showed high internal consistency and a moderate positive relationship, but exploratory internal-structure findings and missing item documentation preclude claims of validated measurement. Larger household size showed a small, robust association with self-stigma, while routinely collected demographic and clinical variables explained little of the overall variation in stigma. Self-stigma also showed modest adjusted concurrent associations with depressive, anxiety, and PTSD symptoms. These findings extend existing Mongolian evidence and support further culturally grounded stigma research, including preservation of item content, formal psychometric validation, and direct study of family and social-context mechanisms before screening thresholds or prevalence estimates are used.
Supplementary Materials
The following supporting information can be downloaded at the website of this paper posted on Preprints.org, Supplementary Table S1: Item-level descriptive statistics, corrected item-total correlations, and Cronbach's alpha if item deleted. Supplementary Table S2: Exploratory internal-structure diagnostics and factor loadings. Supplementary Table S3: Sensitivity analyses, VIF summary, and covariate-adjusted associations with baseline mental-health symptom scores.
Author Contributions
Conceptualization, E.R., O.R. and N.Lk.; methodology, E.R., O.R. and N.Lk.; validation, D.G.; formal analysis, D.G.; investigation, E.R., O.R. and N.Lk.; resources, E.R., O.R. and N.Lk.; data curation, E.R., O.R. and N.Lk.; writing—original draft preparation, E.R., O.R. and N.Lk.; writing—review and editing, D.G. and Kh.Z.; visualization, D.G.; supervision, Kh.Z.; project administration, Kh.Z. All authors have read and agreed to the published version of the manuscript.
Funding
This research received no external funding.
Institutional Review Board Statement
The study was conducted in accordance with the Declaration of Helsinki and was approved by the Research Ethics Review Committee of the Mongolian National University of Medical Sciences (approval No. 2021/3-08; 18 June 2021). The present study was a secondary analysis of de-identified data collected under the approved parent-study protocol and involved no additional participant contact, intervention, or data collection.
Informed Consent Statement
Informed consent was obtained from all participants enrolled in the parent study.
Data Availability Statement
The de-identified data supporting the findings are available from the corresponding author on reasonable request, subject to applicable institutional and ethics requirements.
Acknowledgments
The authors thank the study participants and the clinical and research staff of the participating hospitals. During the preparation of this manuscript, the authors used ChatGPT (OpenAI; GPT-5.6 Sol) for code drafting, statistical cross-checking, and language editing. The authors reviewed and edited all AI-assisted outputs and take full responsibility for the content of this publication.
Conflicts of Interest
The authors declare no conflict of interest.
Abbreviations
BMI, body mass index; CI, confidence interval; FDR, false discovery rate; GAD-7, Generalized Anxiety Disorder-7; HC3, heteroskedasticity-consistent covariance estimator type 3; ISI, Insomnia Severity Index; PCL-5, PTSD Checklist for DSM-5; PHQ-9, Patient Health Questionnaire-9; PTSD, post-traumatic stress disorder; RT-PCR, reverse-transcription polymerase chain reaction.
References
- Link, B.G.; Phelan, J.C. Conceptualizing stigma. Annu. Rev. Sociol. 2001, 27, 363–385. [Google Scholar] [CrossRef]
- Corrigan, P.W.; Watson, A.C. The paradox of self-stigma and mental illness. Clin. Psychol. Sci. Pract. 2002, 9, 35–53. [Google Scholar] [CrossRef]
- Corrigan, P.W.; Rao, D. On the self-stigma of mental illness: Stages, disclosure, and strategies for change. Can. J. Psychiatry 2012, 57, 464–469. [Google Scholar] [CrossRef] [PubMed]
- Haddad, C.; Bou Malhab, S.; Malaeb, D.; Sacre, H.; Saadeh, D.; Mourtada, V.; Salameh, P. Stigma toward people with COVID-19 among the Lebanese population: A cross-sectional study of correlates and mediating effects. BMC Psychol. 2021, 9, 164. [Google Scholar] [CrossRef] [PubMed]
- Yuan, Y.; Zhao, Y.J.; Zhang, Q.E.; Zhang, L.; Cheung, T.; Jackson, T.; Jiang, G.Q.; Xiang, Y.T. COVID-19-related stigma and its sociodemographic correlates: A comparative study. Glob. Health 2021, 17, 54. [Google Scholar] [CrossRef] [PubMed]
- Kang, E.K.; Lee, S.Y.; Kim, M.S.; Jung, H.; Kim, K.H.; Kim, K.N.; Park, H.Y.; Lee, Y.J.; Cho, B.; Sohn, J.H. The psychological burden of COVID-19 stigma: Evaluation of the mental health of isolated mild condition COVID-19 patients. J. Korean Med. Sci. 2021, 36, e33. [Google Scholar] [CrossRef] [PubMed]
- Wahyuhadi, J.; Efendi, F.; Al Farabi, M.J.; Harymawan, I.; Ariana, A.D.; Arifin, H.; Adnani, Q.E.S.; Levkovich, I. Association of stigma with mental health and quality of life among Indonesian COVID-19 survivors. PLoS ONE 2022, 17, e0264218. [Google Scholar] [CrossRef] [PubMed]
- Wu, Y.; Dai, Z.; Xiao, W.; Wang, H.; Huang, Y.; Si, M.; Fu, J.; Chen, X.; Jia, M.; Leng, Z.; et al. Perceived stigma among discharged patients of COVID-19 in Wuhan, China: A latent profile analysis. Front. Public Health 2023, 11, 1111900. [Google Scholar] [CrossRef] [PubMed]
- Pallavi, P.; Bakhla, A.K.; Akhouri, P.K.; Kisku, R.R.; Bala, R. Stigma scale adaptation and validation for measuring COVID-19 stigma. Cureus 2023, 15, e38744. [Google Scholar] [CrossRef] [PubMed]
- Abdul Taib, N.I.; Nik Jaafar, N.R.; Azman, N.; Leong Bin Abdullah, M.F.I.; Mohamad Kamal, N.A.; Baharudin, A.; Bin Abdullah, M.N.; Chidambaram, S.K.; Adlan, A.; Tan, L.H.; et al. Stigma, sociodemographic factors, and clinical factors associated with psychological distress among COVID-19 survivors during the convalescence period: A multi-centre study in Malaysia. Int. J. Environ. Res. Public Health 2023, 20, 3795. [Google Scholar] [CrossRef]
- Techapoonpon, K.; Kerdchareon, N.; Polruamngern, N.; Chalermrungroj, T.; Srikhamdokkhae, O.; Matangkarat, P. Stigma experienced by patients who recovered from COVID-19 in the post-vaccination period in Thailand: Prevalence and associated factors. Psychol. Res. Behav. Manag. 2023, 16, 3561–3571. [Google Scholar] [CrossRef] [PubMed]
- Azman, N.; Nik Jaafar, N.R.; Leong Bin Abdullah, M.F.I.; Abdul Taib, N.I.; Mohamad Kamal, N.A.; Abdullah, M.N.; Dollah, S.N.; Mohamed Said, M.S. Stigma and posttraumatic growth among COVID-19 survivors during the first wave of the COVID-19 pandemic in Malaysia: A multicenter cross-sectional study. Front. Psychiatry 2023, 14, 1152105. [Google Scholar] [CrossRef] [PubMed]
- Wang, R.; Wang, Z.; Shi, D.; Xu, L.; Liu, Y.; Liu, S.; Chen, H.; Chen, Y.; Xia, D.; Ge, X.; et al. Evaluation of the psychometrics of the Social Impact Scale and its association with depression among asymptomatic COVID-19 carriers. BJPsych Open 2024, 10, e41. [Google Scholar] [CrossRef] [PubMed]
- Shah, B.; Mahapatra, A.; Singh, U.N.; Mishra, V.; Daha, S.K.; Pande, R.; Neupane, M.R.; Banjade, A.; Khatik, C.B.; K.C., T.B.; et al. Internalized stigma related to COVID-19 and its psychosocial and mental health correlates: A multicentric health facility-based observational study from Nepal. Front. Psychiatry 2024, 14, 1276369. [Google Scholar] [CrossRef] [PubMed]
- Damant, R.W.; Rourke, L.; Cui, Y.; Lam, G.Y.; Smith, M.P.; Fuhr, D.P.; Tay, J.K.; Varughese, R.A.; Laratta, C.R.; Lau, A.; et al. Reliability and validity of the post COVID-19 condition stigma questionnaire: A prospective cohort study. EClinicalMedicine 2022, 55, 101755. [Google Scholar] [CrossRef] [PubMed]
- Munkh, E.; Oyunsuren, D.; Battuya, B.; Khishig-Undrakh, M.; Oyungerel, R.; Khishigsuren, Z. The discrimination and stigmatization against people with COVID-19 disease in Mongolia. J. Data Anal. 2024, 19, 61–70. [Google Scholar] [CrossRef]
- Sattler, D.N.; Bishkhorloo, B.; Lawley, K.A.; Hackler, R.; Byambajav, C.; Munkhbat, M.; Smith-Galeno, B. Stigma, post-traumatic stress, and COVID-19 vaccination intent in Mongolia, India, and the United States. Int. J. Environ. Res. Public Health 2023, 20, 2084. [Google Scholar] [CrossRef] [PubMed]
- Regzedmaa, E.; Altankhuyag, M.; Enkhbaatar, M.; Mungunkhuyag, U.; Madi, Y.; Byambadash, A.; Mukhtar, Y.; Davaanyam, M.U.; Erdenetsetseg, M.; Bat-Erdene, A.; et al. Changes in mental health following COVID-19 infection: Results of a prospective cohort study in Mongolia. Cent. Asian J. Med. Sci. 2026, 12, 69–78. [Google Scholar] [CrossRef]
- Kroenke, K.; Spitzer, R.L.; Williams, J.B.W. The PHQ-9: Validity of a brief depression severity measure. J. Gen. Intern. Med. 2001, 16, 606–613. [Google Scholar] [CrossRef] [PubMed]
- Spitzer, R.L.; Kroenke, K.; Williams, J.B.W.; Lowe, B. A brief measure for assessing generalized anxiety disorder: The GAD-7. Arch. Intern. Med. 2006, 166, 1092–1097. [Google Scholar] [CrossRef] [PubMed]
- Morin, C.M.; Belleville, G.; Belanger, L.; Ivers, H. The Insomnia Severity Index: Psychometric indicators to detect insomnia cases and evaluate treatment response. Sleep 2011, 34, 601–608. [Google Scholar] [CrossRef] [PubMed]
- Blevins, C.A.; Weathers, F.W.; Davis, M.T.; Witte, T.K.; Domino, J.L. The Posttraumatic Stress Disorder Checklist for DSM-5 (PCL-5): Development and initial psychometric evaluation. J. Trauma. Stress 2015, 28, 489–498. [Google Scholar] [CrossRef] [PubMed]
Figure 1.
Participant flow for the baseline stigma analysis. The 153 non-COVID comparison participants were excluded; all 399 COVID-19 cases had complete responses to both 12-item indices. Outcome-score exclusions in the prior longitudinal analysis were not applied to this baseline analysis.
Figure 1.
Participant flow for the baseline stigma analysis. The 153 non-COVID comparison participants were excluded; all 399 COVID-19 cases had complete responses to both 12-item indices. Outcome-score exclusions in the prior longitudinal analysis were not applied to this baseline analysis.
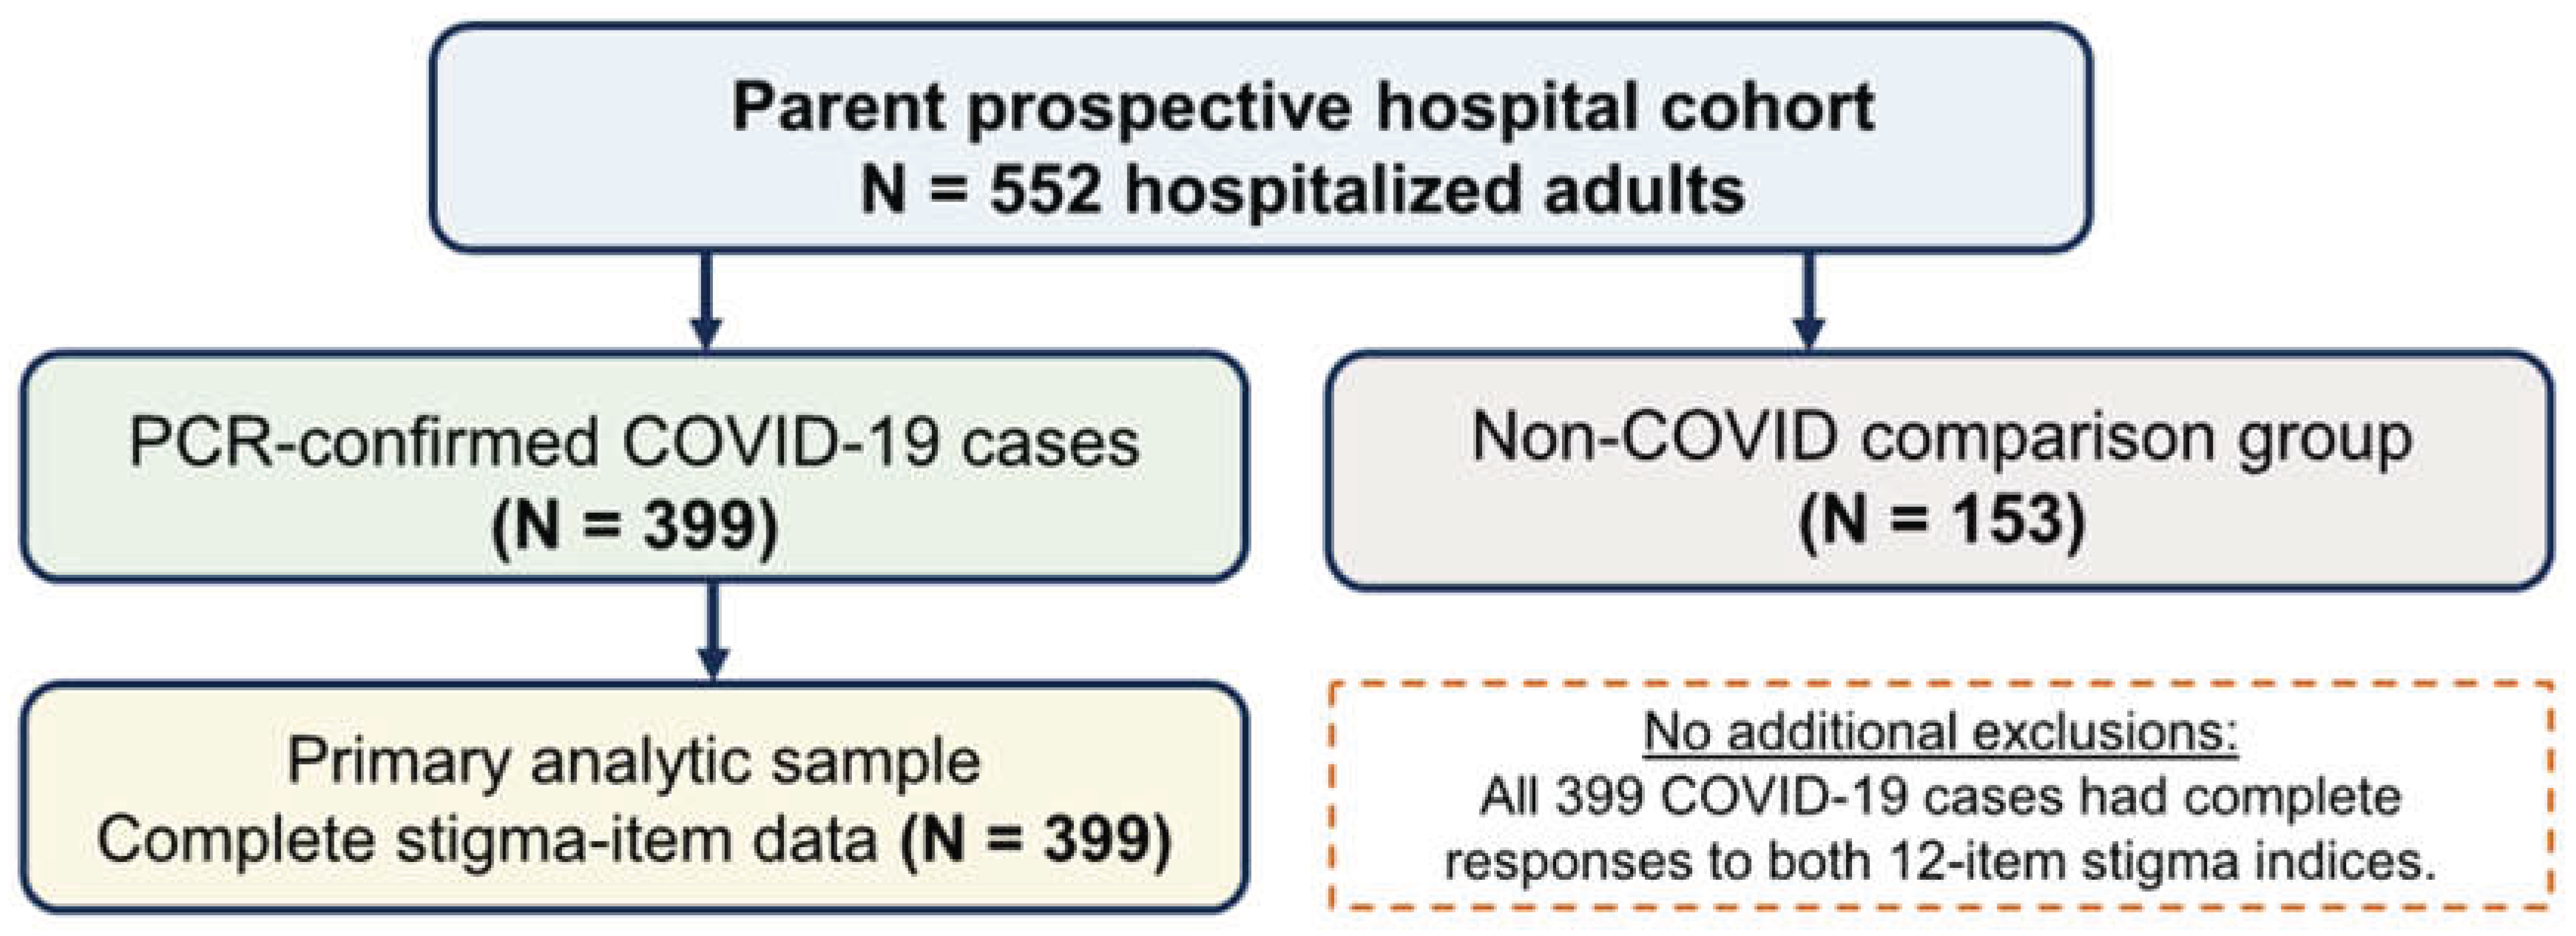
Figure 2.
(A) Social discrimination/stigma index distribution; (B) self-stigma/self-exclusion index distribution; (C) association between the indices. Red dashed lines denote means and gray dashed lines medians. The solid line in panel C is the least-squares best-fit line; Pearson correlation was calculated from the original paired scores.
Figure 2.
(A) Social discrimination/stigma index distribution; (B) self-stigma/self-exclusion index distribution; (C) association between the indices. Red dashed lines denote means and gray dashed lines medians. The solid line in panel C is the least-squares best-fit line; Pearson correlation was calculated from the original paired scores.
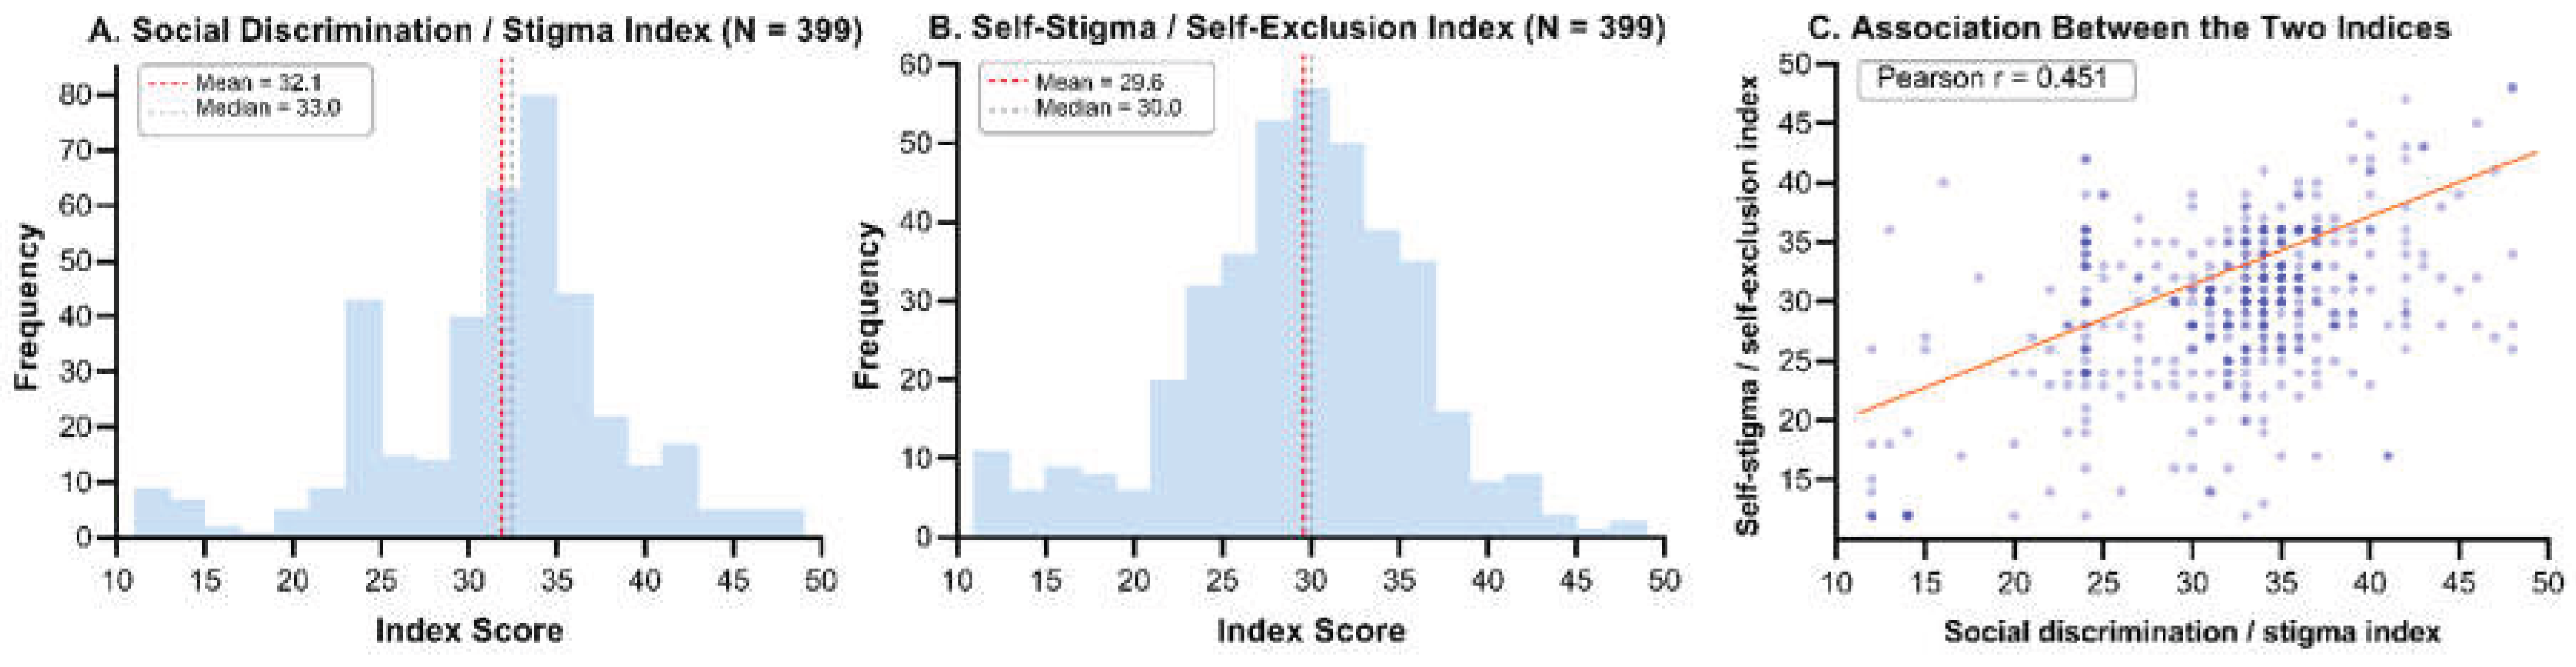

Table 1.
Baseline characteristics of the COVID-19 stigma-analysis sample (N = 399).
| Characteristic | n (%) or mean (SD) |
|---|---|
| Age, years | 40.5 (14.3) |
| Age ≤ 29 years | 102 (25.6%) |
| Age 30-39 years | 99 (24.8%) |
| Age 40-49 years | 86 (21.6%) |
| Age 50-59 years | 67 (16.8%) |
| Age ≥ 60 years | 45 (11.3%) |
| Female sex | 225 (56.4%) |
| Male sex | 174 (43.6%) |
| Higher/university education | 190 (47.6%) |
| Technical/vocational education | 28 (7.0%) |
| Complete secondary education | 142 (35.6%) |
| Incomplete secondary education | 39 (9.8%) |
| Employed | 264 (66.2%) |
| Married/partnered | 268 (67.2%) |
| Household size | 3.89 (1.61) |
| Apartment residence | 243 (60.9%) |
| Traditional ger residence | 60 (15.0%) |
| House residence | 96 (24.1%) |
| BMI, kg/m² | 25.0 (3.8) |
| Mild COVID-19 | 291 (72.9%) |
| Moderate COVID-19 | 97 (24.3%) |
| Severe/critical COVID-19 | 11 (2.8%) |
| Any recorded chronic condition | 205 (51.4%) |
| PHQ-9 score | 5.66 (5.15) |
| GAD-7 score | 4.90 (4.93) |
| ISI score | 7.89 (6.41) |
| PCL-5 score | 10.11 (11.38) |
| Tuberculosis comorbidity | 7 (1.8%) |
Note. Values are n (%) unless otherwise stated. BMI, body mass index. Selected baseline demographic and clinical characteristics derive from the same parent cohort described previously [18] and are presented here solely to characterize the N = 399 stigma-analysis sample.
Table 2.
Descriptive and internal-consistency properties of the study-specific stigma indices.
| Property | Social discrimination/ stigma | Self-stigma/ self-exclusion |
|---|---|---|
| Number of items | 12 | 12 |
| Observed score range | 12-48 | 12-48 |
| Mean (SD) | 32.14 (6.96) | 29.62 (6.77) |
| Median [IQR] | 33.0 [29.0-36.0] | 30.0 [26.0-34.0] |
| Skewness | -0.631 | -0.396 |
| At theoretical floor | 7 (1.8%) | 10 (2.5%) |
| At theoretical ceiling | 5 (1.3%) | 2 (0.5%) |
| Cronbach's alpha | 0.903 | 0.891 |
| Bootstrap 95% CI for alpha | 0.882-0.920 | 0.867-0.909 |
| Corrected item-total r, range | 0.359-0.785 | 0.507-0.697 |
| Mean inter-item correlation | 0.442 | 0.403 |
| KMO statistic | 0.927 | 0.907 |
| Bartlett's test, χ² (df = 66) | 2516.8; p < 0.001 | 1868.7; p < 0.001 |
| Factors retained by parallel analysis | 2 | 1 |
| First two correlation-matrix eigenvalues | 6.07, 1.28 | 5.46, 1.07 |
Note. Floor and ceiling denote the theoretical minimum (12) and maximum (48). Internal consistency does not establish unidimensionality or construct validity.
Table 3.
Multivariable correlates of the two stigma indices using HC3 robust standard errors (N = 399).
Table 3.
Multivariable correlates of the two stigma indices using HC3 robust standard errors (N = 399).
| Predictor | Social B (HC3 SE) | 95% CI | p | Self-stigma B (HC3 SE) | 95% CI | p |
|---|---|---|---|---|---|---|
| Age, years | -0.05 (0.04) | -0.12 to 0.02 | 0.190 | 0.01 (0.03) | -0.05 to 0.08 | 0.677 |
| Female sex (ref: male) | 0.37 (0.73) | -1.06 to 1.79 | 0.615 | 1.10 (0.70) | -0.27 to 2.47 | 0.116 |
| Technical/vocational (ref: university) | -0.53 (1.46) | -3.39 to 2.34 | 0.719 | 2.35 (1.29) | -0.19 to 4.88 | 0.070 |
| Complete secondary (ref: university) | -1.43 (0.88) | -3.16 to 0.29 | 0.104 | 0.76 (0.82) | -0.85 to 2.38 | 0.354 |
| Incomplete secondary (ref: university) | -2.91 (1.41) | -5.67 to -0.15 | 0.039 | 1.24 (1.47) | -1.65 to 4.13 | 0.399 |
| Employed (ref: not employed) | -0.07 (0.90) | -1.82 to 1.69 | 0.941 | 0.80 (0.86) | -0.88 to 2.47 | 0.353 |
| Married/partnered (ref: not married) | -0.05 (0.80) | -1.61 to 1.52 | 0.951 | 0.06 (0.83) | -1.57 to 1.68 | 0.943 |
| Household size | 0.40 (0.22) | -0.04 to 0.84 | 0.077 | 0.59 (0.21) | 0.18 to 1.00 | 0.005 |
| Traditional ger (ref: apartment) | -0.63 (1.03) | -2.64 to 1.38 | 0.540 | 0.87 (1.04) | -1.17 to 2.91 | 0.404 |
| House (ref: apartment) | 0.46 (0.94) | -1.39 to 2.31 | 0.627 | -0.91 (0.91) | -2.69 to 0.87 | 0.317 |
| Moderate COVID-19 (ref: mild) | -0.07 (0.84) | -1.71 to 1.57 | 0.935 | 0.37 (0.80) | -1.20 to 1.94 | 0.645 |
| Severe/critical COVID-19 (ref: mild) | -1.29 (2.30) | -5.80 to 3.22 | 0.575 | -1.17 (2.74) | -6.53 to 4.19 | 0.669 |
| Any chronic condition | 0.80 (0.70) | -0.58 to 2.18 | 0.255 | 1.30 (0.69) | -0.05 to 2.65 | 0.059 |
| BMI, kg/m² | -0.12 (0.12) | -0.35 to 0.11 | 0.292 | -0.06 (0.11) | -0.28 to 0.15 | 0.578 |
| R² / adjusted R² | 0.057 / 0.022 | 0.050 / 0.016 |
Note. B, unstandardized coefficient; BMI, body mass index; CI, confidence interval; ref, reference category. All predictors shown were entered simultaneously. Robust omnibus Wald p-values were 0.128 and 0.328 for education and 0.659 and 0.313 for residence type in the social discrimination/stigma and self-stigma/self-exclusion models, respectively. Maximum VIF was 1.52.
Table 4.
Concurrent correlations between stigma indices and baseline mental-health symptom scores (N = 399).
Table 4.
Concurrent correlations between stigma indices and baseline mental-health symptom scores (N = 399).
| Measure | Social r | p | FDR q | Self-stigma r | p | FDR q |
|---|---|---|---|---|---|---|
| PHQ-9 (depression) | 0.112 | 0.026 | 0.041 | 0.238 | <0.001 | <0.001 |
| GAD-7 (anxiety) | 0.050 | 0.315 | 0.315 | 0.161 | 0.001 | 0.003 |
| ISI (insomnia) | 0.089 | 0.076 | 0.101 | 0.076 | 0.132 | 0.151 |
| PCL-5 (PTSD symptoms) | 0.130 | 0.009 | 0.018 | 0.262 | <0.001 | <0.001 |
Note. FDR q values were calculated with the Benjamini-Hochberg procedure across all eight correlations.
Disclaimer/Publisher’s Note: The statements, opinions and data contained in all publications are solely those of the individual author(s) and contributor(s) and not of MDPI and/or the editor(s). MDPI and/or the editor(s) disclaim responsibility for any injury to people or property resulting from any ideas, methods, instructions or products referred to in the content. |
© 2026 by the authors. Licensee MDPI, Basel, Switzerland. This article is an open access article distributed under the terms and conditions of the Creative Commons Attribution (CC BY) license (http://creativecommons.org/licenses/by/4.0/).
Copyright: This open access article is published under a Creative Commons CC BY 4.0 license, which permit the free download, distribution, and reuse, provided that the author and preprint are cited in any reuse.