

Submitted:
29 September 2026
Posted:
29 September 2026
You are already at the latest version
Abstract
To characterize the growth performance and morphological traits of the Yunjin hybrid grouper (Epinephelus moara ♀ × E. tukula ♂) and its parental populations, this study investigated three 6-month-old grouper populations. Nineteen morphological traits were measured, and correlation analysis, path analysis, coefficient of determination, and gray correlation analysis were conducted to evaluate the relationships between morphological traits and body weight. The results showed that the body weight of 6-month-old Yunjin hybrid groupers reached 72.21 ± 15.10 g, representing a 20% increase compared to the maternal E. moara. The coefficient of variation for body weight was higher than that for measurable length-related traits. Path analysis revealed that total length, eye diameter, body width, and interorbital distance had significant direct effects on body weight in the Yunjin hybrid grouper. Multivariate linear regression equations were established for the three fish species based on the selected traits: YE. tukula= -208.010 + 10.669X1 + 25.299X5 + 14.869X6; YE. moara= -105.1640 + 4.442X1 + 26.629X4 + 9.582X6 + 10.352X7; YYunjin = -134.970 + 6.825X1 + 27.775X5 + 10.600X7 + 31.518X10. The gray correlation analysis showed that the five traits most closely associated with body weight were ranked as follows: total length > body length > head length > body height > body width, which was consistent with the results of the path analysis. This study identified the key morphological indicators affecting body weight in the three grouper populations, providing fundamental biological information and theoretical references for research on hybrid vigor and the selective breeding of the Yunjin hybrid grouper.
Keywords:
Yunjin hybrid grouper (Epinephelus moara ♀ × E. tukula ♂)
; body weight
; morphological traits
; path analysis
; gray correlation analysis
1. Introduction
Groupers belong to the genus Epinephelus within the family Serranidae of the order Perciformes. They are valuable marine economic fish species widely distributed in tropical and subtropical rocky reef waters. Due to their tender flesh, high nutritional value, and considerable market demand, groupers have become one of the major economically important species in cage and intensive aquaculture along China’s southeastern coast [1]. With the rapid expansion and intensification of marine aquaculture, problems including genetic degradation, reduced growth performance, decreased stress tolerance, and low survival rates have become increasingly prominent in traditionally cultured grouper populations, severely restricting the sustainable development of the grouper aquaculture industry [2]. As a core technology in fish genetic improvement, outcrossing can integrate the superior genetic traits of both parents to generate new hybrid varieties with enhanced growth performance and adaptability. It is currently considered an effective approach for improving grouper germplasm and overcoming bottlenecks in the aquaculture industry [3].
E. moara and E. tukula are both high-quality grouper species for aquaculture with highly complementary genetic characteristics. Compared with most grouper species, E. moara exhibits stronger tolerance to low temperatures and is the primary broodstock species cultured in China; however, its application is limited by relatively slow growth and a long cultivation period [4] . In contrast, E. tukula is one of the largest grouper species, with individuals reaching a maximum body weight of 100 kg, and exhibits outstanding growth performance. However, difficulties in artificial spawning and low larval survival rates have limited the development and utilization of its fast-growing traits in large groupers [5]. Based on the complementary advantages of the parental species, interspecific hybridization between E. moara and E. tukula was successfully conducted, resulting in the development of a new germplasm, the Yunjin hybrid grouper (E. moara ♀ × E. tukula ♂), which combines desirable traits such as rapid growth and cold tolerance. Comparative aquaculture experiments showed that at 220 days of age, the body weight of Yunjin hybrid grouper reached 173.42 ± 3.54 g, representing a 56.52% increase compared with that of the maternal E. moara (110.80 ± 2.38 g) at the same age, demonstrating a significant heterosis effect in growth performance [6]. Currently, extensive research has been conducted on the embryonic development, growth characteristics, morphological variation, and heterosis of grouper hybrids. Previous studies have shown that hybrid grouper offspring generally exhibit significant growth advantages, while their morphological traits, including body shape and coloration patterns, exhibit clear parental characteristics [7]. Furthermore, these morphological traits are stably inherited [8]. However, existing studies have primarily focused on genetic selection based on individual growth traits in specific hybrid populations, and systematic investigations of E. tukula, E. moara, and their F1 hybrid offspring remain limited. In particular, comprehensive analyses of differences in multiple morphological traits, growth patterns, and intergenerational correlation analyses between morphological traits and body weight are still lacking.
Body weight is a key economic trait in selective breeding, as it directly reflects fish growth performance and ultimately determines aquaculture production efficiency. However, in practical selection programs, body weight measurements can be affected by factors such as surface moisture and residual feed, leading to considerable measurement errors. In contrast, morphological traits are stable, easily identifiable, and closely associated with economically important traits such as body weight. With the development of high-throughput phenotyping technologies, indirect phenotypic selection methods have been increasingly applied to improve the accuracy and efficiency of growth selection in target fish species [9]. Among these, correlation analysis and path analysis are commonly used to elucidate the relationships between morphological traits and body weight. Path analysis can effectively decompose the direct and indirect contributions of individual morphological traits to body weight. In recent years, path analysis has been widely applied in the evaluation of growth traits in various marine fish species, including several hybrid grouper populations. For example, correlation analysis of morphological traits and body weight in Jinhu hybrid groupers (E. fuscoguttatus ♀ × E. tukula ♂) showed that body width, body height, head length, and caudal peduncle height could serve as primary selection traits for improving body weight [10] . Similarly, a study on morphological selection traits associated with body weight in Yunlong groupers (E. moara ♀ × E. lanceolatus ♂) at different growth stages demonstrated that total length and body height had the greatest direct effects on body weight, providing an important reference for selective breeding research [11]. However, integrated comparative studies on morphological traits associated with body weight in hybrid groupers and their parental populations are lacking, restricting the evaluation of hybrid genetic stability and the genetic analysis of their hybrid vigor.
Therefore, this study used E. tukula, E. moara, and their F1 hybrid offspring as experimental subjects. First, the growth performance of the Yunjin hybrid grouper was evaluated, and 19 morphological parameters were measured in the three populations. Correlation analysis was used to determine the relationships between morphological traits and body weight. Subsequently, path analysis and gray correlation analysis were employed to identify key morphological traits influencing body weight, and regression analysis was performed to establish optimal regression equations for predicting body weight in each population. This study provides a preliminary evaluation of the growth characteristics of the newly developed Yunjin hybrid grouper and identifies key morphological indicators for body weight selection, thereby providing important data for subsequent growth selection studies on the Yunjin hybrid grouper and its parental species.
2. Materials and Methods
2.1. Experimental Materials
Both the experimental site and the experimental fish were provided by Laizhou Mingbo Aquatic Product Co., Ltd. (Yantai, China). Healthy, high-quality individuals with intact body surfaces were selected as broodstock. Fresh sperm from E. tukula was used to artificially fertilize eggs from E. moara to produce Yunjin hybrid grouper fertilized eggs. Meanwhile, artificial insemination was performed to produce purebred fertilized eggs of E. tukula and E. moara. All fry were reared under aquaculture conditions during the early developmental stages, with a water temperature of 24 ± 1 °C and dissolved oxygen levels exceeding 6 mg/L. When the fish reached 6 months of age, 100 normally sized experimental fish were randomly selected from each of the three rearing groups for growth comparisons and morphological trait measurements. Prior to the experiment, the fish were anesthetized with MS-222. Body weight was measured using an electronic balance with an accuracy of 0.01 g, and morphological traits were measured using a vernier caliper with an accuracy of 0.01 cm. Phenotypic analysis involved a total of 19 morphological indicators. Among them, eight countable traits were measured in 30 fish, including dorsal fin spines, dorsal soft rays, pectoral soft rays, abdominal fin spines, abdominal fin rays, pectoral fin spines, pectoral fin rays, and tail fin rays. Eleven measurable traits were recorded in 100 individuals, including body weight (Y) and 10 morphometric traits: total length (X1), body length (X2), head length (X3), snout length (X4), eye diameter (X5), body height (X6), body width (X7), caudal peduncle length (X8), caudal peduncle height (X9), and interorbital distance (X10).
2.2. Analytical Methods
All morphological data were statistically analyzed using Microsoft Excel 2020 and IBM SPSS Statistics 27 software, and data visualization was performed using OriginPro 2024 software. Based on the calculated phenotypic parameters of each morphological trait, correlation analysis, path analysis, and gray correlation analysis were conducted to evaluate their relationships with body weight. Finally, multiple linear regression analysis was used to establish regression equations describing the effects of morphological traits on body weight. The specific operational procedures and calculation methods followed those described by Du and Liu [9,12]. A p-value < 0.05 indicated a significant difference between datasets, while p<0.01 indicated a highly significant difference.
In this study, the path coefficient was abbreviated as; the indirect path coefficient was abbreviated as; the total coefficient of determination was abbreviated as; the coefficient of determination of a single trait for body weight was abbreviated as; and the joint coefficient of determination of two traits for body weight was abbreviated as. The calculation formulas are as follows:
Correlation coefficient:
The coefficient of variation (CV) for the 10 morphometric traits and body weight was calculated as follows: CV = (SD/mean) × 100%. Following the calculation method described by GOMES [13], CV values were classified into the following categories: low (CV < 10%), medium (CV between 10% and 20%), high (CV between 20% and 30%), and very high (CV > 30%).
Calculation of the Hybrid Index: Eight quantifiable traits, such as dorsal fin spines and soft ray numbers, were selected to calculate the hybrid index (HI) of the hybrid offspring using the following formula:
Traits were classified according to the calculated HI values as follows: 0 < HI < 45 indicated maternal-biased traits; 45 < HI < 55 indicated intermediate traits; and 55 < HI < 100 indicated paternal-biased traits. HI values < 0 or > 100 indicated super-parental segregation.
3. Results
3.1. Growth Comparison
At six months of age, the body weights of E. tukula, E. moara, and the Yunjin hybrid grouper were 107.86 ± 20.49 g, 60.26 ± 6.41 g, and 72.21 ± 15.10 g, respectively, with corresponding total lengths of 19.32 ± 1.29 cm, 16.51 ± 0.67 cm, and 16.71 ± 1.26 cm. Among these, the body weight of the Yunjin hybrid grouper was approximately 20% higher than that of the maternal E. moara but significantly lower than that of the paternal E. tukula (Figure 1). The morphological characteristics of the hybrid were intermediate between those of the two parental populations, while its overall dorsal pattern was more similar to that of the maternal E. moara.
3.2. Phenotypic Measurements
Nineteen morphological traits of the three grouper populations were measured and statistically analyzed. The data for countable traits are presented in Table 1. Chi-square test results showed that no significant differences were detected among the three populations for any of the countable traits. Regarding the hybrid index, the number of dorsal fin spines in the Yunjin hybrid grouper was lower than 45, indicating a maternal-biased phenotype. In contrast, the number of soft rays in the dorsal fin exceeded 55, indicating a paternal-biased trait. The absolute values of hybrid indices for pectoral fin soft ray number, anal fin spine number, anal fin ray number, and caudal fin ray number all exceeded 100, indicating deviations beyond the parental mean. The average hybrid index was 47.22, placing it in the intermediate range.
The results of the quantifiable trait measurements are shown in Table 2. The CVs for body weight (Y) in E. tukula, E. moara, and the Yunjin hybrid grouper were all higher than those for other morphological traits, with values of 19.002%, 10.641%, and 20.909%, respectively. In contrast, the CVs for total length were the lowest among all measured traits, with values of 6.661%, 4.076%, and 7.523%, respectively.
3.3. Normality Test of Body Weight
Normality tests were first performed on the body weight (Y) data of six-month-old E. tukula, E. moara, and the Yunjin hybrid grouper (Table 3). In this study, 100 individuals were sampled from each population (n = 100), and the data were tested using the Kolmogorov–Smirnov test and Shapiro–Wilk test. All results showed p > 0.05, indicating that the body weight data of all three populations followed a normal distribution and were suitable for subsequent data analysis.
3.4. Correlation Analysis of Phenotypic Traits
3.4.1. Correlation Analysis Between Morphological Traits and Body Weight
The results of the correlation analysis are shown in Figure 2. Among them, total length exhibited the strongest correlation with body weight in E. tukula, E. moara, and the Yunjin hybrid grouper, with correlation coefficients of 0.935, 0.850, and 0.905, respectively. Among the morphological traits, total length and body length showed high correlations in the three grouper populations, with correlation coefficients of 0.942, 0.912, and 0.987, respectively, all reaching an extremely significant level (p < 0.01). This suggests the possible presence of multicollinearity among morphological traits, which requires further evaluation.
3.4.2. Multicollinearity Test
Multicollinearity tests were conducted on the morphological traits of the three grouper populations. The results showed that the partial regression coefficients of total length and body height in E. tukula, E. moara, and the Yunjin hybrid grouper all reached highly significant levels (p < 0.01). Variance inflation factor (VIF) analysis revealed that the VIF value between total length and body length was 9.378 in E. moara, while the VIF values between these two traits in E. tukula and E. moara exceeded 10, indicating a high risk of multicollinearity. Furthermore, the partial regression coefficient of body length showed a lower significance level than that of total length for predicting body weight. Based on the above results, body length was excluded from subsequent analyses, and stepwise regression analysis was performed using the remaining nine morphological traits.

Table 4.
Multicollinearity test results.
| Three Groups | Traits | Partial Regression Coefficient | Significance | Variance inflation Factor |
| E. tukula | X1 | 7.276 | 0.000 | 12.387 |
| X2 | 2.821 | 0.088 | 10.234 | |
| X3 | 4.147 | 0.098 | 2.914 | |
| X4 | -2.650 | 0.769 | 3.251 | |
| X5 | 19.909 | 0.040 | 1.272 | |
| X6 | 14.444 | 0.000 | 3.271 | |
| X7 | 3.266 | 0.303 | 4.128 | |
| X8 | 2.696 | 0.424 | 1.594 | |
| X9 | 3.856 | 0.601 | 3.409 | |
| X10 | 1.230 | 0.884 | 3.433 | |
| E. moara | X1 | 1.925 | 0.000 | 9.378 |
| X2 | 1.562 | 0.078 | 6.176 | |
| X3 | 1.658 | 0.153 | 2.312 | |
| X4 | 25.328 | 0.000 | 1.546 | |
| X5 | 9.448 | 0.016 | 1.945 | |
| X6 | 8.189 | 0.000 | 1.793 | |
| X7 | 9.249 | 0.003 | 2.483 | |
| X8 | 3.423 | 0.154 | 1.673 | |
| X9 | 0.364 | 0.838 | 1.281 | |
| X10 | -0.079 | 0.776 | 1.035 | |
| E. moara♀ × E. tukula♂ | X1 | 12.834 | 0.000 | 58.448 |
| X2 | -6.977 | 0.030 | 52.220 | |
| X3 | 2.447 | 0.344 | 4.732 | |
| X4 | -3.616 | 0.679 | 2.115 | |
| X5 | 23.083 | 0.003 | 1.800 | |
| X6 | 0.896 | 0.734 | 3.260 | |
| X7 | 13.019 | 0.000 | 3.123 | |
| X8 | -1.119 | 0.671 | 3.019 | |
| X9 | -0.614 | 0.931 | 4.596 | |
| X10 | 27.911 | 0.000 | 1.768 |
3.5. Path Analysis of the Effects of Morphological Traits on Body Weight
3.5.1. Analysis of Direct and Indirect Effects of Morphological Traits on Body Mass
Path analysis was performed to evaluate the relationships between various morphological traits and body weight. The results showed that, in E. tukula, total length, eye diameter, and body height were significantly correlated with body weight. In E. moara, total length, snout length, body height, and body width showed significant correlations with body weight. In the Yunjin hybrid grouper, total length, eye diameter, body width, and interorbital distance showed significant correlations with body weight. Based on the principles of correlation coefficient decomposition, the effects of morphological traits on body weight can be further divided into direct and indirect effects.
As shown in Table 5, E. tukula exhibited the highest direct path coefficient of total length on body weight, with a value of 0.670. In E. moara, total length also showed the highest direct path coefficient for body weight (0.466), while body width had the lowest direct effect on body weight (0.188). In the Yunjin hybrid grouper, total length had the highest direct path coefficient for body weight (0.568), while eye diameter exhibited the lowest direct effect for body weight (0.157). The direct effect of total length on body weight (0.568) was greater than its indirect effect (0.338). In contrast, the indirect effects of eye diameter, body width, and interorbital distance on body weight (0.161, 0.500, and 0.514, respectively) were greater than their corresponding direct effects (0.157, 0.280, and 0.173, respectively). In summary, total length showed the strongest direct contribution to body weight, while the effects of other relevant traits were mainly indirect, largely mediated through their associations with total length.
3.5.2. Analysis of the Coefficients of Determination of Morphological Traits for Body Weight
Table 6 presents the coefficients of determination of individual morphological traits for body weight. The diagonal values represent the individual coefficients of determination of each morphological trait. A comparison showed that total length had the highest individual coefficient of determination for body weight in E. tukula, with a value of 0.449. In E. moara, total length had the highest individual coefficient of determination for body weight (0.217), followed by body height (0.153). In the Yunjin hybrid grouper, total length also showed the highest individual coefficient of determination for body weight (0.323), while eye diameter had the lowest value (0.025). The remaining values in Table 6 represent the combined coefficients of determination for body weight based on pairs of traits. Among these, total length and body height showed the strongest combined effect in E. tukula, with a coefficient of determination of 0.325. Similarly, in E. moara, the combined effect of total length and body height was strongest, with a coefficient of determination of 0.153. In the Yunjin hybrid grouper, the combined effect of total length and body width was strongest, with a coefficient of determination of 0.222.
The total coefficients of determination of morphological traits for body weight in E. tukula, E. moara, and the Yunjin hybrid grouper were 0.920, 0.870, and 0.901, respectively. The relatively low residual factors indicated that these traits were core indicators associated with body weight and accounted for a large proportion of its variation.
3.6. Establishment of Multivariate Regression Equations
For E. tukula, an optimal multiple regression equation was established with body weight as the dependent variable and total length, body height, and eye diameter as independent variables: Y = -208.010 + 10.669X1+ 25.299X5+ 14.869X6 (F = 371.636, p < 0.01).
For E. moara, the optimal multiple regression equation was established with body weight as the dependent variable and total length, eye diameter, body width, and interorbital distance as independent variables: Y = -105.1640 + 4.442X1 +26.629X4 +9.582X6 +10.352X7 (F = 163.125, p < 0.01).
For the Yunjin hybrid grouper, the optimal multiple regression equation was established with body weight as the dependent variable and total length, eye diameter, body width, and interorbital distance as independent variables: Y = -134.970 + 6.825X1 +27.775X5 +10.600X7 +31.518X10 (F = 221.242, p < 0.01).
Significance tests of the multiple regression models and standardized regression coefficients indicated that the regression constant and all standardized regression coefficients reached significance levels (p < 0.05), confirming the reliability of the above-mentioned fitted equations.
3.7. Gray Correlation Analysis of Morphometric Traits Associated with Body Weight
Figure 3 shows the gray correlation analysis between 10 morphometric traits and body weight in the three grouper populations. For E. tukula, E. moara, and the Yunjin hybrid grouper, the five traits with the highest gray correlation grades were ranked as follows: total length > body length > head length > body height > body width. The gray correlation coefficients between morphometric traits and body weight ranged from 0.663 to 0.738 in E. tukula, from 0.708 to 0.845 in E. moara, and from 0.620 to 0.708 in the hybrid grouper.
4. Discussion
Path analysis, based on a multiple linear regression model, can further decompose simple correlation coefficients between traits into direct and indirect path coefficients. These coefficients quantify the direct effect of an individual morphometric trait on body weight and the indirect effect mediated through other associated traits, respectively, thereby enabling a more intuitive and precise evaluation of the relative contributions and relationships among traits associated with body weight [14]. Currently, this analytical method has been successfully applied in the analysis of trait association mechanisms and directed breeding research in various aquatic organisms [15,16]. Phenotypic statistical results from this study on 6-month-old Yunjin hybrid groupers and their parents indicated that the CV for body weight in all three grouper populations was significantly higher than that for other morphological traits. This was consistent with the variation patterns observed in growth traits of most fish species [17], including Lepomis gibbosus [18], and Oreochromis niloticus [19]. The higher variation in body weight may be attributed to the combined effects of multiple factors, such as feeding, metabolism, and environmental conditions, which contribute to greater phenotypic plasticity. In contrast, skeletal-related morphological traits, such as body length and total length, exhibit higher genetic stability, are less susceptible to external disturbances, and show more conservative variation, making them suitable auxiliary indicators for selective breeding. At the same time, there was a very strong correlation between total length and body length across the three populations, accompanied by significant multicollinearity. Similar patterns have also been reported in grouper populations, including E. fasciatus [20] and Yunlong grouper [11]. Eliminating collinear variables and selecting core traits are essential prerequisites for constructing precision breeding models.
In terms of trait contribution effects, total length was found to be the core trait making the greatest direct contribution to body weight across all three grouper populations. Its direct path coefficient was significantly higher than that of other traits, making it an important factor associated with body weight variation in juvenile fish. This was supported by morphological trait analyses of 5-month-old E. coioides [21] and hybrid groupers [22], which demonstrated that total length was the primary morphological indicator associated with body weight during the juvenile stage of grouper, reflecting the developmental pattern of juvenile groupers characterized by predominantly axial body growth. Aside from total length, the differential roles of other core traits reflect the differences in trait characteristics between purebred and hybrid populations. E. tukula emphasizes longitudinal body development, such as body height and eye diameter, whereas E. moara relies more on body thickening, as indicated by snout length and body width, and the development of feeding organs. In contrast, the hybrid offspring integrate the phenotypic characteristics of both parents and exhibit a new significant association between interorbital distance and body weight, demonstrating a unique pattern of trait regulation and suggesting that distant hybridization can induce changes in trait regulation networks.
Combined with the hybrid index results, it can be observed that the hybrid indices for most quantifiable traits in the Yunjin hybrid grouper ranged from 0 to 45. The morphological phenotype generally showed a maternal tendency toward E. moara, with only snout length exhibiting phenotypic characteristics of the paternal E. tukula; some traits exhibited negative super-parental effects. This pattern was also evident from the path analysis and coefficient of determination results: the hybrid offspring retained total length, a core selection trait shared by both parents, while inheriting the significant association between body width and body weight from the maternal E. moara. At the same time, they incorporated the paternal influence of eye diameter and showed a unique association of interorbital distance, which was significant only in the hybrid population. The mean body weight of the hybrid offspring was closer to the maternal level, indicating that the variation pattern of body weight also exhibited a maternal tendency. Thus, under this distant hybrid combination, the morphological and body weight-associated networks of the offspring did not represent a simple superposition of parental traits but rather exhibited a distinct maternal genetic tendency accompanied by interactions among new trait associations induced by hybridization.
The path analysis results of morphological traits and body weight in two parental grouper lines and their hybrid offspring indicated that the core morphological traits influencing body weight were significantly differentiated among different genetic populations. A comprehensive analysis revealed that the significant traits ultimately included in the path analysis models for each population did not fully encompass all morphological indicators significantly correlated with body weight, and that the core traits associated with body weight among the three groups of experimental fish exhibited distinct population-specific characteristics. These results indicate that simple correlation analysis can only reflect the degree of association between traits and cannot account for the interference caused by mutual constraints and interactions among morphological traits, further validating the necessity and scientific rigor of path analysis. In this study, the total coefficients of determination for body weight based on the core morphological traits screened from the three grouper populations were not lower than 0.87, with minimal residual effects, indicating that the traits retained by path analysis were the primary morphological traits associated with body weight variation in different populations [15,23].
Gray correlation analysis, based on gray systems theory and the geometric similarity principle of sequences, quantifies the degree of correlation between variables and can effectively reveal the patterns of factor correlations in systems with incomplete data and information uncertainty [24]. It has been widely applied in studies on the correlation mechanisms of morphological traits [14] and physiological traits [25] in aquatic animals. The results of the gray correlation analysis in this study further supported the aforementioned conclusions. In the three grouper populations, the correlation coefficients for total length, body length, head length, body height, and body width with body weight were among the highest, which was highly consistent with the core traits identified by path analysis. These findings established a multidimensional and mutually corroborative analytical framework; however, subtle differences were also observed. Path analysis and gray correlation analysis differ significantly in terms of data requirements and analytical principles. Path analysis is more suitable for larger datasets and can elucidate the relationships among independent variables, whereas gray correlation analysis requires relatively smaller sample sizes and evaluates the contribution of each independent variable independently, without considering statistical significance or multicollinearity. The theoretical foundations of these two statistical methods differ, and each method has its own requirements for input data [9,26]. Therefore, selecting appropriate analytical methods according to the target trait, or conducting comparative validation by combining multiple statistical methods, is of great significance for objectively identifying the key factors influencing the target trait.
5. Conclusions
This study compared the growth performance and morphological characteristics of the newly developed Yunjin hybrid grouper and its parental populations, and analyzed the relationships between phenotypic traits and body weight. The results indicated that the overall morphology of the Yunjin hybrid grouper showed a maternal tendency toward E. moara. The results of gray correlation analysis further supported the reliability of the path analysis results. In summary, total length can serve as a common indicator for the indirect selection of body weight in the three grouper populations. Additionally, eye diameter, body width, and interorbital distance can be used as supplementary traits for early selection of the Yunjin hybrid grouper. These findings provide valuable data references for germplasm evaluation and breeding practices of this hybrid grouper.
Author Contributions
Y.L. D.B., and Y.T. co-conceived this study and supervised the experiments; Y.W., X.J., Y.Z., and K.C. performed the experiments, and created the figures; Z.L. and Y.X. conducted the data analysis, and provided the funding support. Y.W. wrote the manuscript. All authors have read and agreed to the published version of the manuscript.
Funding
This research was funded by the Key Research and Development Project of Shandong Province (2026LZGC045); the Yellow Sea Fisheries Research Institute Research Fees (20603022025002); 2025 Research on breeding technology of candidate species for Guangdong modern marine ranching (2025-MRB-00-001); National Natural Science Foundation of China (32604862); Hainan Seed Industry Laboratory (B25H10CB2; B25H1QC02; B25Z10C03); Hainan Province Science and Technology Commissioner Project (KJTP202548); Hainan Province Science and Technology Special Fund (ZDYF2025SXLH002); Shandong Province Natural Science Foundation (ZR2025QC146); China Agriculture Research System of MOF and MARA (CARS-46-G31); Central Public-interest Scientific Institution Basal Research Fund, CAFS (2020TD19).
Institutional Review Board Statement
The research in this manuscript has been conducted under the Experimental Animal Care, Ethics and Safety Inspection Form Yellow Sea Fisheries Research Institute, CAFS (approval code: YSFRI-2025072).
Informed Consent Statement
Not applicable.
Data Availability Statement
The original contributions presented in this study are included in the article/Supplementary Material. Further inquiries can be directed to the corresponding author.
Conflicts of Interest
The author declares no conflicts of interest.
References
- CHATLA, D. Taxonomic validation of Areolate grouper, Epinephelus areolatus (Perciformes: Serranidae) along the Nizampatnam coast, India. J. Appl. Biol. Biotechnol. 2020, 8, 7–15. [Google Scholar] [CrossRef]
- YBANEZ, J.R. C. O.; GONZALES, R. C. Challenges and progress of grouper aquaculture in asia: A Review. Davao Res. J. 2023, 14, 6–29. [Google Scholar] [CrossRef]
- XU, K.; DUAN, W.; XIAO, J.; et al. Development and application of biological technologies in fish genetic breeding. Sci. China Life Sci. 2015, 58, 187–201. [Google Scholar] [CrossRef]
- LIU, T.; DONG, F.; SUN, Y.; et al. Effect of Dietary Lipid Level on Growth Performance, Feed Utilization, and Body Composition of Juvenile Kelp Grouper Epinephelus moara. Fishes 2025, 10, 244. [Google Scholar] [CrossRef]
- ZENG, L.; WEI, Q.; WANG, T.; et al. Chromosome-level genome assembly and annotation of potato grouper (Epinephelus tukula). Sci. Data 2026, 13, 287. [Google Scholar] [CrossRef]
- TANG, J.; YIAN, Y.; LI, Z.; et al. Development and Growth Traits of Distant Hybrid Offspring of Epinephelus moara(♀)×E. tukula(♂). J. Guangdong Ocean Univ. 2019, 39, 27–34. [Google Scholar]
- CAO, L.; CHEN, P.; HOU, X.; et al. Genetic characteristics and growth patterns of the hybrid grouper derived from the hybridization of Epinephelus fuscoguttatus (female)× Epinephelus polyphekadion (male). J. Fish. Biol. 2023, 102, 328–39. [Google Scholar] [CrossRef]
- QI, Q.; YANG, F.; SUN, X.; et al. Path analysis and multiple linear regression fitting study on body weight and visceral organ mass of male and female ussuri catfish (Pseudobagras ussuriensis). Fishes 2025, 10, 537. [Google Scholar] [CrossRef]
- LIU, J.; HU, Z.; SU, C.; et al. Correlations Between Morphometric Traits and Body Mass Among Different Geographical Populations of Wild Macrobrachium nipponense in Upper Reaches of the Huaihe River, China. Fishes 2025, 10, 413. [Google Scholar] [CrossRef]
- CHEN, C.; SHANG, X.; MA, C.; et al. Correlation Between Morphological Traits and Body Mass and Path Analysis of Epinephelus moara ♀ ×Epinephelus lanceolatus♂. Tianjin Fish. Res. Inst. 2024, 30, 49–54. [Google Scholar]
- WU, S.; LUO, H.; ZHANG, Z.; et al. Principal component and path analysis of phenotypic traits of Yunlong grouper with different month ages. J. Dalian Ocean Univ. 2019, 34, 680–7. [Google Scholar]
- DU, J.; CHEN, Z. Carrying out path analysis by linear regression of SPSS. B Biol 2010, 45, 4–6. [Google Scholar]
- Gomes, F.P. Curso de Estatística Experimental, 6th ed.; Nobel: Piracicaba, Brazil, 1985; p. 430. [Google Scholar]
- LI, J.; QIN, Q.; TIAN, X.; et al. Effects of Different Cultivation Modes on Morphological Traits and Correlations between Traits and Body Mass of Crayfish (Procambarus clarkii). Biology 2024, 13, 395. [Google Scholar] [CrossRef]
- MA C, M.A. H.; M.A. L.; et al. Correlation of growth-related traits and their effects on body weight of the mud crab (Scylla paramamosain). Genet Mol. Res. 2013, 12, 4127–36. [Google Scholar] [CrossRef]
- YOUHUI, H.; BIN, F.; YIMING, L. I.; et al. Path analysis for the correlations between morphological traits and body weight in five Macrobrachium nipponense populations. J. Fish. China 2016, 40, 1173–1185. [Google Scholar]
- SCOCCO, P.; DE FELICE, E. Morphological and physiological research on fish. Animals 2025, 15, 1513. [Google Scholar] [CrossRef]
- Halilović, S. H.; Adrović, A.; Dekić, R. Morphometric characteristics and length-weight relationship of pumpkinseed sunfish (Lepomis gibbosus) from three reservoirs of north-eastern Bosnia and Herzegovina. Acta Sci. Balc. 2021, 2, 35–44. [Google Scholar] [CrossRef]
- YAKUBU, A.; OKUNSEBOR, S. A.; KIGBU, A. A.; et al. Use of Factor Scores for Predicting Body Weight from Some Morphometric Measurements of Two Fish Species in Nigeria. J. Agric. Sci. (1916-9752) 2012, 4, 60. [Google Scholar] [CrossRef]
- DING, T.; TIAN, Y.; BAI, D.; et al. Evaluation of Hypoxia Tolerance and Correlation Analysis Between Morphological Traits and Body Weight of Epinephelus fasciatus. Prog. Fish. Sci. 2026, 1–13. [Google Scholar]
- ZHAO, W.; YANG, R.; HU, J.; et al. Path analysis of morphological traits effects on body weight of five-month-old grouper Epinephelus coioides. J. Dalian Ocean Univ. 2017, 32, 557–62. [Google Scholar]
- HAUNG, J.; ZHANG, J.; CHEN, G.; et al. Path Analysis of Morphometric Traits on Body Weight for Hybrid Grouper (Epinephelus fuscoguttatus♀ × E.polyphekadion♂). J. Guangdong Ocean Univ. 2017, 37, 23–8. [Google Scholar]
- XU, W.; FENG, Y.; GU, Z.; et al. Effects of morphological traits on body weight and analysis of growth-related genes of Parabramis pekinensis at different ages. BMC Zool. 2023, 8, 13. [Google Scholar] [CrossRef]
- JULONG, D. Introduction to grey system theory. J. Grey Syst. 1989, 1, 1–24. [Google Scholar] [CrossRef]
- YIHUA, C.; ZHENGYU, S.; GUOLONG, Z.; et al. Salinity tolerance assessment of different families of the razor clam Sinonovacula constricta using physiological traits. Aquaculture 2025, 595, 741494. [Google Scholar] [CrossRef]
- LIU, S.; FORREST, J.; YANG, Y. A brief introduction to grey systems theory. Grey Syst. Theory Appl. 2012, 2, 89–104. [Google Scholar] [CrossRef]
Figure 1.
Comparative analysis of individual variation among three grouper populations. Note: ** indicates an extremely significant difference (p < 0.01); * indicates a significant difference (p < 0.05). The same applies below.
Figure 1.
Comparative analysis of individual variation among three grouper populations. Note: ** indicates an extremely significant difference (p < 0.01); * indicates a significant difference (p < 0.05). The same applies below.
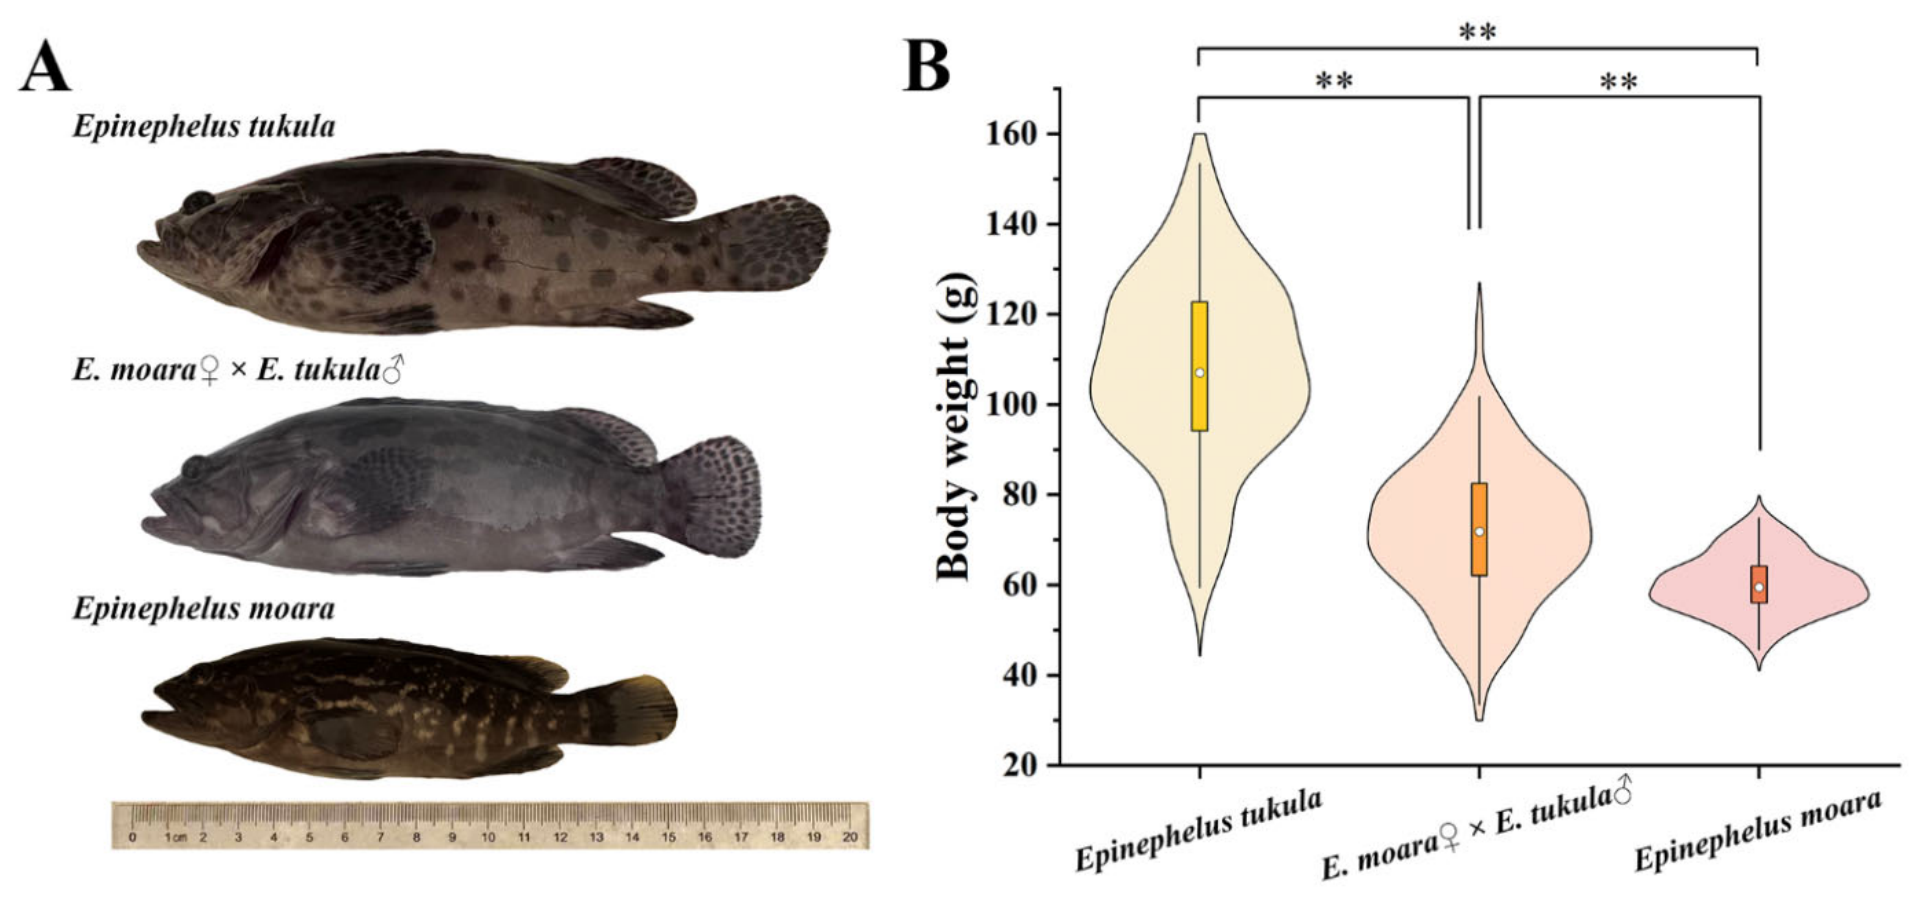
Figure 2.
Correlation results among phenotypic traits in three grouper populations. (a–c) indicate E. tukula, E. moara, and E. moara ♀ × E. tukula ♂ populations, respectively.
Figure 2.
Correlation results among phenotypic traits in three grouper populations. (a–c) indicate E. tukula, E. moara, and E. moara ♀ × E. tukula ♂ populations, respectively.
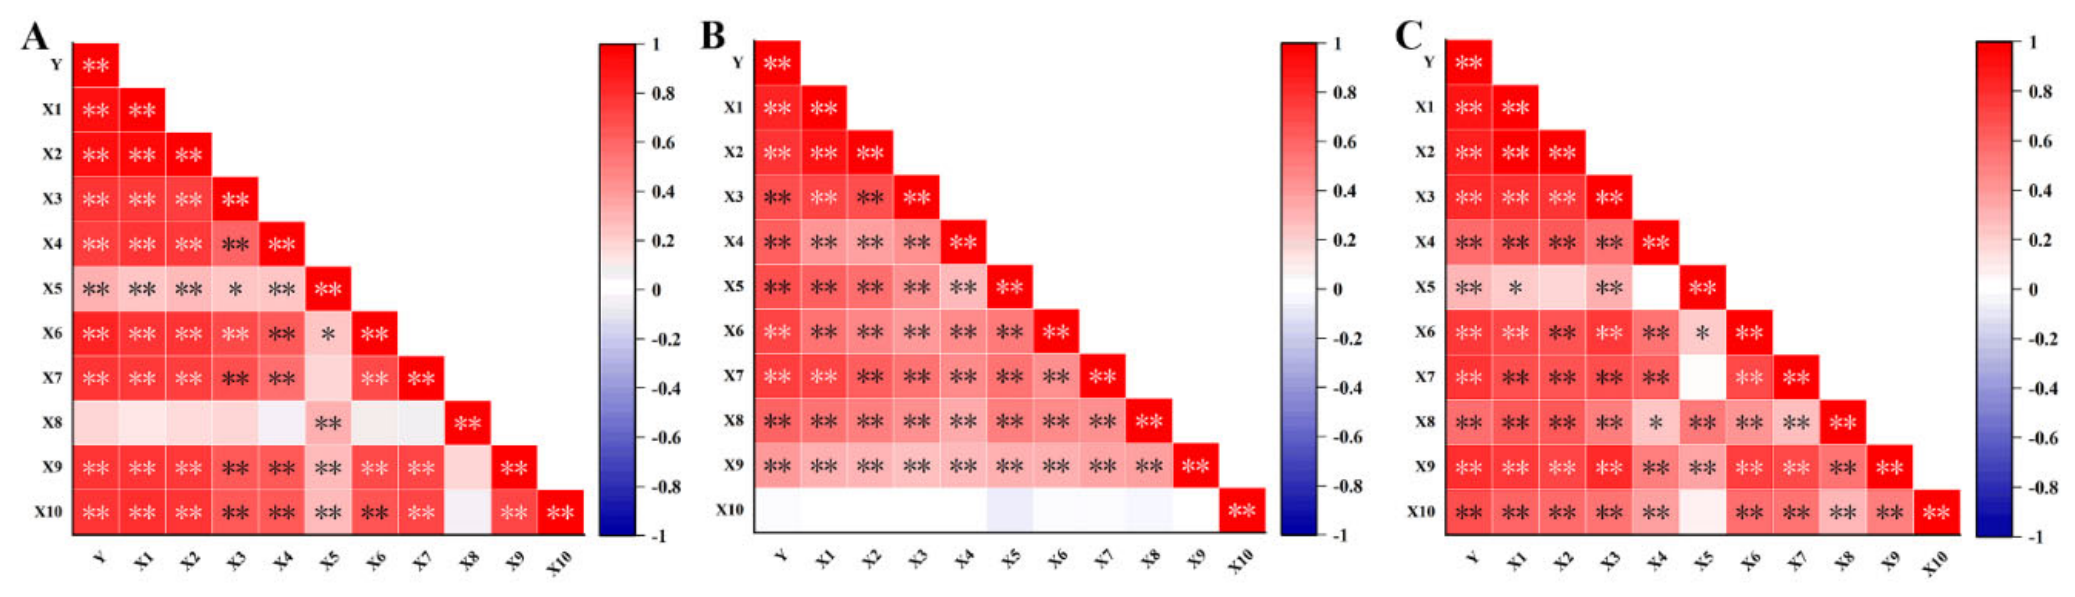
Figure 3.
Heatmap of gray relational grades between morphometric traits and body weight in three grouper populations.
Figure 3.
Heatmap of gray relational grades between morphometric traits and body weight in three grouper populations.
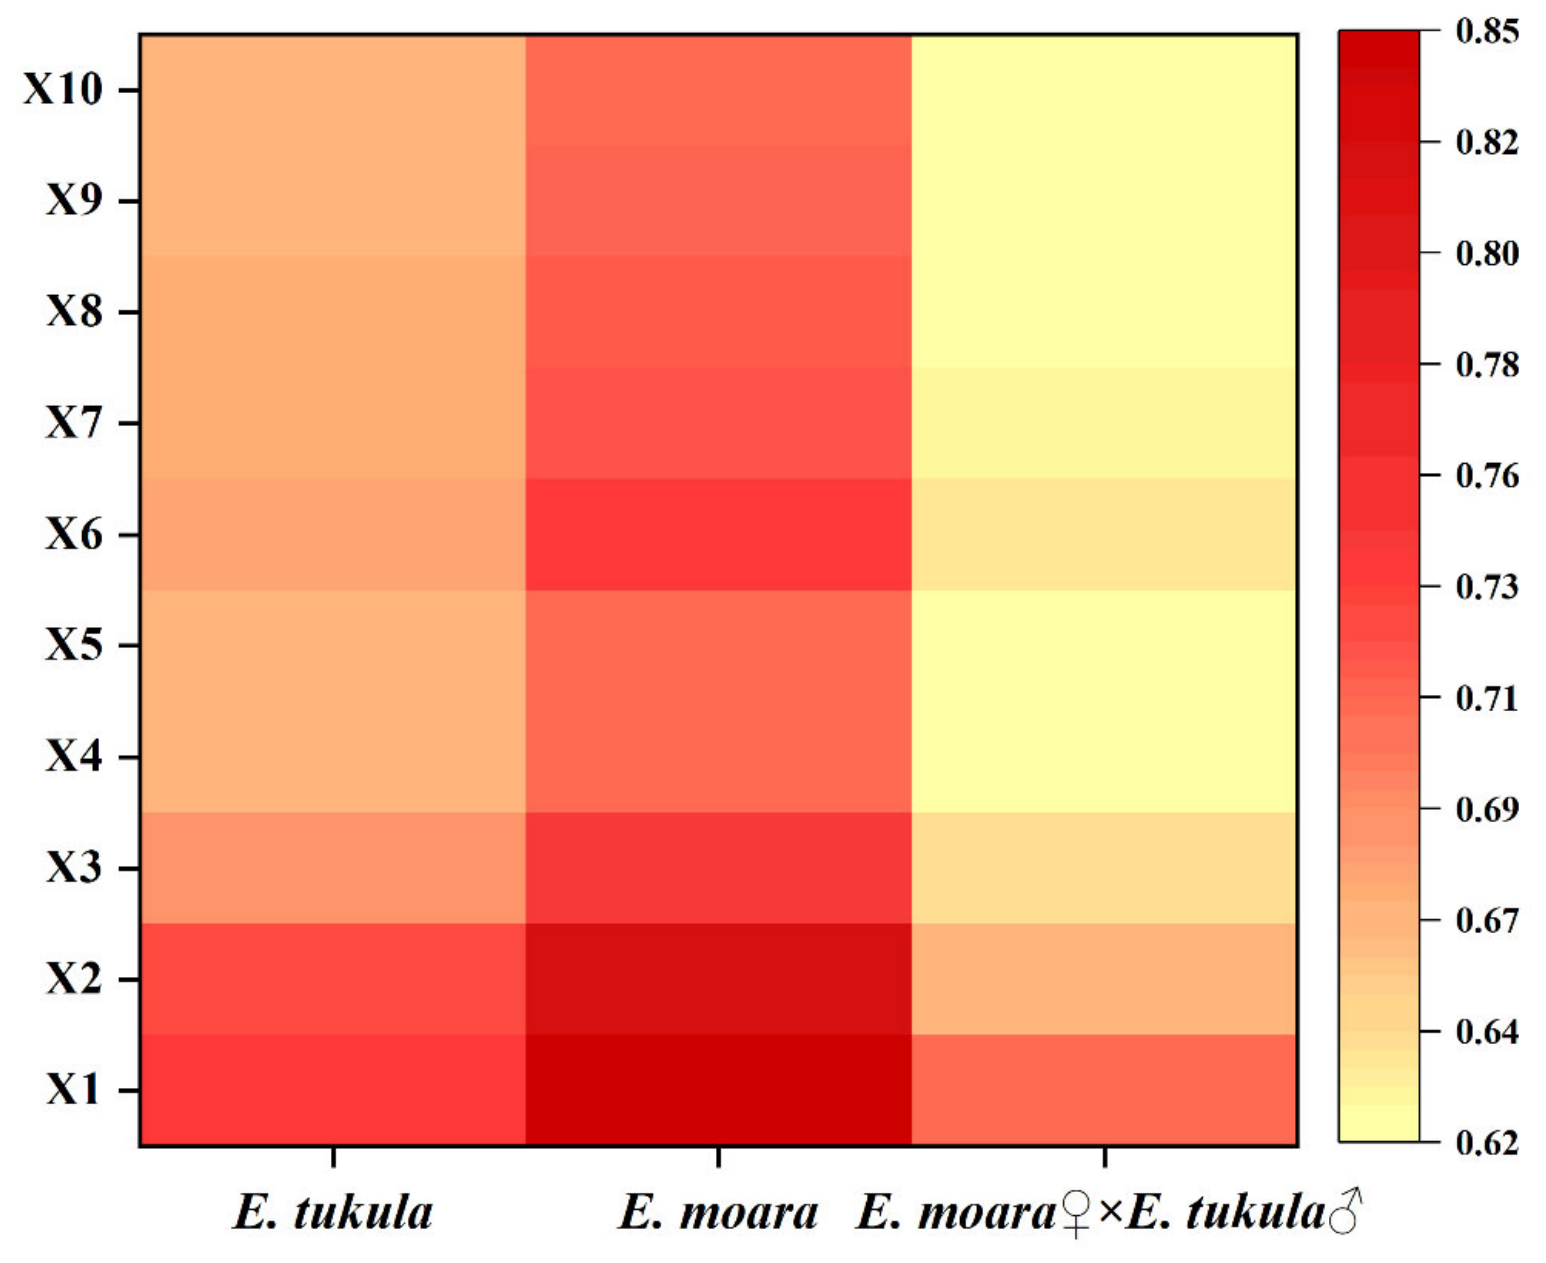
Table 1.
Statistics of countable morphological traits in three grouper populations.
| Amount | E. tukula | E. moara | E. moara♀ × E. tukula♂ | HI |
|---|---|---|---|---|
| Average±SD | Average±SD | Average±SD | ||
| Dorsal fin spines | 11.07±0.26 | 11.00±0.00 | 11.00±0.00 | 0.00 |
| Dorsal soft rays | 15.60±0.51 | 14.03±0.40 | 15.37±0.63 | 85.35 |
| Pectoral soft ray | 17.73±0.70 | 16.87±0.64 | 17.80±0.56 | 108.14 |
| Abdomina fin spine | 1.00±0.00 | 1.00±0.00 | 1.00±0.00 | |
| Abdominal fin rays | 4.00±0.00 | 4.00±0.00 | 5.00±0.00 | |
| Pectoral fin spine | 1.93±0.26 | 1.53±0.74 | 2.00±0.00 | 117.50 |
| Pectoral fin ray | 8.00±0.53 | 8.13±0.52 | 8.00±0.55 | 100.00 |
| Tail fin ray | 16.73±0.80 | 17.20±0.68 | 17.80±0.56 | -127.66 |
| Mean | 47.22 | |||
Table 2.
Statistical results of measurable traits in three grouper populations.
| Three Groups | Traits | Mean | Standard Deviation | Skewness | Kurtosis | Coefficient of Variation | ||||
| E. tukula | Y(g) | 107.857 | 20.495 | -0.133 | -0.268 | 19.002 | ||||
| X1(cm) | 19.323 | 1.287 | -0.421 | 0.165 | 6.661 | |||||
| X2(cm) | 15.847 | 1.123 | -0.282 | 0.016 | 7.084 | |||||
| X3(cm) | 5.541 | 0.396 | -0.370 | 1.508 | 7.141 | |||||
| X4(cm) | 1.122 | 0.115 | 0.165 | -0.499 | 10.258 | |||||
| X5(cm) | 0.969 | 0.068 | -1.720 | 3.016 | 6.988 | |||||
| X6(cm) | 4.581 | 0.343 | 0.180 | 0.343 | 7.489 | |||||
| X7(cm) | 3.089 | 0.370 | 0.372 | -0.629 | 11.989 | |||||
| X8(cm) | 2.626 | 0.216 | -0.421 | 0.820 | 8.220 | |||||
| X9(cm) | 2.025 | 0.145 | 0.063 | 0.472 | 7.136 | |||||
| X10(cm) | 1.005 | 0.127 | 0.148 | -0.661 | 12.600 | |||||
| E. moara | Y(g) | 60.261 | 6.412 | 0.193 | -0.417 | 10.641 | ||||
| X1(cm) | 16.509 | 0.673 | -0.020 | -0.374 | 4.076 | |||||
| X2(cm) | 13.733 | 0.629 | 0.242 | 0.290 | 4.580 | |||||
| X3(cm) | 5.486 | 0.293 | -0.371 | 0.090 | 5.340 | |||||
| X4(cm) | 0.999 | 0.046 | -0.039 | 1.914 | 4.605 | |||||
| X5(cm) | 0.898 | 0.080 | -0.321 | -0.559 | 8.909 | |||||
| X6(cm) | 4.150 | 0.199 | 0.406 | 0.084 | 4.956 | |||||
| X7(cm) | 2.485 | 0.117 | -0.130 | 0.653 | 4.708 | |||||
| X8(cm) | 2.186 | 0.121 | -0.712 | 0.380 | 5.535 | |||||
| X9(cm) | 1.635 | 0.142 | 0.312 | 0.670 | 8.685 | |||||
| X10(cm) | 0.979 | 0.812 | 0.930 | 0.056 | 8.294 | |||||
| E. moara♀ × E. tukula♂ | Y(g) | 72.210 | 15.098 | 0.066 | 0.038 | 20.909 | ||||
| X1(cm) | 16.714 | 1.257 | -0.469 | 0.554 | 7.523 | |||||
| X2(cm) | 13.591 | 1.0804 | -0.498 | 0.662 | 7.949 | |||||
| X3(cm) | 5.270 | 0.401 | -0.478 | 0.040 | 7.606 | |||||
| X4(cm) | 1.078 | 0.084 | 0.162 | -0.279 | 7.792 | |||||
| X5(cm) | 0.929 | 0.085 | -1.198 | 1.419 | 9.158 | |||||
| X6(cm) | 4.179 | 0.325 | -0.127 | 1.071 | 7.783 | |||||
| X7(cm) | 2.572 | 0.284 | 0.843 | 2.459 | 11.037 | |||||
| X8(cm) | 2.065 | 0.292 | -0.349 | 0.116 | 14.176 | |||||
| X9(cm) | 1.762 | 0.143 | -0.180 | 0.339 | 8.147 | |||||
| X10(cm) | 0.922 | 0.082 | 0.216 | 0.036 | 8.9857 | |||||
Note: Y: Body Weight; X1: Total length; X2: Standard length; X3: Head length; X4: Snout length; X5: Eye diameter; X6: Body height; X7: Body width; X8: Caudal peduncle length; X9: Caudal peduncle depth; X10: Interorbital distance; the same applies below.
Table 3.
Results of the normality test for body weight.
| Items | Kolmogorov-Smirnov | Shapiro-Wilk | ||||||
| Statistic | Freedom | P1 | Statistic | Freedom | P2 | |||
| E. tukula | 0.051 | 100 | 0.200 | 0.990 | 100 | 0.634 | ||
| E. moara | 0.053 | 100 | 0.200 | 0.988 | 100 | 0.539 | ||
| E. moara♀ × E. tukula♂ | 0.040 | 100 | 0.200 | 0.995 | 100 | 0.974 | ||
Table 5.
Analysis of the direct and indirect effects of morphological traits on body weight.
| Traits | Correlation Coefficient | Direct Path Coefficient | Total | Indirect Path Coefficient | ||||
| X1-Y | X5-Y | X6-Y | ||||||
| E. tukula | X1 | 0.935** | 0.670 | 0.265 | 0.174 | 0.523 | ||
| X5 | 0.335** | 0.084 | 0.251 | 0.022 | 0.021 | |||
| X6 | 0.855** | 0.311 | 0.544 | 0.243 | 0.077 | |||
| E. moara | X1-Y | X4-Y | X6-Y | X7-Y | ||||
| X1 | 0.850** | 0.466 | 0.384 | 0.083 | 0.164 | 0.137 | ||
| X4 | 0.621** | 0.191 | 0.429 | 0.202 | 0.139 | 0.088 | ||
| X6 | 0.729** | 0.297 | 0.432 | 0.257 | 0.090 | 0.085 | ||
| X7 | 0.751** | 0.188 | 0.563 | 0.340 | 0.089 | 0.134 | ||
| E. moara♀ × E. tukula♂ | X1-Y | X5-Y | X7-Y | X10-Y | ||||
| X1 | 0.905** | 0.568 | 0.338 | 0.036 | 0.196 | 0.106 | ||
| X5 | 0.318** | 0.157 | 0.161 | 0.129 | 0.016 | 0.016 | ||
| X7 | 0.780** | 0.280 | 0.500 | 0.397 | 0.009 | 0.094 | ||
| X10 | 0.687** | 0.173 | 0.514 | 0.348 | 0.014 | 0.152 | ||
Table 6.
Coefficients of determination of morphological traits for body weight.
| Traits | X1 | X5 | X6 | Determination Coefficien | ||
| E. tukula | X1 | 0.449 | 0.920 | |||
| X5 | 0.029 | 0.007 | ||||
| X6 | 0.325 | 0.013 | 0.097 | |||
| E. moara | X1 | X4 | X6 | X7 | 0.870 | |
| X1 | 0.217 | |||||
| X4 | 0.077 | 0.036 | ||||
| X6 | 0.153 | 0.046 | 0.088 | |||
| X7 | 0.128 | 0.040 | 0.050 | 0.035 | ||
| E. moara♀ × E. tukula♂ | X1 | X5 | X7 | X10 | 0.901 | |
| X1 | 0.323 | |||||
| X5 | 0.040 | 0.025 | ||||
| X7 | 0.222 | 0.005 | 0.078 | |||
| X10 | 0.120 | 0.005 | 0.053 | 0.030 |
Disclaimer/Publisher’s Note: The statements, opinions and data contained in all publications are solely those of the individual author(s) and contributor(s) and not of MDPI and/or the editor(s). MDPI and/or the editor(s) disclaim responsibility for any injury to people or property resulting from any ideas, methods, instructions or products referred to in the content. |
© 2026 by the authors. Licensee MDPI, Basel, Switzerland. This article is an open access article distributed under the terms and conditions of the Creative Commons Attribution (CC BY) license.
Copyright: This open access article is published under a Creative Commons CC BY 4.0 license, which permit the free download, distribution, and reuse, provided that the author and preprint are cited in any reuse.