

Submitted:
26 September 2026
Posted:
29 September 2026
You are already at the latest version
Abstract
Soil carbon dynamics and fertility may respond differently to land-use systems in the Brazilian semiarid region due to its high environmental and edaphic heterogeneity. This study evaluated soil attributes in degraded, forest, and restoration areas across the states of Ceará (CE), Paraíba (PB), Pernambuco (PE), and Piauí (PI). Surface soil samples (0–10 cm) were analyzed for particle-size distribution, pH, total organic carbon (TOC), humic fractions, available phosphorus, exchangeable cations, and cation exchange capacity (CEC). Soil responses to land use varied markedly among states. Forest areas showed 12% and 57% higher TOC than degraded areas in PB and PI, respectively. Restoration areas showed substantial changes in specific carbon fractions; in PB, humic acid carbon was approximately 85–95% higher and humin carbon 136% higher than in the degraded area. Available phosphorus was also markedly higher in restoration areas in PB and PI. In PI, the restoration area was characterized by high Ca²⁺ and Mg²⁺ contents and CEC, whereas soil pH ranged from approximately 5.0 in the forest area to 8.0 in the degraded area. Overall, restoration areas showed improvements in specific soil attributes, although the magnitude and direction of these responses were strongly modulated by local edaphic conditions.
Keywords:
humic fractions
; cation exchange capacity
; soil quality
; Caatinga
1. Introduction
Soil performs essential functions in agricultural production and the provision of ecosystem services, including nutrient cycling, water regulation, carbon storage, and support for biodiversity [1]. These functions arise from interactions between its mineral and organic components and may be impaired by changes in land use. The conversion of native vegetation to cropland and pasture, particularly when coupled with inadequate management, can intensify erosion, compaction, organic matter loss, and fertility decline, increasing the vulnerability of soils to degradation and desertification [2,3].
These processes are particularly relevant in northeastern Brazil, a region characterized by considerable environmental heterogeneity and a mosaic of native vegetation, cropland, pasture, degraded land, and areas at different stages of restoration [4]. In the Brazilian Semiarid region, irregular rainfall, prolonged water deficits, and high temperatures may interact with human pressures to accelerate soil degradation and reduce the capacity of soils to sustain plant production and ecosystem services. Vegetation removal, overgrazing, intensive land use, and inadequate irrigation practices are among the factors that can intensify these processes [5,6,7].
The vulnerability of soils in the Brazilian Semiarid region is also shaped by their considerable pedological diversity. Differences in parent material, relief, climate, and soil-forming processes generate substantial variation in physical and chemical properties, even across relatively short distances [8]. Constraints such as shallow effective soil depth in Leptosols, marked textural contrasts in Luvisols and Planosols, and susceptibility to salinization in some alluvial soils can limit water and nutrient storage and increase sensitivity to human disturbance [9]. Accordingly, the relationships between land degradation, vegetation restoration, and soil quality must be examined in the context of both land use and the edaphic characteristics of each site.
In this context, soil organic matter (SOM) is a key component of soil quality and resilience in semiarid environments. In addition to serving as a major carbon reservoir, SOM contributes to aggregate formation and stability, water retention, cation exchange capacity, nutrient availability, and microbial activity [10,11]. Its dynamics reflect the balance between carbon inputs from plant residues, roots, and other organic materials and losses through decomposition, erosion, and related processes. Changes in soil organic carbon may therefore provide insight into differences among land-use systems and the condition of areas undergoing restoration.
Total organic carbon alone, however, may not fully capture differences in SOM composition. Chemical fractionation into fulvic acid, humic acid, and humin separates carbon into operationally defined fractions with different solubility properties, providing complementary information on its distribution within the soil [12]. Examining these fractions alongside particle-size distribution and chemical attributes may help clarify how vegetation cover, land-use history, and inherent soil properties are associated with carbon retention and nutrient availability. Because the fractions are defined by the extraction method, their concentrations should not be interpreted as direct measures of carbon persistence.
Although the relationship between land use and soil organic carbon has been widely studied, less is known about how total carbon, chemically extracted carbon fractions, and fertility attributes vary together across degraded, forest, and restoration areas under contrasting edaphic conditions in the Brazilian Semiarid region. This gap matters because soils exposed to similar climatic conditions may differ in texture, mineralogy, management history, and capacity to retain organic matter. These differences can influence the soil attributes observed at a given stage of degradation or restoration.
Therefore, this study aimed to evaluate how three land-use categories (degraded, forest, and restoration areas) are associated with variation in soil particle-size distribution, total organic carbon, humic fractions, and fertility attributes across four states in the Brazilian Semiarid region.
2. Materials and Methods
2.1. Study Areas and Soil Sampling
The study was conducted in four desertification hotspots in the semiarid region of northeastern Brazil: Irauçuba, Ceará (CE); Cariris Velhos, Paraíba (PB); Cabrobó, Pernambuco (PE); and Gilbués, Piauí (PI). Three land-use and vegetation-cover conditions were evaluated in each state: degraded area (DA), forest area (FA), and restoration area (RA). These regions are characterized by different degrees of soil degradation resulting from the interaction between inherent climatic and edaphic constraints and long-term anthropogenic pressures, particularly overgrazing, deforestation, agricultural activities, and mining.
The region is predominantly characterized by a hot semiarid climate (BSh, according to the Köppen classification), with a mean annual temperature of approximately 26 °C and marked spatial variation in annual precipitation. Irauçuba (3°44′ S, 39°46′ W; 152 m a.s.l.) receives approximately 540 mm year⁻¹, mainly from January to April, and its degradation process is strongly associated with overgrazing. Cabrobó (8°30′ S, 39°18′ W; approximately 325 m a.s.l.) receives approximately 500 mm year⁻¹ and is characterized by degradation associated with deforestation. Cariris Velhos (7°22′ S, 36°31′ W) receives approximately 400 mm year⁻¹, with degradation mainly associated with overgrazing and vegetation removal for charcoal production. In contrast, Gilbués (9°49′ S, 45°20′ W; 481 m a.s.l.) receives approximately 900 mm year⁻¹, but has undergone severe degradation associated with deforestation, agricultural expansion, livestock production, and mining. The native vegetation consists predominantly of Caatinga, including areas of seasonally dry forest, and the terrain ranges from undulating to strongly undulating.
Within each land-use condition, three 50 × 50 m plots (2500 m²) were established. A central 40 × 40 m area (1600 m²) was delimited within each plot to minimize potential edge effects.
Soil profiles were opened at different landscape positions for morphological description and soil classification. Profile description and sampling followed Santos et al. [13], and soils were classified according to the Brazilian Soil Classification System [14]. For the analyses performed in this study, disturbed soil samples were collected from the 0–10 cm layer and placed in sterile bags. Samples were transported to the Soil Laboratory of the State University of Paraíba, Lagoa Seca, PB, Brazil, for particle-size and chemical analyses and soil organic matter fractionation.
2.2. Particle-Size Analysis
Particle-size distribution was determined after chemical dispersion with 1 mol L⁻¹ NaOH, according to Teixeira et al. [15]. The sand fraction (2.000–0.053 mm) was separated by sieving, whereas the clay fraction (<0.002 mm) was determined using the pipette method. Silt content was calculated by difference between the initial sample mass and the combined masses of the sand and clay fractions. Results were expressed as g kg⁻¹ of soil.
2.3. Soil Chemical Analyses
Soil pH was determined in water. Available phosphorus and exchangeable potassium were extracted with Mehlich-1 solution (0.05 mol L⁻¹ HCl + 0.0125 mol L⁻¹ H₂SO₄). Phosphorus was determined colorimetrically, and potassium was determined by flame photometry. Exchangeable calcium, magnesium, and aluminum were extracted with 1 mol L⁻¹ KCl. Calcium and magnesium were determined by atomic absorption spectrometry, and aluminum was determined by titration, according to Teixeira et al. [15].
Effective cation exchange capacity (effective CEC, t), representing cation exchange capacity under the prevailing soil pH conditions, was calculated as the sum of exchangeable bases and exchangeable aluminum:
t = Ca2+ + Mg2+ +K+ + Al3+
All cation concentrations were converted to the same unit before calculation.
2.4. Total Organic Carbon and Soil Organic Matter Fractionation
Soil total organic carbon was determined by wet oxidation with potassium dichromate.
Soil organic matter was chemically fractionated according to Benites et al. [16], based on the differential solubility of humic fractions under alkaline and acidic conditions. Fulvic acid, humic acid, and humin fractions were obtained. Their respective carbon contents are referred to as fulvic acid carbon (FAC), humic acid carbon (HAC), and humin carbon (HC).
For extraction, 1.0 g of air-dried, sieved soil was mixed with 0.1 mol L⁻¹ NaOH and maintained in contact with the solution for 24 h. The alkaline extract was then separated from the insoluble residue by centrifugation at 5000 × g for 30 min. The residue, corresponding to the humin fraction, was dried at 45 °C before carbon determination.
The pH of the alkaline extract was adjusted to 1–2 with 20% H₂SO₄ to precipitate the humic acid fraction. After centrifugation, the supernatant, corresponding to the fulvic acid fraction, was separated from the humic acid precipitate. The fractions were transferred to 50 mL tubes, and their volumes were adjusted with distilled water. Carbon in each fraction was determined by wet oxidation with potassium dichromate.
2.5. Statistical Analysis
For statistical analysis, the study was considered as a 4 × 3 factorial arrangement, comprising four desertification hotspots (CE, PB, PE, and PI) and three land-use systems (DA, FA, and RA), with four replicates per combination. Residual normality and homogeneity of variances were assessed before analysis of variance (ANOVA). When significant effects were detected (p ≤ 0.05), means were compared using Tukey’s test at the 5% significance level. All statistical analyses were performed using R software, version 4.5.1.
3. Results
3.1. Soil Particle-Size Distribution
ANOVA revealed a significant interaction between Brazilian state and land-use system for all variables evaluated, indicating that the effects associated with degraded, forest, and restoration conditions depended on the edaphic context of each state.
The distribution of soil particle-size fractions differed among land-use systems and Brazilian states (Figure 1). Overall, the soils were predominantly characterized by a high sand content, although the magnitude of the differences among degraded, forest, and restoration areas varied across states.
In Ceará, the highest sand contents were observed in DA and FA, which did not differ significantly from each other, whereas RA exhibited a lower sand content (Figure 1a). In Paraíba, FA had a higher sand content than DA, while RA showed an intermediate value. In Pernambuco, RA exhibited the highest sand content, followed by DA, whereas FA had the lowest value. The most pronounced contrast was observed in Piauí, where FA exhibited a high sand content, whereas RA showed a substantially lower value.
Silt content also responded differently to land-use systems across states (Figure 1b). In Ceará, RA exhibited a higher silt content than DA and FA, which did not differ significantly from each other. In Paraíba, the highest silt content was recorded in DA. In Pernambuco, DA and FA exhibited higher silt contents than RA. In contrast, in Piauí, RA had the highest silt content, followed by DA, whereas FA exhibited the lowest value.
Clay distribution showed a pattern generally opposite to that observed for sand (Figure 1c). In Piauí, RA exhibited the highest clay content, contrasting with the high sand content observed in FA. In Pernambuco, FA had a higher clay content than DA. In Paraíba, no significant differences in clay content were detected among land-use systems, whereas in Ceará, DA exhibited a lower clay content than FA and RA, which did not differ significantly from each other.
3.2. Soil pH
Soil pH also responded differently to land-use systems across states (Figure 2). In Ceará, DA exhibited the highest pH (6.2), followed by FA (5.8) and RA (5.5), with significant differences among the three land-use systems. In Paraíba, pH values remained close to neutral, ranging from 7.0 to 7.2; RA exhibited the highest pH, FA the lowest, and DA an intermediate value. In Pernambuco, FA showed the highest pH (7.4), whereas DA and RA, with values close to 6.9, did not differ significantly from each other. The most pronounced contrast was observed in Piauí, where DA exhibited a pH of 8.0, followed by RA (7.5), whereas FA had a markedly lower value of 5.1. Thus, Piauí exhibited both the greatest variation in soil pH among land-use systems and the most extreme pH values across all areas evaluated.
3.3. Total Organic Carbon and Humic Fractions
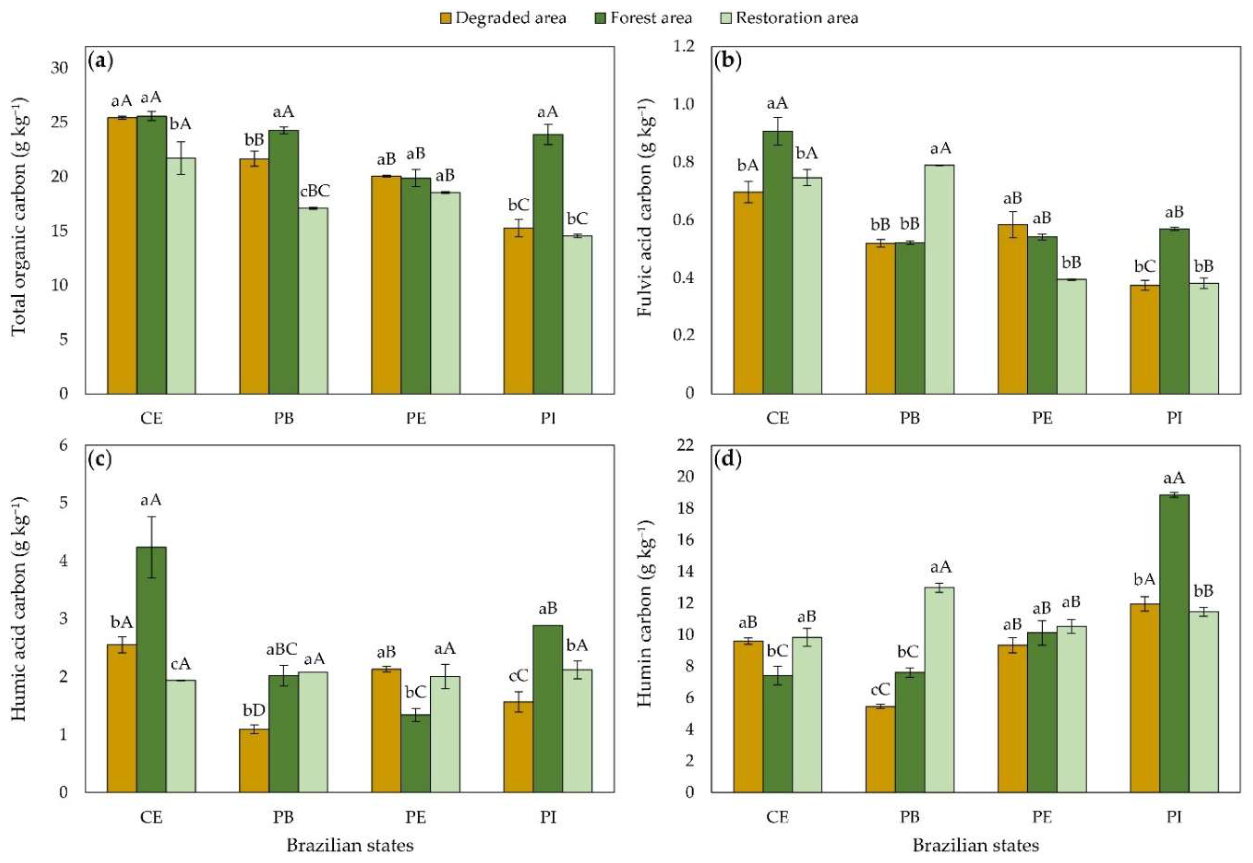
Total organic carbon (TOC) was significantly influenced by the interaction between state and land-use system (Figure 3a). In Paraíba and Piauí, the highest TOC contents were observed in FA. In Paraíba, TOC in FA was 12% higher than that recorded in DA, whereas in Piauí, this difference reached 57%. In Ceará, FA exhibited the highest absolute TOC value, although it did not differ significantly from DA. In Pernambuco, no significant differences were observed among land-use systems. Overall, RA exhibited intermediate or lower TOC contents than FA, with differences ranging from 10% to 35%, depending on the state.
Carbon associated with the fulvic acid fraction (FAC) also showed state-dependent responses (Figure 3b). In Ceará, FA exhibited the highest FAC content, 30% higher than that in DA, whereas RA showed an intermediate value. In Paraíba, RA exhibited the highest FAC content, 50% higher than those observed in DA and FA, which did not differ significantly from each other. In Pernambuco, DA and FA showed the highest FAC contents, whereas RA exhibited a reduction of 30% compared with DA. In Piauí, FA had the highest FAC content, exceeding those of DA and RA by 50%, with no significant difference between the latter two land-use systems.
For carbon associated with the humic acid fraction (HAC), FA exhibited the highest values in Ceará and Piauí (Figure 3c). In Ceará, HAC content in FA was 65% higher than that in DA and 120% higher than that in RA. In Paraíba, DA exhibited the lowest HAC content, whereas FA and RA showed similar values, with increases of 85–95% compared with DA. In Pernambuco, a contrasting pattern was observed, with higher HAC contents in DA and RA; in RA, HAC was 50% higher than that observed in FA. In Piauí, FA exhibited HAC contents 80% and 35% higher than those in DA and RA, respectively.
Humin carbon (HC) showed patterns distinct from those observed for FAC and HAC (Figure 3d). In Ceará, DA and RA exhibited the highest HC contents, 9.6 and 9.9 g kg⁻¹, respectively, whereas FA showed 7.4 g kg⁻¹. In Paraíba, RA exhibited the highest HC content (13.0 g kg⁻¹), representing increases of 71% and 136% compared with FA and DA, respectively. In Pernambuco, differences among land-use systems were less pronounced, with HC contents of 9.4, 10.1, and 10.6 g kg⁻¹ in DA, FA, and RA, respectively. In Piauí, FA exhibited the highest HC content (18.9 g kg⁻¹), 58% higher than that in DA (12.0 g kg⁻¹) and 64% higher than that in RA (11.5 g kg⁻¹).
Figure 3.
Total organic carbon (a), fulvic acid carbon (b), humic acid carbon (c), and humin carbon (d) contents in soils under different land-use systems across different states of Northeastern Brazil. CE, Ceará; PB, Paraíba; PE, Pernambuco; PI, Piauí. Lowercase letters compare land-use systems within each state, whereas uppercase letters compare states within each land-use system according to Tukey’s test (p ≤ 0.05). Error bars represent the standard error of the mean (n = 4).
Figure 3.
Total organic carbon (a), fulvic acid carbon (b), humic acid carbon (c), and humin carbon (d) contents in soils under different land-use systems across different states of Northeastern Brazil. CE, Ceará; PB, Paraíba; PE, Pernambuco; PI, Piauí. Lowercase letters compare land-use systems within each state, whereas uppercase letters compare states within each land-use system according to Tukey’s test (p ≤ 0.05). Error bars represent the standard error of the mean (n = 4).
3.4. Soil Chemical Properties
Available phosphorus content varied widely among states and land-use systems (Figure 4a). In Ceará, FA exhibited a P content 113% higher than that observed in DA, whereas RA showed an increase of 90% compared with DA. In Paraíba, P content in RA was approximately 1400% higher than that observed in FA. In Pernambuco, RA also exhibited the highest P content, with an increase of 120% compared with DA, whereas FA showed an intermediate value. In Piauí, the difference was even more pronounced, with P content in RA exceeding that in FA by more than 6000%.
Exchangeable K⁺ content showed contrasting patterns among states (Figure 4b). In Ceará and Pernambuco, FA exhibited the highest K⁺ contents, differing significantly from DA and RA. In Paraíba, FA also showed the highest K⁺ content, followed by RA and DA. In contrast, in Piauí, DA exhibited the highest K⁺ content, exceeding those observed in FA and RA.
For exchangeable Ca²⁺, no significant differences among land-use systems were observed in Ceará (Figure 4c). In Paraíba, FA exhibited a higher Ca²⁺ content than DA and RA, which did not differ significantly from each other. In Pernambuco, FA and DA did not differ significantly from each other and showed higher Ca²⁺ contents than RA. The highest absolute Ca²⁺ contents across all states were recorded in Piauí, particularly in RA, followed by DA, whereas FA exhibited the lowest value.
Figure 4.
P (a), K+ (b), Ca2+ (c), and Mg2+ (d) contents in soils under different land-use systems across different states of Northeastern Brazil. CE, Ceará; PB, Paraíba; PE, Pernambuco; PI, Piauí. Lowercase letters compare land-use systems within each state, whereas uppercase letters compare states within each land-use system according to Tukey’s test (p ≤ 0.05). Error bars represent the standard error of the mean (n = 4).
Figure 4.
P (a), K+ (b), Ca2+ (c), and Mg2+ (d) contents in soils under different land-use systems across different states of Northeastern Brazil. CE, Ceará; PB, Paraíba; PE, Pernambuco; PI, Piauí. Lowercase letters compare land-use systems within each state, whereas uppercase letters compare states within each land-use system according to Tukey’s test (p ≤ 0.05). Error bars represent the standard error of the mean (n = 4).
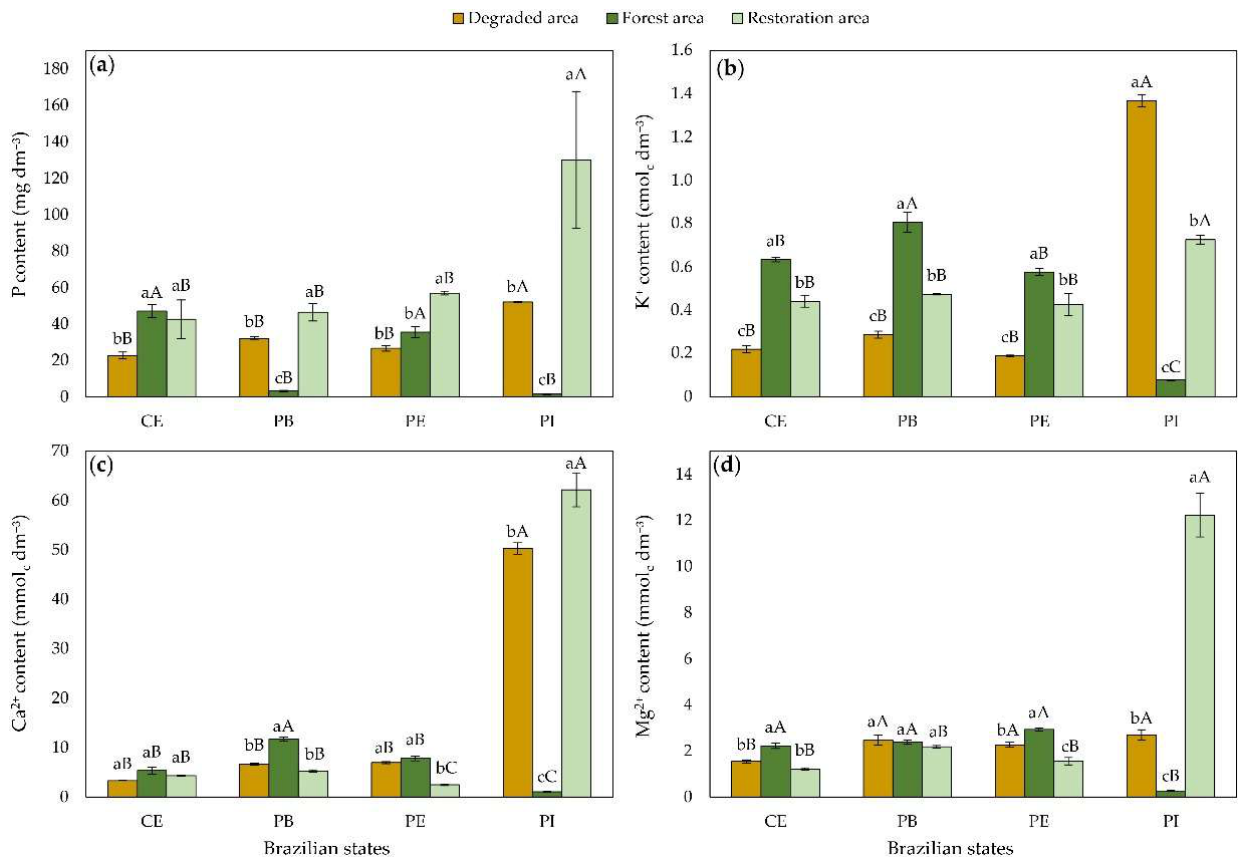
Exchangeable Mg²⁺ content was also affected by the interaction between state and land-use system (Figure 4d). In Ceará, FA exhibited a higher Mg²⁺ content than DA and RA. In Paraíba, no significant differences in Mg²⁺ content were observed among land-use systems. In Pernambuco, FA exhibited the highest Mg²⁺ content, whereas RA showed the lowest. In Piauí, RA exhibited a substantially higher Mg²⁺ content than those observed in DA and FA.
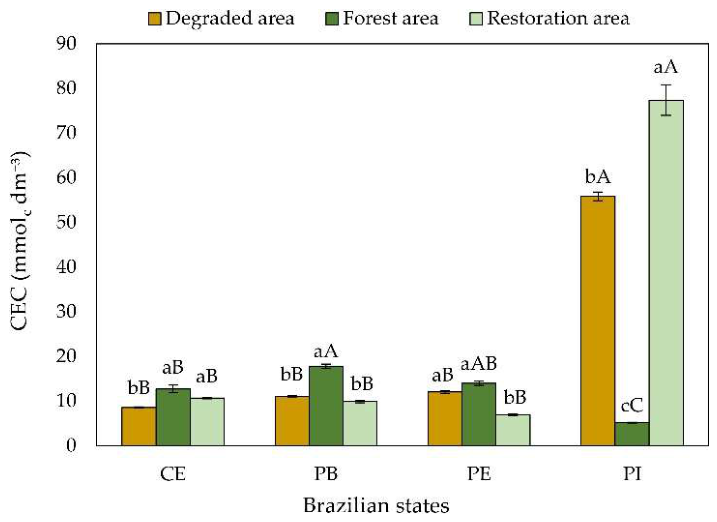
Cation exchange capacity (CEC) varied widely among states and land-use systems (Figure 5). In Ceará, CEC values were relatively low and similar among land-use systems, with the highest value observed in FA and the lowest in DA. In Paraíba, FA exhibited a higher CEC than DA and RA. In Pernambuco, DA and FA did not differ significantly and exhibited higher CEC values than RA.
4. Discussion
4.1. Particle-Size Distribution, Soil pH, and Edaphic Heterogeneity
The significant interaction between state and land-use system indicates that differences among degraded, forest, and restoration areas cannot be interpreted independently of the pedogenetic context of each region. Although differences in particle-size distribution were detected among land-use systems (Figure 1), soil texture is a relatively stable property primarily determined by parent material, pedogenic processes, and landscape position [17,18]. Therefore, the contrasts observed among DA, FA, and RA likely reflect not only land-use history but also the inherent spatial heterogeneity of the studied areas.
The predominance of the sand fraction (Figure 1a), particularly in Ceará and in some areas of Piauí, is consistent with the occurrence of sandy- to medium-textured soils in different regions of Northeastern Brazil [14]. A high proportion of sand may limit water and nutrient retention and reduce the physicochemical protection of soil organic matter, potentially increasing soil vulnerability to the effects of vegetation-cover removal.
Nevertheless, land management and degradation processes can modify the distribution of soil particles in the surface layer through selective erosion, sediment transport, and deposition. Vegetation-cover removal increases soil exposure to raindrop impact and surface runoff, promoting particle mobilization, particularly of the finer fractions [19]. In this context, differences in silt (Figure 1b) and clay (Figure 1c) contents among land-use systems may reflect both pre-existing edaphic characteristics and the cumulative effects of erosional processes.
The contrast observed in Piauí is particularly noteworthy. The high proportion of sand in FA coincided with lower silt and clay contents, whereas RA showed the opposite pattern (Figure 1). This relationship indicates that differences among land-use systems should not be attributed exclusively to ecological restoration, as vegetation recovery would not be expected to substantially alter soil particle-size distribution over a short period. Instead, differences in parent material, topographic position, sediment deposition, and erosion history are more likely to contribute to this pattern [17,18].
Differences in soil pH further highlight the combined influence of intrinsic soil properties and land-use history. Whereas soils in Paraíba and Pernambuco generally exhibited pH values close to neutrality, Piauí showed the greatest contrast, with pH values of approximately 5.0 in FA and 8.0 in DA (Figure 2). This wide range indicates that the current land-use system alone is insufficient to explain soil reaction, as soil pH reflects the combined influence of parent material, mineral weathering, base-cation leaching, and the composition of the soil exchange complex, as well as past management practices such as fertilization and liming [20,21].
In forest environments, acidification of the surface soil layer may be associated with the production of organic acids during litter decomposition, differential uptake of cations and anions by plants, and leaching of base cátions [22,23]. Conversely, higher soil pH values may reflect greater abundance of Ca²⁺, Mg²⁺, and other base cations in the exchange complex, as well as potential residual effects of previous management practices. Therefore, the pronounced pH contrast between FA and DA in Piauí (Figure 2) should be interpreted in conjunction with the other soil chemical attributes rather than simply as a consequence of soil degradation.
This interpretation is further supported by the high Ca²⁺ (Figure 4c) and Mg²⁺ (Figure 4d) contents and CEC (Figure 5) values observed mainly in RA and/or DA in Piauí, in contrast to FA. The concurrence of higher pH and greater abundance of exchangeable bases suggests substantial differences in the composition of the soil exchange complex among these areas. At the same time, the forest area in Piauí exhibited higher TOC (Figure 3a), demonstrating that greater soil organic carbon accumulation did not necessarily correspond to higher pH or greater concentrations of exchangeable bases.
From a functional perspective, variation in soil pH can alter nutrient availability and the surface charge of soil constituents, while also influencing microbial activity and organic matter decomposition and mineralization processes [24,25]. In soils dominated by pH-dependent charges, changes in soil reaction can modify CEC and, consequently, cation retention. Therefore, part of the variation in soil fertility observed among states and land-use systems should be interpreted by considering the combined effects of soil pH, particle-size distribution, mineralogy, and organic matter.
4.2. Organic Carbon and Humic Fractions as Indicators of Land-Use Changes
The higher TOC contents observed under forest in Paraíba and Piauí (Figure 3a) highlight the importance of continuous vegetation cover for maintaining soil organic carbon. Forest ecosystems provide a continuous input of litter, roots, and rhizodeposits, while reduced physical disturbance favors carbon protection within soil aggregates and its association with the mineral matrix [26,27,28]. The 12% and 57% differences between FA and DA in Paraíba and Piauí, respectively, indicate that the conversion or degradation of vegetation cover may be associated with substantial carbon losses in these environments.
However, the absence of significant differences in TOC among land-use systems in Ceará and Pernambuco (Figure 3a) indicates that soil carbon responses to land use were not consistent across states. In addition to the amount of organic residues incorporated into the soil, TOC dynamics depend on interactions among soil texture, mineralogy, moisture and temperature conditions, microbial activity, and the history of land use and soil disturbance [29,30]. Sandy soils, in particular, generally have a lower capacity for organo-mineral protection of carbon and may therefore respond more slowly to vegetation restoration or exhibit greater susceptibility to mineralization and organic matter losses [31,32,33].
The fact that RA still exhibited lower TOC contents than FA under different conditions (Figure 3a) is consistent with the gradual nature of soil carbon stock recovery. Vegetation restoration progressively re-establishes organic residue inputs and the conditions required for carbon stabilization; however, the recovery of carbon to levels comparable to those of reference ecosystems may require extended periods. Evidence from different restoration systems indicates that soil organic carbon progressively increases with restoration time, although the magnitude and rate of this process are strongly dependent on environmental conditions and restoration strategies [34].
Humic fractions provided additional information beyond that obtained from TOC, revealing qualitative changes in carbon distribution among operationally defined pools. FAC showed variable responses among states (Figure 3b). The higher values observed in FA in Ceará and Piauí are consistent with continuous organic matter inputs and the production of soluble organic compounds during litter decomposition [35,36]. In Paraíba, however, the higher FAC content in RA suggests that the restoration process may have promoted carbon incorporation into operationally more soluble fractions before corresponding changes became detectable in TOC.
This interpretation is consistent with the greater sensitivity of certain soil organic matter fractions to recent changes in management. Fulvic acids are more soluble and generally exhibit weaker structural associations with the mineral matrix than more persistent organic matter fractions, allowing them to respond relatively rapidly to changes in organic residue inputs and transformation processes [37]. However, the lower FAC content observed in RA in Pernambuco (Figure 3b) indicates that this response is not necessarily linear. In this case, differences in soil texture, organic residue inputs, and the mobility of soluble organic compounds may contribute to the observed pattern, particularly in soils with a greater proportion of sand [38].
HAC showed a more consistent response associated with the maintenance or recovery of humified forms of soil organic carbon (Figure 3c). In Ceará and Piauí, the higher HAC contents observed in FA coincided with continuous vegetation cover, where diverse organic residue inputs and the absence of intensive disturbance favor organic matter transformation and stabilization [39,40,41]. In Paraíba, the similarity between FA and RA, both of which exhibited substantially higher HAC contents than DA, is particularly noteworthy, suggesting that restoration may already have promoted detectable changes in carbon distribution among humic fractions even before the complete recovery of TOC.
This response becomes even more evident when HAC and HC are considered together in Paraíba. Although RA did not exhibit the highest TOC content, its HAC content (Figure 3c) was 85–95% higher than that in DA, while HC was 136% Higher (Figure 3d). These findings indicate that attributes related to carbon distribution and stabilization may respond to restoration before comparable changes become evident in total soil organic carbon, highlighting the potential of humic fractions as sensitive indicators of changes in organic matter quality during restoration.
The response of the humin fraction further supports this interpretation while also highlighting the importance of intrinsic soil properties. Because humin is operationally defined as the fraction insoluble during the extraction procedure and is strongly associated with the soil mineral phase, it tends to represent a more persistent pool of organic carbon [42]. The high HC content (Figure 3d) in RA in Paraíba, together with the increase in HAC (Figure 3c), suggests a greater contribution of stabilized carbon forms in this area. In contrast, in Piauí, FA exhibited substantially higher HC contents than DA and RA, coinciding with higher TOC, FAC, and HAC contents (Figure 3). Thus, in this state, the forest area was characterized not only by a greater amount of soil organic carbon but also by a greater representation of the different humic fractions.
Associations between organic matter and soil minerals represent an important mechanism controlling soil carbon persistence, as they reduce its accessibility to decomposers and may increase its residence time in the soil [43,44]. However, the contrasting patterns observed among states demonstrate that the distribution of FAC, HAC, and HC should not be interpreted as a simple temporal sequence involving the transformation of “labile” fractions into humin. Instead, the observed differences result from interactions among the quantity and quality of organic residues, microbial activity, soil texture and mineralogy, climatic conditions, and land-use history [45,46]. In this context, chemical fractionation complements TOC measurements by revealing changes in the operational distribution of soil organic carbon that would not be detected by considering total carbon content alone.
4.3. Nutrient Availability and Cation Exchange Capacity
Soil chemical attributes were strongly influenced by the interaction between land-use system and state, demonstrating that the effects associated with degradation and restoration on soil fertility were conditioned by local edaphic characteristics. This dependence was particularly evident for P (Figure 4a), for which differences among land-use systems reached approximately 1400% in Paraíba and more than 6000% in Piauí.
Under forest conditions, the maintenance of available P may be favored by biogeochemical cycling, whereby plant uptake, litter deposition, decomposition, and mineralization continuously redistribute the nutrient between vegetation and soil [47,48]. This mechanism may contribute to explaining the higher P contents observed in FA in Ceará (Figure 4a).
However, the exceptionally high P contents observed in RA in Paraíba and Piauí (Figure 4a) are unlikely to be attributable solely to the natural process of vegetation recovery. These results are more consistent with the influence of previous land management, including possible legacy effects of mineral or organic fertilization. Phosphorus has low mobility within the soil profile and is strongly retained by soil mineral phases, allowing previous applications to exert prolonged residual effects [49,50]. Thus, P provides a particularly clear example of how the current chemical status of the soil may preserve signatures of previous land uses rather than exclusively reflecting the current vegetation condition.
The pattern observed for K⁺ was more consistently associated with forest cover, as FA exhibited the highest contents in three of the four states (Figure 4b). Unlike nutrients predominantly incorporated into complex organic structures, K remains largely in ionic form within plant tissues and can be rapidly released following residue senescence and decomposition [51,52]. Therefore, continuous litter inputs and the biological redistribution of K from subsurface to surface soil layers may favor its maintenance in forest soils [53].
The higher K⁺ content in DA in Piauí (Figure 4b), however, further demonstrates the importance of edaphic characteristics and land-use history. Potassium retention is strongly dependent on soil mineralogy, CEC, and the presence of minerals capable of supplying or retaining this cation. Therefore, high K⁺ contents in degraded areas do not necessarily indicate improved biogeochemical functioning but may instead reflect differences in parent material or inputs resulting from previous management practices [54].
The patterns observed for Ca²⁺ (Figure 4c) and Mg²⁺ (Figure 4d) followed a similar trend. The greater availability of these cations in FA in some states may be associated with vegetation-mediated nutrient cycling, particularly through the return of base cations to the soil via litterfall [55,56]. However, the high Ca²⁺ and Mg²⁺ contents observed in RA in Piauí, together with the high CEC (Figure 5) and near-neutral to slightly alkaline pH in the same area, indicate strong control by intrinsic soil properties and previous land management.
Ca²⁺ and Mg²⁺ are components of the soil exchange complex, and their retention depends on the amount and nature of surface charges associated with soil organic matter and clay minerals [57,58,59]. Thus, mineralogical and textural differences may explain a substantial proportion of the variability among states, particularly in Piauí, where RA simultaneously exhibited a greater proportion of fine soil particles, high Ca²⁺ and Mg²⁺ contents, high pH, and high CEC.
This relationship becomes more evident when CEC is considered together with particle-size distribution, soil pH, and organic carbon. The higher CEC observed in FA in Paraíba and Pernambuco (Figure 5) may be associated with the combined contribution of reactive mineral fractions and soil organic matter to soil surface charge. Soil organic matter has a high density of pH-dependent charges and can contribute substantially to the CEC of tropical soils, particularly when the mineral fraction is dominated by low-activity minerals [60,61]. Consequently, organic matter losses resulting from soil degradation may reduce not only soil carbon stocks but also the capacity of the soil to retain nutrient cations [62].
In Piauí, however, DA and particularly RA exhibited substantially higher CEC than FA (Figure 5). This pattern coincided with marked differences in particle-size distribution and soil chemical properties: RA had a lower sand content and greater proportions of fine particles, whereas FA was characterized by a high proportion of sand. In addition, DA and RA exhibited substantially higher pH values than FA. In variable-charge soils, increasing pH promotes the deprotonation of functional groups associated with soil organic matter and mineral surfaces, thereby increasing negative surface charge density and, consequently, cation retention capacity [63,64]. Thus, the combination of a greater proportion of fine particles, higher pH, and mineralogical differences provides a more consistent explanation for the high CEC observed in DA and RA in Piauí than organic matter content alone.
This interpretation is further supported by the fact that FA in Piauí exhibited the highest TOC, FAC, HAC, and HC contents while simultaneously showing the lowest pH and a lower CEC than DA and RA. Therefore, soil organic carbon content alone did not determine cation retention capacity in this environment. The decoupling between higher TOC under forest and higher CEC in degraded and restoration areas represents one of the most relevant findings of this study, highlighting the need to jointly consider soil organic matter, texture, pH, and mineralogy when assessing soil fertility in the Brazilian semiarid region.
5. Conclusions
The results demonstrate that the effects of land-use systems on soil quality in the Brazilian semiarid region are strongly influenced by regional edaphic conditions. Forest areas were generally associated with the maintenance of total organic carbon, specific humic fractions, and nutrient availability, particularly K⁺, highlighting the importance of vegetation cover and biogeochemical cycling for soil quality conservation. Restoration areas also showed evidence of recovery in soil organic matter-related attributes, particularly in Paraíba, where humic acid and humin carbon contents were higher than those observed in the degraded area.
However, the contrasting responses of soil pH, P, Ca²⁺, Mg²⁺, and CEC among states demonstrate that the effects associated with vegetation recovery are modulated by soil texture, pedogenetic characteristics, and land-use history. Therefore, soil quality recovery did not follow a uniform trajectory among degraded, restoration, and forest areas, indicating that its assessment should integrate multiple physical and chemical attributes. The combined evaluation of soil particle-size distribution, pH, total organic carbon, humic fractions, nutrient availability, and CEC provided a more comprehensive understanding of soil responses to different land-use conditions.
Future studies should include long-term monitoring of restoration areas and incorporate physical and biological indicators, as well as information on soil mineralogy, carbon stocks at different soil depths, and management history. Such an integrated approach may allow a more accurate distinction between restoration effects and those resulting from intrinsic soil properties and contribute to the establishment of region-specific indicators for assessing soil quality recovery in the Brazilian semiarid region.
Author Contributions
Conceptualization, J.A.D., J.F.d.B.N. and R.F.P.; methodology, J.A.D., J.F.d.B.N., C.d.S.S., F.S.d.A., V.V.L.d.A., A.C.A.d.S., R.S.M., E.F.d.M., W.E.P., E.d.C.C. and R.F.P.; validation, J.F.d.B.N. and R.F.P.; formal analysis, W.E.P., E.F.d.M. and R.F.P.; investigation, J.A.D., J.F.d.B.N., C.d.S.S., F.S.d.A., V.V.L.d.A., A.C.A.d.S., R.S.M., E.F.d.M., W.E.P., E.d.C.C. and R.F.P.; resources, J.F.d.B.N.; data curation, J.F.d.B.N. and R.F.P.; writing—original draft preparation, J.A.D. and R.F.P.; writing—review and editing, J.F.d.B.N., C.d.S.S., F.S.d.A., V.V.L.d.A., A.C.A.d.S., R.S.M., E.F.d.M., W.E.P. and E.d.C.C.; visualization, R.F.P.; supervision, J.F.d.B.N. and R.F.P.; project administration, J.F.d.B.N.; funding acquisition, J.F.d.B.N. All authors have read and agreed to the published version of the manuscript.
Funding
This research received no external funding.
Data Availability Statement
The dataset is available upon request from the authors. The data are not publicly available due to privacy restrictions.
Conflicts of Interest
The authors declare no conflicts of interest.:
Abbreviations
The following abbreviations are used in this manuscript:
| CE | Ceará |
| PB | Paraíba |
| PE | Pernambuco |
| PI | Piauí |
| TOC | Total organic carbon |
| CEC | Exchange capacity |
| SOM | Soil organic matter |
| DA | Degraded Area |
| FA | Forest Area |
| RA | Restoration Area |
| FAC | Fulvic acid carbon |
| HAC | Humic acid carbon |
| HC | Humin carbon |
| ANOVA | Analysis of Variance |
References
- Veldkamp, E.; Schmidt, M.; Markwitz, C.; Beule, L.; Beuschel, R.; Biertümpfel, A.; Bischel, X.; Duan, X.; Gerjets, R.; Göbel, L.; et al. Multifunctionality of temperate alley-cropping agroforestry outperforms open cropland and grassland. Commun. Earth Environ. 2023, 4, 20. [CrossRef]
- Wall, D.H.; Bardgett, R.D.; Behan-Pelletier, V.; Herrick, J.E.; Jones, T.H.; Ritz, K.; Six, J.; Strong, D.R.; van der Putten, W.H., Eds. Soil Ecology and Ecosystem Services; Oxford University Press: Oxford, UK, 2012.
- Oliveira, M.L.; dos Santos, C.A.C.; de Oliveira, G.; Perez-Marin, A.M.; Santos, C.A.G. Effects of human-induced land degradation on water and carbon fluxes in two different Brazilian dryland soil covers. Sci. Total Environ. 2021, 792, 148458. [CrossRef]
- Fernandes, M.F.; Cardoso, D.; Pennington, R.T.; de Queiroz, L.P. The origins and historical assembly of the Brazilian Caatinga seasonally dry tropical forests. Front. Ecol. Evol. 2022, 10, 723286. [CrossRef]
- Centro de Gestão e Estudos Estratégicos (CGEE). Desertificação, Degradação da Terra e Secas no Brasil; CGEE: Brasília, Brazil, 2016; 252p.
- Giongo, V.; Silva, D.J.; Salviano, A.M.; Cunha, T.J.F.; de Figueiredo, M.C.B. Desenhos de Agroecossistemas Multifuncionais para o Cultivo de Frutícolas Irrigadas no Semiárido; Comunicado Técnico 182; Embrapa Semiárido: Petrolina, Brazil, 2021; 17p.
- Silva, M.L.O.; Lopes, K.P.; Leite, M.I.A.; Campos, K.W.N.; Soares, A.K.F. Áreas degradadas no Semiárido: Causas, situação e alternativas de recuperação. In Ciências Rurais em Foco; Redin, E., Ed.; Editora Poisson: Belo Horizonte, Brazil, 2021; Volume 3, pp. 22–37. [CrossRef]
- Souza, H.A. de; Leite, L.F.C.; Medeiros, J.C., Eds. Solos Sustentáveis para a Agricultura no Nordeste; Embrapa: Brasília, Brazil, 2021; 595 pp.
- Macedo, R.S.; Beirigo, R.M.; Medeiros, B.M.; Felix, V.J.L.; Souza, R.F.S.; de Bakker, A.P. Processos pedogenéticos e susceptibilidade dos solos à degradação no semiárido brasileiro. Caminhos Geogr. 2021, 22, 176–195. [CrossRef]
- Loss, A.; Pereira, M.G.; Schultz, N.; dos Anjos, L.H.C.; da Silva, E.M.R. Frações orgânicas e índice de manejo de carbono do solo em diferentes sistemas de produção orgânica. Idesia 2011, 29, 11–19. [CrossRef]
- Bünemann, E.K.; Bongiorno, G.; Bai, Z.; Creamer, R.E.; de Deyn, G.; de Goede, R.; Fleskens, L.; Geissen, V.; Kuyper, T.W.; Mäder, P.; Pulleman, M.; Sukkel, W.; van Groenigen, J.W.; Brussaard, L. Soil quality—A critical review. Soil Biol. Biochem. 2018, 120, 105–125. [CrossRef]
- Silva, I. R.; Mendonça, E. S. Matéria orgânica do solo. In: NOVAIS, R.F. et al. (Ed.). Fertilidade do solo. Viçosa: Sociedade Brasileira de Ciência do Solo, 2007. p. 275-374.
- Santos, R.D. dos; Santos, H.G. dos; Ker, J.C.; Anjos, L.H.C. dos; Shimizu, S.H. Manual de Descrição e Coleta de Solo no Campo, 7th ed.; Sociedade Brasileira de Ciência do Solo: Viçosa, Brazil, 2015.
- Santos, H.G. dos; Jacomine, P.K.T.; Anjos, L.H.C. dos; Oliveira, V.A. de; Lumbreras, J.F.; Coelho, M.R.; Almeida, J.A. de; Araujo Filho, J.C. de; Oliveira, J.B. de; Cunha, T.J.F. Sistema Brasileiro de Classificação de Solos, 5th ed.; Embrapa: Brasília, Brazil, 2018; 356 pp.
- Teixeira, P.C.; Donagemma, G.K.; Fontana, A.; Teixeira, W.G., Eds. Manual de Métodos de Análise de Solo, 3rd ed.; Embrapa: Brasília, Brazil, 2017; 574 pp.
- Benites, V. de M.; Madari, B.E.; Machado, P.L.O. de A. Extração e Fracionamento Quantitativo de Substâncias Húmicas do Solo: Um Procedimento Simplificado de Baixo Custo; Comunicado Técnico 16; Embrapa Solos: Rio de Janeiro, Brazil, 2003; 7 pp.
- Lepsch, I.F. Formação e conservação dos solos. 2nd ed. São Paulo: Oficina de Textos, 2010. 216 p. ISBN 978-85-7975-008-3.
- Silva, W.T.M.; Alves, F.J.B.; Leonardo, F.A.P.; Santos, R.V.; Farias Júnior, J.A. Levantamento da textura do solo e da relação silte/argila em regiões semiáridas do Nordeste. Agropecuária Científica no Semiárido 2018, 14, 266–272. [CrossRef]
- Bertoni, J.; Lombardi Neto, F. Conservação do Solo, 9th ed.; Ícone: São Paulo, Brazil, 2014.
- Slessarev, E.W.; Lin, Y.; Bingham, N.L.; Johnson, J.E.; Dai, Y.; Schimel, J.P.; Chadwick, O.A. Water balance creates a threshold in soil pH at the global scale. Nature 2016, 540, 567–569. [CrossRef]
- Xu, D.; Carswell, A.; Zhu, Q.; Zhang, F.; de Vries, W. Modelling long-term impacts of fertilization and liming on soil acidification at Rothamsted experimental station. Sci. Total Environ. 2020, 713, 136249. [CrossRef]
- Fujii, K. Soil acidification and adaptations of plants and microorganisms in Bornean tropical forests. Ecol. Res. 2014, 29, 371–381. [CrossRef]
- Dijkstra, F.A.; Geibe, C.; Holmström, S.; Lundström, U.S.; van Breemen, N. The effect of organic acids on base cation leaching from the forest floor under six North American tree species. Eur. J. Soil Sci. 2001, 52, 205–214. [CrossRef]
- Barrow, N.J.; Hartemink, A.E. The effects of pH on nutrient availability depend on both soils and plants. Plant Soil 2023, 487, 21–37. [CrossRef]
- Malik, A.A.; Puissant, J.; Buckeridge, K.M.; Goodall, T.; Jehmlich, N.; Chowdhury, S.; Gweon, H.S.; Peyton, J.M.; Mason, K.E.; van Agtmaal, M.; Blaud, A.; Clark, I.M.; Whitaker, J.; Pywell, R.F.; Ostle, N.; Gleixner, G.; Griffiths, R.I. Land use driven change in soil pH affects microbial carbon cycling processes. Nat. Commun. 2018, 9, 3591. [CrossRef]
- Six, J.; Conant, R.T.; Paul, E.A.; Paustian, K. Stabilization mechanisms of soil organic matter: Implications for C-saturation of soils. Plant Soil 2002, 241, 155–176. [CrossRef]
- Lyu, M.; Noormets, A.; Ukonmaanaho, L.; Li, Y.; Yang, Y.; Xie, J. Stability of soil organic carbon during forest conversion is more sensitive in deep soil than in topsoil in subtropical forests. Pedobiologia 2021, 84, 150706. [CrossRef]
- Han, Z.; Wu, X.; Gao, H.; Jia, A.; Gao, Q. Long-term conservation tillage increases soil organic carbon stability by modulating microbial nutrient limitations and aggregate protection. Agronomy 2025, 15, 1571. [CrossRef]
- Zinn, Y.L.; Lal, R.; Bigham, J.M.; Resck, D.V.S. Edaphic controls on soil organic carbon retention in the Brazilian Cerrado: Texture and mineralogy. Soil Sci. Soc. Am. J. 2007, 71, 1204–1214. [CrossRef]
- Schmidt, M.W.I.; Torn, M.S.; Abiven, S.; Dittmar, T.; Guggenberger, G.; Janssens, I.A.; Kleber, M.; Kögel-Knabner, I.; Lehmann, J.; Manning, D.A.C.; Nannipieri, P.; Rasse, D.P.; Weiner, S.; Trumbore, S.E. Persistence of soil organic matter as an ecosystem property. Nature 2011, 478, 49–56. [CrossRef]
- Fang, X.; Zhu, Y.-L.; Liu, J.-D.; Lin, X.-P.; Sun, H.-Z.; Tang, X.-H.; Hu, Y.-L.; Huang, Y.-P.; Yi, Z.-G. Effects of moisture and temperature on soil organic carbon decomposition along a vegetation restoration gradient of subtropical China. Forests 2022, 13, 578. [CrossRef]
- Colunga, S.; Fierro Cabo, A.; Christoffersen, B.; Pereira, E. Tillage legacy, grasses and soil texture shape soil organic carbon recovery in semi-arid woodland. Sci. Rep. 2025, 15, 34789. [CrossRef]
- Šimanský, V.; Lukac, M. Interactions between soil texture and cover crop diversity shape carbon dynamics and aggregate stability. Land 2025, 14, 2044. [CrossRef]
- Zhang, X.; Fu, J.; Ma, P.; Diwu, G.; Li, T.; Ma, H.; Shangguan, Z.; Deng, L.; Zhong, Y.; Yan, W. Impact of vegetation restoration on soil organic carbon fractions: A global meta-analysis. Ecol. Eng. 2025, 216, 107640. [CrossRef]
- Wei, X.; Yang, Y.; Shen, Y.; Chen, Z.; Dong, Y.; Wu, F.; Zhang, L. Effects of litterfall on the accumulation of extracted soil humic substances in subalpine forests. Front. Plant Sci. 2020, 11, 254. [CrossRef]
- Zhao, Z.; Dong, P.; Fu, B.; Wu, D.; Zhao, Z. Labile fraction of organic carbon in soils from natural and plantation forests of Tropical China. Sustainability 2024, 16, 7836. [CrossRef]
- Ukalska-Jaruga, A.; Bejger, R.; Debaene, G.; Smreczak, B. Characterization of soil organic matter individual fractions (fulvic acids, humic acids, and humins) by spectroscopic and electrochemical techniques in agricultural soils. Agronomy 2021, 11, 1067. [CrossRef]
- Guimarães, D.V.; Gonzaga, M.I.S.; Silva, T.O.; Silva, T.L.; Dias, N.S.; Matias, M.I.S. Soil organic matter pools and carbon fractions in soil under different land uses. Soil Tillage Res. 2013, 126, 177–182. [CrossRef]
- Stevenson, F.J. Humus Chemistry: Genesis, Composition, Reactions, 2nd ed.; John Wiley & Sons: New York, NY, USA, 1994.
- Canellas, L.P.; Velloso, A.C.X.; Marciano, C.R.; Ramalho, J.F.G.P.; Rumjanek, V.M.; Rezende, C.E.; Santos, G.A. Propriedades químicas de um Cambissolo cultivado com cana-de-açúcar, com preservação do palhiço e adição de vinhaça por longo tempo. Rev. Bras. Cienc. Solo 2003, 27, 935–944. [CrossRef]
- Prescott, C.E.; Vesterdal, L. Decomposition and transformations along the continuum from litter to soil organic matter in forest soils. For. Ecol. Manag. 2021, 498, 119522. [CrossRef]
- Baldock, J.A.; Skjemstad, J.O. Role of the soil matrix and minerals in protecting natural organic materials against biological attack. Org. Geochem. 2000, 31, 697–710. [CrossRef]
- Xue, B.; Huang, L.; Li, X.; Lu, J.; Gao, R.; Kamran, M.; Fahad, S. Effect of clay mineralogy and soil organic carbon in aggregates under straw incorporation. Agronomy 2022, 12, 534. [CrossRef]
- Liu, Y.; Huang, Y.; Ndzelu, B.S.; Hou, R. Carbon saturation level regulates the stability of mineral-associated organic carbon in forest soils. Catena 2025, 259, 109391. [CrossRef]
- Angst, G.; Mueller, K.E.; Nierop, K.G.J.; Simpson, M.J. Plant- or microbial-derived? A review on the molecular composition of stabilized soil organic matter. Soil Biol. Biochem. 2021, 156, 108189. [CrossRef]
- Rocci, K.S.; Cotrufo, M.F.; Ernakovich, J.; Foster, E.; Frey, S.; Georgiou, K.; Grandy, A.S.; Malhotra, A.; Reich, P.B.; Schlerman, E.P.; Wieder, W.R. Bridging 20 years of soil organic matter frameworks: Empirical support, model representation, and next steps. J. Geophys. Res. Biogeosci. 2024, 129, e2023JG007964. [CrossRef]
- Zaia, F.C.; Gama-Rodrigues, A.C.; Gama-Rodrigues, E.F. Formas de fósforo no solo sob leguminosas florestais, floresta secundária e pastagem no Norte Fluminense. Rev. Bras. Cienc. Solo 2008, 32, 1191–1197. [CrossRef]
- Chi, G.; Zeng, F.; Wang, Y.; Chen, X. Phosphorus dynamics in litter-soil systems during litter decomposition in larch plantations across the chronosequence. Front. Plant Sci. 2022, 13, 1010458. [CrossRef]
- Dodd, R.J.; McDowell, R.W.; Condron, L.M. Changes in soil phosphorus availability and potential phosphorus loss following cessation of phosphorus fertiliser inputs. Soil Res. 2013, 51, 427–436. [CrossRef]
- Vilar, C.C.; Costa, A.C.S.; Hoepers, A.; Souza Junior, I.G. Capacidade máxima de adsorção de fósforo relacionada a formas de ferro e alumínio em solos subtropicais. Rev. Bras. Cienc. Solo 2010, 34, 1059–1068. [CrossRef]
- Marschner, P. Marschner’s Mineral Nutrition of Higher Plants, 3rd ed.; Academic Press: London, UK, 2012.
- Taiz, L.; Zeiger, E.; Møller, I.M.; Murphy, A. Plant Physiology and Development, 6th ed.; Sinauer Associates: Sunderland, MA, USA, 2017.
- Weil, R.R.; Brady, N.C. The Nature and Properties of Soils, 15th ed.; Pearson: Columbus, OH, USA, 2016.
- Novais, R.F.; Alvarez V., V.H.; Barros, N.F.; Fontes, R.L.F.; Cantarutti, R.B.; Neves, J.C.L. Fertilidade do Solo; Sociedade Brasileira de Ciência do Solo: Viçosa, MG, Brazil, 2007.
- Dauer, J.M.; Perakis, S.S. Calcium oxalate contribution to calcium cycling in forests of contrasting nutrient status. For. Ecol. Manag. 2014, 334, 64–73. [CrossRef]
- Zhou, S.; Yan, G.; Hu, J.; Liu, X.; Zou, X.; Tie, L.; Yuan, R.; Yang, Y.; Xiao, L.; Cui, X.; Tu, L.; Lai, J.; Zhao, A.; Huang, C. The responses of leaf litter calcium, magnesium, and manganese dynamics to simulated nitrogen deposition and reduced precipitation vary with different decomposition stages. Forests 2021, 12, 1473. [CrossRef]
- McBride, M.B. Environmental Chemistry of Soils; Oxford University Press: New York, NY, USA, 1994.
- Sposito, G. The Chemistry of Soils, 3rd ed.; Oxford University Press: New York, NY, USA, 2016.
- Rowley, M.C.; Grand, S.; Spangenberg, J.E.; Verrecchia, E.P. Evidence linking calcium to increased organo-mineral association in soils. Biogeochemistry 2021, 153, 223–241. [CrossRef]
- Bayer, C.; Spagnollo, E.; Wildner, L.P.; Ernani, P.R.; Albuquerque, J.A. Incremento de carbono e nitrogênio num Latossolo pelo uso de plantas estivais para cobertura do solo. Cienc. Rural 2003, 33, 469–475. [CrossRef]
- Ciotta, M.N.; Bayer, C.; Fontoura, S.M.V.; Ernani, P.R.; Albuquerque, J.A. Matéria orgânica e aumento da capacidade de troca de cátions em solo com argila de atividade baixa sob plantio direto. Cienc. Rural 2003, 33, 1161–1164. [CrossRef]
- Curtin, D.; Fraser, P.M.; Beare, M.H. Loss of soil organic matter following cultivation of long-term pasture: Effects on major exchangeable cations and cation exchange capacity. Soil Res. 2015, 53, 377–385. [CrossRef]
- Katou, H. A pH-dependence implicit formulation of cation- and anion-exchange capacities of variable-charge soils. Soil Sci. Soc. Am. J. 2002, 66, 1218–1224. [CrossRef]
- Bortoluzzi, E.C.; Tessier, D.; Rheinheimer, D.S.; Julien, J.L. The cation exchange capacity of a sandy soil in southern Brazil: An estimation of permanent and pH-dependent charges. Eur. J. Soil Sci. 2006, 57, 356–364. [CrossRef]
Figure 1.
Sand (a), silt (b), and clay (c) contents in soils under different land-use systems across different states of Northeastern Brazil. CE, Ceará; PB, Paraíba; PE, Pernambuco; PI, Piauí. Lowercase letters compare land-use systems within each state, whereas uppercase letters compare states within each land-use system according to Tukey’s test (p ≤ 0.05). Error bars represent the standard error of the mean (n = 4).
Figure 1.
Sand (a), silt (b), and clay (c) contents in soils under different land-use systems across different states of Northeastern Brazil. CE, Ceará; PB, Paraíba; PE, Pernambuco; PI, Piauí. Lowercase letters compare land-use systems within each state, whereas uppercase letters compare states within each land-use system according to Tukey’s test (p ≤ 0.05). Error bars represent the standard error of the mean (n = 4).
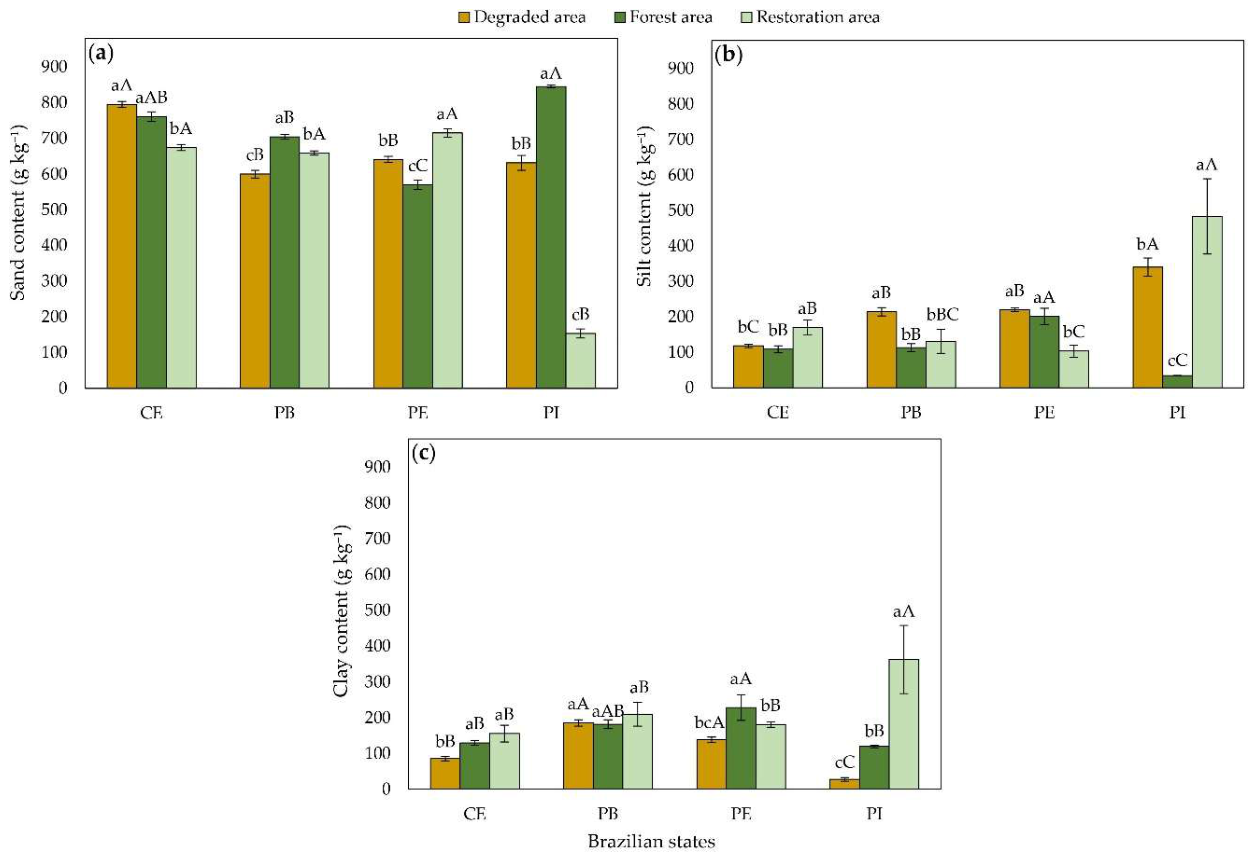
Figure 2.
pH in soils under different land-use systems across different states of Northeastern Brazil. CE, Ceará; PB, Paraíba; PE, Pernambuco; PI, Piauí. Lowercase letters compare land-use systems within each state, whereas uppercase letters compare states within each land-use system according to Tukey’s test (p ≤ 0.05). Error bars represent the standard error of the mean (n = 4).
Figure 2.
pH in soils under different land-use systems across different states of Northeastern Brazil. CE, Ceará; PB, Paraíba; PE, Pernambuco; PI, Piauí. Lowercase letters compare land-use systems within each state, whereas uppercase letters compare states within each land-use system according to Tukey’s test (p ≤ 0.05). Error bars represent the standard error of the mean (n = 4).
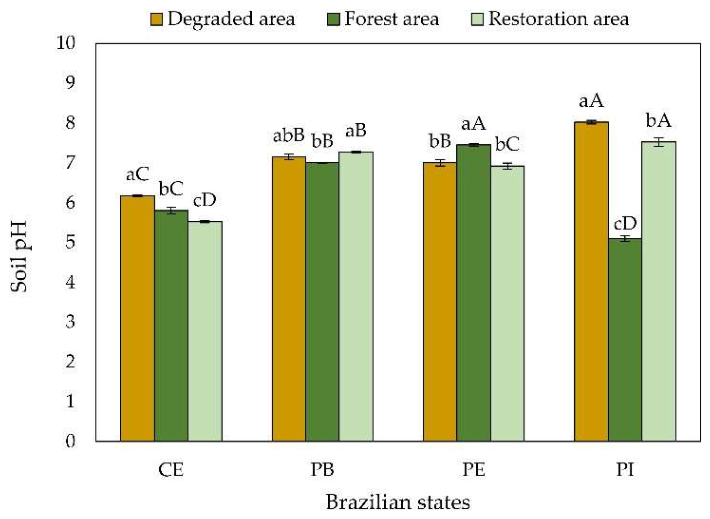
Figure 5.
Cation exchange capacity (CEC) in soils under different land-use systems across different states of Northeastern Brazil. CE, Ceará; PB, Paraíba; PE, Pernambuco; PI, Piauí. Lowercase letters compare land-use systems within each state, whereas uppercase letters compare states within each land-use system according to Tukey’s test (p ≤ 0.05). Error bars represent the standard error of the mean (n = 4).
Figure 5.
Cation exchange capacity (CEC) in soils under different land-use systems across different states of Northeastern Brazil. CE, Ceará; PB, Paraíba; PE, Pernambuco; PI, Piauí. Lowercase letters compare land-use systems within each state, whereas uppercase letters compare states within each land-use system according to Tukey’s test (p ≤ 0.05). Error bars represent the standard error of the mean (n = 4).
Disclaimer/Publisher’s Note: The statements, opinions and data contained in all publications are solely those of the individual author(s) and contributor(s) and not of MDPI and/or the editor(s). MDPI and/or the editor(s) disclaim responsibility for any injury to people or property resulting from any ideas, methods, instructions or products referred to in the content. |
© 2026 by the authors. Licensee MDPI, Basel, Switzerland. This article is an open access article distributed under the terms and conditions of the Creative Commons Attribution (CC BY) license (http://creativecommons.org/licenses/by/4.0/).
Copyright: This open access article is published under a Creative Commons CC BY 4.0 license, which permit the free download, distribution, and reuse, provided that the author and preprint are cited in any reuse.