

Submitted:
27 September 2026
Posted:
29 September 2026
You are already at the latest version
Abstract
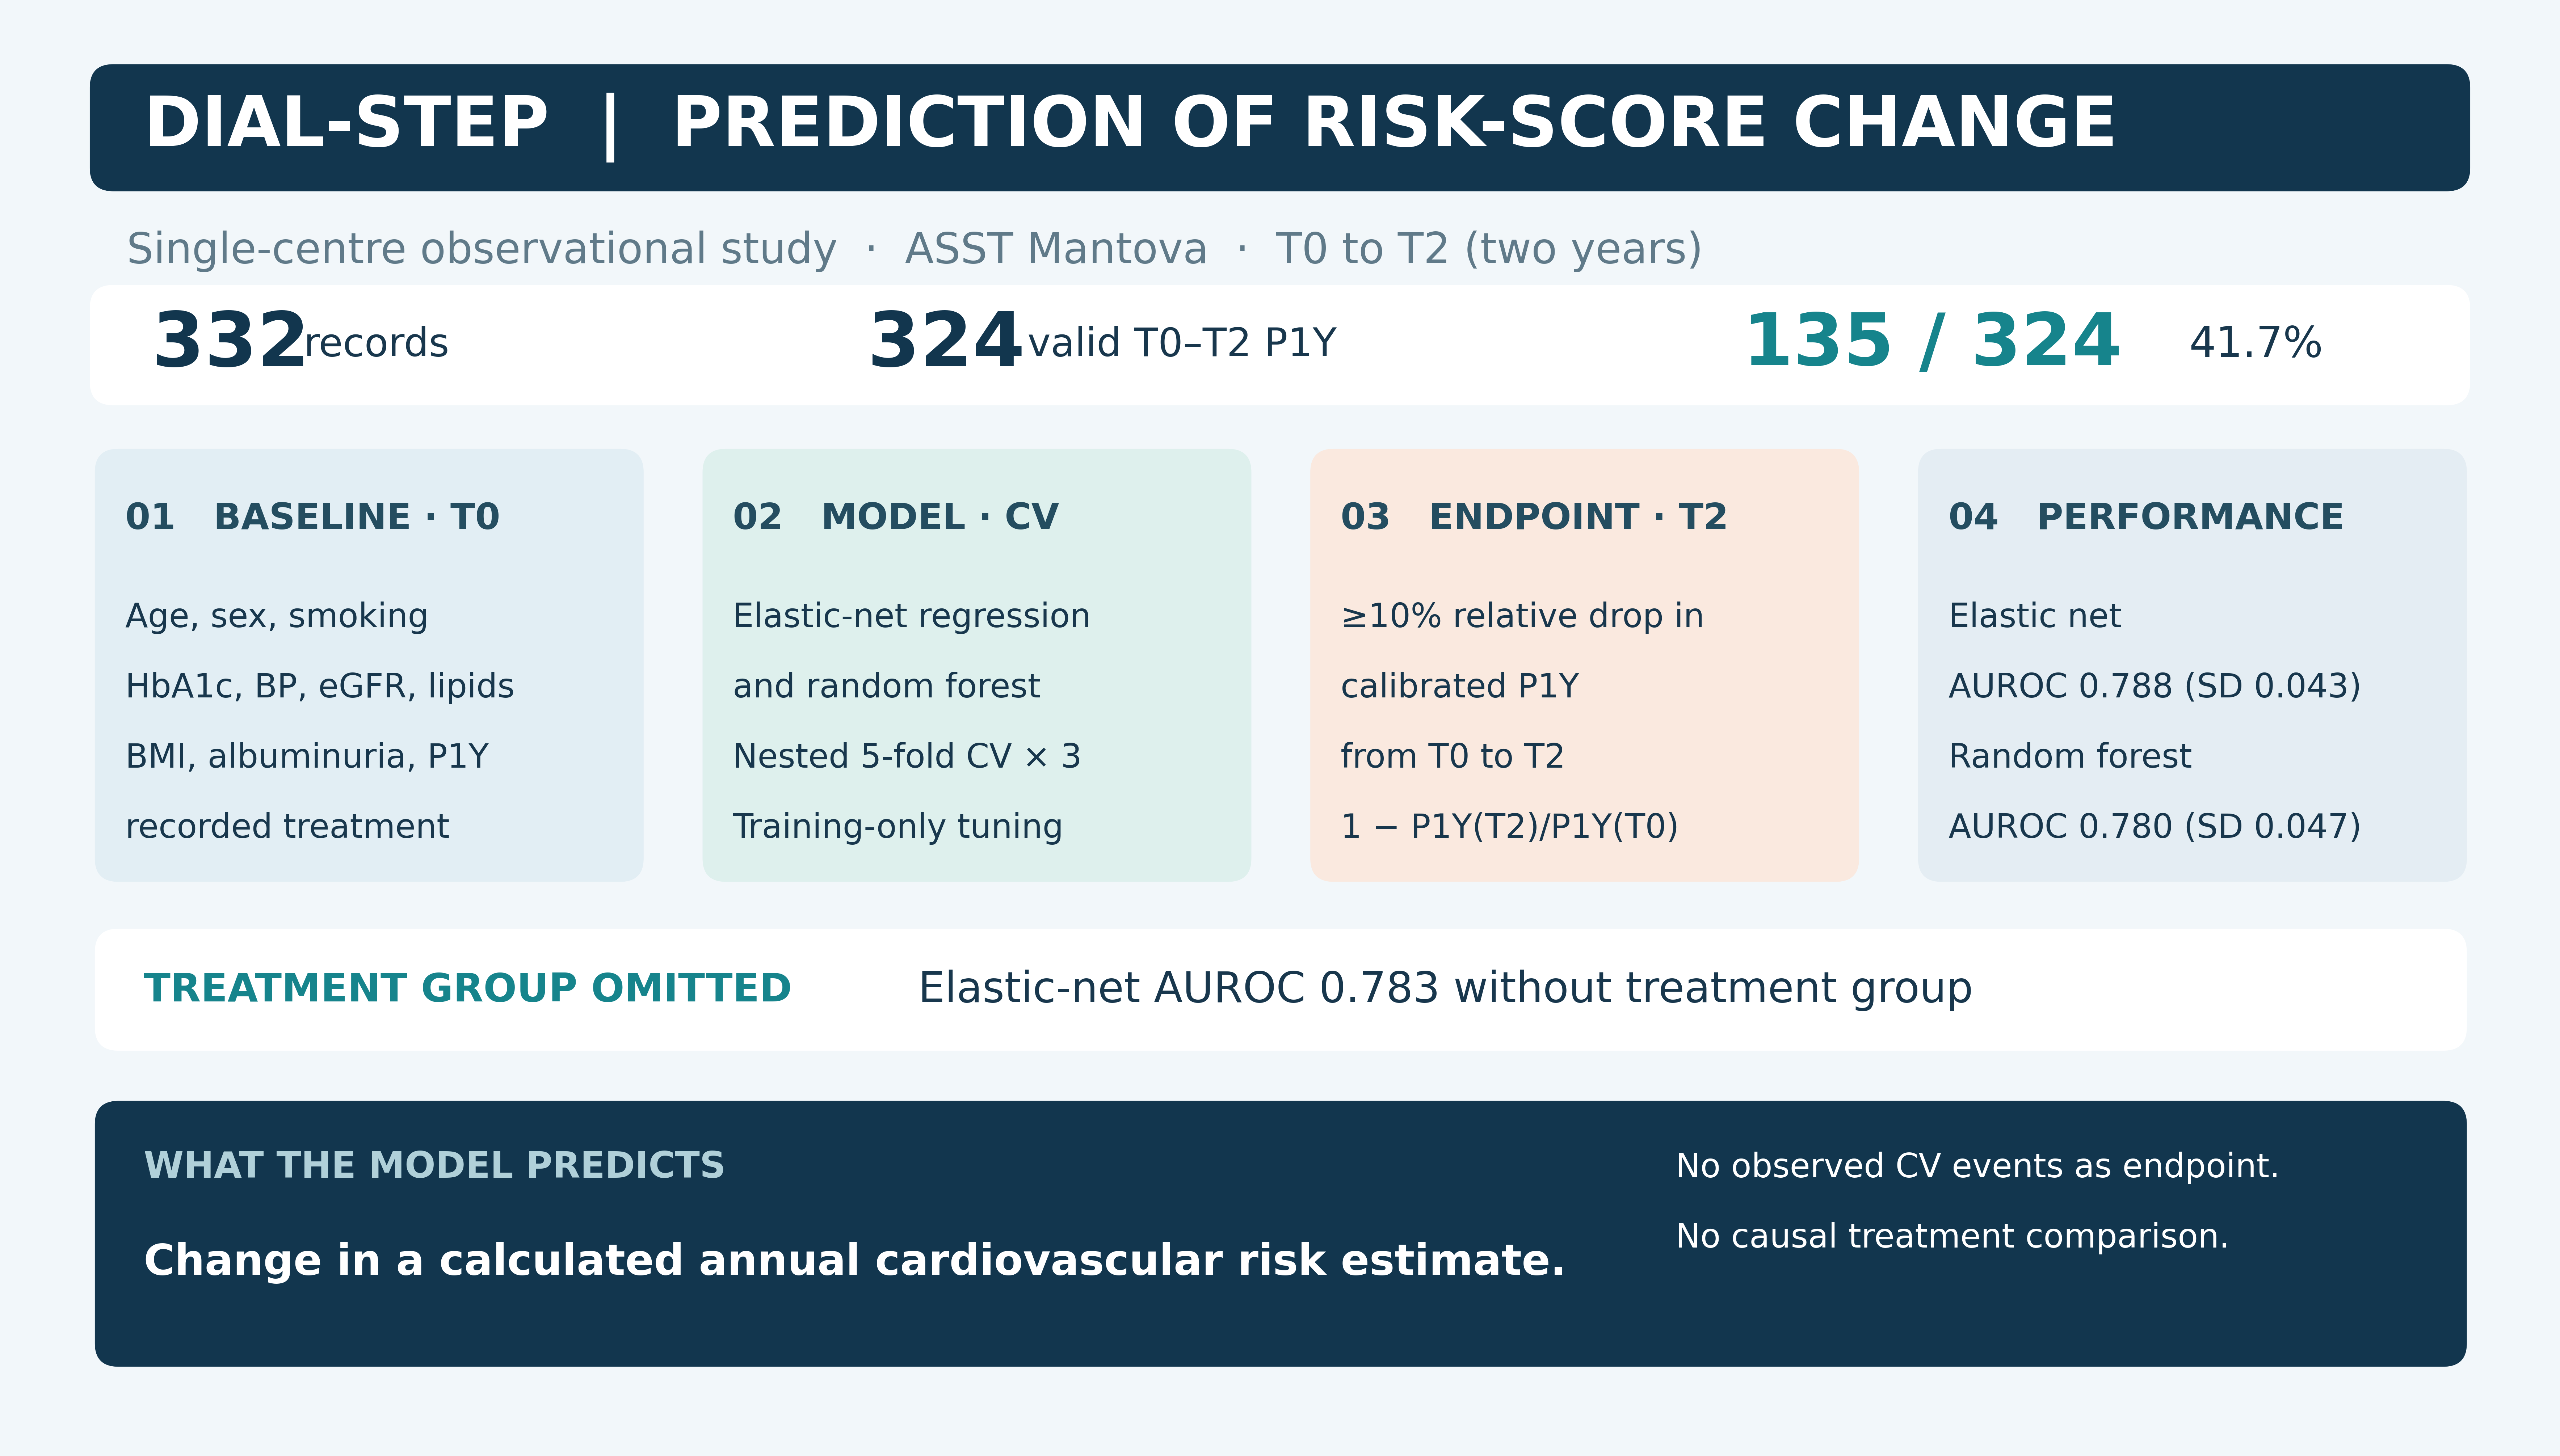
Background: Longitudinal changes in estimated cardiovascular risk vary across indi-viduals with type 2 diabetes. We investigated whether baseline clinical data predict a relative decrease of at least 10% in the DIAL2-derived calibrated one-year cardiovascular risk estimate (P1Y) over two years. Methods: This single-centre observational prediction analysis used data collected at ASST Mantova. Of 332 source records, 324 had valid P1Y estimates at baseline (T0) and two years (T2). Elastic net logistic regression and random forest were assessed with three repetitions of nested stratified five-fold cross-validation. We assessed discrimination, average precision, Brier score, and calibration of held-out predictions. Results: The response criterion was met in 135 of 324 patients (41.7%). Mean test-fold area under the receiver operating characteristic curve (AUROC) was 0.788 (fold SD 0.043) with elastic net and 0.780 (0.047) with random forest. Average precision was 0.755 and 0.740, and Brier score was 0.183 and 0.190. Elastic net without treatment group yielded AUROC 0.783. Averaged held-out elastic net predictions had AUROC 0.792 and calibration slope 0.978. At fixed baseline age, 230/324 (71.0%) met the reduction criterion; a separately validated elastic net had mean AUROC 0.751. Outcomes were changes in a computed risk estimate, not observed cardiovascular events. Conclusions: Baseline characteristics discriminated individuals with a two-year reduction in estimated annual risk in internal validation. Endpoint status was sensitive to the age term in DIAL2. These findings require validation in an independent cohort; model outputs cannot establish the effect of any therapy on clinical cardiovascular outcomes.
Keywords:
type 2 diabetes
; prediction
; cardiovascular risk estimate
; DIAL2
; elastic net
; internal validation
1. Introduction
Risk estimation can summarize a changing cardiometabolic profile, but a change in estimated risk is distinct from a cardiovascular event. The DIAbetes Lifetime perspective model (DIAL2) was developed for adults with type 2 diabetes without prior cardiovascular disease and geographically recalibrated for European risk regions [1]. Other diabetes-specific risk approaches include SCORE2-Diabetes, the original DIAL framework, the UKPDS risk engine, and the ADVANCE model [2,3,4,5]. The present dataset includes a calibrated annual risk estimate derived from this framework at successive clinical assessments. Its use here is restricted to an internally validated prediction study of risk-score change.
European prevention and diabetes guidance recommends risk assessment alongside management of multiple cardiometabolic factors [6,7,8]. Randomized outcome trials have investigated empagliflozin [9] and semaglutide in oral [10,11] or injectable [12] formulations, with additional kidney-outcome evidence [13,14]. A trial of injectable semaglutide added to an SGLT2 inhibitor informs combination feasibility but does not test the oral semaglutide–empagliflozin regimen analysed here [15]. These trial findings concern actual clinical outcomes or metabolic changes; they cannot establish that a calculated score reduction in DIAL-STEP represents an event reduction.
In prior work from our group, a small real-world cohort described glycaemic and cardiometabolic measurements during oral semaglutide treatment in older adults [16], and a narrative review discussed mechanistic sources of residual cardiometabolic risk [17]. These publications motivate the clinical setting and biological context, respectively; neither validates the present prediction model. A separate narrative review from our group discusses AI-supported anticipation of clinical deterioration in non-insulin-treated diabetes and calls for explainable tools with clinical validation [18]. Kidney function and albuminuria are relevant clinical descriptors in diabetes care [19,37], but a change in those inputs can change a computed risk score without demonstrating a cardiovascular benefit.
We aimed to predict, using only information available at baseline, whether the calibrated P1Y estimate would decrease by at least 10% relative to baseline over approximately two years. Elastic net was selected as an interpretable penalized regression approach and random forest as a nonlinear comparator. Reporting follows the principles of TRIPOD+AI and STROBE [20,21]. No treatment-effect or event-prediction claim is made.
2. Materials and Methods
2.1. Setting, Participants, and Study Design
The study was conducted at the Specialistica Ambulatoriale, Branca Diabetologia, Casa di Comunità di Goito, ASST Mantova, Italy, the sole clinical centre named in the approval issued by CET Lombardia 4 (protocol DIAL-STEP, CET 48-26; favourable opinion at its meeting on 28 May 2026; opinion dated 29 May 2026). This retrospective, observational, single-centre analysis included 332 unique records of adults with type 2 diabetes in primary prevention, grouped by initiation of oral semaglutide, empagliflozin, or both at T0. T0, intermediate (T1), and T2 measurements were available. The available analytical cohort comprised 332 patients with recorded T0 and T2 visits; a screening log of all patients who initiated these therapies in 2023 and a formal sample-size calculation were unavailable. Baseline (T0) visits began in 2023; T1 and T2 were recorded clinical visits at nominal 12 and 24 months through 2025. Exact visit dates were not retained in the analytical master, preventing reconstruction of individual visit-window compliance. Primary-prevention status was established during clinical study enrolment; the analytical workbook did not contain a separate prior-event field for re-audit. The pre-enrolment screening log, drug persistence, and concomitant treatment changes were unavailable.
2.2. Risk Estimate and Outcome
P1Y_CVD_CAL denotes the calibrated DIAL2-derived estimated one-year cardiovascular risk at each visit, stored as a proportion and presented as a percentage. For the DIAL-STEP risk calculation, the DIAL2 core model used published predictor transformations, age-dependent terms, baseline survival and the moderate-risk European recalibration [1]. Total and HDL cholesterol were separate inputs. Selected survival and regional parameters were checked against the source supplementary tables; 981 eligible annual estimates were recomputed from archived model inputs. Agreement with the online clinical calculator was not tested. The original DIAL2 publication concerns cardiovascular risk estimation [1]; the present two-year endpoint is the relative change of two annual estimates: response = 1 when 1 − P1Y_CVD_CAL(T2) / P1Y_CVD_CAL(T0) ≥ 0.10. The ≥10% threshold was defined for this prediction analysis. Valid estimates at both visits and a positive baseline estimate were required. The workbook applies a score validity age range of 30–85 years; eight records lacked a valid paired score because age was outside that range at one or both visits. Thus, 324 records were available for the primary endpoint. The investigators confirmed that no deaths or cardiovascular events occurred during follow-up; the analytical workbook did not include individual event fields. The analysis does not estimate event incidence or evaluate DIAL2 calibration against clinical events.
2.3. Baseline Predictors and Data Handling
The baseline candidate predictor set comprised age, diabetes duration, sex, smoking status, HbA1c, systolic blood pressure, estimated glomerular filtration rate (eGFR; CKD-EPI 2009 as supplied), total cholesterol, HDL cholesterol, body mass index (BMI), log(1 + albuminuria), calibrated baseline P1Y, and recorded treatment group. No T1 or T2 predictor entered model fitting. All whitelist variables were complete in the 324 analysed records; median imputation was specified within training folds but was not triggered. Numeric predictors were standardized within training folds for elastic net; treatment group was dummy-coded with empagliflozin as the reference category and its indicator variables were not standardized. No observations were excluded on the basis of a large within-person change. Automated broad biological plausibility checks found no impossible values and retained every supplied measurement.
2.4. Model Training and Internal Validation
Outer validation used stratified five-fold cross-validation repeated three times (15 held-out test folds in total; fixed random seed 20260926). Each outer training fold underwent an inner stratified three-fold grid search optimizing negative log loss. Elastic net penalization was chosen for correlated baseline variables [22], and random forests provide a flexible tree-based comparator [23]; the L1 component derives from lasso regularization [24]. In line with methodological guidance for transparent clinical prediction modeling [25], all tuning and preprocessing were enclosed within the training splits. Elastic net logistic regression tested regularization strengths C of 0.03, 0.3, and 3 and L1 ratios of 0.25, 0.75, and 1. Random forest used 160 trees and tested minimum leaf sizes of 5 and 12 and max-feature choices of square root or 0.8. Preprocessing, imputation, and hyperparameter choice were entirely within training data for each split. A baseline-P1Y-only logistic model served as a comparator; an elastic net model excluding treatment group assessed whether discrimination was retained without the treatment variable. Available sample size and the lack of a formal development sample-size calculation limit precision and raise a potential for overfitting despite internal validation [26,27].
We report mean test-fold AUROC, average precision (area under the precision–recall curve), and Brier score; fold SD summarizes dispersion over overlapping splits and is not a patient-level confidence interval. Each person received three held-out probabilities from the three outer repeats; their mean was used for one descriptive ROC curve, quintile calibration plot, calibration intercept and slope, and subgroup evaluation. Calibration intercept and slope were estimated jointly using logistic regression of observed outcomes on the logit of the mean held-out probabilities; they describe the averaged predictions rather than a single model fit. Since repeated test predictions for the same people were averaged, the resulting pooled AUROC is distinct from the mean of the 15 test-fold AUROCs. The outcome prevalence, 41.7%, provides context for average precision; discrimination metrics were interpreted alongside precision–recall measures [28,29,30] and probability calibration [31]. Subgroups were descriptive only.
For a stability description, final elastic net tuning was chosen by five-fold cross-validation in the complete analysis cohort; 300 bootstrap refits held that tuning fixed. Coefficient intervals from these refits describe sample variability conditional on fixed tuning and do not account for model-selection uncertainty. Threshold sensitivity analyses repeated nested five-fold outer cross-validation twice for calibrated reductions of at least 5% and 15%, and for an uncalibrated raw P1Y reduction of at least 10%. No therapy comparison was prespecified as causal.
For the deployable final specification, five-fold stratified cross-validation on all 324 patients selected C = 0.3 and L1 ratio = 0.25. The full-cohort refit used scikit-learn 1.8.0 logistic regression with the saga solver (maximum 7000 iterations; random seed 20260926). Table 4 gives the fitted intercept, standardized coefficients, and the training means and standard deviations needed to compute probabilities. These full-data coefficients were estimated after internal validation and their apparent fit should not be confused with held-out performance.
As an explanatory sensitivity analysis of the endpoint, T2 calibrated P1Y was recalculated with chronological age, diabetes duration and all age-dependent terms held at each patient’s T0 value, while retaining the observed T2 clinical inputs. We then applied the same ≥10% relative reduction criterion to these age-fixed T2 estimates in the same 324 patients. This deterministic scenario quantifies how endpoint classification changes if age does not advance; interactions in DIAL2 mean it is not a unique attribution of the age contribution. The elastic-net pipeline was also evaluated for this alternative binary endpoint using two repeats of nested five-fold cross-validation.
Use of Generative AI: OpenAI ChatGPT assisted with computational analysis, preparation of manuscript text, and creation of the graphical abstract. The authors are responsible for verifying the analyses and manuscript before submission.
3. Results
3.1. Cohort and Baseline Profile
The source cohort included 139 oral semaglutide, 106 empagliflozin, and 87 combination records. Of these, 137, 101, and 86, respectively, had a valid paired P1Y, for 324 analysed participants. Among analysed participants, median age was 67 years, 113 (34.9%) were female, and median baseline estimated annual risk was 1.83%. Baseline differences among treatment groups are descriptive (Table 1).
3.2. Primary Outcome and Model Performance
The relative estimated-risk reduction reached at least 10% in 135/324 (41.7%); 189 were nonresponders. By recorded treatment, response was present in 54/137 (39.4%) with semaglutide, 36/101 (35.6%) with empagliflozin, and 45/86 (52.3%) with combination therapy. These proportions describe nonrandomized groups with different baseline profiles; they cannot be interpreted as comparative treatment effects.
In the age-fixed endpoint sensitivity analysis, 230/324 (71.0%) met the ≥10% reduction criterion, compared with 135/324 (41.7%) under the standard age-advancing calculation. All 135 standard responders remained responders; 95 additional patients met the age-fixed criterion. The age-fixed counts were 95/137 for semaglutide, 63/101 for empagliflozin, and 72/86 for combination therapy. The mean T0-to-T2 change was −0.39 percentage points with age held at T0 versus −0.12 points under standard calculation (mean difference +0.27 points). The alternative endpoint yielded mean internally validated AUROC 0.751. These are differences between calculations of estimated risk, not observed event rates or treatment effects.
Elastic net yielded the highest mean AUROC, 0.788, and mean Brier score 0.183, equal after rounding to the model without treatment and lower than random forest and the P1Y-only comparator (Table 2). The numerical difference with random forest was not subjected to a formal superiority test. Excluding treatment group changed mean AUROC only slightly, from 0.788 to 0.783. Mean predicted probability from averaged held-out elastic net predictions was 41.9% versus observed response 41.7%; pooled AUROC was 0.792, Brier score 0.181, calibration intercept −0.020, and calibration slope 0.978. Observed proportions across quintiles of predicted response were 10.8%, 29.2%, 29.7%, 60.0%, and 78.5%; corresponding mean predictions were 10.4%, 24.1%, 37.8%, 54.9%, and 82.3% (Figure 1).
3.3. Sensitivity and Exploratory Analyses
Model use: p = 1/[1 + exp(−η)], where η is the intercept plus each coefficient multiplied by (baseline value − mean)/SD, plus the applicable treatment indicator (empagliflozin is reference). Baseline P1Y is a proportion; albuminuria is ln(1 + mg/24 h). Female and smoking are coded 1=yes, 0=no, then standardized. The treatment indicators are not standardized. Standard deviations use the population denominator (n), as in StandardScaler. This implementation requires complete predictor data; median imputation was specified for training-fold preprocessing but never triggered in the analysed cohort. These full-cohort coefficients are distinct from held-out validation estimates.

Table 3.
Nested elastic net sensitivity analyses (10 held-out outer folds per outcome). Thresholds refer to a relative decrease in estimated annual P1Y.
Table 3.
Nested elastic net sensitivity analyses (10 held-out outer folds per outcome). Thresholds refer to a relative decrease in estimated annual P1Y.
| Outcome definition | Analysed | Responders | Mean AUROC |
| Calibrated P1Y reduction ≥5% | 324 | 173 | 0.794 |
| Calibrated P1Y reduction ≥15% | 324 | 94 | 0.841 |
| Raw P1Y reduction ≥10% | 324 | 150 | 0.795 |
| Age-fixed calibrated P1Y reduction ≥10% | 324 | 230 | 0.751 |
Table 4.
Final elastic-net model specification for the standard age-advancing endpoint.
| Predictor | Coefficient | Mean | SD |
| Intercept | −0.4347 | — | — |
| Age, years | −0.6230 | 66.0494 | 10.3714 |
| Diabetes duration, years | 0.0830 | 10.6944 | 8.5039 |
| Female (1=yes) | 0.1835 | 0.3488 | 0.4766 |
| Smoking (1=yes) | 0.1896 | 0.3765 | 0.4845 |
| HbA1c, % | 0.8120 | 7.8556 | 1.2538 |
| Systolic BP, mmHg | 0.8070 | 135.5401 | 14.9206 |
| eGFR, mL/min/1.73 m² | −0.4317 | 76.4910 | 20.9276 |
| Total cholesterol, mg/dL | 0.4515 | 169.2994 | 39.8904 |
| HDL cholesterol, mg/dL | −0.3151 | 47.0463 | 10.6151 |
| BMI, kg/m² | 0.0534 | 30.9590 | 5.4372 |
| ln(1 + albuminuria) | 0.0162 | 3.5938 | 1.1992 |
| Baseline P1Y, proportion | −0.2709 | 0.021720 | 0.014737 |
| Combination vs empagliflozin | 0.4030 | — | — |
| Semaglutide vs empagliflozin | −0.1867 | — | — |
In pooled held-out predictions, exploratory AUROC was 0.770 in women (n = 113), 0.803 in men (n = 211), 0.744 at age <65 (n = 129), and 0.808 at age ≥65 years (n = 195). Group-specific values were 0.798 for semaglutide, 0.803 for empagliflozin, and 0.752 for combination therapy. These small subgroup estimates are descriptive and do not establish differential performance. In 300 fixed-tuning bootstrap refits, the signs of baseline HbA1c, systolic BP, total cholesterol, age, eGFR, and HDL cholesterol coefficients were preserved in at least 99.7% of samples. Treatment group coefficients were less stable. Higher baseline HbA1c, systolic BP, and total cholesterol had positive fitted associations with score response, whereas age, eGFR and HDL cholesterol had negative fitted associations; these coefficients are conditional on correlated baseline score constituents and do not explain a biological treatment mechanism.
4. Discussion
In this single-centre cohort, a baseline-only elastic net model showed moderate internal discrimination of a two-year relative reduction in estimated annual cardiovascular risk. Average precision was 0.755 against an outcome prevalence of 0.417. Mean predicted and observed response probabilities were close in the same cohort, but quintile estimates show sampling variability, and the absence of external validation limits use beyond this dataset. Risk-of-bias tools for prediction studies emphasize sample selection, outcome definition, and validation, which are especially relevant to this modest, single-centre dataset [32,33]. The apparent discrimination may in part arise from baseline predictors that also determine P1Y and from the mathematics of a change in a risk estimate; regression to the mean and score construction may contribute. A clinical improvement cannot be inferred solely from this modeled endpoint.
The score is recalculated from cardiometabolic measurements, several of which are included as baseline predictors. Consequently, fitted coefficients partly reflect relationships with the score equation, and changes in the modeled annual estimate have not been shown here to predict later observed cardiovascular events. The investigators confirmed no deaths or cardiovascular events during follow-up; the absence of observed events prevents validation against hard outcomes. Prediction stability can vary even when mean validation metrics appear acceptable [34]. Decision-curve analysis was not performed because no clinical decision threshold or action was defined for this computed endpoint [35]. The exposure groups are observational, differ at baseline, and lack documented treatment persistence, so neither response rates nor model treatment coefficients support choosing among semaglutide, empagliflozin, and combination therapy. More complex machine-learning methods have not consistently outperformed conventional models in published clinical prediction comparisons [36].
The age-fixed sensitivity analysis substantially increased the number meeting the study-defined ≥10% reduction threshold (230 versus 135). Among the 189 participants who did not meet the standard criterion, 95 (50.3%) met it when age was held fixed. Thus, the primary endpoint reflects whether changes in modeled clinical risk factors outweigh the increase associated with aging in DIAL2. The negative age coefficient in Table 4 should be interpreted partly in light of this score construction. The primary model predicts the standard age-advancing endpoint; mean AUROC decreased to 0.751 for the alternative age-fixed endpoint in a separately tuned internal-validation analysis.
The sample is limited to one authorised centre. Individual visit dates, the pre-enrolment screening log, an independent record of prior cardiovascular disease, and exposure continuity are not available in the analytic workbook. T1 and T2 are nominal 12- and 24-month visits; individual visit-window compliance cannot be reconstructed. Albuminuria was recorded in mg/24 h. DIAL2 was designed for a defined disease context; eligibility for its original target population cannot be fully verified from these fields. The source DIAL-STEP calculation applied published DIAL2 components with moderate-risk European recalibration and checked selected parameters against its supplementary tables. Agreement with an independent online calculator was not tested, and the estimates were not calibrated against cardiovascular events in this cohort. All primary baseline predictors were complete among analysed participants. Eight exclusions due to age-based score validity may affect generalizability. Repeated internal folds and bootstrap resampling do not replace independent temporal or external validation.
Future research should test the locked specification on independent patients with documented follow-up and cardiovascular outcomes [38], assess calibration and usefulness for the intended application, and establish whether this surrogate change adds meaningful information beyond observed clinical measures. At present the model describes a pattern in computed risk scores and should not guide causal prescribing decisions.
5. Conclusions
Using only baseline variables in 324 valid records collected at ASST Mantova, elastic net predicted a relative ≥10% decrease in calibrated estimated annual P1Y over two years with mean internally validated AUROC 0.788. External validation and evaluation against observed clinical outcomes are needed before clinical interpretation.
Supplementary Materials
The following supporting information can be downloaded at the website of this paper posted on Preprints.org.
Author Contributions
Conceptualization, P.V.; clinical investigation and data curation, A.M.L.; formal analysis, A.M.L.; writing—original draft, A.M.L.; writing—review and editing, P.V. and A.M.L.
Funding
This research received no external funding.
Institutional Review Board Statement
CET Lombardia 4 approved the single-centre observational DIAL-STEP study (CET 48-26, protocol DIAL-STEP) at the meeting of 28 May 2026; the written opinion is dated 29 May 2026. The sole authorised clinical centre is the Servizio di Specialistica Ambulatoriale, Branca Diabetologia, Casa di Comunità di Goito, ASST Mantova, with Antonio Maria Labate named as investigator. The approved documentation includes a patient information and informed-consent form and a separate data-processing information and consent form (versions dated 11 March 2026). Written informed consent for study participation and for personal-data processing was obtained from all participants using the two information and consent forms approved by the CET.
Informed Consent Statement
Informed consent and the study information form were obtained from all participants.
Data Availability Statement
Individual patient data are not publicly available because they contain sensitive clinical information and are subject to institutional and ethical restrictions. Requests for access may be directed to the corresponding author; any data sharing would require authorization by ASST Mantova and compliance with the approved consent and applicable requirements.
Code Availability Statement
The analysis script for the primary elastic-net model and its final coefficients is available from the corresponding author on request. Additional calculations, including the alternative age-fixed outcome, can be shared subject to institutional review; no patient-level data are embedded in the code.
Conflicts of Interest
The authors declare no conflicts of interest. This independent academic study had no pharmaceutical industry involvement, industry funding, or company-affiliated authors.
References
- Østergaard HB, et al. Estimating individual lifetime risk of incident cardiovascular events in adults with Type 2 diabetes: an update and geographical calibration of the DIAbetes Lifetime perspective model (DIAL2). Eur J Prev Cardiol. 2023;30:61–69. [CrossRef]
- SCORE2-Diabetes Working Group and ESC Cardiovascular Risk Collaboration. SCORE2-Diabetes: 10-year cardiovascular risk estimation in type 2 diabetes in Europe. Eur Heart J. 2023;44:2544–2556. [CrossRef]
- Berkelmans GFN, et al. Prediction of individual life-years gained without cardiovascular events from lipid, blood pressure, glucose, and aspirin treatment based on data of more than 500,000 patients with Type 2 diabetes mellitus. Eur Heart J. 2019;40:2899–2906. [CrossRef]
- Stevens RJ, Kothari V, Adler AI, Stratton IM. The UKPDS risk engine: a model for the risk of coronary heart disease in Type II diabetes (UKPDS 56). Clin Sci (Lond). 2001;101:671–679. [CrossRef]
- Kengne AP, et al. Contemporary model for cardiovascular risk prediction in people with type 2 diabetes. Eur J Cardiovasc Prev Rehabil. 2011;18:393–398. [CrossRef]
- Marx N, et al. 2023 ESC Guidelines for the management of cardiovascular disease in patients with diabetes. Eur Heart J. 2023;44:4043–4140. [CrossRef]
- Visseren FLJ, et al. 2021 ESC Guidelines on cardiovascular disease prevention in clinical practice. Eur Heart J. 2021;42:3227–3337. [CrossRef]
- American Diabetes Association Professional Practice Committee. 10. Cardiovascular Disease and Risk Management: Standards of Care in Diabetes—2026. Diabetes Care. 2026;49(Suppl 1):S216–S245. [CrossRef]
- Zinman B, et al. Empagliflozin, cardiovascular outcomes, and mortality in type 2 diabetes. N Engl J Med. 2015;373:2117–2128. [CrossRef]
- Husain M, et al. Oral semaglutide and cardiovascular outcomes in patients with type 2 diabetes. N Engl J Med. 2019;381:841–851. [CrossRef]
- McGuire DK, et al. Oral semaglutide and cardiovascular outcomes in high-risk type 2 diabetes. N Engl J Med. 2025;392:2001–2012. [CrossRef]
- Marso SP, et al. Semaglutide and cardiovascular outcomes in patients with type 2 diabetes. N Engl J Med. 2016;375:1834–1844. [CrossRef]
- Wanner C, et al. Empagliflozin and progression of kidney disease in type 2 diabetes. N Engl J Med. 2016;375:323–334. [CrossRef]
- Perkovic V, et al. Effects of semaglutide on chronic kidney disease in patients with type 2 diabetes. N Engl J Med. 2024;391:109–121. [CrossRef]
- Zinman B, et al. Semaglutide once weekly as add-on to SGLT-2 inhibitor therapy in type 2 diabetes (SUSTAIN 9): a randomised, placebo-controlled trial. Lancet Diabetes Endocrinol. 2019;7:356–367. [CrossRef]
- Labate AM, Moretti L, Villari P. Glycaemic and Cardiometabolic Effects of Oral Semaglutide in Patients Aged ≥65 Years with Type 2 Diabetes. Endocrines. 2026;7:8. [CrossRef]
- Labate AM, Cimino E, Giacomelli L, Ettori S, Oladeji OA, Agosti B. Molecular Pathways of Cardiometabolic Residual Risk in Type 2 Diabetes: Insulin Resistance, Metaflammation, and Liver–Kidney–Vascular Crosstalk. Int J Mol Sci. 2026;27:6170. [CrossRef]
- Labate AM, Cimino E, Giacomelli L, Ettori S, Oladeji OA, Agosti B. Artificial Intelligence in Non-Insulin-Treated Type 2 Diabetes: From Reactive Management to Anticipatory Care. Endocrines. 2026;7(3):40. [CrossRef]
- de Boer IH, et al. Diabetes Management in Chronic Kidney Disease: A Consensus Report by the American Diabetes Association (ADA) and Kidney Disease: Improving Global Outcomes (KDIGO). Diabetes Care. 2022;45:3075–3090. [CrossRef]
- Collins GS, et al. TRIPOD+AI statement: updated guidance for reporting clinical prediction models that use regression or machine learning methods. BMJ. 2024;385:e078378. [CrossRef]
- von Elm E, et al. The Strengthening the Reporting of Observational Studies in Epidemiology (STROBE) Statement: guidelines for reporting observational studies. PLoS Med. 2007;4:e296. [CrossRef]
- Zou H, Hastie T. Regularization and variable selection via the elastic net. J R Stat Soc Series B. 2005;67:301–320. [CrossRef]
- Breiman L. Random forests. Mach Learn. 2001;45:5–32. [CrossRef]
- Tibshirani R. Regression shrinkage and selection via the lasso. J R Stat Soc Series B. 1996;58:267–288. [CrossRef]
- Efthimiou O, et al. Developing clinical prediction models: a step-by-step guide. BMJ. 2024;386:e078276. [CrossRef]
- Riley RD, et al. Calculating the sample size required for developing a clinical prediction model. BMJ. 2020;368:m441. [CrossRef]
- Collins GS, et al. Evaluation of clinical prediction models (part 1): from development to external validation. BMJ. 2024;384:e074819. [CrossRef]
- Davis J, Goadrich M. The relationship between precision-recall and ROC curves. Proceedings of ICML. 2006. [CrossRef]
- Saito T, Rehmsmeier M. The precision-recall plot is more informative than the ROC plot when evaluating binary classifiers on imbalanced datasets. PLoS One. 2015;10:e0118432. [CrossRef]
- Steyerberg EW, et al. Assessing the performance of prediction models: a framework for traditional and novel measures. Epidemiology. 2010;21:128–138. [CrossRef]
- Van Calster B, et al. Calibration: the Achilles heel of predictive analytics. BMC Med. 2019;17:230. [CrossRef]
- Moons KGM, et al. PROBAST+AI: an updated quality, risk of bias, and applicability assessment tool for prediction models using regression or artificial intelligence methods. BMJ. 2025;388:e082505. [CrossRef]
- Wolff RF, et al. PROBAST: a tool to assess the risk of bias and applicability of prediction model studies. Ann Intern Med. 2019;170:51–58. [CrossRef]
- Riley RD, Collins GS. Stability of clinical prediction models developed using statistical or machine learning methods. Biom J. 2023;65:e2200302. [CrossRef]
- Vickers AJ, Elkin EB. Decision curve analysis: a novel method for evaluating prediction models. Med Decis Making. 2006;26:565–574. [CrossRef]
- Christodoulou E, et al. A systematic review shows no performance benefit of machine learning over logistic regression for clinical prediction models. J Clin Epidemiol. 2019;110:12–22. [CrossRef]
- KDIGO CKD Work Group. KDIGO 2024 Clinical Practice Guideline for the Evaluation and Management of Chronic Kidney Disease. Kidney Int. 2024;105(4S):S117–S314. [CrossRef]
- Riley RD, et al. Evaluation of clinical prediction models (part 2): how to undertake an external validation study. BMJ. 2024;384:e074820. [CrossRef]
Figure 1.
Discrimination and calibration of elastic net predictions for ≥10% relative reduction in calibrated P1Y. Each participant contributed one prediction formed by averaging the three predictions made while that participant was held out in the repeated outer cross-validation. Error bars in the calibration panel are exact binomial 95% intervals within groups of approximately equal size; they do not account for the repeated model-fitting procedure.
Figure 1.
Discrimination and calibration of elastic net predictions for ≥10% relative reduction in calibrated P1Y. Each participant contributed one prediction formed by averaging the three predictions made while that participant was held out in the repeated outer cross-validation. Error bars in the calibration panel are exact binomial 95% intervals within groups of approximately equal size; they do not account for the repeated model-fitting procedure.
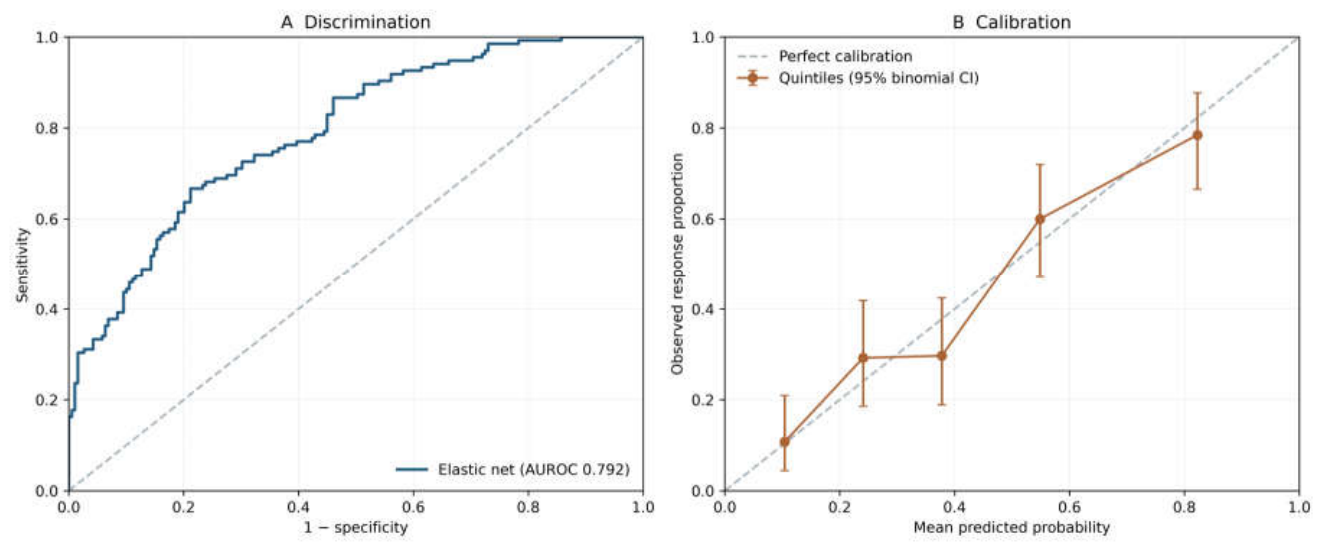
Table 1.
Baseline characteristics in the primary analysis cohort. Continuous values are median (25th–75th percentile).
Table 1.
Baseline characteristics in the primary analysis cohort. Continuous values are median (25th–75th percentile).
| Characteristic |
Overall (n = 324) |
Semaglutide (n = 137) |
Empagliflozin (n = 101) |
Combination (n = 86) |
| Age, years | 67 (59–74) | 64 (56–71) | 72 (64–77) | 69 (61–75) |
| Female, n (%) | 113 (34.9) | 46 (33.6) | 44 (43.6) | 23 (26.7) |
| Smoking, n (%) | 122 (37.7) | 57 (41.6) | 39 (38.6) | 26 (30.2) |
| Diabetes duration, years | 10 (3–15) | 10 (3–14) | 10 (3–14) | 11 (5–15) |
| BMI, kg/m² | 30.32 (27.02–34.06) | 30.12 (27.55–34.31) | 28.91 (25.91–32.47) | 31.13 (27.76–34.68) |
| HbA1c, % | 7.55 (7.00–8.51) | 7.60 (7.00–8.55) | 7.50 (6.91–8.55) | 7.60 (7.00–8.38) |
| Systolic BP, mmHg | 135 (125–150) | 130 (130–140) | 130 (120–150) | 135 (130–150) |
| eGFR, mL/min/1.73 m² | 79.18 (61.31–92.58) | 84.95 (69.28–96.25) | 76.70 (59.00–91.36) | 70.89 (54.77–85.72) |
| Total cholesterol, mg/dL | 168.5 (140–191) | 172 (146–191) | 159 (134–188) | 172 (140–198) |
| HDL cholesterol, mg/dL | 46 (40–53) | 46 (40–55) | 46 (40–52) | 45 (40–52) |
| Albuminuria, mg/24 h | 35.5 (16.4–72.5) | 32 (15–59) | 28 (11–56) | 50.5 (27–92.8) |
| Baseline P1Y, % | 1.83 (1.15–2.89) | 1.55 (0.89–2.43) | 2.03 (1.26–3.26) | 2.15 (1.30–3.20) |
BP, blood pressure; P1Y, calibrated one-year cardiovascular risk estimate. Albuminuria was measured in mg/24 h, as confirmed by the investigators.
Table 2.
Performance in nested repeated five-fold cross-validation. Values are mean across 15 held-out test folds, except fold SD.
Table 2.
Performance in nested repeated five-fold cross-validation. Values are mean across 15 held-out test folds, except fold SD.
| Predictor/model | AUROC | Fold SD | Average precision | Brier |
| Baseline P1Y alone | 0.492 | 0.071 | 0.438 | 0.245 |
| Elastic net, full baseline whitelist | 0.788 | 0.043 | 0.755 | 0.183 |
| Random forest, full baseline whitelist | 0.780 | 0.047 | 0.740 | 0.190 |
| Elastic net, without treatment group | 0.783 | 0.043 | 0.754 | 0.183 |
Disclaimer/Publisher’s Note: The statements, opinions and data contained in all publications are solely those of the individual author(s) and contributor(s) and not of MDPI and/or the editor(s). MDPI and/or the editor(s) disclaim responsibility for any injury to people or property resulting from any ideas, methods, instructions or products referred to in the content. |
© 2026 by the authors. Licensee MDPI, Basel, Switzerland. This article is an open access article distributed under the terms and conditions of the Creative Commons Attribution (CC BY) license (http://creativecommons.org/licenses/by/4.0/).
Copyright: This open access article is published under a Creative Commons CC BY 4.0 license, which permit the free download, distribution, and reuse, provided that the author and preprint are cited in any reuse.