

Submitted:
25 September 2026
Posted:
28 September 2026
You are already at the latest version
Abstract
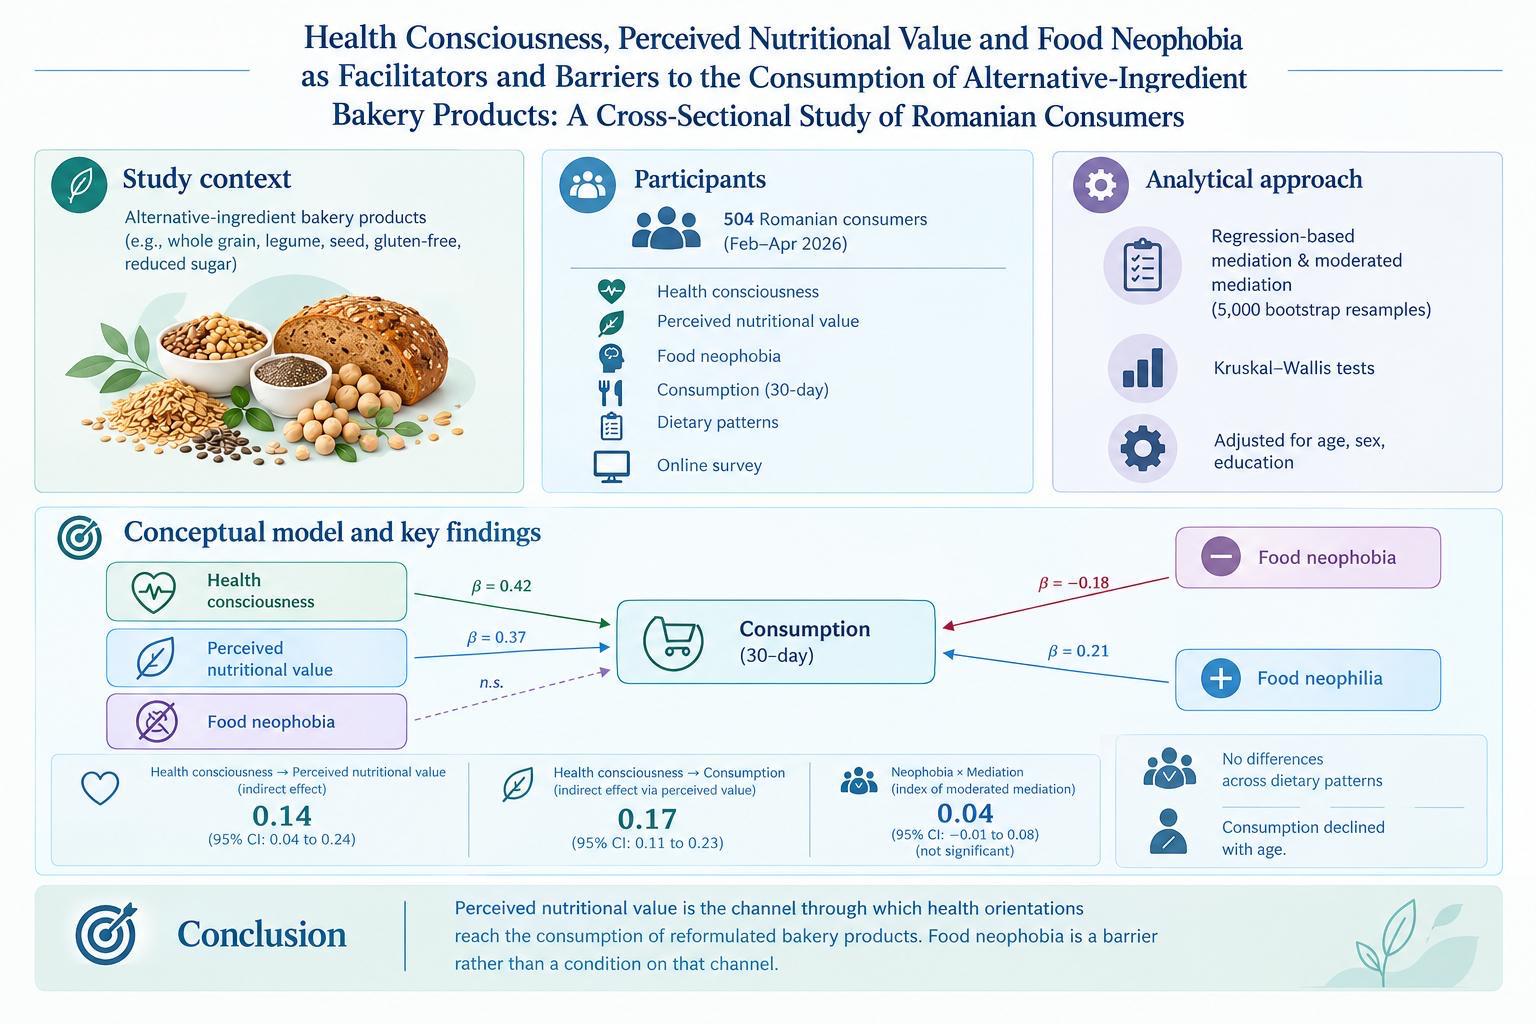
Background/Objectives: Bakery and confectionery products reformulated with alternative ingredients are increasingly present in the retail food environment, but their contribution to healthier diets depends on whether consumers eat them. This study examined how health consciousness and perceived nutritional value relate to the recent consumption of such products among Romanian consumers, whether food neophobia weakens these associations, and whether consumption differs across dietary patterns. Methods: A cross-sectional online survey of 504 consumers (February to April 2026) measured health consciousness, perceived nutritional value, health and natural-content food choice motives, food neophobia and 30-day consumption on five-point scales. Regression-based mediation and moderated mediation with 5000 bootstrap resamples and Kruskal-Wallis tests were adjusted for age group, sex and education. Results: The scales were reliable (alpha 0.77 to 0.94) and the measurement model fitted acceptably (CFI = 0.968; SRMR = 0.039). Health consciousness partially mediated the association between motives and perceived nutritional value (indirect effect 0.14, 95% CI 0.04 to 0.24). Perceived nutritional value fully mediated the association between health consciousness and consumption (indirect effect 0.17, 95% CI 0.11 to 0.23; direct effect 0.04). The neophobic and neophilic items formed two uncorrelated facets: neophobia lowered consumption directly (β= -0.18) without moderating the mediated path (index of moderated mediation 0.04, 95% CI -0.01 to 0.08), whereas openness to new foods raised it (β = 0.21). Consumption did not differ across dietary patterns (p = 0.130) but declined with age. Conclusions: Perceived nutritional value is the channel through which health orientations reach the consumption of reformulated bakery products. Food neophobia is an additive barrier rather than a condition on that channel, so credible nutritional information and familiar product formats are complementary levers for widening uptake.
Keywords:
food environment
; food choice
; health consciousness
; perceived nutritional value
; food neophobia
; alternative ingredients
; bakery products
; food reformulation
; dietary patterns
; Romania
1. Introduction
Diets high in refined grains, free sugars and energy-dense processed foods are among the leading modifiable contributors to the global burden of non-communicable disease [1,2]. Ultra-processed foods, as defined by the Nova classification, have been associated with a wide range of adverse health outcomes in an umbrella review of meta-analyses [3,4]. Across 22 European countries, the share of dietary energy from ultra-processed foods and drinks ranged from 14% to 44%, and fine bakery wares together with soft drinks were the most frequent main contributors. Romania was among the countries with the lowest share [5], which leaves room to prevent the increase observed elsewhere. National household budget data nevertheless indicate that Romanian diets shifted towards higher fat and carbohydrate intakes after 2020 [6].
Bakery and confectionery products are therefore a logical target for reformulation. Bread and related products are eaten daily in most households, and their nutritional quality depends largely on how refined the raw materials are [7]. Replacing part of the refined wheat flour with whole-grain, legume or other alternative flours increases fibre, protein and micronutrient content, and recent experimental work shows that such substitution can lower postprandial glycaemic responses without reducing acceptability [7,8]. Sugar reduction with functional ingredients and fibre-enriched flour mixes follow the same logic [9,10]. Whether reformulated products change diets is not decided in the laboratory, however. Consumer acceptance of whole-grain products remains limited even where they are widely available [11], and a previous analysis of the survey used here found that Romanian consumers' purchase intentions for alternative-ingredient bakery products depended on how they appraised the nutritional value of these products [12].
The food environment comprises the availability, affordability, convenience, promotion, quality and sustainability properties of the foods that consumers encounter, and it is the interface at which changes in the food system reach individual diets [13,14]. Monitoring frameworks such as INFORMAS treat product composition as one of the characteristics of the food environment to be tracked over time [15]. Reformulated bakery products enlarge the healthier segment of this environment. The benefit reaches the population only if the products are chosen repeatedly, so psychological facilitators and barriers at the consumer level condition the dietary yield of a product-level intervention. Two sets of factors are examined here: health-related orientations that may facilitate uptake, and food neophobia, which may impede it.
Health consciousness is a stable disposition to attend to one's health and to act on that concern [16]. Health-conscious consumers are less prone to the intuition that healthy food tastes worse [17], and health consciousness predicts attitudes and intentions towards functional and healthy foods in samples from Taiwan, Peru and China [18,19,20]. Health and natural content are two of the nine motives measured by the Food Choice Questionnaire [21]; the factor structure of this instrument is invariant across Belgian, Hungarian and Romanian consumers, and health ranks among the five most important motives in all three countries [22]. Health concern influences attitudes towards healthy eating through these motives [23]. Dispositions of this kind do not, by themselves, tell consumers whether a particular product is worth choosing. Consumption value theory and perceived value theory hold that purchase depends on the appraisal of the benefits a product offers relative to what is given up [24,25], and health consciousness has been shown to operate on willingness to consume healthy foods through the dimensions of perceived value [26]. For reformulated bakery products, the relevant appraisal is perceived nutritional value, defined as the consumer's judgement that products made with alternative ingredients provide genuine nutritional benefits rather than a healthier image. A four-item scale for this construct was developed and validated in the earlier report on the present survey, where perceived nutritional value predicted both willingness to pay and purchase intention [12].
Intentions are imperfect proxies for behaviour. The gap between favourable attitudes and actual choices is well documented for sustainable food [27], and only strong, stable intentions predict behaviour closely [28,29,30]. The present study therefore uses self-reported consumption of alternative-ingredient bakery products during the previous 30 days as the outcome, rather than intention.
Food neophobia, the trait reluctance to eat novel or unfamiliar foods, is measured with the Food Neophobia Scale of Pliner and Hobden [31], whose unidimensional structure has been confirmed across countries [32]; several shorter derivatives are in use [33,34]. The trait is partly heritable, correlates negatively with openness, and is associated with lower liking and use frequency of fruit, vegetables and fish [35,36]. In Finnish and Estonian adults, neophobia was associated with lower dietary quality, higher body mass index, adverse metabolic biomarkers and a higher incidence of type 2 diabetes [37,38]. Neophobic adults report lower intake and lower liking across many commonplace foods [38], adhere less to the Mediterranean diet and consume more sweets and soft drinks [39], although the relation with diet quality may be non-linear in young adults [40]. One mechanism is directly relevant here: as neophobia increases, familiarity and convenience gain importance as food choice motives, whereas health and natural content lose importance [41]. Neophobia could therefore blunt the translation of health orientations into the consumption of products whose ingredients are unfamiliar. Reviews of novel food acceptance consistently list neophobia, unfamiliarity and poor product knowledge as barriers, and perceived healthiness as a driver [42,43,44,45,46,47]. Alternative-ingredient bakery products differ from insects or cultured meat in one respect: the format is familiar and only the ingredient is new. Disguising an unfamiliar ingredient in a familiar food increases willingness to consume it [48], so neophobia may act as a moderator of the appraisal-behaviour link rather than as a strong direct barrier. A national adaptation of the Food Neophobia Scale found that 18% of Romanian adults were neophobic, a higher share than in Korea, Hungary or Italy [49,50,51], but how neophobia interacts with health motives in bakery product choices has not been studied in this population.
Self-reported dietary pattern provides a sociocultural context for these processes. Vegetarians, vegans and flexitarians differ in the weight they give to health, environmental and animal-welfare motives [52,53,54,55], and vegetarians report lower food neophobia than omnivores [56]. Adoption of gluten-free diets by people without coeliac disease has increased [57], driven partly by the perception that gluten avoidance is a healthy lifestyle choice [58,59]. Because many alternative-ingredient bakery products are gluten-free, legume-based or enriched with plant protein, their consumption may differ across dietary patterns, although the small size of these groups in general population samples limits the precision of such comparisons. Romanian consumers relate food choice to health but know little about the functional food concept [60], judge healthiness mainly from ingredients, nutrition facts and additives [61], and are sensitive to the price of novel foods [62].
This study examined, in the sample of 504 Romanian consumers described previously [12], the questionnaire domains that were collected for exploratory purposes and were not part of the earlier structural model. Four hypotheses were tested (Figure 1). H1: health consciousness mediates the association between health and natural-content food choice motives and perceived nutritional value. H2: perceived nutritional value mediates the association between health consciousness and consumption of alternative-ingredient bakery products during the previous 30 days. H3: food neophobia weakens the paths from perceived nutritional value and from health consciousness to consumption, so that the indirect effect in H2 is smaller among more neophobic consumers. H4: consumption differs across self-reported dietary patterns after adjustment for age group and education. By identifying consumer-level facilitators and barriers that condition the dietary effect of a healthier product offer, the study addresses the question of how the food environment shapes diet in a Central and Eastern European setting.
2. Materials and Methods
2.1. Study Design and Participants
The study is a cross-sectional analysis of an online consumer survey conducted in Romania, reported according to the STROBE recommendations [63]. The self-administered questionnaire was built in Google Forms (Google LLC, Mountain View, CA, USA) and distributed through social media platforms, university networks and consumer-interest groups by convenience and snowball sampling between February and April 2026. Participation was voluntary and anonymous. The introductory page described the objectives, the completion time (5 to 8 min) and the confidentiality procedures, and consent had to be confirmed actively before the items were displayed. The minimum age was 15 years; respondents younger than 18 years participated only with the written consent of a parent or legal guardian. Of 556 submitted questionnaires, 52 were incomplete and were excluded, leaving 504 complete responses. All items were mandatory, so the analysed variables have no missing values. The development, translation, cognitive pretesting and psychometric validation of the instrument, together with the structural model linking food choice motives, green values, health consciousness, perceived nutritional value, willingness to pay and purchase intention, were reported previously [12]. The present analysis uses three of those constructs together with the food neophobia, consumption and dietary pattern domains that were collected in the same survey but were not included in that model.
The study was approved by the Research Ethics Subcommittee of "Aurel Vlaicu" University of Arad (approval no. 16, 5 February 2026) and conducted in accordance with the Declaration of Helsinki.
2.2. Measures
All attitudinal and behavioural items were rated on a five-point agreement scale from 1 (strongly disagree) to 5 (strongly agree); this format yields measurement quality equal to or better than longer scales while reducing respondent burden [64]. Construct scores were computed as the mean of their items (Table 1). Health consciousness (HC) was measured with four items adapted from Gould's Health Consciousness Scale [16]. Perceived nutritional value (PNV) was measured with the four-item scale developed in the validation study [12]. Health and natural-content food choice motives (FCM) were measured with four items drawn from the corresponding dimensions of the Food Choice Questionnaire [21]. Food neophobia was measured with four items adapted from the Food Neophobia Scale [31]: two items express reluctance towards unfamiliar foods (FN1, FN4) and two express liking for and curiosity about new foods (FN2, FN3). The analysis plan specified a single four-item score with the neophilic items reverse-scored. Because the item analysis showed that the neophilic items did not load with the neophobic items (Section 3.3), the two neophobic items were used as the food neophobia score (FN) and the two neophilic items as a separate openness-to-new-foods score (OPN); the pre-specified four-item score is reported for completeness. Consumption (CONS) was measured with four study-specific items referring to the previous 30 days: having consumed alternative-ingredient bakery or confectionery products, having chosen them instead of conventional products, having bought them frequently, and their being a regular part of the diet. Socio-demographic items covered age group (under 18, 18-25, 26-35, 36-50, over 50 years), sex, residence, education (five levels from lower secondary to doctorate), net monthly income (five bands) and self-reported dietary pattern (omnivore, flexitarian, vegetarian, vegan, gluten-free).
2.3. Hypothesised Model
Figure 1 summarises the hypothesised relationships. H1 is a simple mediation with FCM as predictor, HC as mediator and PNV as outcome. H2 is a simple mediation with HC as predictor, PNV as mediator and CONS as outcome. H3 adds food neophobia as a moderator of the PNV to CONS path and of the direct HC to CONS path, which corresponds to a conditional process model in which the indirect effect of HC on CONS varies with neophobia [65]. H4 compares CONS across dietary patterns. Because the vegetarian (n = 16), vegan (n = 5) and gluten-free (n = 20) groups are small, the primary comparison contrasts omnivores, flexitarians and a combined restricted-diet group (vegetarian, vegan and gluten-free); the five-category comparison is reported as an exploratory analysis. Age group, sex and education were specified as covariates in all regression models because health orientations, neophobia and consumption of novel products vary with these characteristics [37,40,49].
2.4. Statistical Analysis
Item and construct distributions were described with the median and interquartile range (IQR), the mean and standard deviation (SD), skewness, excess kurtosis and floor and ceiling effects, defined as the percentage of respondents selecting the lowest or highest response category and considered notable above 15%. Normality of construct scores was examined with the Shapiro-Wilk test. Internal consistency was estimated with Cronbach's alpha and its 95% confidence interval [66] and with McDonald's omega, which does not assume equal item loadings [67]; for two-item scales the Spearman-Brown coefficient replaces omega. Corrected item-total correlations and inter-item correlations were inspected. Because reversed items are a known source of method bias [68], the dimensionality of the four neophobia items was examined before scoring, with the raw inter-item correlations, the eigenvalues of the correlation matrix and a two-factor exploratory solution (minimum residual extraction, oblimin rotation); the decision rule was to keep the pre-specified four-item score if the reverse-worded items loaded on the same factor as the neophobic items and to analyse the two facets separately otherwise. The measurement model was tested with confirmatory factor analysis by maximum likelihood. Fit was judged against the comparative fit index (CFI) and Tucker-Lewis index (TLI), with values of 0.95 or above indicating good and 0.90 or above acceptable fit, the root mean square error of approximation (RMSEA) and the standardized root mean square residual (SRMR), with values at or below 0.08 considered acceptable [69]. Convergent validity required standardized loadings of about 0.70 or above, composite reliability of 0.70 or above and average variance extracted of 0.50 or above [70]; discriminant validity was assessed with the heterotrait-monotrait ratio, using 0.85 as the threshold [71]. A single-factor model was estimated for comparison, and Harman's single-factor test was used as a screen for common method variance [72].
Associations between construct scores were quantified with Spearman rank correlations and percentile bootstrap 95% confidence intervals from 2000 resamples, and interpreted according to Schober et al. [73]. Construct scores were treated as approximately interval for the regression models, which is defensible for multi-item Likert composites [74]. Mediation was estimated with ordinary least squares regression on standardized scores, following the causal steps logic of Baron and Kenny [75] but basing inference on the indirect effect itself: the product of the a and b paths was tested with percentile bootstrap confidence intervals from 5000 resamples [76,77], and the type of mediation was classified according to Zhao et al. [78]. Standard errors of the regression coefficients were of the HC3 heteroscedasticity-consistent type. For H3, the moderator and the predictors were mean-centred, product terms for HC × FN and PNV × FN were added to the outcome equation, and the index of moderated mediation together with the conditional indirect effects at one SD below the mean, at the mean and at one SD above the mean of the moderator were estimated with the same bootstrap procedure; the analysis was repeated with the openness-to-new-foods score and with the pre-specified four-item score as moderators. A serial model (FCM → HC → PNV → CONS) combined H1 and H2. With N = 504 the study had 80% power to detect an indirect effect whose two paths are each of small to medium size (standardized 0.26) with bootstrap methods, and approached the sample size required when both paths are small (0.14) [79]; effect sizes were interpreted with the conventions of Cohen [80].
Differences between dietary patterns were tested with the Kruskal–Wallis test [81], with epsilon-squared as the effect size, followed by Dunn’s pairwise comparisons with Bonferroni correction [82]. An ordinary least squares regression of the consumption score on dietary pattern (omnivore as reference), age group, sex, and education completed the adjusted comparison, and a regression on all constructs and covariates summarised their independent contributions. A pre-specified sensitivity analysis repeated the H2 and H3 models after excluding respondents younger than 18 years. Two-sided p-values below 0.05 were considered statistically significant. Statistical analyses were performed using R Statistical Software (Version 4.5.1; R Core Team, 2025), within the RStudio environment (Version 2024.12.1; Posit Team, 2025), and JASP (Version 0.98; JASP Team). Figures were generated using R and JASP based directly on the validated source data, without imputation or extrapolation.
3. Results
3.1. Sample Characteristics
The sample comprised 504 respondents (Table 2). Most participants were women (70.8%), lived in urban areas (70.6%), and had at least a bachelor’s degree (62.0%); 12.5% were aged 15–17 years. Most respondents reported an omnivorous diet (76.2%), followed by flexitarian (15.7%) and restricted dietary patterns (8.1%; gluten-free, 4.0%; vegetarian, 3.2%; vegan, 1.0%).
3.2. Item Distributions
Item-level descriptive statistics are presented in Table 3. Health consciousness and health and natural-content food choice motive items had median scores of 4, with ceiling effects ranging up to 39.1%. Perceived nutritional value items were closer to the scale midpoint, with ceiling effects ranging from 12.1% to 16.7%. Mean scores for the two neophobic items were 2.82 and 2.91, whereas those for the two neophilic items were 3.58 and 3.65. Consumption item means ranged from 2.86 to 3.13, with floor effects of 9.9%–13.9% and ceiling effects of 7.9%–10.9%. Across all items, absolute skewness was <2 and absolute excess kurtosis was <7. Construct scores showed departures from normality (Shapiro–Wilk, all p < 0.001).
3.3. Reliability and Measurement Model
Internal consistency was high for health consciousness (α = 0.938), perceived nutritional value (α = 0.931), and health and natural-content motives (α = 0.914), with similar McDonald’s omega values (Table 4). The three-factor model for these constructs showed acceptable fit (χ² = 191.8, df = 51; CFI = 0.975; TLI = 0.967; RMSEA = 0.074; SRMR = 0.028) and fitted better than the single-factor model (CFI = 0.637; RMSEA = 0.272; Δχ² = 1873.57, df = 3, p < 0.001).
The four food neophobia items separated into two factors. The correlation was 0.63 between the two neophobic items and 0.78 between the two neophilic items, whereas cross-correlations ranged from −0.07 to 0.09. Two eigenvalues exceeded 1 (1.79 and 1.63). In the two-factor solution, FN1 and FN4 loaded on one factor (0.81 and 0.79), and FN2 and FN3 on the second factor (0.83 and 0.94), with cross-loadings <0.10. The pre-specified four-item reverse-scored score had α = 0.533, compared with α = 0.772 (95% CI: 0.728–0.809) for the neophobic subscale and α = 0.874 (95% CI: 0.850–0.894) for the neophilic subscale. The two subscales were weakly correlated (r = 0.018) and were therefore analyzed separately as food neophobia (FN) and openness to new foods (OPN). The consumption scale had α = 0.920. The six-construct confirmatory model showed acceptable fit (χ² = 420.98, df = 155; χ²/df = 2.72; CFI = 0.968; TLI = 0.961; RMSEA = 0.058; SRMR = 0.039). Standardized factor loadings ranged from 0.68 to 0.94, composite reliability was ≥0.79, and average variance extracted was ≥0.66. All heterotrait–monotrait ratios were <0.85, with the highest value observed between health consciousness and health and natural-content motives (HTMT = 0.77; latent correlation = 0.76).
3.4. Correlations between Constructs
Health consciousness was positively correlated with perceived nutritional value (ρ = 0.386, 95% CI: 0.302–0.465) and health and natural-content motives (ρ = 0.676, 95% CI: 0.615–0.731) (Table 5, Figure 2). Health and natural-content motives were also positively correlated with perceived nutritional value (ρ = 0.443). Consumption was positively correlated with perceived nutritional value (ρ = 0.373, 95% CI: 0.285–0.454) and openness to new foods (ρ = 0.313), and negatively correlated with food neophobia (ρ = −0.272, 95% CI: −0.361 to −0.181). Smaller positive correlations were observed between consumption and health consciousness (ρ = 0.116, p = 0.009) and health and natural-content motives (ρ = 0.183). Food neophobia was negatively correlated with the three health-related constructs (ρ = −0.241 to −0.197), whereas openness to new foods was positively correlated with them (ρ = 0.324–0.384). Food neophobia and openness to new foods were not significantly correlated (ρ = 0.074, p = 0.099).
3.5. Hypothesis 1: Health Consciousness as a Mediator between Motives and Perceived Nutritional Value
In the unadjusted model (Table 6, Model 1), health and natural-content motives were positively associated with health consciousness (a = 0.710, p < 0.001), which was, in turn, positively associated with perceived nutritional value after accounting for motives (b = 0.196, p = 0.006). The direct association between motives and perceived nutritional value remained significant (c′ = 0.346, p < 0.001). The indirect effect through health consciousness was 0.139 (95% bootstrap CI: 0.044–0.240). After adjustment for age group, sex, and education (Model 2), the estimates were similar (a = 0.704, p < 0.001; b = 0.195, p = 0.007; c′ = 0.381, p < 0.001). The indirect effect was 0.137 (95% bootstrap CI: 0.044–0.237), accounting for 26% of the total effect (c = 0.519). This pattern was consistent with complementary mediation. The adjusted model explained 50.5% of the variance in health consciousness and 28.6% of the variance in perceived nutritional value.
3.6. Hypothesis 2: Perceived Nutritional Value as a Mediator between Health Consciousness and Consumption
In the adjusted model (Table 7, Model 2), health consciousness was positively associated with perceived nutritional value (a = 0.454, p < 0.001), and perceived nutritional value was positively associated with consumption after accounting for health consciousness and the covariates (b = 0.377, p < 0.001). The total association between health consciousness and consumption was significant (c = 0.215, p < 0.001), whereas the direct association was not significant after perceived nutritional value was included in the model (c′ = 0.044, p = 0.364). The indirect effect through perceived nutritional value was 0.171 (95% bootstrap CI: 0.113–0.235), consistent with an indirect-only mediation pattern. The unadjusted model yielded similar estimates, with an indirect effect of 0.173 (95% bootstrap CI: 0.117–0.236) and a non-significant direct effect (c′ = −0.004, p = 0.931). The adjusted model explained 18.5% of the variance in consumption. These findings were consistent with H2 In the serial model combining H1 and H2 (FCM → HC → PNV → CONS; Figure S1), the serial indirect effect was 0.046 (95% bootstrap CI: 0.015–0.085), while the indirect effect of health and natural-content motives through perceived nutritional value was 0.129 (95% bootstrap CI: 0.072–0.196). The direct association between health consciousness and consumption was not significant (β = −0.051, p = 0.375), whereas the direct association between health and natural-content motives and consumption remained significant (β = 0.166, p = 0.010).
3.7. Hypothesis 3: Moderation by Food Neophobia
With food neophobia as the moderator (Table 8), higher neophobia was associated with lower consumption (β = −0.177, p < 0.001). Neither the HC × FN interaction (β = −0.059, p = 0.266) nor the PNV × FN interaction (β = 0.082, p = 0.106) was statistically significant. The index of moderated mediation was 0.037 (95% bootstrap CI: −0.008 to 0.078), with the confidence interval including zero. The conditional indirect effect of health consciousness on consumption through perceived nutritional value was 0.123 (95% bootstrap CI: 0.056–0.202) at 1 SD below the mean of food neophobia, 0.160 (95% bootstrap CI: 0.107–0.219) at the mean, and 0.198 (95% bootstrap CI: 0.129–0.266) at 1 SD above the mean (Figure 3). Sensitivity analyses yielded similar results. Openness to new foods was positively associated with consumption (β = 0.206, p < 0.001), while its index of moderated mediation was 0.040 (95% bootstrap CI: −0.004 to 0.086). For the pre-specified four-item reverse-scored neophobia score, the association with consumption was negative (β = −0.330, p < 0.001), and the index of moderated mediation was 0.026 (95% bootstrap CI: −0.019 to 0.070).
3.8. Hypothesis 4: Dietary Patterns
Consumption scores did not differ significantly across the three dietary patterns (Kruskal–Wallis H = 4.09, df = 2, p = 0.130, ε² = 0.008; Table 9, Figure 4). Median consumption scores were 3.00 for omnivores, 3.00 for flexitarians, and 2.50 for respondents following restricted diets. None of the pairwise comparisons was statistically significant after Bonferroni correction (smallest adjusted p = 0.132). In the regression model adjusted for age group, sex, and education, the standardized differences in consumption relative to omnivores were β = 0.162 for flexitarians (p = 0.174) and β = −0.263 for restricted diets (p = 0.150). Age group was significantly associated with consumption (β = −0.123 per category, p = 0.001). In the exploratory analysis using five dietary categories, the overall difference in consumption was not statistically significant (H = 8.45, df = 4, p = 0.076). No statistically significant differences across dietary patterns were observed for perceived nutritional value, health consciousness, health and natural-content motives, food neophobia, or openness to new foods (all p ≥ 0.300).
3.9. Sensitivity Analyses and Common Method Variance
After excluding respondents younger than 18 years (n = 441), the indirect effect of health consciousness on consumption through perceived nutritional value was 0.160 (95% CI: 0.100–0.225), and the index of moderated mediation for food neophobia was 0.039 (95% CI: −0.007 to 0.082). In the regression model including all five constructs, dietary pattern, and the covariates, 25.7% of the variance in consumption was explained, with a maximum variance inflation factor of 2.64. Perceived nutritional value (β = 0.253, p < 0.001), openness to new foods (β = 0.230, p < 0.001), and food neophobia (β = −0.209, p < 0.001) were significantly associated with consumption. Health consciousness (β = −0.064, p = 0.241) and health and natural-content motives (β = 0.025, p = 0.717) were not significantly associated with consumption in this model. Harman’s single-factor test applied to the 12 health-related items showed that the first unrotated factor accounted for 57.7% of the total variance. The single-factor confirmatory model showed poorer fit than the three-factor model reported in Section 3.3, while all heterotrait–monotrait ratios remained below 0.85. When all 20 items were included in Harman’s single-factor test, the first unrotated factor accounted for 41.1% of the total variance.
4. Discussion
This study examined whether health-related orientations were associated with favourable evaluations and consumption of reformulated bakery products and whether food neophobia and dietary pattern were related to these associations among Romanian consumers. Health consciousness, perceived nutritional value, and health and natural-content motives showed high internal consistency and were represented by three distinct, although correlated, factors. Health consciousness accounted for approximately 26% of the total association between health and natural-content motives and perceived nutritional value, a pattern consistent with partial mediation and H1. Perceived nutritional value accounted for the indirect association between health consciousness and consumption during the previous 30 days, while the direct association was not statistically significant after perceived nutritional value was included in the model, a pattern consistent with indirect-only mediation and H2. The four food neophobia items separated into neophobic and neophilic facets that showed little correlation with each other; food neophobia was negatively associated with consumption but did not significantly moderate the indirect association through perceived nutritional value, a pattern that did not support the moderation proposed in H3. Consumption did not differ significantly across dietary patterns, as proposed in H4, whereas lower consumption was observed across increasing age categories.
4.1. From General Health Orientations to a Product-Specific Appraisal
The validation study modelled health consciousness as a terminal construct and identified food choice motives as its strongest predictor (β = 0.523), together with a smaller direct path from motives to perceived nutritional value (β = 0.218) [12]. In the present analysis, health consciousness may partly account for the association between health and natural-content motives and the appraisal of alternative-ingredient bakery products. Respondents who placed greater importance on health and natural content also reported higher health consciousness, which was, in turn, associated with a more favourable evaluation of the nutritional value of these products. However, the direct association between motives and perceived nutritional value remained significant and was approximately 2.8 times larger than the indirect association (0.38 vs. 0.14). This pattern suggests that health consciousness may represent one, but not the only, pathway linking health and natural-content motives to product-specific nutritional appraisal. One possible explanation is that the natural-content component of food choice motives may be particularly relevant to the evaluation of products containing alternative ingredients, which may be perceived as less refined or more natural. This interpretation is consistent with the clean-label literature [80] and with evidence indicating that Romanian consumers use ingredients, nutrition information, and additives as important cues when assessing food healthiness [61].
The direction of the association between health and natural-content motives and health consciousness cannot be established from the present cross-sectional data. Sun [23] modelled health concern as an antecedent of food choice motives, with motives mediating its association with attitudes towards healthy eating, indicating that an alternative ordering of these constructs is also plausible. In the present study, the two dispositions were strongly related (latent correlation = 0.76) but remained empirically distinguishable. Both were moderately associated with perceived nutritional value, suggesting that closely related general health orientations may contribute differently to consumers’ product-specific nutritional appraisal.
4.2. From Appraisal to Consumption
Perceived nutritional value, which was associated with willingness to pay and purchase intention in the validation study [12], was also positively associated with self-reported consumption in the present analysis. The indirect association between health consciousness and 30-day consumption through perceived nutritional value was statistically significant, whereas the direct association between health consciousness and consumption was close to zero and not statistically significant after perceived nutritional value was included in the model. The standardized indirect effect was 0.17, compared with a direct path of 0.275 from perceived nutritional value to purchase intention in the previous validation study [12]. Although these estimates refer to different outcomes and models and should therefore not be directly equated, their direction and magnitude suggest that perceived nutritional value may remain relevant when the outcome shifts from purchase intention to self-reported recent consumption. This interpretation is broadly consistent with evidence that intentions can be associated with behaviour when they are strong and stable [28,29] and with the value–appraisal–behaviour sequence proposed within consumption value theory [24,25]. Health consciousness was not directly associated with consumption after perceived nutritional value was included in the model. Similarly, in the full regression including all five constructs, health and natural-content motives were not independently associated with consumption, whereas perceived nutritional value remained positively associated with consumption. These findings suggest that product-specific nutritional appraisal may be more closely associated with reported consumption of alternative-ingredient bakery products than general health-related orientations alone. Similar patterns involving indirect associations through perceived value, attitudes, or desire have been reported for healthy food brands, where health consciousness was related to behavioural outcomes through perceived value dimensions [26], and for health and wellness foods, where attitude and desire mediated the association between health consciousness and purchase intention [20]. Given the cross-sectional design of the present study, however, these findings should be interpreted as statistical associations and do not establish that perceived nutritional value causally links health consciousness to subsequent consumption.
4.3. Food Neophobia and Openness to New Foods
Food neophobia did not significantly moderate the associations of perceived nutritional value or health consciousness with consumption. The conditional indirect association was positive across low, average, and high levels of food neophobia, while the index of moderated mediation included zero. Sensitivity analyses using the neophilic facet and the pre-specified four-item score yielded similar results. In contrast, food neophobia was directly and negatively associated with consumption, with an adjusted coefficient of approximately −0.18 SD per SD increase in neophobia, whereas openness to new foods was positively associated with consumption (approximately +0.21 SD per SD increase). These findings suggest that food neophobia and openness to new foods may be associated with the overall level of consumption rather than with the strength of the indirect association between health consciousness, perceived nutritional value, and consumption. One possible explanation may relate to the characteristics of the product category. Bakery and confectionery products made with alternative ingredients retain familiar formats, such as bread, biscuits, or cakes, while differing primarily in their ingredient composition. Familiar product formats may reduce some of the uncertainty associated with novel ingredients, potentially allowing nutritional appraisal to remain relevant across different levels of food neophobia. Previous research suggests that incorporating unfamiliar ingredients into familiar foods may increase willingness to consume them [48]. At the same time, neophobic adults have been reported to consume and like fewer commonly consumed foods [38] and to place greater importance on familiarity and convenience and less importance on health and natural content when making food choices [42]. These tendencies may partly explain the negative association between food neophobia and consumption observed in the present study, although the cross-sectional design does not allow the underlying mechanism to be established.
The measurement findings also warrant consideration. The two neophobic and two neophilic items, originally intended to form a single reverse-scored scale, separated into two factors that were almost uncorrelated (r = 0.02). Reverse-worded items are a recognized potential source of method effects related to acquiescence, careless responding, and confirmation bias [68], and cross-national research on the Food Neophobia Scale has previously recommended item reduction to obtain a unidimensional short form [32]. However, the present results also raise the possibility that the observed separation may not be attributable solely to wording effects. Openness to new foods was positively associated with consumption and with the health-related constructs independently of the neophobic facet. This pattern suggests that reluctance to try unfamiliar foods and openness to food novelty may represent partly distinct dimensions in this sample rather than opposite ends of a single continuum. This interpretation remains tentative because each facet was represented by only two items and the separate scoring was adopted after examination of the measurement structure. Studies using reverse-scored totals, including the recent Romanian adaptation [49], may therefore benefit from examining the two facets separately in future research to determine whether they show distinct behavioural correlates. [37,38].
The association between food neophobia and consumption may also be relevant from a public health nutrition perspective. The Romanian adaptation of the Food Neophobia Scale reported a higher proportion of participants classified as neophobic than neophilic (18.2% vs. 12.6%) [49], while studies in other European populations have associated greater food neophobia with lower diet quality and less favourable cardiometabolic markers [36,37]. Previous research has also suggested that the importance attributed to health and natural-content motives decreases as food neophobia increases [42]. Taken together with the present findings, this evidence suggests that health-related information alone may not address all factors associated with the acceptance of foods containing unfamiliar ingredients. Familiar product formats, repeated exposure, and transparent information about ingredients have been proposed as approaches that may facilitate acceptance [43,44,48].
4.4. Dietary Patterns and Age
Consumption did not differ significantly across dietary patterns after adjustment for age group, sex, and education. Although the between-group differences were not statistically significant, flexitarians showed the highest consumption scores, whereas respondents following restricted diets showed the lowest. The restricted-diet group was relatively small (n = 41), and the observed standardized difference of approximately 0.25 SD relative to omnivores should therefore be interpreted cautiously. The validation study similarly found no significant differences in construct scores across dietary patterns [12]. The absence of higher consumption among flexitarians may reflect the fact that flexitarian dietary practices primarily involve reducing or substituting animal-derived foods, rather than a broader preference for products containing alternative ingredients. Conversely, the lower consumption observed in the restricted-diet group differs from the expectation that some consumers following restricted diets, particularly gluten-free diets, might be more likely to seek alternative-ingredient bakery products [58,59]. However, the small and heterogeneous restricted-diet group, which combined vegetarian, vegan, and gluten-free respondents, limits the interpretation of these numerical differences and suggests that they should be examined in larger samples with separate dietary-pattern categories. A clearer demographic association was observed for age, with each higher age category associated with lower consumption (β= −0.12). This finding is consistent with previous evidence suggesting greater acceptance of novel foods among younger consumers [43,44]. However, the present data do not indicate why consumption differed across age categories. The observed association may reflect differences in familiarity with alternative ingredients, purchasing habits, product availability, or other age-related factors not measured in the present study. Further research using more detailed measures of these factors would be needed to clarify the basis of the age-related pattern.
4.5. Implications for the Food Environment and Public Health Nutrition
Food reformulation acts primarily on the composition dimension of the food environment [14,15], but its potential nutritional relevance also depends on whether reformulated products are accepted and consumed. The present findings provide a consumer-level perspective for bakery and confectionery products, a category that contributes substantially to ultra-processed food consumption in European diets [5]. Several implications may be considered in relation to the present results. First, perceived nutritional value was more closely associated with consumption than the broader health-related orientations when these constructs were considered together. This finding suggests that the uptake of reformulated bakery products may depend partly on whether consumers perceive their nutritional characteristics as relevant and credible. Clear information about characteristics such as fibre content, sugar content, or ingredient composition may therefore contribute to consumers’ nutritional appraisal of these products. This possibility is consistent with previous evidence indicating that Romanian consumers use ingredients, nutrition information, and additives as cues when evaluating food healthiness [61]. Second, food neophobia was negatively associated with consumption, whereas openness to new foods was positively associated with it. These findings suggest that responses to novelty may be relevant to the acceptance of products containing alternative ingredients, independently of their perceived nutritional value. The familiar format of bakery products, including bread, biscuits, and cakes, may potentially facilitate the introduction of less familiar ingredients by reducing the novelty of the product as a whole. Previous studies suggest that familiar food formats and repeated exposure can facilitate acceptance of unfamiliar foods or ingredients [45,48]. Repeated exposure in everyday settings may therefore represent one possible approach to increasing familiarity, although its effectiveness for the products examined here would require direct evaluation. Third, consumption decreased across increasing age categories (β = −0.12 per category). This association suggests that the uptake of alternative-ingredient bakery products may vary by age and that older consumers may currently report lower consumption of these products than younger consumers. Given the greater burden of many diet-related chronic conditions at older ages, understanding the reasons for this difference may be relevant from a public health nutrition perspective. Such differences could potentially involve familiarity with alternative ingredients, purchasing habits, perceived value, price, accessibility, or product availability, but these factors were not directly examined in the present study. Fourth, the findings suggest that monitoring the uptake of reformulated products, in addition to their availability and nutritional composition, could provide useful information on how changes in the food environment relate to consumer behaviour. Food-environment surveillance based primarily on product availability or shelf-level indicators may not fully capture whether reformulated products are incorporated into consumers’ diets [15,83]. Measures of purchase or consumption could therefore complement existing indicators by providing a behavioural dimension of product uptake. These considerations may be particularly relevant in Romania, where bakery products contribute to the ultra-processed share of dietary energy intake [5] and changes towards higher fat and carbohydrate intakes have been reported after 2020 [6]. Within this context, examining both the availability of reformulated bakery products and their actual uptake may help clarify their potential contribution to dietary change.
4.6. Strengths and Limitations
Several strengths of the study should be noted. The analysis included multiple health-related and behavioural constructs measured using multi-item scales, with the psychometric properties of several constructs previously evaluated in the same population [12]. The outcome assessed self-reported consumption during the previous 30 days rather than purchase intention alone, allowing the analysis to address reported behaviour in addition to consumer perceptions. The analyses followed a pre-specified plan, used bootstrap inference, and were complemented by sensitivity analyses and a reproducible analysis script. Several limitations should also be considered. First, the cross-sectional design does not allow the temporal or causal ordering of the observed associations to be established. Consequently, the mediation models should be interpreted as indirect statistical associations rather than evidence of causal mechanisms, and the direction of the relationships among the dispositional constructs cannot be determined from the present data. Second, the sample was recruited using convenience and snowball sampling and included relatively high proportions of women, urban residents, and participants with higher education. The sample should therefore not be considered representative of the Romanian population, and descriptive or prevalence estimates should not be generalized to the population as a whole. The associations examined in the study may be less dependent on sample composition than prevalence estimates, but their generalizability should nevertheless be evaluated in more representative samples. Third, consumption was self-reported for the previous 30 days using agreement-scaled items rather than a quantitative frequency measure. The outcome may therefore be affected by recall error and social desirability, and it does not provide direct information on the quantity of products consumed. Third, consumption was self-reported for the previous 30 days using agreement-scaled items rather than a quantitative frequency measure. The outcome may therefore be affected by recall error and social desirability, and it does not provide direct information on the quantity of products consumed. Future studies using purchase records, dietary records, or quantitative frequency measures could provide a more detailed assessment of actual consumption. Fifth, the restricted-diet group was relatively small (n = 41) and combined vegetarian, vegan, and gluten-free respondents. This limited the precision of comparisons across dietary patterns and did not allow these restricted dietary categories to be examined separately. Larger and more balanced groups would be needed to assess whether associations differ among specific dietary patterns. Sixth, all constructs were measured using the same questionnaire and at the same time, creating the possibility of common-method variance. Harman’s single-factor test showed that the first unrotated factor accounted for 57.7% of the variance among the 12 health-related items. At the same time, the single-factor confirmatory model showed substantially poorer fit than the three-factor model, and all HTMT ratios remained below 0.85. When all 20 items were included, the first unrotated factor accounted for 41.1% of the total variance. These findings do not exclude the possibility that common-method variance contributed to some of the observed associations, particularly those among the closely related health constructs [69]. Seventh, the data were obtained from the same survey previously used to validate part of the measurement instrument [12], and three of the six constructs had therefore been examined previously in a different analytical model. The hypotheses evaluated in the present study concern relationships and outcomes that were not part of that previous model; nevertheless, the overlap in the underlying dataset should be considered when interpreting the contribution and independence of the current analysis.
4.7. Future Research
Future research could use longitudinal or experimental designs to clarify the temporal ordering of health consciousness, perceived nutritional value, and consumption and to examine whether changes in perceived nutritional value are followed by changes in consumption. Experimental studies could also assess whether approaches aimed at reducing the influence of food neophobia, such as repeated exposure to products containing alternative ingredients, are associated with greater product acceptance and consumption. Purchase data, dietary records, or quantitative consumption measures could complement self-reported measures and provide a more detailed assessment of actual behaviour. The two-facet structure observed for the food neophobia items should be examined using the full Food Neophobia Scale in Romanian samples. Such studies could help determine whether reluctance to try unfamiliar foods and openness to new foods represent partly distinct dimensions or whether the separation observed in the present study reflects the abbreviated scale or item wording. Replication in larger samples with sufficient numbers of vegetarian, vegan, gluten-free, flexitarian, and omnivorous consumers would also allow dietary-pattern differences to be examined with greater precision. Extending these analyses to other Central and Eastern European populations could help assess whether the observed associations are specific to the Romanian context or are also present in comparable food environments. Finally, future studies could examine psychological factors together with contextual determinants such as price, product availability, accessibility, and nutritional information. This may be particularly relevant because Romanian consumers have been reported to be sensitive to the price of novel foods [62], while access to reformulated products may differ between urban and rural food environments. Examining these factors jointly may provide a more complete understanding of how consumer perceptions and characteristics of the food environment are associated with the uptake of bakery and confectionery products made with alternative ingredients.
5. Conclusions
Among Romanian consumers, health consciousness and health and natural-content food choice motives were reliably measured, strongly related and yet distinct dispositions, each moderately associated with the perceived nutritional value of bakery and confectionery products made with alternative ingredients. Health consciousness partially mediated the association between motives and this appraisal, carrying about 26% of the total effect. Perceived nutritional value fully mediated the association between health consciousness and consumption during the previous 30 days. Food neophobia lowered consumption directly but did not weaken this channel, openness to new foods raised consumption independently, and consumption did not differ significantly across dietary patterns while declining with age. For public health nutrition, the findings indicate that a healthier bakery offer will be eaten to the extent that its nutritional benefit is perceived as real, that neophobic consumers need familiar formats and repeated exposure rather than health arguments alone, and that older adults are the least reached group.
Supplementary Materials
The following supporting information can be downloaded at the website of this paper posted on Preprints.org.
Author Contributions
Conceptualization, all authors; methodology, A.M.D., F.S.B. and L.Ș.B.; software, C.M., R.D.M., A.T., T.P., M.F., and L.C.M.; formal analysis, C.M., R.D.M., A.T., T.P. and F.S.B.; validation, A.M.D., R.-C.M. C.M., and L.C.M.; investigation, A.M.D., R.-C.M., F.S.B., M.F., and L.Ș.B.; data curation, C.M., R.D.M., T.P. and M.F.; writing—original draft preparation, A.M.D., R.-C.M. and C.M.; writing—review and editing, all authors; visualization all authors; supervision, A.M.D., R.-C.M., C.M., L.Ș.B., and L.C.M.; All authors have read and agreed to the published version of the manuscript.
Funding
The APC was funded by “Victor Babes” University of Medicine and Pharmacy, Timisoara, Romania.
Institutional Review Board Statement
The study was conducted in accordance with the Declaration of Helsinki and approved by the Ethics Subcommittee of “Aurel Vlaicu” University of Arad (protocol code Nr. 16, 5 February 2026).
Informed Consent Statement
Informed consent was obtained from all subjects involved in the study.
Data Availability Statement
The data presented in this study are available on request from the corresponding author. The data is not publicly available due to privacy and ethical restrictions.
Acknowledgments
The authors would like to acknowledge “Victor Babeș” University of Medicine and Pharmacy Timișoara and the Doctoral School of “Victor Babeș” University of Medicine and Pharmacy Timișoara for their academic and institutional support in covering the cost of publication for this article. During the preparation of this work, the authors used AI-based linguistic tools (ChatGPT 5.2 and Grammarly) solely for the purpose of language editing, grammatical refinement, and enhancing the academic tone of the manuscript. After using this tool, the authors reviewed and edited the content as needed and took full responsibility for the accuracy and integrity of the scientific content, data analysis, and the selection of bibliographic references. No AI tools were used for data generation, the formulation of scientific arguments, or the creation of the reference list.
Conflicts of Interest
The authors declare no conflicts of interest.
Abbreviations
The following abbreviations are used in this manuscript:
| AVE | Average variance extracted |
| CFA | Confirmatory factor analysis |
| CFI | Comparative fit index |
| CI | Confidence interval |
| CONS | Consumption of alternative-ingredient bakery products in the previous 30 days |
| CR | Composite reliability |
| FCM | Health and natural-content food choice motives |
| FN | Food neophobia (neophobic subscale) |
| HC | Health consciousness |
| HTMT | Heterotrait-monotrait ratio |
| IQR | Interquartile range |
| OPN | Openness to new foods (neophilic subscale) |
| PNV | Perceived nutritional value |
| RMSEA | Root mean square error of approximation |
| SD | Standard deviation |
| SRMR | Standardized root mean square residual |
| STROBE | Strengthening the Reporting of Observational Studies in Epidemiology |
| TLI | Tucker-Lewis index |
Appendix A

Table A1.
Original Romanian wording of the questionnaire items analysed in this study.
| Code | Romanian wording (as administered) | English translation |
| HC1 | Sunt foarte atent(a) la cat de sanatoase sunt alimentele pe care le consum. | I pay close attention to how healthy the foods I eat are. |
| HC2 | Aleg alimentele cu grija pentru a-mi mentine sanatatea. | I choose foods carefully to maintain my health. |
| HC3 | Consider sanatatea un criteriu important atunci cand aleg produsele alimentare. | I consider health an important criterion when choosing food products. |
| HC4 | Ma preocupa impactul alimentatiei asupra starii mele de sanatate. | I am concerned about the impact of my diet on my health. |
| PNV1 | Produsele realizate cu materii prime alternative au o valoare nutritionala mai ridicata. | Products made with alternative raw materials have a higher nutritional value. |
| PNV2 | Aceste produse au un profil nutritional mai bun (ex. mai multe fibre, mai putine ingrediente rafinate). | These products have a better nutritional profile (e.g., more fibre, fewer refined ingredients). |
| PNV3 | Aceste produse sunt mai adecvate din punct de vedere nutritional pentru consum regulat. | These products are more suitable, from a nutritional point of view, for regular consumption. |
| PNV4 | Aceste produse ofera beneficii nutritionale reale, nu doar o imagine de produs mai sanatos. | These products offer real nutritional benefits, not just the image of a healthier product. |
| FCM1 | Aleg alimente care sunt benefice pentru sanatatea mea. | I choose foods that are beneficial to my health. |
| FCM2 | Prefer alimente care contin ingrediente naturale. | I prefer foods that contain natural ingredients. |
| FCM3 | Evit alimentele cu ingrediente artificiale sau foarte procesate. | I avoid foods with artificial or highly processed ingredients. |
| FCM4 | Este important pentru mine ca alimentele sa fie cat mai naturale. | It is important to me that foods are as natural as possible. |
| FN1 | Sunt reticent(a) sa incerc alimente pe care nu le-am mai consumat inainte. | I am reluctant to try foods I have not eaten before. |
| FN2 (R) | Imi place sa incerc alimente noi si diferite. | I like to try new and different foods. |
| FN3 (R) | Sunt curios(oasa) sa gust produse alimentare necunoscute. | I am curious to taste unfamiliar food products. |
| FN4 | Prefer sa consum doar alimente cu care sunt deja familiarizat(a). | I prefer to eat only foods I am already familiar with. |
| CONS1 | In ultimele 30 de zile, am consumat produse de patiserie/cofetarie cu materii prime alternative. | In the past 30 days, I have consumed bakery or confectionery products made with alternative raw materials. |
| CONS2 | In ultimele 30 de zile, am ales aceste produse in locul celor conventionale. | In the past 30 days, I have chosen these products instead of conventional ones. |
| CONS3 | In ultimele 30 de zile, am cumparat frecvent produse cu ingrediente alternative. | In the past 30 days, I have frequently bought products with alternative ingredients. |
| CONS4 | In ultimele 30 de zile, aceste produse au facut parte regulat din alimentatia mea. | In the past 30 days, these products have been a regular part of my diet. |
Diacritics are omitted in the Romanian wording for typesetting reasons.
References
- Afshin, A.; Sur, P.J.; Fay, K.A.; Cornaby, L.; Ferrara, G.; Salama, J.S.; Mullany, E.C.; Abate, K.H.; Abbafati, C.; Abebe, Z.; et al. Health Effects of Dietary Risks in 195 Countries, 1990–2017: A Systematic Analysis for the Global Burden of Disease Study 2017. The Lancet 2019, 393, 1958–1972. [CrossRef]
- Willett, W.; Rockström, J.; Loken, B.; Springmann, M.; Lang, T.; Vermeulen, S.; Garnett, T.; Tilman, D.; DeClerck, F.; Wood, A.; et al. Food in the Anthropocene: The EAT–Lancet Commission on Healthy Diets from Sustainable Food Systems. The Lancet 2019, 393, 447–492. [CrossRef]
- Monteiro, C.A.; Cannon, G.; Levy, R.B.; Moubarac, J.C.; Louzada, M.L.C.; Rauber, F.; Khandpur, N.; Cediel, G.; Neri, D.; Martinez-Steele, E.; et al. Ultra-Processed Foods: What They Are and How to Identify Them. Public Health Nutr. 2019, 22, 936–941. [CrossRef]
- Lane, M.M.; Gamage, E.; Du, S.; Ashtree, D.N.; McGuinness, A.J.; Gauci, S.; Baker, P.; Lawrence, M.; Rebholz, C.M.; Srour, B.; et al. Ultra-Processed Food Exposure and Adverse Health Outcomes: Umbrella Review of Epidemiological Meta-Analyses. BMJ 2024, 384. [CrossRef]
- Mertens, E.; Colizzi, C.; Peñalvo, J.L. Ultra-Processed Food Consumption in Adults across Europe. Eur. J. Nutr. 2022, 61, 1521–1539. [CrossRef]
- Pană, A.; Strilciuc, Ștefan; Ileanu, B.V. Dietary Disruptors in Romania: Seasonality, Traditions, and the COVID-19 Pandemic. Nutrients 2025, Vol. 17, Page 183 2025, 17, 183. [CrossRef]
- Mesta-Corral, M.; Gómez-García, R.; Balagurusamy, N.; Torres-León, C.; Hernández-Almanza, A.Y. Technological and Nutritional Aspects of Bread Production: An Overview of Current Status and Future Challenges. Foods 2024, Vol. 13, Page 2062 2024, 13, 2062. [CrossRef]
- Okoye, S.I.; Carlson, R.; Dallmier, K.; Pepino, M.Y. Substituting Refined Flour with Soy Flour Improves Postprandial Glycemic Responses in Staple Foods Without Reducing Consumer Acceptability. Nutrients 2026, Vol. 18, Page 1173 2026, 18, 1173. [CrossRef]
- Dana, H.; Sonia, A. Substituting Sugar in Pastry and Bakery Products with Functional Ingredients. Applied Sciences 2024, Vol. 14, Page 8563 2024, 14, 8563. [CrossRef]
- Szőke-Trenyik, E.; Mihalkó, J.; Sipos, P.; Szabó, B.P. Development of High-Fibre, Ready-to-Bake Flour Mixtures from Purple Wheat. Processes 2023, Vol. 11, Page 389 2023, 11, 389. [CrossRef]
- Schulz, R.; Peterson, H.; Lundquist, H.; Kocher, M.; Marquart, L. U.S. Consumer Acceptance of Whole Grains, Local Grains, and Alternative Grain Networks: A Scoping Review. Front. Nutr. 2026, 13, 1729260. [CrossRef]
- Dicu, A.M.; Marin, R.C.; Muntean, C.; Moleriu, R.D.; Tudor, A.; Piroș, T.; Barbu, F.S.; Radu, D.G.; Bozdog, L. Ștefania Development and Validation of a Multidimensional Consumer Assessment Framework for Alternative-Ingredient Bakery and Confectionery Products: Implications for Nutrition Methodology and Sustainable Diet Research. Foods 2026, 15, 2950. [CrossRef]
- Turner, C.; Aggarwal, A.; Walls, H.; Herforth, A.; Drewnowski, A.; Coates, J.; Kalamatianou, S.; Kadiyala, S. Concepts and Critical Perspectives for Food Environment Research: A Global Framework with Implications for Action in Low- and Middle-Income Countries. Glob. Food Sec. 2018, 18, 93–101. [CrossRef]
- Downs, S.M.; Ahmed, S.; Fanzo, J.; Herforth, A. Food Environment Typology: Advancing an Expanded Definition, Framework, and Methodological Approach for Improved Characterization of Wild, Cultivated, and Built Food Environments toward Sustainable Diets. Foods 2020, Vol. 9, Page 532 2020, 9, 532. [CrossRef]
- Swinburn, B.; Sacks, G.; Vandevijvere, S.; Kumanyika, S.; Lobstein, T.; Neal, B.; Barquera, S.; Friel, S.; Hawkes, C.; Kelly, B.; et al. INFORMAS (International Network for Food and Obesity/Non-Communicable Diseases Research, Monitoring and Action Support): Overview and Key Principles. Obesity Reviews 2013, 14, 1–12. [CrossRef]
- Colémont, A.; Van den Broucke, S. Measuring Determinants of Occupational Health Related Behavior in Flemish Farmers: An Application of the Theory of Planned Behavior. J. Safety Res. 2008, 39, 55–64. [CrossRef]
- Mai, R.; Hoffmann, S. How to Combat the Unhealthy = Tasty Intuition: The Influencing Role of Health Consciousness. Journal of Public Policy & Marketing 2015, 34, 63–83. [CrossRef]
- Chen, M.F. The Joint Moderating Effect of Health Consciousness and Healthy Lifestyle on Consumers’ Willingness to Use Functional Foods in Taiwan. Appetite 2011, 57, 253–262. [CrossRef]
- Escobar-Farfán, M.; García-Salirrosas, E.E.; Guerra-Velásquez, M.; Veas-González, I.; Gómez-Bayona, L.; Gallardo-Canales, R. Psychological Determinants of Healthy Food Purchase Intention: An Integrative Model Based on Health Consciousness. Nutrients 2025, Vol. 17, Page 1140 2025, 17, 1140. [CrossRef]
- Pan, J.; Wu, K.S.; Huang, D.M.; Sun, S.W. Role of Health-Consciousness on Purchase Intention of Health and Wellness Food: The Serial Mediating Effect of Attitude and Desire. Nutrients 2025, Vol. 17, Page 746 2025, 17, 746. [CrossRef]
- Steptoe, A.; Pollard, T.M.; Wardle, J. Development of a Measure of the Motives Underlying the Selection of Food: The Food Choice Questionnaire. Appetite 1995, 25, 267–284. [CrossRef]
- Januszewska, R.; Pieniak, Z.; Verbeke, W. Food Choice Questionnaire Revisited in Four Countries. Does It Still Measure the Same? Appetite 2011, 57, 94–98. [CrossRef]
- Sun, Y.H.C. Health Concern, Food Choice Motives, and Attitudes toward Healthy Eating: The Mediating Role of Food Choice Motives. Appetite 2008, 51, 42–49. [CrossRef]
- Sheth, J.N.; Newman, B.I.; Gross, B.L. Why We Buy What We Buy: A Theory of Consumption Values. J. Bus. Res. 1991, 22, 159–170. [CrossRef]
- Zeithaml, V.A. Consumer Perceptions of Price, Quality, and Value: A Means-End Model and Synthesis of Evidence. J. Mark. 1988, 52, 2–22. [CrossRef]
- Albornoz, R.; García-Salirrosas, E.E.; Millones-Liza, D.Y.; Villar-Guevara, M.; Toyohama-Pocco, G. Using the Theory of Perceived Value to Determine the Willingness to Consume Foods from a Healthy Brand: The Role of Health Consciousness. Nutrients 2024, Vol. 16, Page 1995 2024, 16, 1995. [CrossRef]
- Vermeir, I.; Verbeke, W. Sustainable Food Consumption: Exploring the Consumer “Attitude - Behavioral Intention” Gap. J. Agric. Environ. Ethics 2006, 19, 169–194. [CrossRef]
- Sheeran, P.; Webb, T.L. The Intention–Behavior Gap. Soc. Personal. Psychol. Compass 2016, 10, 503–518. [CrossRef]
- Conner, M.; Norman, P. Understanding the Intention-Behavior Gap: The Role of Intention Strength. Front. Psychol. 2022, 13, 923464. [CrossRef]
- Ajzen, I. The Theory of Planned Behavior. Organ. Behav. Hum. Decis. Process. 1991, 50, 179–211. [CrossRef]
- Pliner, P.; Hobden, K. Development of a Scale to Measure the Trait of Food Neophobia in Humans. Appetite 1992, 19, 105–120. [CrossRef]
- Ritchey, P.N.; Frank, R.A.; Hursti, U.K.; Tuorila, H. Validation and Cross-National Comparison of the Food Neophobia Scale (FNS) Using Confirmatory Factor Analysis. Appetite 2003, 40, 163–173. [CrossRef]
- Damsbo-Svendsen, M.; Frøst, M.B.; Olsen, A. A Review of Instruments Developed to Measure Food Neophobia. Appetite 2017, 113, 358–367. [CrossRef]
- Rabadán, A.; Bernabéu, R. A Systematic Review of Studies Using the Food Neophobia Scale: Conclusions from Thirty Years of Studies. Food Qual. Prefer. 2021, 93, 104241. [CrossRef]
- Knaapila, A.; Silventoinen, K.; Broms, U.; Rose, R.J.; Perola, M.; Kaprio, J.; Tuorila, H.M. Food Neophobia in Young Adults: Genetic Architecture and Relation to Personality, Pleasantness and Use Frequency of Foods, and Body Mass Index-A Twin Study. Behav. Genet. 2011, 41, 512–521. [CrossRef]
- Muntean, C.; Piroș, T.; Marin, R.C.; Moleriu, L.C.; Lupușoru, R.; Dicu, A.M.; Ștefănigă, S.; Moleriu, R.D. Chrononutrition Behaviors and BMI Change During the Transition to University Life in Young Adults: A Prospective Study. Nutrients 2026, 18, 1975. [CrossRef]
- Knaapila, A.J.; Sandell, M.A.; Vaarno, J.; Hoppu, U.; Puolimatka, T.; Kaljonen, A.; Lagström, H. Food Neophobia Associates with Lower Dietary Quality and Higher BMI in Finnish Adults. Public Health Nutr. 2015, 18, 2161–2171. [CrossRef]
- Sarin, H. V.; Taba, N.; Fischer, K.; Esko, T.; Kanerva, N.; Moilanen, L.; Saltevo, J.; Joensuu, A.; Borodulin, K.; Männistö, S.; et al. Food Neophobia Associates with Poorer Dietary Quality, Metabolic Risk Factors, and Increased Disease Outcome Risk in Population-Based Cohorts in a Metabolomics Study. Am. J. Clin. Nutr. 2019, 110, 233–245. [CrossRef]
- Jaeger, S.R.; Rasmussen, M.A.; Prescott, J. Relationships between Food Neophobia and Food Intake and Preferences: Findings from a Sample of New Zealand Adults. Appetite 2017, 116, 410–422. [CrossRef]
- Predieri, S.; Sinesio, F.; Monteleone, E.; Spinelli, S.; Cianciabella, M.; Daniele, G.M.; Dinnella, C.; Gasperi, F.; Endrizzi, I.; Torri, L.; et al. Gender, Age, Geographical Area, Food Neophobia and Their Relationships with the Adherence to the Mediterranean Diet: New Insights from a Large Population Cross-Sectional Study. Nutrients 2020, Vol. 12, Page 1778 2020, 12, 1778. [CrossRef]
- Icer, M.A.; Sarıkaya, B.; Çelik, E.; Gezmen-Karadag, M. Food Neophobia and Its Relationship with Dietary Quality and Diversity in Turkish Young Adults: A Cross-Sectional Study. Int. J. Environ. Health Res. 2025, 35, 1401–1411. [CrossRef]
- Jaeger, S.R.; Roigard, C.M.; Hunter, D.C.; Worch, T. Importance of Food Choice Motives Vary with Degree of Food Neophobia. Appetite 2021, 159, 105056. [CrossRef]
- Laureati, M.; De Boni, A.; Saba, A.; Lamy, E.; Minervini, F.; Delgado, A.M.; Sinesio, F. Determinants of Consumers’ Acceptance and Adoption of Novel Food in View of More Resilient and Sustainable Food Systems in the EU: A Systematic Literature Review. Foods 2024, 13, 1534. [CrossRef]
- Monaco, A.; Kotz, J.; Al Masri, M.; Allmeta, A.; Purnhagen, K.P.; König, L.M. Consumers’ Perception of Novel Foods and the Impact of Heuristics and Biases: A Systematic Review. Appetite 2024, 196, 107285. [CrossRef]
- Onwezen, M.C.; Bouwman, E.P.; Reinders, M.J.; Dagevos, H. A Systematic Review on Consumer Acceptance of Alternative Proteins: Pulses, Algae, Insects, Plant-Based Meat Alternatives, and Cultured Meat. Appetite 2021, 159, 105058. [CrossRef]
- Siegrist, M.; Hartmann, C. Consumer Acceptance of Novel Food Technologies. Nature Food 2020 1:6 2020, 1, 343–350. [CrossRef]
- Serban, D.M.; Ursoniu, S.; Moleriu, R.D.; Banu, A.M.; Serban, C.L. Mindful Eating, Nutrition Knowledge, and Weight Status among Medical Students: Implications for Health and Counseling Practices. Nutrients 2024, 16. [CrossRef]
- Sidali, K.L.; Pizzo, S.; Garrido-Pérez, E.I.; Schamel, G. Between Food Delicacies and Food Taboos: A Structural Equation Model to Assess Western Students’ Acceptance of Amazonian Insect Food. Food Research International 2019, 115, 83–89. [CrossRef]
- Bugi, M.A.; Jugănaru, I.; Simina, I.E.; Nicoară, D.M.; Cristun, L.I.; Brad, G.F.; Boru, C.; Cîrnatu, D.; Mărginean, O. Exploring Adult Eating Behaviors and Food Neophobia: A National Study in Romania. Foods 2024, 13, 1301. [CrossRef]
- Piroș, T.; Lupusoru, R.; Moleriu, L.C.; Muntean, C.; Moleriu, R.D.; Cîmpian, D.M.; Cincu, M.G.; Strete, E.G.; Timofte, A.G.; Marin, R.C. Dietary Patterns, Cooking Methods, and Their Association with Prediabetes Risk Markers in Romanian University Students: A Cross-Sectional Analysis. Nutrients 2026, 18, 977. [CrossRef]
- Defta, N.; Barbu, A.; Ion, V.A.; Pogurschi, E.N.; Osman, A.; Cune, L.C.; Bădulescu, L.A. Exploring the Relationship Between Socio-Demographic Factors and Consumers’ Perception of Food Promotions in Romania. Foods 2025, Vol. 14, Page 599 2025, 14, 599. [CrossRef]
- Rosenfeld, D.L. The Psychology of Vegetarianism: Recent Advances and Future Directions. Appetite 2018, 131, 125–138. [CrossRef]
- Hopwood, C.J.; Bleidorn, W.; Schwaba, T.; Chen, S. Health, Environmental, and Animal Rights Motives for Vegetarian Eating. PLoS One 2020, 15, e0230609. [CrossRef]
- Dhont, K.; Ioannidou, M. Similarities and Differences between Vegetarians and Vegans in Motives for Meat-Free and Plant-Based Diets. Appetite 2024, 195, 107232. [CrossRef]
- Dagevos, H. Finding Flexitarians: Current Studies on Meat Eaters and Meat Reducers. Trends Food Sci. Technol. 2021, 114, 530–539. [CrossRef]
- Bellikci Koyu, E.; Karaağaç, Y.; Öner, B.N. The Association between Food Neophobia, Bi-Dimensional Aspects of Orthorexia, and Anxiety among Vegetarians and Omnivores. Appetite 2024, 197, 107303. [CrossRef]
- Kim, H.S.; Patel, K.G.; Orosz, E.; Kothari, N.; Demyen, M.F.; Pyrsopoulos, N.; Ahlawat, S.K. Time Trends in the Prevalence of Celiac Disease and Gluten-Free Diet in the US Population: Results From the National Health and Nutrition Examination Surveys 2009-2014. JAMA Intern. Med. 2016, 176, 1716–1717. [CrossRef]
- Niland, B.; Cash, B.D. Health Benefits and Adverse Effects of a Gluten-Free Diet in Non–Celiac Disease Patients. Gastroenterol. Hepatol. (N. Y). 2018, 14, 82.
- Catassi, C.; Chirdo, F.G. The Gluten-Free Diet: The Road Ahead. Nutrients 2025, Vol. 17, Page 1226 2025, 17, 1226. [CrossRef]
- Chira, D.C.; Arion, F.H.; Mihăilă, M.; Roman, I.A.; Roman, R.A.; Vac, C.S. Consumers’ Attitudes Towards Functional Foods in the North-West Region of Romania (Transylvania). Foods 2026, Vol. 15, Page 2861 2026, 15, 2861. [CrossRef]
- Petrescu, D.C.; Vermeir, I.; Petrescu-Mag, R.M. Consumer Understanding of Food Quality, Healthiness, and Environmental Impact: A Cross-National Perspective. International Journal of Environmental Research and Public Health 2020, Vol. 17, Page 169 2019, 17, 169. [CrossRef]
- Gârdan, I.P.; Roșca, M.I.; Gârdan, D.A.; Andronie, M.; Roșca, L.D.; Paștiu, C.A. Adoption of 3D-Printed Food in Romania: Price Perception as a Key Determinant of Consumer Acceptance. Foods 2025, Vol. 14, Page 4306 2025, 14, 4306. [CrossRef]
- von Elm, E.; Altman, D.G.; Egger, M.; Pocock, S.J.; Gøtzsche, P.C.; Vandenbroucke, J.P. The Strengthening the Reporting of Observational Studies in Epidemiology (STROBE) Statement: Guidelines for Reporting Observational Studies. Lancet 2007, 370, 1453–1457. [CrossRef]
- Revilla, M.A.; Saris, W.E.; Krosnick, J.A. Choosing the Number of Categories in Agree-Disagree Scales. Sociol. Methods Res. 2014, 43, 73–97. [CrossRef]
- Hayes, A.F.; Rockwood, N.J. Regression-Based Statistical Mediation and Moderation Analysis in Clinical Research: Observations, Recommendations, and Implementation. Behaviour Research and Therapy 2017, 98, 39–57. [CrossRef]
- Tavakol, M.; Dennick, R. Making Sense of Cronbach’s Alpha. Int. J. Med. Educ. 2011, 2, 53–55. [CrossRef]
- Hayes, A.F.; Coutts, J.J. Use Omega Rather than Cronbach’s Alpha for Estimating Reliability. But…. Commun. Methods Meas. 2020, 14, 1–24. [CrossRef]
- Weijters, B.; Baumgartner, H.; Schillewaert, N. Reversed Item Bias: An Integrative Model. Psychol. Methods 2013, 18, 320–334. [CrossRef]
- Hu, L.T.; Bentler, P.M. Cutoff Criteria for Fit Indexes in Covariance Structure Analysis: Conventional Criteria versus New Alternatives. Struct. Equ. Modeling 1999, 6, 1–55. [CrossRef]
- Fornell, C.; Larcker, D.F. Evaluating Structural Equation Models with Unobservable Variables and Measurement Error. Journal of Marketing Research 1981, 18, 39. [CrossRef]
- Henseler, J.; Ringle, C.M.; Sarstedt, M. A New Criterion for Assessing Discriminant Validity in Variance-Based Structural Equation Modeling. J. Acad. Mark. Sci. 2015, 43, 115–135. [CrossRef]
- Podsakoff, P.M.; MacKenzie, S.B.; Lee, J.Y.; Podsakoff, N.P. Common Method Biases in Behavioral Research: A Critical Review of the Literature and Recommended Remedies. Journal of Applied Psychology 2003, 88, 879–903. [CrossRef]
- Schober, P.; Schwarte, L.A. Correlation Coefficients: Appropriate Use and Interpretation. Anesth. Analg. 2018, 126, 1763–1768. [CrossRef]
- Norman, G. Likert Scales, Levels of Measurement and the “Laws” of Statistics. Advances in Health Sciences Education 2010, 15, 625–632. [CrossRef]
- Baron, R.M.; Kenny, D.A. The Moderator-Mediator Variable Distinction in Social Psychological Research. Conceptual, Strategic, and Statistical Considerations. J. Pers. Soc. Psychol. 1986, 51, 1173–1182. [CrossRef]
- Preacher, K.J.; Hayes, A.F. Asymptotic and Resampling Strategies for Assessing and Comparing Indirect Effects in Multiple Mediator Models. Behav. Res. Methods 2008, 40, 879–891. [CrossRef]
- Maxwell, S.E.; Cole, D.A. Bias in Cross-Sectional Analyses of Longitudinal Mediation. Psychol. Methods 2007, 12, 23–44. [CrossRef]
- Zhao, X.; Lynch, J.G.; Chen, Q. Reconsidering Baron and Kenny: Myths and Truths about Mediation Analysis. Journal of Consumer Research 2010, 37, 197–206. [CrossRef]
- Fritz, M.S.; MacKinnon, D.P. Required Sample Size to Detect the Mediated Effect. Psychol. Sci. 2007, 18, 233–239. [CrossRef]
- Cohen, J. A Power Primer. Psychol. Bull. 1992, 112, 155–159. [CrossRef]
- Kruskal, W.H.; Wallis, W.A. Use of Ranks in One-Criterion Variance Analysis. J. Am. Stat. Assoc. 1952, 47, 583–621. [CrossRef]
- Dunn, O.J. Multiple Comparisons Using Rank Sums. Technometrics 1964, 6, 241–252. [CrossRef]
- Mepham, B. Food Additives: An Ethical Evaluation. Br. Med. Bull. 2011, 99, 7–23. [CrossRef]
Figure 1.
Hypothesised model. Solid arrows denote the mediation paths tested in H1 (FCM → HC → PNV) and H2 (HC → PNV → CONS); dashed arrows denote the moderation by food neophobia of the PNV → CONS and HC → CONS paths tested in H3; H4 compares consumption across dietary patterns. All regression models were adjusted for age group, sex and education. FCM, health and natural-content food choice motives; HC, health consciousness; PNV, perceived nutritional value; CONS, consumption of alternative-ingredient bakery products in the previous 30 days.
Figure 1.
Hypothesised model. Solid arrows denote the mediation paths tested in H1 (FCM → HC → PNV) and H2 (HC → PNV → CONS); dashed arrows denote the moderation by food neophobia of the PNV → CONS and HC → CONS paths tested in H3; H4 compares consumption across dietary patterns. All regression models were adjusted for age group, sex and education. FCM, health and natural-content food choice motives; HC, health consciousness; PNV, perceived nutritional value; CONS, consumption of alternative-ingredient bakery products in the previous 30 days.
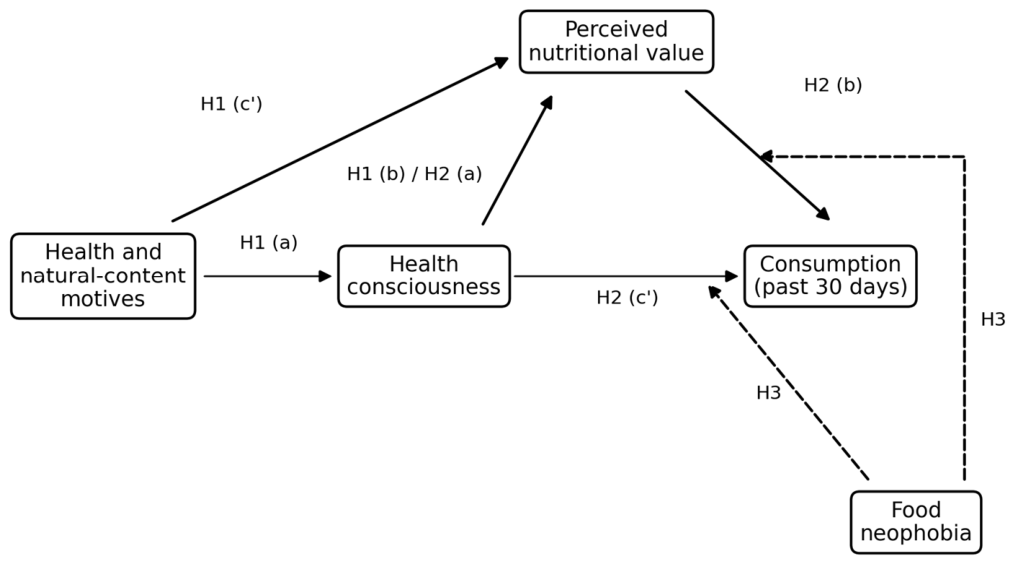
Figure 2.
Spearman rank correlations between the six construct scores (lower triangle; N = 504). Cell values are rho coefficients; * p < 0.05, ** p < 0.01, *** p < 0.001. HC, health consciousness; PNV, perceived nutritional value; FCM, health and natural-content food choice motives; FN, food neophobia (neophobic subscale); OPN, openness to new foods (neophilic subscale); CONS, consumption of alternative-ingredient bakery products in the previous 30 days.
Figure 2.
Spearman rank correlations between the six construct scores (lower triangle; N = 504). Cell values are rho coefficients; * p < 0.05, ** p < 0.01, *** p < 0.001. HC, health consciousness; PNV, perceived nutritional value; FCM, health and natural-content food choice motives; FN, food neophobia (neophobic subscale); OPN, openness to new foods (neophilic subscale); CONS, consumption of alternative-ingredient bakery products in the previous 30 days.
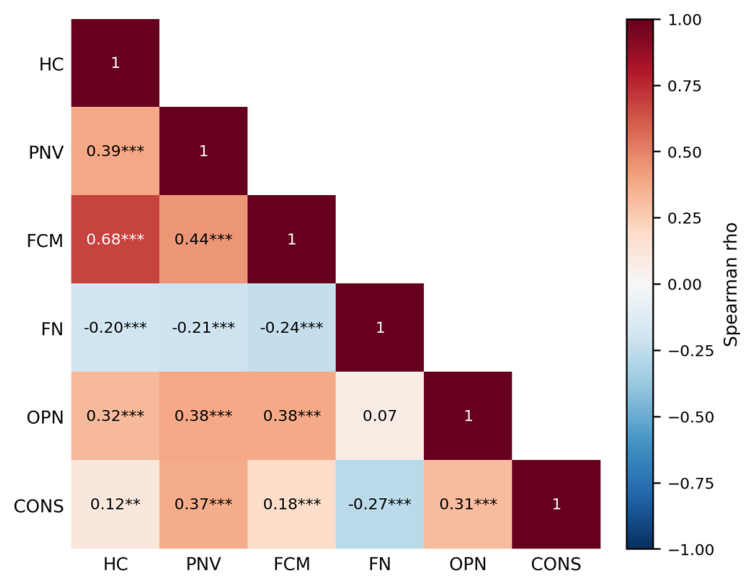
Figure 3.
Conditional indirect effect of health consciousness on consumption through perceived nutritional value at one SD below the mean, at the mean and at one SD above the mean of food neophobia (neophobic subscale). Points are standardized estimates; bars are percentile bootstrap 95% confidence intervals (5000 resamples).
Figure 3.
Conditional indirect effect of health consciousness on consumption through perceived nutritional value at one SD below the mean, at the mean and at one SD above the mean of food neophobia (neophobic subscale). Points are standardized estimates; bars are percentile bootstrap 95% confidence intervals (5000 resamples).
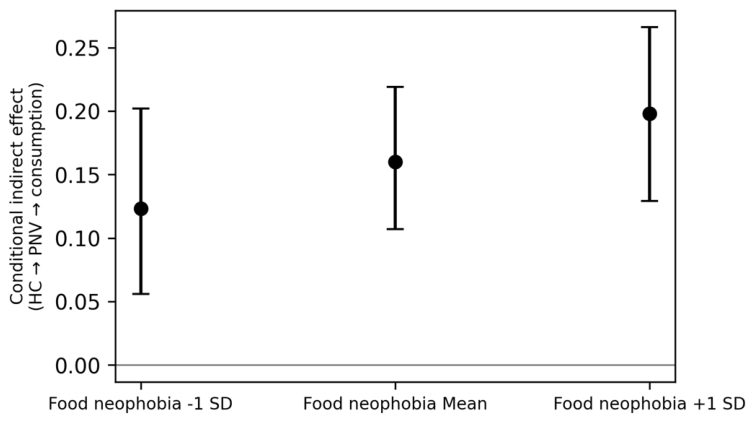
Figure 4.
Consumption of alternative-ingredient bakery products in the previous 30 days by self-reported dietary pattern (five categories). Boxes show the median and interquartile range, whiskers extend to 1.5 times the interquartile range, and triangles mark the means.
Figure 4.
Consumption of alternative-ingredient bakery products in the previous 30 days by self-reported dietary pattern (five categories). Boxes show the median and interquartile range, whiskers extend to 1.5 times the interquartile range, and triangles mark the means.
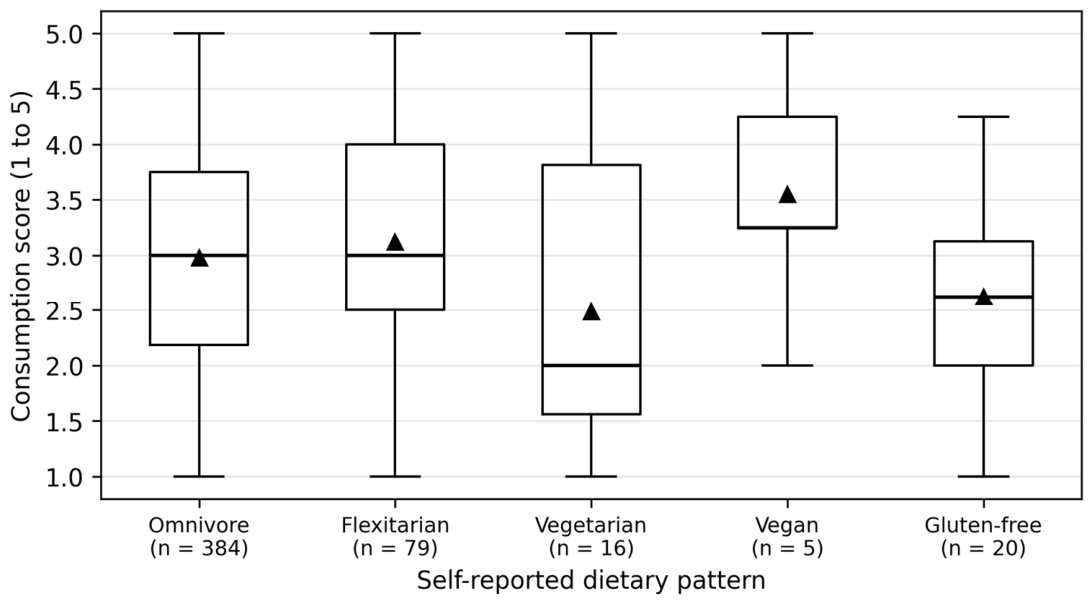
Table 1.
Constructs, item codes, item wording (English translation) and source scales.
| Construct | Code | Item (English translation of the Romanian wording) | Source |
| Health consciousness (HC) | HC1 | I pay close attention to how healthy the foods I eat are. | Adapted from the Health Consciousness Scale [16] |
| HC2 | I choose foods carefully to maintain my health. | ||
| HC3 | I consider health an important criterion when choosing food products. | ||
| HC4 | I am concerned about the impact of my diet on my health. | ||
| Perceived nutritional value (PNV) | PNV1 | Products made with alternative raw materials have a higher nutritional value. | Scale developed and validated in [12] |
| PNV2 | These products have a better nutritional profile (e.g., more fibre, fewer refined ingredients). | ||
| PNV3 | These products are more suitable, from a nutritional point of view, for regular consumption. | ||
| PNV4 | These products offer real nutritional benefits, not just the image of a healthier product. | ||
| Health and natural-content food choice motives (FCM) | FCM1 | I choose foods that are beneficial to my health. | Health and natural-content dimensions of the Food Choice Questionnaire [21] |
| FCM2 | I prefer foods that contain natural ingredients. | ||
| FCM3 | I avoid foods with artificial or highly processed ingredients. | ||
| FCM4 | It is important to me that foods are as natural as possible. | ||
| Food neophobia (FN) and openness to new foods (OPN) | FN1 | I am reluctant to try foods I have not eaten before. | Four items adapted from the Food Neophobia Scale [31]; FN1 and FN4 form the neophobic subscale (FN), FN2 and FN3 the neophilic subscale (OPN) |
| FN2 (R) | I like to try new and different foods. | ||
| FN3 (R) | I am curious to taste unfamiliar food products. | ||
| FN4 | I prefer to eat only foods I am already familiar with. | ||
| Recent consumption (CONS) | CONS1 | In the past 30 days, I have consumed bakery or confectionery products made with alternative raw materials. | Study-specific behavioural items (30-day recall) |
| CONS2 | In the past 30 days, I have chosen these products instead of conventional ones. | ||
| CONS3 | In the past 30 days, I have frequently bought products with alternative ingredients. | ||
| CONS4 | In the past 30 days, these products have been a regular part of my diet. |
(R), item reverse-scored in the pre-specified four-item neophobia score. All items used a five-point agreement scale (1 = strongly disagree, 5 = strongly agree). Construct scores are item means (range 1 to 5); higher FN scores denote stronger neophobia and higher OPN scores denote greater openness to new foods. The original Romanian wording is given in Table A1.
Table 2.
Socio-demographic characteristics of the sample (N = 504).
| Characteristic | Category | n | % |
| Age group | Under 18 years | 63 | 12.5 |
| 18-25 years | 191 | 37.9 | |
| 26-35 years | 60 | 11.9 | |
| 36-50 years | 95 | 18.8 | |
| Over 50 years | 95 | 18.8 | |
| Sex | Female | 357 | 70.8 |
| Male | 147 | 29.2 | |
| Residence | Urban | 356 | 70.6 |
| Rural | 148 | 29.4 | |
| Education | Lower secondary | 8 | 1.6 |
| High school | 184 | 36.5 | |
| Bachelor's degree | 197 | 39.1 | |
| Master's degree | 88 | 17.5 | |
| Doctorate | 27 | 5.4 | |
| Dietary pattern | Omnivore | 384 | 76.2 |
| Flexitarian | 79 | 15.7 | |
| Gluten-free | 20 | 4.0 | |
| Vegetarian | 16 | 3.2 | |
| Vegan | 5 | 1.0 | |
| Net monthly income | Under RON 2000 | 136 | 27.0 |
| RON 2001-3500 | 103 | 20.4 | |
| RON 3501-5000 | 96 | 19.0 | |
| RON 5001-7000 | 82 | 16.3 | |
| Over RON 7000 | 87 | 17.3 |
Percentages are computed on N = 504 and may not sum to 100 owing to rounding. RON, Romanian leu. The same sample was described in the instrument validation study [12].
Table 3.
Item descriptive statistics (N = 504).
| Item | Mean | SD | Median [IQR] | Skewness | Kurtosis | Floor % | Ceiling % |
| HC1 | 3.82 | 0.96 | 4 [3-4] | -0.81 | 0.64 | 3.2 | 24.8 |
| HC2 | 3.86 | 0.96 | 4 [3-5] | -0.89 | 0.79 | 3.2 | 25.8 |
| HC3 | 4.03 | 0.97 | 4 [4-5] | -1.07 | 1.09 | 3.0 | 36.1 |
| HC4 | 4.07 | 0.97 | 4 [4-5] | -1.11 | 1.11 | 2.8 | 39.1 |
| PNV1 | 3.35 | 0.93 | 3 [3-4] | -0.07 | 0.07 | 3.2 | 12.1 |
| PNV2 | 3.53 | 0.96 | 4 [3-4] | -0.39 | 0.03 | 3.2 | 15.5 |
| PNV3 | 3.52 | 0.97 | 4 [3-4] | -0.33 | -0.08 | 3.2 | 16.3 |
| PNV4 | 3.55 | 0.96 | 4 [3-4] | -0.39 | -0.01 | 3.2 | 16.7 |
| FCM1 | 3.85 | 0.94 | 4 [3-5] | -0.72 | 0.47 | 2.4 | 26.0 |
| FCM2 | 3.98 | 0.95 | 4 [4-5] | -1.01 | 1.04 | 2.8 | 32.1 |
| FCM3 | 3.77 | 1.03 | 4 [3-5] | -0.68 | 0.01 | 3.2 | 26.6 |
| FCM4 | 3.96 | 0.98 | 4 [3-5] | -0.83 | 0.33 | 2.2 | 34.1 |
| FN1 | 2.91 | 1.10 | 3 [2-4] | 0.14 | -0.63 | 9.9 | 9.1 |
| FN2 | 3.65 | 1.04 | 4 [3-4] | -0.66 | 0.05 | 4.4 | 20.6 |
| FN3 | 3.58 | 1.03 | 4 [3-4] | -0.48 | -0.23 | 3.8 | 19.6 |
| FN4 | 2.82 | 1.18 | 3 [2-4] | 0.16 | -0.84 | 14.1 | 8.9 |
| CONS1 | 3.13 | 1.15 | 3 [2-4] | -0.22 | -0.80 | 9.9 | 10.9 |
| CONS2 | 2.97 | 1.12 | 3 [2-4] | -0.01 | -0.73 | 10.5 | 8.9 |
| CONS3 | 2.95 | 1.10 | 3 [2-4] | 0.02 | -0.63 | 10.5 | 8.7 |
| CONS4 | 2.86 | 1.13 | 3 [2-4] | 0.03 | -0.70 | 13.9 | 7.9 |
SD, standard deviation; IQR, interquartile range (25th to 75th percentile). Kurtosis is excess kurtosis. Floor and ceiling: percentage of respondents selecting the lowest and the highest response category. FN2 and FN3 are shown as answered (higher values denote greater openness to new foods).
Table 4.
Internal consistency, standardized loadings and convergent validity of the constructs.
| Construct | Code | Cronbach's alpha (95% CI) | Omega | Standardized loadings | CR | AVE |
| Health consciousness | HC | 0.938 (0.929 to 0.947) | 0.939 | 0.870 to 0.917 | 0.939 | 0.793 |
| Perceived nutritional value | PNV | 0.931 (0.921 to 0.941) | 0.932 | 0.795 to 0.919 | 0.932 | 0.776 |
| Health and natural-content motives | FCM | 0.914 (0.901 to 0.926) | 0.915 | 0.800 to 0.894 | 0.916 | 0.731 |
| Food neophobia (neophobic items FN1, FN4) | FN | 0.772 (0.728 to 0.809) | 0.773 | 0.677 to 0.931 | 0.793 | 0.662 |
| Openness to new foods (neophilic items FN2, FN3) | OPN | 0.874 (0.850 to 0.894) | 0.874 | 0.848 to 0.915 | 0.875 | 0.778 |
| Pre-specified four-item reverse-scored neophobia score | FN4rev | 0.533 (0.462 to 0.596) | 0.552 | not modelled | not modelled | not modelled |
| Recent consumption | CONS | 0.920 (0.908 to 0.931) | 0.921 | 0.757 to 0.936 | 0.921 | 0.747 |
CI, confidence interval; CR, composite reliability; AVE, average variance extracted. Omega is McDonald's omega for four-item scales and the Spearman-Brown coefficient for two-item scales. Loadings, CR and AVE come from the six-construct confirmatory factor analysis; the four-item reverse-scored score was not modelled because its items load on two factors (Section 3.3).
Table 5.
Spearman rank correlations between construct scores with bootstrap 95% confidence intervals (2000 resamples).
Table 5.
Spearman rank correlations between construct scores with bootstrap 95% confidence intervals (2000 resamples).
| Construct | HC | PNV | FCM | FN | OPN | CONS |
| HC | 1 | |||||
| PNV | 0.386*** [0.302, 0.465] | 1 | ||||
| FCM | 0.676*** [0.615, 0.731] | 0.443*** [0.363, 0.518] | 1 | |||
| FN | -0.197*** [-0.288, -0.107] | -0.208*** [-0.298, -0.118] | -0.241*** [-0.326, -0.155] | 1 | ||
| OPN | 0.324*** [0.237, 0.406] | 0.384*** [0.302, 0.465] | 0.377*** [0.289, 0.456] | 0.074 [-0.030, 0.176] | 1 | |
| CONS | 0.116** [0.023, 0.203] | 0.373*** [0.285, 0.454] | 0.183*** [0.091, 0.271] | -0.272*** [-0.361, -0.181] | 0.313*** [0.224, 0.396] | 1 |
HC, health consciousness; PNV, perceived nutritional value; FCM, health and natural-content food choice motives; FN, food neophobia (neophobic subscale); OPN, openness to new foods (neophilic subscale); CONS, consumption of alternative-ingredient bakery products in the previous 30 days. * p < 0.05; ** p < 0.01; *** p < 0.001.
Table 6.
Hypothesis 1: health consciousness as a mediator between health and natural-content motives and perceived nutritional value (standardized coefficients; N = 504; 5000 bootstrap resamples).
Table 6.
Hypothesis 1: health consciousness as a mediator between health and natural-content motives and perceived nutritional value (standardized coefficients; N = 504; 5000 bootstrap resamples).
| Path | Coefficient | 95% CI | p / decision |
| Model 1: no covariates | |||
| FCM → HC (a) | 0.710 | 0.637 to 0.784 | p < 0.001 |
| HC → PNV (b) | 0.196 | p = 0.006 | |
| FCM → PNV direct (c') | 0.346 | p < 0.001 | |
| FCM → PNV total (c) | 0.486 | p < 0.001 | |
| Indirect effect (a × b) | 0.139 | 0.044 to 0.240 (bootstrap) | excludes zero |
| R2 mediator / R2 outcome | 0.504 / 0.255 | ||
| Model 2: adjusted for age group, sex and education | |||
| FCM → HC (a) | 0.704 | 0.626 to 0.781 | p < 0.001 |
| HC → PNV (b) | 0.195 | p = 0.007 | |
| FCM → PNV direct (c') | 0.381 | p < 0.001 | |
| FCM → PNV total (c) | 0.519 | p < 0.001 | |
| Indirect effect (a × b) | 0.137 | 0.044 to 0.237 (bootstrap) | excludes zero |
| R2 mediator / R2 outcome | 0.505 / 0.286 |
FCM, health and natural-content food choice motives; HC, health consciousness; PNV, perceived nutritional value; CI, confidence interval. Ordinary least squares with HC3 heteroscedasticity-consistent standard errors; percentile bootstrap intervals for the indirect effect.
Table 7.
Hypothesis 2: perceived nutritional value as a mediator between health consciousness and recent consumption (standardized coefficients; N = 504; 5000 bootstrap resamples; adjusted for age group, sex and education).
Table 7.
Hypothesis 2: perceived nutritional value as a mediator between health consciousness and recent consumption (standardized coefficients; N = 504; 5000 bootstrap resamples; adjusted for age group, sex and education).
| Path | Coefficient | 95% CI | p / decision |
| Model 1: no covariates | |||
| HC → PNV (a) | 0.442 | 0.344 to 0.541 | p < 0.001 |
| PNV → CONS (b) | 0.391 | p < 0.001 | |
| HC → CONS direct (c') | -0.004 | p = 0.931 | |
| HC → CONS total (c) | 0.169 | p < 0.001 | |
| Indirect effect (a × b) | 0.173 | 0.117 to 0.236 (bootstrap) | excludes zero |
| R2 mediator / R2 outcome | 0.196 / 0.152 | ||
| Model 2: adjusted for age group, sex and education | |||
| HC → PNV (a) | 0.454 | 0.349 to 0.560 | p < 0.001 |
| PNV → CONS (b) | 0.377 | p < 0.001 | |
| HC → CONS direct (c') | 0.044 | p = 0.364 | |
| HC → CONS total (c) | 0.215 | p < 0.001 | |
| Indirect effect (a × b) | 0.171 | 0.113 to 0.235 (bootstrap) | excludes zero |
| R2 mediator / R2 outcome | 0.217 / 0.185 |
HC, health consciousness; PNV, perceived nutritional value; CONS, consumption in the previous 30 days; CI, confidence interval. Ordinary least squares with HC3 heteroscedasticity-consistent standard errors; percentile bootstrap intervals for the indirect effect.
Table 8.
Hypothesis 3: food neophobia as a moderator of the paths from perceived nutritional value and health consciousness to recent consumption (standardized coefficients; N = 504; 5000 bootstrap resamples; adjusted for age group, sex and education).
Table 8.
Hypothesis 3: food neophobia as a moderator of the paths from perceived nutritional value and health consciousness to recent consumption (standardized coefficients; N = 504; 5000 bootstrap resamples; adjusted for age group, sex and education).
| Term | Coefficient | 95% CI | p / decision |
| Primary moderator: food neophobia, FN (neophobic items) | |||
| PNV → CONS (b, at mean FN) | 0.353 | p < 0.001 | |
| FN → CONS | -0.177 | p < 0.001 | |
| HC → CONS direct (c', at mean FN) | 0.002 | p = 0.968 | |
| HC × FN | -0.059 | p = 0.266 | |
| PNV × FN | 0.082 | p = 0.106 | |
| Index of moderated mediation | 0.037 | -0.008 to 0.078 | includes zero |
| Conditional indirect effect, FN at -1 SD | 0.123 | 0.056 to 0.202 | |
| Conditional indirect effect, FN at mean | 0.160 | 0.107 to 0.219 | |
| Conditional indirect effect, FN at +1 SD | 0.198 | 0.129 to 0.266 | |
| R2 outcome | 0.218 | ||
| Sensitivity moderator: openness to new foods, OPN (neophilic items) | |||
| PNV → CONS (b, at mean OPN) | 0.304 | p < 0.001 | |
| OPN → CONS | 0.206 | p < 0.001 | |
| HC → CONS direct (c', at mean OPN) | -0.008 | p = 0.878 | |
| HC × OPN | -0.067 | p = 0.174 | |
| PNV × OPN | 0.089 | p = 0.081 | |
| Index of moderated mediation | 0.040 | -0.004 to 0.086 | includes zero |
| Conditional indirect effect, OPN at -1 SD | 0.098 | 0.030 to 0.176 | |
| Conditional indirect effect, OPN at mean | 0.138 | 0.086 to 0.199 | |
| Conditional indirect effect, OPN at +1 SD | 0.178 | 0.110 to 0.253 | |
| R2 outcome | 0.221 | ||
| Sensitivity moderator: pre-specified four-item reverse-scored score | |||
| PNV → CONS (b, at mean FN4) | 0.273 | p < 0.001 | |
| FN4 → CONS | -0.330 | p < 0.001 | |
| HC → CONS direct (c', at mean FN4) | -0.048 | p = 0.384 | |
| HC × FN4 | -0.073 | p = 0.131 | |
| PNV × FN4 | 0.056 | p = 0.264 | |
| Index of moderated mediation | 0.026 | -0.019 to 0.070 | includes zero |
| Conditional indirect effect, FN4 at -1 SD | 0.099 | 0.037 to 0.170 | |
| Conditional indirect effect, FN4 at mean | 0.124 | 0.074 to 0.182 | |
| Conditional indirect effect, FN4 at +1 SD | 0.150 | 0.081 to 0.226 | |
| R2 outcome | 0.256 |
HC, health consciousness; PNV, perceived nutritional value; CONS, consumption in the previous 30 days; FN, food neophobia; OPN, openness to new foods; FN4, four-item reverse-scored neophobia score; CI, confidence interval. Predictors and moderators mean-centred; percentile bootstrap intervals.
Table 9.
Hypothesis 4: construct scores by self-reported dietary pattern, median [IQR] and Kruskal-Wallis tests.
Table 9.
Hypothesis 4: construct scores by self-reported dietary pattern, median [IQR] and Kruskal-Wallis tests.
| Construct | Omnivore (n = 384) | Flexitarian (n = 79) | Restricted diets (n = 41) | H; p | epsilon2 |
| Recent consumption | 3.00 [2.19-3.75] | 3.00 [2.50-4.00] | 2.50 [2.00-3.50] | 4.09; p = 0.130 | 0.008 |
| Perceived nutritional value | 3.50 [3.00-4.00] | 3.75 [3.00-4.00] | 3.50 [3.00-4.00] | 2.19; p = 0.334 | 0.004 |
| Health consciousness | 4.00 [3.50-4.50] | 4.00 [3.62-4.62] | 4.00 [3.00-5.00] | 0.14; p = 0.931 | 0.000 |
| Health and natural-content motives | 4.00 [3.50-4.50] | 4.00 [3.50-4.75] | 4.00 [3.00-4.75] | 2.41; p = 0.300 | 0.005 |
| Food neophobia | 3.00 [2.00-3.50] | 3.00 [2.00-3.00] | 3.00 [2.00-3.50] | 0.07; p = 0.968 | 0.000 |
| Openness to new foods | 4.00 [3.00-4.00] | 4.00 [3.00-4.00] | 4.00 [2.50-4.00] | 1.01; p = 0.603 | 0.002 |
Restricted diets combine vegetarian, vegan and gluten-free respondents. IQR, interquartile range; H, Kruskal-Wallis statistic (2 degrees of freedom); epsilon2, rank-based effect size. Dunn post hoc comparisons with Bonferroni correction are reported in the text.
Disclaimer/Publisher’s Note: The statements, opinions and data contained in all publications are solely those of the individual author(s) and contributor(s) and not of MDPI and/or the editor(s). MDPI and/or the editor(s) disclaim responsibility for any injury to people or property resulting from any ideas, methods, instructions or products referred to in the content. |
© 2026 by the authors. Licensee MDPI, Basel, Switzerland. This article is an open access article distributed under the terms and conditions of the Creative Commons Attribution (CC BY) license (http://creativecommons.org/licenses/by/4.0/).
Copyright: This open access article is published under a Creative Commons CC BY 4.0 license, which permit the free download, distribution, and reuse, provided that the author and preprint are cited in any reuse.