

Submitted:
25 September 2026
Posted:
28 September 2026
You are already at the latest version
Abstract
This article constructs and evaluates a composite sustainability index aligned with the 5P framework (People, Planet, Prosperity, Peace, and Partnerships) to compare Colombia and Mexico with 14 selected countries and territories in the Middle East and its regional environment, using information available for 2020–2023. The design is quantitative, documentary, and comparative and integrates eight international indicators. The main specification is estimated for 16 comparable cases, after verifying coverage, harmonizing directionality, controlling extreme values, and normalizing the variables on a scale from 0 to 100. Uniform weighting by dimension constitutes the baseline scenario, while an expanded database of 32 countries is used exclusively for exploratory KMO and Bartlett diagnostics and to estimate alternative weights through principal component analysis. The countries with the best aggregate performance are Colombia, Israel, Mexico, and Kuwait, although their results are not homogeneous across the evaluated dimensions. The nonparametric Spearman and Kendall coefficients, together with the leave-one-out tests and the Monte Carlo simulation, confirm that the classification is generally stable, although changes occur when assumptions incorporated into the model are modified. Likewise, the comparison with the SDG Index yields moderate convergence results (Spearman ρ = 0.507; Kendall τ = 0.371; Pearson r = 0.550). Under these conditions, the index is useful for identifying performance groups, characterizing profiles, and detecting gaps across countries; it also constitutes a transparent and replicable tool whose results should be interpreted as an analytical approximation rather than as a definitive classification or a measure that fully captures the sustainability of a nation.
Keywords:
composite index
; 5P framework
; sustainability indicators
; sustainable development
; international comparison
1. Introduction
Sustainable development as set out in the 2030 Agenda proposes an integrated vision of sustainable development, articulated through five axes that encompass people, planet, prosperity, peace, and partnerships [1]. The strength of this framework lies in recognizing interdependencies, whereby progress in both the social and economic spheres is conditioned by the protection of environmental systems, the development of institutional capacities, and collaboration among actors [1].
Given the particular characteristics of this integrative framework, a weakness can be identified in terms of evaluation due to the current structure of unidimensional indicators, which limits the structural reading of results and intersectoral trade-offs.
According to the methodological consensus, the development of composite indices enhances analytical capacity and the interpretation of results; however, to achieve this, their construction must be based on transparent constructs that explicitly incorporate uncertainty assessment and subsequently subject the results to robustness and sensitivity checks [2,3,4,5,6,7].
It is important to note that the use of composite indices to construct rankings entails a series of both technical and methodological challenges, because the results are sensitive to the selection, normalization, weighting, and aggregation criteria employed [2,7].
Indeed, even small variations in Min–Max thresholds can modify the relative ordering, which requires explicit sensitivity tests to ensure the robustness of the indicator [8]. Therefore, evaluating the 5P model, whose nature is multidimensional, requires a formative measurement logic, since each component contributes a unique dimension to the construct and, given this approach, the components do not depend on high correlations to remain relevant. In this context, the quality of the measurement and the validity of the tool are not based on overall internal consistency; rather, their support derives from the robustness of the theoretical framework, methodological traceability, and the stabilization of results under alternative methodological decisions [2,3].
Given the advances in international measurement systems and metrics, it can be observed that the empirical operationalization of the 5P framework still lacks comparable indicators grounded in explicit uncertainty principles. This deficit becomes more evident when comparing regions such as Latin America and the Middle East, where productive, environmental, and geopolitical structures are often represented through aggregate global indicators. In this context, the study proposes a formative measurement architecture that methodologically separates index construction (design, weighting, and aggregation of dimensions) from robustness analysis (sensitivity, stability, and uncertainty tests), thereby differentiating the two analytical levels.
Under this approach, two methodological expectations are examined. On the one hand, H1 posits the stability of the general ordering of the 5P index under plausible alternative specifications; on the other hand, H2 anticipates that equivalent aggregate positions may arise from heterogeneous dimensional profiles, so performance blocks will be analytically more stable than individual ranks. These hypotheses have no causal intent and operate only as a guide for sensitivity analysis and comparative interpretation.
Based on the preceding premises, the general objective of the research is to construct and evaluate a composite sustainability index aligned with the 5P framework that enables comparison of the relative position of Colombia and Mexico with the economies of the Middle East and its regional environment over the 2020–2023 time window. Specifically, the study addresses three key questions: first, how are countries ranked when People, Planet, Prosperity, Peace, and Partnerships are integrated into a common measure? Second, which dimensions and compensation patterns explain interregional and intraregional gaps? Finally, how robust is this ordering to variations in normalization, weighting, the treatment of extreme values, and the exclusion of variables?
The contribution of the article is considered threefold. The first contribution is a replicable methodological framework for constructing a composite index aligned with the 5P framework and with international guidelines for producing comparative rankings [2,7]. The second contribution is comparative evidence for Colombia and Mexico relative to countries and territories in the Middle East and its regional environment, with a dimension-level interpretation. Finally, it implements an explicit assessment of ranking robustness in accordance with the recommendations, thereby avoiding overinterpretations tied to a single methodological design [3,8].
To address the issues outlined above, the article is organized into six sections. Following this introduction, Section 2 develops the theoretical framework; the methodological design is addressed in Section 3; Section 4 presents the aggregate, dimensional, and robustness results; Section 5 discusses the findings and their strategic implications; and Section 6 presents the conclusions, limitations, and future lines of work.
2. Theoretical Framework
2.1. Sustainable Development and the 5P Approach
Sustainable development has become established as a normative and analytical framework that seeks to integrate social, environmental, economic, and institutional objectives simultaneously into public and private decision-making processes. Within the structure of the 2030 Agenda, this integration is explicitly reflected in the 5P approach (People, Planet, Prosperity, Peace, and Partnerships), which states that sustainable progress requires coordinated efforts in human well-being, prosperity, environmental protection, institutional strength, and cooperation among actors [1]. From this perspective, sustainability is presented as a multidimensional phenomenon in which improvements in one area depend on enabling conditions and factors inherent in others, such as institutional stability and the development of partnerships to implement policies, or environmental resilience to ensure well-being and productivity over time [1].
In this context, the 5P approach is particularly valuable for comparative research because it provides a conceptual framework that integrates a cohesive scheme from which national realities with heterogeneous trajectories and diverse structural conditions can be addressed. Its intrinsic strength, however, also constitutes an operational weakness: making the 5Ps comparable is not a simple exercise of translating categories into numbers; rather, it is a process involving choices, including which indicators to prioritize and how to formalize disparate time series, how to standardize what is not originally standardized, and how to choose an aggregation criterion that does not distort the meaning of each dimension. In addition, the process must leave a sufficient methodological trail so that an external reader can follow it and independently assess the soundness of the comparisons drawn [9].
2.2. Composite Indices for Measuring Multidimensional Phenomena
In applied research, composite indices are used to condense multidimensional realities into a manageable figure. The apparent simplicity of an index conceals a methodical process structured around a network of technical choices and normative assumptions that are often not reported with the transparency and detail they require [9]. A relevant point is that anyone seeking to structure this type of tool must pass through four critical stages, each with its corresponding methodological rigor that will shape the result: selecting the indicators or alpha factors that will enter the structure, standardizing their scales to make them measurable, assigning weights that establish their relative importance, and defining the aggregation rule that combines them into a single value [9,10,11].
In addition, sustainability is a matter of greater complexity because countries rarely exhibit a balanced profile: the evidence indicates that while some may stand out in a particular area, they may show imbalances in other dimensions. Given this complexity, linear aggregation (a widely used approach) allows strengths in one area to compensate for weaknesses in other areas, potentially producing a synthetic result that is more favorable than the overall profile would warrant [12]. For this reason, experts recommend interpreting global indices together with the disaggregated profile and providing a detailed discussion of the degree of substitutability assumed by the aggregation procedure [9,12].
It is also important to clarify that even after taking the above precautions, the soundness of the index remains an open issue. This is supported by the findings of several studies showing that the nominal weights assigned to an indicator do not always correspond to the influence it ultimately exerts on the final result. It is therefore necessary not to rely on appearances alone, but to complement the analysis with estimates of effective contribution and to subject the index to a varied set of tests that modify the weights in order to assess ranking robustness [3,11].
2.3. Robustness, Sensitivity, and Ranking Stability
When a composite index is used to generate rankings, methodological requirements increase because relative positions may vary under reasonable changes in normalization, weighting, or the treatment of extreme values. Given this nature, the literature proposes evaluating ranking robustness as a central quality criterion, because a classification is more reliable if it remains stable across different plausible scenarios [4]. In practice, ranking robustness can be examined by comparing alternative rankings obtained through systematic modifications of the methodological specifications and by quantifying the degree of concordance using rank-correlation coefficients such as Spearman (ρ) or Kendall (τ) [5,6].
Empirical evidence shows that ranking behavior is not always stable, a dynamic that may arise from the interaction among weights, aggregation, and data structure. Experts therefore recommend incorporating alternative weighting scenarios, comparing normalization methods such as min–max versus z-scores, and examining the effect of extreme values [8,10]. It has also been noted that seemingly technical decisions, such as the thresholds set in min–max scaling, can produce fragile rankings, reinforcing the need to report sensitivity as part of methodological transparency [8,13]. Taken together, these recommendations justify that a comparative sustainability study should not be limited to reporting the aggregate ranking; it should go further by presenting a disaggregated profile by dimension and demonstrating how the ordering responds under alternative conditions.
2.4. Global Sustainability Indices as External References
In the field of sustainability, various comparative frameworks have been developed, and tools such as the SDG Index have become a key reference for measuring progress toward the 2030 Agenda. These systems serve as an external benchmark for comparing results, identifying coincidences, or analyzing why two metrics differ according to their coverage or weighting [14]. However, the methodological literature calls for these data to be examined in sufficient detail, because differences between indices do not necessarily indicate real progress; rather, they may reflect disparities in the conceptual framework, aggregation technique, or data quality itself [2,9].
In comparative studies involving heterogeneous regions such as Latin America and the Middle East, these external benchmarks help determine whether the ordering obtained from the index is consistent with global assessments, while also allowing analysis of the influence of structural variables. This dynamic also opens discussion of underlying structural factors, such as political instability, institutional gaps, and data scarcity, which jointly condition territorial realities and the way these dimensions are measured [14].
In light of the considerations described above, the 5P index incorporates an explicit conceptual design together with robustness controls, in contrast with global frameworks, thereby supporting interpretation with methodological transparency.
2.5. International Indicators and Multidimensional Measurement
Assessing sustainable development requires metric tools capable of capturing its multiple dimensions. Accordingly, in recent decades international indicators have become established for measuring human well-being, environmental performance, economic growth, resource security (water–energy–food), democratic quality, peace, and intersectoral cooperation; however, observing each indicator individually provides only a fragmented view [15,16]. In this context, expert guidance favors the integration of metrics that make it possible to identify patterns, detect imbalances, and establish correlations among dimensions, thereby reducing biases and enabling more robust comparisons [17,18], which is particularly important in regions with contrasting realities such as Latin America and the Middle East.
Within this framework, economic growth, commonly estimated through changes in real GDP, becomes a relevant factor for sustainable development because its influence extends to variables such as employment, income, investment, and the state’s fiscal revenue capacity to provide public goods and services [19,20]. On the other hand, its analytical scope is limited when used as an isolated indicator and must be complemented by indicators of distribution, well-being, environmental sustainability, and institutional stability [21]. This multidimensional framework must also incorporate the resource-security dimension, because demographic pressures, accelerated urbanization, and changes in consumption patterns intensify the use of natural resources, reinforcing the water–energy–food nexus as an indispensable analytical framework for assessing systemic resilience and resource interdependence [18,22,23].
In addition, the Human Development Index (HDI) synthesizes the dimensions of health, education, and real income, making it possible to identify differences in human development among countries with similar income levels and revealing well-being asymmetries that are not adequately explained by per capita income. Nevertheless, it has limitations in explicitly capturing inequality, multidimensional poverty, or social security [24,25].
Complementarily, the Happy Planet Index (HPI) links subjective well-being, life expectancy, and ecological footprint, making it possible to estimate how efficiently national systems transform natural capital into human development outcomes [15,16,26].
The Green Growth Index, in turn, quantifies performance in resource efficiency, preservation of natural capital, green economic opportunities, and social inclusion, providing guidance for strengthening sustainability policies [27,28,29].
With regard to the institutional dimension, the Democracy Matrix assesses democratic quality through sociopolitical dimensions and institutions, providing empirical evidence to identify strengths and weaknesses in democratic systems [30,31,32]. Regarding collaborative governance, the Concordia Partnership Index assesses the ecosystem most conducive to multi-actor governance by analyzing the viability of public–private partnerships, particularly in terms of shared-risk mitigation and the degree to which states and intersectoral actors can leverage their capacities [33,34,35]. Finally, the Global Peace Index provides a methodology for measuring the Peace dimension that goes beyond the absence of armed conflict, incorporating dimensions of security and stability and thereby facilitating international comparisons and trend analysis [36]. In this context, the convergence of these instruments provides a rationale for developing an integrated and multidimensional approach capable of addressing the complexity of sustainable development.
3. Materials and Methods
The methodology is organized into two complementary components that directly correspond to the scope announced in the title. The first comprises the construction of the 5P Composite Index: conceptual delimitation, indicator selection and screening, coverage verification, directionality adjustment, normalization, subindex calculation, weighting, and aggregation. In the second phase, the instrument is analytically validated and evaluated by linking the formative conceptual model with six empirical tests required to provide consistency to the results, including exploratory analysis, sensitivity to normalization and outliers, stability in ordinal rankings, the leave-one-out test, uncertainty quantification, and external validation. This methodological sequence made it possible to separate the internal operations of the indicator from the empirical support that defines the margins of validity and the limits of interpretation.
3.1. Study Design and Unit of Analysis
The study adopts a quantitative, documentary, and comparative design aimed at constructing and applying a composite index aligned with the 5P framework (People, Planet, Prosperity, Peace, and Partnerships) to assess relative performance across countries. The unit of analysis is the country, and the level of observation corresponds to aggregate indicators obtained from international sources. In line with the methodological literature on composite indices, the construction process makes explicit the decisions regarding selection, normalization, weighting, and aggregation and is accompanied by ranking robustness tests [3,9].
3.2. Data, Sample, and Reference Window
The study sample comprises 16 units of analysis (15 countries and one territory): Colombia, Mexico, Israel, Kuwait, the United Arab Emirates, Oman, Türkiye, Saudi Arabia, Jordan, Qatar, Pakistan, Egypt, Bahrain, Iran, Palestine, and Iraq. Colombia and Mexico serve as Latin American reference cases, while the remaining units represent economies and territories in the Middle East and its regional environment,
The selection exercise follows a contrasting-case design focused on assessing how the dynamics and combinations of human well-being, environmental performance, economic dynamism, peace, and cooperation are transformed into an integrated synthetic metric.
The expression regional environment reflects the variability in international geographical classifications of Türkiye and Pakistan, as well as the status attributed to Palestine as a sovereign territory in statistical repositories. Criteria of completeness, consistency, and interinstitutional comparability were also used to delimit the sample for the eight constituent indicators over the 2020–2023 observation window.
To estimate the global hierarchy, the study results were calculated using the group of observations retained in the validated sample. For this purpose, the study adopted a harmonized cross-sectional scope, using the latest available records within the analysis window.
The sample-selection process was structured in two phases. In the first phase, the temporal and cross-sectional completeness matrix was assessed, and cases with data vectors containing no omissions were selected, thereby avoiding biases arising from statistical imputation procedures. Subsequently, an expanded database of 32 countries meeting the coverage criterion for the eight indicators was formed. This database does not serve to evaluate individual cases or reorder the study cases; its purpose is to provide a comparatively less restricted sample basis for exploratory estimation of KMO, Bartlett’s test of sphericity, and weights derived from principal component analysis (PCA).
To make this result possible, it was necessary to separate the databases as a design decision. Thus, to preserve the geographical and comparative coherence of the applied objective, the 16-case sample maintains the comparative coherence of the applied objective, while the 32-country database partially mitigates the fragility of estimating covariances with only 16 observations.
Consequently, the analyses developed with the expanded database of n = 32 are used exclusively as an exploratory contrast with the baseline ranking. This strategy has methodological limitations: the expanded sample may contain a covariance structure different from that observed in the 16 cases; the subject-to-variable ratio (four observations per indicator) is below the standard threshold for factor analysis; and the empirical weights have neither causal validity nor substitutive validity relative to the normative specification of the construct.
Given this complexity, the replicability of the study is ensured through explicit traceability of the primary sources, the temporal window of the data, the scale-transformation operators, the winsorization limits, and the aggregation algorithms detailed in the document.
3.3. Construction Process of the 5P Composite Index
The 5P Index was developed through a methodical procedure covered in seven stages. The first consisted of conceptually aligning the indicators with the five dimensions and defining their directionality. This was followed by verification of temporal homogeneity together with an assessment of redundancy and treatment of extreme values. Once the data had been normalized to a common metric, the dimensional subindices were calculated, weights were assigned, and the final ranking was obtained through aggregation. The index-evaluation analyses were conducted subsequently and are not operations required for its construction.
3.3.1. Coding, Screening, and Conceptual Alignment
Based on the methodological sequence described above, the indicators were coded according to their 5P dimension, operational definition, source, temporal rule, directionality, coverage, redundancy risk, and inclusion status. Table 1 reflects this traceability at the point where the decision is made to retain, reassign, or exclude each variable.
To strengthen content validity, a dimension-level congruence review was conducted to verify that the selected indicators adequately represented the construct and that their directionality was homogeneous [9]. For the People dimension, the selection focused on documented well-being and human-development indicators (HDI), to which the HPI was added as a sustainability-oriented measure of well-being. It is important to note that the HPI may amplify cross-country differences because of its dispersion, which justifies including sensitivity analysis to assess its impact [8]. In the Planet dimension, environmental-performance and resource-resilience metrics (Green Growth Index and WEF Nexus Index) were included, because the water–energy–food nexus represents enabling conditions for environmental sustainability and resource security [9].
In the Prosperity dimension, average GDP growth over 2021–2022 was used as an approximation of economic dynamism because of its homogeneous availability across the sample. Because this variable is cyclical, it does not provide a complete representation of structural prosperity and may reflect the recovery effect following the 2020 contraction; for this reason, its interpretation is kept separate from income-level indicators, and its effect is examined through weighting scenarios and leave-one-out tests. Future iterations could incorporate GDP per capita, employment, productivity, or national income, provided that consistent information is available for all cases.
Because composite metrics were included in the structural development of the index, there is a potential risk of implicit collinearity.
Indicators such as the HDI, HPI, Green Growth Index, and WEF Nexus Index intrinsically contain subdimensions in the socio-environmental and economic fields, while the GPI and democratic-quality measures share attributes related to governance and cooperation capacities.
Given the evident interdependence among the variables, the classification for the 5P index was resolved by identifying the dominant conceptual component of each metric while acknowledging the covariance inherent among the selected alpha variables. For reasons of temporal coverage and international comparability, the Prosperity and Partnerships dimensions were each synthesized using a single indicator, which ensures parsimony and sample consistency while narrowing the descriptive scope of both domains.
These methodological limitations are addressed through weighting simulations, together with unidimensional analyses and leave-one-out validation. For this reason, the resulting instrument is a formative index intended to condense the complexity of development rather than a reflective scale composed of interchangeable variables.
Table 1 presents the structure of the matrix in which the indicators considered for constructing the 5P index are coded and screened.
Table 1 shows the sequence of filters used in the exercise. The first was applied to assess the 5P framework conceptually; the second verified coverage and temporal consistency over the 2020–2023 window; the third examined redundancy, dominance, and sensitivity to extreme values; and a fourth evaluated ranking robustness based on potential changes in normalization and weighting methods. To ensure international comparability, indicators with sufficient data were retained, and the exercise was complemented by recoding and pre-normalization adjustments in cases where the original scale had an inverse interpretation. Given the multidimensional nature of the construct, the selection criterion was grounded in the model’s theoretical soundness and the analytical robustness of the ranking under alternative methodological specifications [3,7,8,9].
Table 1 shows that indicator selection balances information availability while enabling a systemic assessment within the 5P framework, taking into account scale polarity and sensitivity to outliers. Although this logic reduces discretion in model specification, partial conceptual overlap among attributes is acknowledged; consequently, the aggregate score was assessed using unit-omission analysis and weighting scenarios.
3.3.2. Operational Map of the 5P Composite Index
Based on the screening reported in Table 1, the 5P Index is operationalized through dimension-level subindices and a global index. Table 2 summarizes the indicators included, the temporal criterion applied, and the adjustments required to maintain a consistent interpretation across scales (for example, when an original indicator is interpreted in the opposite direction).
Table 2 shows that the dimensions are not composed of the same number of indicators: People, Planet, and Peace each comprise two measures, whereas Prosperity and Partnerships depend on a single indicator.
For the Partnerships pillar, inclusion of the Concordia Partnerships index responds to its alignment with public–private coordination capacity, while recognizing the exclusion of dimensions related to trade, technical cooperation, and international financing. This methodological restriction provides operational balance and transparency, but it narrows the conceptual coverage and conditions the subindices to a formative interpretation. For these reasons, the influence of the indicator was subjected to individual-omission tests and weighting simulations.
3.3.3. Directionality Adjustment and Normalization
Because the indicators come from heterogeneous scales, the baseline specification transforms them to a common scale from 0 to 100. Equation (1) is applied to indicators with positive directionality.
where is the normalized value of indicator for country , expressed on a scale from 0 to 100; is the original observed value of indicator for country ; () and () are, respectively, the minimum and maximum values of indicator across the countries in the sample, after the conservative treatment of extreme values has been applied. The subscript identifies the country and the subscript identifies the indicator. Equation (1) is applied to variables with positive directionality, for which a higher original value represents better performance: the minimum is transformed to 0, the maximum to 100, and intermediate values retain their proportional position within the observed range.
When the original scale interprets a lower value as better performance, the inverse transformation in Equation (2) is used.
where is the normalized value of indicator for country , expressed on a scale from 0 to 100; represents the original observed value of indicator for country ; () corresponds to the maximum value of indicator in the sample; and () corresponds to the minimum value of the same indicator. The subscript identifies the country and the subscript identifies the indicator. Equation (2) is applied to variables with inverse directionality, that is, variables for which a lower original value represents better performance. With this transformation, the lowest observed value receives 100 and the highest receives 0. In this study it was applied to the Global Peace Index (GPI), whose original scale assigns better peace conditions to lower values; after inversion, a higher value of represents better relative performance in the Peace dimension, consistently with the other components of the 5P Index.
3.3.4. Data Coverage and Comparability Criterion
Data coverage was verified before calculating the subindices and the global index. No statistical imputations or weighting readjustments due to partial availability were applied; only countries with sufficient, consistent, and temporally compatible information for all eight indicators were retained. Cases without minimum coverage were excluded from the main ranking. The values used come from the international sources identified for each indicator and were subjected to a common rule for directionality adjustment, treatment of extremes, and normalization. Consequently, all countries included in the ranking were evaluated using the same structure of eight indicators and five dimensions, preventing relative position from depending on different information sets across cases.
3.3.5. Construction of Subindices, Weighting, and Global Aggregation
The baseline specification uses uniform weighting because of its transparency. First, each dimensional subindex is calculated using Equation (3).
where is the subindex obtained by country in dimension of the 5P framework; is the number of indicators assigned to that dimension; is the normalized value for country on indicator ; and the condition indicates that the sum includes only the indicators belonging to dimension . The index runs over the indicators in the dimension. Equation (3) calculates each subindex as a simple arithmetic mean, so all indicators included within the same dimension receive the same internal weight. The result remains on the 0-to-100 scale.
The global index with equal dimension weights is expressed in Equation (4).
where is the global 5P Index score for country ; is the weight assigned to dimension ; is the subindex of country in that dimension; and the summation operator runs over the five dimensions, from to . The weights must satisfy and sum to one. Equation (4) aggregates People, Planet, Prosperity, Peace, and Partnerships into a single score from 0 to 100. Because the aggregation is linear and compensatory, high performance in one dimension may partially compensate for low performance in another; therefore, the global result is interpreted together with the dimensional profiles and sensitivity tests.
Under the uniform scenario, dimensional weights are defined using Equation (5).
where is the uniform weight assigned to dimension and the value 5 represents the total number of dimensions in the framework. Consequently, , so each dimension contributes 20% to the global index. Equation (5) defines the main weighting specification, chosen for its transparency and because it avoids assigning greater normative importance to any of the 5Ps. This assumption is subsequently contrasted with PCA-derived weights.
This scheme is compensatory; therefore, its interpretation is accompanied by ranking-robustness tests to verify that the ordering does not depend on a single weighting or normalization structure [9,12].
The result of this process is a 5P Composite Index expressed on a scale from 0 to 100 for the 16 countries and territories in the main sample, accompanied by five dimensional subindices and a baseline ranking. The construction maintains a common information structure for all cases and makes explicit the decisions concerning directionality adjustment, normalization, weighting, and aggregation. Based on this specification, the following section evaluates the behavior of the index under alternative scenarios and complementary diagnostics.
3.4. Evaluation Strategy for the 5P Composite Index
Once the baseline index had been constructed, its evaluation was organized as an empirical protocol comprising five levels of evidence. The first, conceptual phase examined content validity across the eight variables and the five 5P dimensions, as well as the potential overlaps previously reported in Table 1. At the second, exploratory level, the covariance matrix was assessed using KMO, Bartlett, PCA, and Cronbach’s alpha, not to validate a reflective scale but to empirically support the weighting structure. The third and fourth levels addressed methodological sensitivity (scaling, outliers, and weighting) and ordering consistency through the calculation of Spearman and Kendall coefficients and the leave-one-out technique. In the fifth phase, simulations were applied using the Monte Carlo technique to project the propagation of classification uncertainty under stochastic variations in the weights, thereby avoiding reliance on a single demonstrative test for model validity.
3.4.1. Sensitivity, Ordinal Robustness, and Leave-One-Out Test
To verify whether variations in methodological design affect countries’ relative positions [10,13], ranking robustness was examined through multiple tests and a set of scenarios designed to alter methodological decisions. The sensitivity analysis was structured around three axes: the weighting structure (theoretical and empirical weights), the normalization technique (min–max versus z-score), and the treatment of extremes (winsorization) [8,9]. Variations in the ordinal structure were quantified using the Spearman (ρ) and Kendall (τ) concordance measures, and a unit-omission analysis protocol (leave-one-out) was incorporated to isolate the individual influence of each indicator [11]. Finally, the robustness assessment was completed by testing the stability of the ordering within a formally admissible range of weights for ordinal sensitivity analysis [4,5,37,38].
Monotonic concordance between the baseline ranking and an alternative scenario is estimated with Spearman using Equation (6).
where is Spearman’s rank-correlation coefficient; is the difference between the position of country in the baseline ranking and its position in the alternative ranking; represents the square of that difference; is the total number of countries compared; and the summation includes all countries from to . Equation (6) quantifies overall ordinal concordance between two rankings: values close to 1 indicate a very similar ordering, values close to 0 indicate no monotonic association, and values close to −1 indicate an inverse ordering. The expression corresponds to the no-ties case; when ties occur, the coefficient is obtained from average ranks and their correlation.
As a contrast based on concordant and discordant pairs, Kendall is used according to Equation (7).
where is Kendall’s concordance coefficient; is the number of concordant country pairs, that is, pairs that maintain the same relative order in both rankings; is the number of discordant pairs, whose relative order changes; is the number of countries; and is the total number of possible pairs. Equation (7) evaluates ranking stability through pairwise comparisons. A value close to 1 indicates high preservation of pairwise ordering; a value close to 0 reflects low concordance; and a value close to −1 indicates inversion of the ordering. The form presented corresponds to Kendall without correction for ties; if ties exist, the corresponding adjusted variant is used.
Sensitivity to the exclusion of each indicator is summarized by the maximum rank change in Equation (8).
where is the largest absolute rank change caused by excluding indicator ; is the position of country in the ranking recalculated without indicator ; is the position of the same country in the baseline ranking; indicates that the largest difference observed across all countries is selected; and the vertical bars represent absolute value. Equation (8) summarizes the individual sensitivity of the ranking to a leave-one-out test: the larger is, the greater the magnitude of the changes and the more strongly the absence of that specific variable affects a country’s position. Based on this consideration, the index was recalculated by excluding one indicator at a time, re-estimating the index with combinations of seven variables and re-ranking the 16 countries to measure deviation from the baseline ranking. In this way, the Spearman and Kendall coefficients provide a synthetic measure of overall stability, complemented by the maximum rank change to avoid averaging bias in high global correlations.
3.4.2. Exploratory Covariance Diagnostics and Alternative Weighting
Given the structure of the 5P index and its statistical treatment, it should be noted that the procedure follows a strict functional delimitation. Owing to its formative architecture, which is structured around heterogeneous and complementary dimensions capable of capturing additional facets of sustainable development, the indicators are not treated as reflective manifestations of a hidden variable; this makes the use of traditional internal-consistency thresholds inappropriate as a quality filter. Because of its nature, assessment of the construct must go beyond conventional reliability metrics. Accordingly, KMO and Bartlett’s test of sphericity justify only the technical feasibility of exploratory PCA, whose purpose is limited to generating an alternative data-driven vector of weights. In this context, PCA does not seek to validate latent factors, but rather to provide deterministic weights for an ordinal sensitivity analysis. Cronbach’s alpha, in turn, serves only as a descriptive diagnostic of internal covariance.
To mitigate the impact of atypical data, the empirical strategy included the calculation of alternative weights and scenario modeling using the expanded database; the operational sequence for the 32 countries and eight indicators is summarized in Table 3.
Table 3 shows two key moments: first, the design of the index prior to aggregation and, second, the diagnostic evaluation of its behavior, both of which provide supporting evidence while respecting the conceptual architecture. Table 4 shows the statistical behavior of the model, including control of atypical data, normalization methods captured by PCA, alternative weights, and matrix-stability tests.
The information presented in Table 4 is complementary to the index-evaluation process and should not be understood as conclusive validation evidence. Its interpretation must be integrated with content validity, traceability of the construction process, dimensional profiles, and ranking stability under different methodological assumptions.
The information presented in Table 4 is complementary to the index-evaluation process and should not be understood as conclusive validation evidence. Its interpretation must be integrated with content validity, traceability of the construction process, dimensional profiles, and ranking stability under different methodological assumptions.
Given the marked variability in the database examined, a conservative treatment of atypical values was implemented through winsorization at the p5 and p95 thresholds before scaling. This neutralized the bias from extreme values while preserving the integrity of the multinational sample and helped prevent distortion of the Min–Max scale range and, consequently, of ranking distances. Table 5 details the operationalization of winsorization, which was applied uniformly to each variable.
Table 5 reports the p5–p95 thresholds used to winsorize each indicator and the number of observations adjusted at the extremes. In practical terms, these limits define the range within which the original data are preserved and identify the exact point at which replacement by the boundary value begins. These adjustments protect the min–max normalization scale by preventing artificial gaps from appearing in the structure of the overall index. In this context, Table 5 makes it possible to identify which indicators are more sensitive to atypical values, thereby supporting a more cautious analysis of how this dynamic affects interpretation of the ranking.
The next step involved Min–Max normalization, which homogenized the scale of the indicators within an ordinal interval from 0 to 100. This exercise enables comparability among variables with heterogeneous units and produces a uniform interpretation. To align the direction of all variables in the matrix, indicators whose directionality was opposite to this rule were recoded before scaling, maintaining the convergent validity of the aggregate indicator.
For the estimation of weights, principal component analysis was implemented as an exploratory tool intended to generate a weighting structure capable of capturing the interdependence among indicators. Although the first component explains a relevant proportion of total variance and its normalized loadings form an empirical weight vector that accounts for a relevant share of accumulated variance, the resulting solution does not constitute evidence of an implicit factor model of the 5Ps, nor is it intended to replace the theoretical equal-weighting scheme. This preserves the formative nature of the index and acknowledges the available sample size.
The score of the first principal component is obtained using Equation (9).
where is the score of the first principal component for country ; is the loading of indicator on the first component; is the standardized value of indicator for country , with mean zero and standard deviation one; is the total number of indicators included in the PCA, which in this study equals 8; and the summation runs over . Equation (9) linearly combines the standardized indicators to represent the covariance pattern that explains the largest proportion of variance in the expanded database of 32 countries. Its use is exploratory and is limited to generating an alternative weighting scenario; it does not validate latent factors or replace the main ranking of 16 countries.
The loadings are transformed into non-negative normalized weights using Equation (10).
where is the alternative weight assigned to indicator based on the PCA; is its loading on the first principal component; the absolute-value notation neutralizes the sign to prevent negative weights; is the loading of generic indicator on the same component; runs over the indicators; and the denominator normalizes the absolute values so that the sum of the weights equals 1. Equation (10) transforms the loading matrix into a comparable standardized weighting scheme, applied strictly as a robustness contrast to the original ranking, without assuming that the factor solution validates the latent structure of the 5P framework.
With the data screened, the next step is to evaluate the index and identify its sensitivity and stability when moving away from uniform weighting toward weights derived from the variability of the data themselves. The PCA weights are documented in Table 6.
Table 6 reports the loadings of the first principal component (PC1) and the normalized weights that sum to one. The scheme is interpreted as an empirical contrast in which variables more closely aligned with the overall PC1 pattern receive greater weight. It is also emphasized that, in this study, the structured weighting does not replace the baseline specification; rather, it acts as a sensitivity test to verify whether the ranking changes significantly when moving from a uniform criterion to a rule derived from sample variability.
When a dimension contains at least two indicators, alpha is calculated using Equation (11).
where is Cronbach’s alpha coefficient; denotes the number of indicators included in the evaluated set; is the variance of indicator ; is the variance of the total score obtained by summing the indicators; and the summation accumulates the individual variances from to . It is essential to indicate that Equation (11) is used only as an exploratory diagnostic of internal consistency. The 5P framework is conceived as a predominantly formative construct, so its dimensions represent complementary and not necessarily interchangeable facets.
Because the People, Planet, and Peace dimensions contain two indicators, their alpha coefficients are highly responsive to the association between each pair of variables, making automated cutoff rules inappropriate. Given this complexity, inclusion of each component is based on its theoretical role within the 5P structure and its effect on the final ordering. Accordingly, the interpretation process considers three criteria: thematic consistency, potential redundancy, and ranking sensitivity. This approach prevents a single parameter from determining the viability of a formative construct.
The overall value obtained was , which represents conceptual divergence among the 5P components and does not act as an exclusion filter. In the People dimension, , the results show coherence in linking two indicators that address differentiated aspects of human development and well-being in relation to ecological efficiency. The magnitude observed for the Planet dimension is = 0.990, suggesting redundancy between green growth and security of the water–energy–food triad. Finally, for the Peace dimension, after recoding the Global Peace Index (an action undertaken to homogenize the direction of the scale), the negative value of , reveals an inverse relationship between peace/security stability and democratic institutionality, which operate in opposite directions within the sample, rejecting the hypothesis of unidimensionality. The results justify separate readings of each indicator and the use of leave-one-out and sensitivity analyses to assess their influence. Alpha is not calculated for Prosperity and Partnerships because each dimension contains a single indicator.
Once an exploratory adequacy of the correlation matrix has been verified, graphical evidence is presented to facilitate interpretation of the components and alternative weights. These figures should be interpreted as descriptive support for the sensitivity analysis, not as confirmation of a definitive factor structure.
The Kaiser–Meyer–Olkin value (KMO = 0.866) and Bartlett’s test of sphericity (χ² = 359.75; df = 28; p < 0.001) indicate that there are sufficient correlations to apply PCA for exploratory purposes. However, the ratio of four observations per variable in the expanded database (32 cases and eight indicators) limits any confirmatory interpretation. Therefore, the components are used only to construct alternative weights and assess ranking stability.
As an exploratory complement, the scree plot is used to observe the concentration of variance in the first components. The retained solution is used to describe covariance and support sensitivity analysis; it is not intended to establish a definitive latent dimensionality for the 5P framework.
To examine how variance is distributed across the principal components, Figure 1 presents the scree plot obtained from the standardized variables.
Figure 1 shows a substantial concentration of variance in the first components and a marked decline in subsequent eigenvalues. This pattern supports the parsimonious use of PCA to generate alternative weights, although it does not by itself demonstrate that the 5Ps constitute latent factors or authorize a confirmatory interpretation of the structure.
With the retained number of factors, Varimax rotation is applied to facilitate interpretation of the loadings. Figure 2 presents the heat map of the rotated loadings and identifies indicators with stronger relative associations with each factor. This result is interpreted as exploratory evidence of the covariance structure: patterns of concentrated loadings suggest partially redundant blocks of information that are relevant when discussing index sensitivity to changes in weighting.
Figure 2 shows that some variables cluster with high loadings on specific components, whereas others display weaker or more distributed associations. This heterogeneity confirms that the indicators are not interchangeable and helps identify possible sources of dominance or overlap that may modify empirical weighting.
Complementarily, Figure 3 shows the correlation circle in the PC1–PC2 plane. This representation makes it possible to examine which indicators align with the dominant pattern captured by the first two components and, therefore, which tend to exert greater influence on the PCA-derived weighting scheme. The relative orientation of the vectors also facilitates identification of positive or inverse associations among indicators.
In Figure 3, the proximity and orientation of the vectors make it possible to identify positive associations, oppositions, and variables with low representation in the PC1–PC2 plane. Consequently, the graph should be interpreted as a covariance diagnostic useful for index sensitivity, not as definitive validation of the normative dimensions of the 5P framework.
Finally, Figure 4 reports the distribution of the weighted I5P–Score and indicates tertile cut-off points. This visualization supports a descriptive reading by groups (low, medium, and high) and makes it possible to assess whether the score distribution is concentrated within narrow ranges, which is relevant when interpreting small differences between adjacent ranking positions.
Figure 4 shows that the scores are not uniformly distributed and that clusters exist in different performance segments. Tertile cut-offs facilitate descriptive classification, but the small distances around each threshold advise against rigid labels and support complementing the interpretation with uncertainty intervals and dimension-level profiles.
Finally, robustness was assessed by comparing the baseline ranking with dimension-based weights, normative scenarios, PCA weights, alternative treatments of extremes, and leave-one-out tests. Rank correlations make it possible to assess overall concordance, whereas the maximum rank change identifies individual sensitivity. Consequently, a high correlation does not imply invariance: stability may be strong across performance blocks while remaining weak for exact positions. Because the available consolidated database reports the maximum magnitude of shifts but does not retain, in every scenario, the individual identity of the country responsible for that maximum, the interpretation prudently focuses on overall stability, performance blocks, and observed ranges of variation, without attributing specific unverified shifts.
3.4.3. Uncertainty Assessment through Monte Carlo Simulation
Deterministic sensitivity indicates how the ranking changes under predefined scenarios, but it does not describe the distribution of positions that may arise when weights vary simultaneously. To address this dimension, a Monte Carlo weighting simulation was performed on the normalized matrix of 16 countries and eight indicators. A total of 1,000 iterations were carried out per scenario. In each iteration, a vector of non-negative weights summing to one was generated, the aggregate score of each country was recalculated, and the resulting position was recorded. Two complementary scenarios were considered: a symmetric Dirichlet distribution with α = 50, which concentrates weights around equality, and another with α = 1, which allows widely dispersed combinations and constitutes a weighting stress test.
The weighting vector for iteration b is obtained using Equation (12).
where is the weighting vector generated in iteration ; is the weight assigned to indicator in that iteration; runs over the eight indicators, from to ; is the common concentration parameter of the Dirichlet distribution; establishes that the sum of the eight weights equals one; and imposes the non-negativity condition for each indicator. With , the weights are concentrated around and represent moderate perturbations of uniform weighting; with , the distribution allows more dispersed combinations of weights. Equation (12) generates, in each iteration, a complete alternative weighting structure that preserves the constraints required to recalculate the composite index.
For each generated vector, the simulated score for country i is recalculated using Equation (13).
where is the simulated aggregate score for country in iteration ; is the random weight assigned to indicator in that iteration; is the normalized value of country on indicator , expressed on a scale from to ; and represents the weighted sum of the eight indicators. After calculating for the countries, the scores are ordered from highest to lowest and the position attained by each case is recorded. Equation (13) makes it possible to obtain, for each country, the empirical distribution of positions, the median rank, the interquartile range, the probabilities of belonging to the Top-3 and Top-5, and the best and worst positions observed.
The simulation complements, but does not replace, the deterministic tests. Spearman, Kendall, and leave-one-out indicate how the ranking changes under specific scenarios; Monte Carlo evaluates how frequently each country occupies particular position intervals when the weights vary jointly. The results are interpreted at two levels: stability under moderate perturbations (α = 50) and resistance to widely dispersed weights (α = 1). Table 9 and Table 10 present the statistics derived from both scenarios and make it possible to assess whether stability is greater by performance blocks than by exact rank.
4. Results
The results are presented following the same analytical distinction used in the methodology. First, the product of the index-construction process is documented: final composition, scores, subindices, classification, and national profiles. The evaluation of its behavior is then presented through ordinal robustness, sensitivity, weighting uncertainty, and external comparison. This organization makes it possible to verify, on the one hand, how the 5P Composite Index is operationalized and, on the other, the extent to which its conclusions are maintained or change under alternative methodological decisions.
4.1. Results of the Construction of the 5P Composite Index
Construction culminated in a specification comprising eight indicators distributed across the five dimensions of the 5P framework, normalized on a common scale and aggregated using the uniform-weighting structure defined as the baseline scenario. This section presents the resulting index and does not yet constitute a robustness test; its purpose is to show the empirical product of the methodological decisions described in Section 3.3, including global scores, the ordering, and classification by performance blocks.
Figure 5 presents the aggregate 5P Index score (0–100) for the analyzed sample. The ranking places Colombia (83) first, followed by Israel (76) and Mexico (64). A second group comprises Kuwait (60), the United Arab Emirates (55), and Oman (54). Intermediate positions are occupied by Türkiye (51), Saudi Arabia (48), Jordan (46), and Qatar (42). Finally, the lowest scores correspond to Pakistan (38), Egypt (37), Bahrain (36), Iran (36), Palestine (34), and Iraq (32).
For descriptive purposes and without overinterpreting small differences, the ranking can be read in three blocks:
- High block (≥60): Colombia, Israel, Mexico, and Kuwait.
- Medium block (42–55): United Arab Emirates, Oman, Türkiye, Saudi Arabia, Jordan, and Qatar.
- Low block (≤38): Pakistan, Egypt, Bahrain, Iran, Palestine, and Iraq.
This block-based reading is complemented by analysis by dimension (5P) to identify which components drive relative performance, as well as by ranking-robustness tests under alternative specifications, as recommended by methodological frameworks for comparative composite indices [3,7,8,9].
The overall comparison among the countries and territories analyzed is summarized in Figure 5, which presents the aggregate 5P Index score on a common scale from 0 to 100.
Figure 5 makes it possible to identify a top block led by Colombia and Israel, followed by Mexico and Kuwait, as well as intermediate and lagging groups. However, the exact ordinal position should not be interpreted as an absolute measure of sustainability: the result depends on the coverage of eight indicators, the temporal window, and the compensatory nature of the aggregation.
4.2. Dimensional Composition and Performance Profiles
Once the eight indicators had been normalized according to Equations (1) and (2), aggregation was performed in two stages. First, the People, Planet, and Peace subindices were calculated as simple averages of their two constituent indicators, whereas Prosperity and Partnerships retained the value of the single indicator available in each dimension. Second, the 5P Composite Index was obtained through uniform weighting of the five subindices. Table 7 presents the result of this aggregation and relates each country’s dimensional profile to its global score, ordinal position, and classification by performance blocks.
Table 7 shows that favorable overall concordance of the index can coexist with clearly differentiated dimensional profiles. Colombia is located in the top block because of the combination of favorable results in Planet and Partnerships, without depending exclusively on a single dimension. Israel maintains high aggregate performance because of its strengths in People and Planet, although Peace introduces a relevant compensation effect. Mexico benefits mainly from the environmental component, while Kuwait offsets its relatively lower performance in Planet through stronger results in Prosperity and Peace. Among countries in intermediate and lower positions, shortfalls are concentrated to varying degrees in Peace, Prosperity, or Partnerships. For this reason, classification by blocks provides a more consistent interpretation than an isolated reading of adjacent ordinal positions.
Methodologically, Table 7 and Table 8 make it possible to reconstruct the complete sequence leading from indicator normalization to the calculation of subindices and the global score. This traceability is particularly relevant because the use of composite indices as inputs may generate conceptual overlap and compensation effects. Consequently, both tables should be interpreted as support for the construction and comparative evaluation of the 5P Index, and not as evidence of causal relationships between the indicators and the final position of the countries.
On this basis, interpretation of the results is developed along two complementary dimensions: aggregate performance, which summarizes each country’s relative position, and dimensional performance, which makes it possible to identify the strengths, shortfalls, and compensations underlying the global score.
Interpretation of the ranking is enriched by reviewing the relative contribution of each dimension (People, Planet, Prosperity, Peace, and Partnerships). In Colombia, the aggregate score is supported mainly by high values in Planet and Partnerships, accompanied by a Prosperity component that also contributes significantly. Overall, the result reflects favorable performance in more than one dimension rather than dependence on a single pillar.
In Israel, the high position is explained by strong performance in People and Partnerships, together with a high level in Planet. However, the Peace subindex is visibly lower, producing a high global result with an important internal contrast: strengths in well-being/institutionality and sustainability, but a relative shortfall in stability or security.
In Mexico, the component that most strongly drives the aggregate score is Planet. Even so, the final result is moderated by relatively lower values in Prosperity and Peace, suggesting robust environmental performance that is not reflected with the same intensity in structural prosperity or stability.
Kuwait illustrates the compensatory nature of the index: it stands out in Peace and Prosperity, while its performance in Planet is low. This shows that similar aggregate scores may arise from different internal combinations across dimensions.
In the lower aggregate-performance group, the most frequent pattern is the presence of shortfalls in Peace and/or Prosperity, with additional weaknesses in Partnerships in some cases. These results describe profiles with relative limitations in stability, cooperation/partnerships, or the economic base, which are ultimately reflected in the global index.
4.3. Sensitivity and Ordinal Robustness Assessment
The evaluation begins by examining whether the ordering obtained during construction remains similar when reasonable design decisions are modified. To this end, the baseline ranking is compared with alternative specifications using the Spearman and Kendall coefficients and is complemented by the maximum rank change and leave-one-out tests. Overall concordance and the sensitivity of individual countries are interpreted jointly, because a high correlation may coexist with relevant shifts in specific cases.
Because the ranking may vary according to weighting, normalization, and treatment of extreme values, sensitivity and ordering-stability tests were applied. In line with the literature, the following are reported: comparison under alternative specifications and (ii) stability through Spearman and Kendall across rankings [3,7,8].
The stability of positions under methodological changes is summarized in Table 8. The table compares the baseline ranking with the main alternative scenarios using the Spearman and Kendall coefficients, together with the maximum absolute shift observed for a country.
Table 8 shows high overall concordance across the scenarios examined; however, the maximum shifts indicate that this stability is not uniform for all countries. Therefore, the association coefficients should be interpreted together with individual rank changes and the leave-one-out results, avoiding the assumption that a high overall correlation implies complete ranking invariance.
Taken together, the tests show high overall concordance across specifications, but not complete invariance of positions. Some countries in the middle segment experience substantial shifts, particularly in leave-one-out exercises. Consequently, the result should be interpreted by performance blocks and dimensional profiles, avoiding claims that small ordinal differences represent substantive superiority.
4.4. Uncertainty Assessment Through Monte Carlo Simulation
In accordance with the protocol developed in Section 3.4.3, ranking uncertainty was evaluated using 1,000 iterations per scenario and weights generated from a symmetric Dirichlet distribution. Equations (12) and (13) were applied in each iteration: first, a vector of eight non-negative weights summing to one was obtained; the scores and positions of the 16 countries were then recalculated. The α = 50 scenario represents moderate perturbations around uniform weighting, whereas α = 1 functions as a stress test by allowing more unequal combinations. For each country, the median, interquartile range, probability of belonging to the Top-3 and Top-5, and best and worst positions are reported.
Before examining widely dispersed weights, ranking uncertainty was estimated under a scenario of nearly equal weights generated from a Dirichlet distribution with α = 50. Table 9 presents, for each country, the median position, interquartile range, and probabilities of being in the Top-3 and Top-5, with the purpose of assessing ordering stability under moderate fluctuations around uniform weighting.
The results in Table 9 indicate that, when weights fluctuate moderately around equality, the top positions exhibit high stability and the interquartile ranges tend to be small. This behavior supports the baseline specification, although it does not eliminate uncertainty for countries located near the boundaries between performance blocks.
Subsequently, a more demanding scenario was evaluated, in which the weights may vary considerably across iterations through a Dirichlet distribution with . Table 10 presents the same statistics as Table 9 and makes it possible to identify which countries retain relatively robust positions and which show greater sensitivity when the relative contribution of the indicators changes substantially.
Table 10 shows that ranking variability increases when extreme weights are allowed. Colombia and Israel frequently remain in the top positions, whereas several countries in the middle segment display a wider range of positions. This result confirms that uncertainty is concentrated mainly in cases whose dimensional profiles depend more strongly on compensations between strengths and shortfalls.
Taken together, the tests show high overall concordance across specifications, but not complete invariance of positions. Some countries in the middle segment experience substantial shifts, particularly in leave-one-out exercises. Consequently, the result should be interpreted by performance blocks and dimensional profiles, avoiding claims that small ordinal differences represent substantive superiority.
4.5. Integrated Synthesis of Construction and Evaluation
A joint reading of the results makes it possible to separate two types of evidence. Construction evidence identifies each country’s score, position, and dimensional profile under the baseline specification. Evaluation evidence determines which components of the result are relatively robust and which depend more strongly on weighting, normalization, or the inclusion of specific indicators. This distinction prevents the observed ranking from being equated with a definitive sustainability hierarchy.
In the aggregate 5P Index score, Colombia, Israel, Mexico, and Kuwait are located in the upper block (≥60). However, the dimensional decomposition shows that this position does not arise from homogeneous performance but from different internal combinations of People, Planet, Prosperity, Peace, and Partnerships. In Colombia, the global result is explained mainly by high levels in Planet and Partnerships, accompanied by a Prosperity component that also contributes significantly. In Israel, the high position is sustained by strengths in People and Partnerships, although a notable shortfall in Peace creates an internally contrasting profile that must be considered when interpreting the ranking. Kuwait, in turn, stands out in Peace and Prosperity, while its performance in Planet is comparatively low; this pattern illustrates the compensatory nature of the index and shows why the aggregate score alone may conceal specific weaknesses.
The sensitivity tests show that the ordering maintains high overall concordance under reasonable methodological specifications, although not all positions are invariant. In the main deterministic scenarios, maximum shifts range between four and five positions; however, the more demanding weighting, winsorization, and leave-one-out contrasts reported in other tests reach larger variations. Therefore, interpretation of the 5P Index is more robust when focused on performance blocks and dimensional profiles rather than on small differences between adjacent positions, as recommended by methodological studies on the robustness of composite indices [2,3,4,5,6,9].
4.6. External Evaluation Through Comparison with the SDG Index
As a check of convergent validity, the aggregate score of the proposed index (equal weights across the eight indicators) was compared with the SDG Index reported by the Sustainable Development Report (SDR). Because the SDR publishes an annual global score for 193 countries, the reported value from the latest edition available in the rankings panel was used. This comparison does not seek perfect temporal equivalence, but rather to assess whether the relative ordering of the proposed index is consistent with a widely used external metric.
For the sample with comparable information (n = 16), the association between the two instruments is moderate: Spearman ρ = 0.507, Kendall τ = 0.371, and Pearson r = 0.550. Table 11 presents the country-by-country comparison and makes it possible to examine convergences and divergences between the 5P Composite Index and the SDG Index. These differences are expected because of differences in indicator coverage, normalization and weighting rules, and the sensitivity of some countries to conflicts or recent disturbances.
The moderate association observed in Table 11 supports partial convergence with the SDG Index, but also confirms that the two instruments are not equivalent. The divergences reflect differences in coverage, temporality, normalization, and aggregation; therefore, this comparison functions as complementary external evidence and not as the sole criterion of validity for the 5P Composite Index.
5. Discussion
The contribution of this study is supported by two differentiated analytical lines of work. First, a synthetic metric aligned with the 5P approach is developed, providing traceability of performance. The second line evaluates the magnitude of the effect on the ranking generated by decisions concerning indicator selection, normalization, weighting, aggregation, and the treatment of atypical values. Thus, the contribution of the research exercise should not be understood as merely providing a ranking; rather, the tool incorporates empirical evidence on its own stability, sensitivity, and interpretive limits, in line with the methodological standards established for constructing composite indices [2,3,4,5,6,9].
Regarding the results, integrated sustainability does not follow a homogeneous pattern across countries. One piece of evidence is that Colombia leads the baseline scenario because of the aggregation of outstanding results in the Planet and Partnerships dimensions; this result should not be interpreted as proof of superiority, nor does it imply the absence of relevant shortcomings.
Israel is located in the upper block because of its performance in the People, Planet, and Partnerships dimensions, although the Peace dimension introduces an internal tension. Mexico receives an important boost from People and Planet, but the Prosperity and Peace components moderate its score. Kuwait, for its part, clearly illustrates the compensatory bias of the index, since its results in Prosperity and Peace coexist with weak environmental performance. These patterns confirm that the aggregate score should be examined jointly with the dimensional decomposition rather than as a unidimensional attribute of countries [3,9,11,12].
The comparative results for Latin American countries and Middle Eastern countries do not provide evidence of a uniform hierarchy. The observed gaps respond to country-specific configurations of human well-being, environmental pressure, economic dynamism, institutional stability, and cooperation capacity. For Colombia and Mexico, public-policy implications are oriented toward consolidating social and environmental achievements while simultaneously strengthening peace, institutional quality, and partnerships. For Israel, Kuwait, the United Arab Emirates, and Oman, the index shows that high aggregate averages may coexist with environmental, institutional, or peace-related imbalances.
For countries affected by conflicts and cooperation constraints, shortfalls in Peace and Partnerships become particularly relevant. These implications must be understood as strictly descriptive and comparative; therefore, they do not demonstrate causal relationships between specific policies and the position attained [1,18,22,23,33,34,35,36].
Indicator choice also affects the indicator-selection criteria. Incorporating composite indices as inputs increases thematic coverage but intrinsically entails a risk of overlap, because the HDI, HPI, Green Growth Index, WEF Nexus, GPI, Democracy Matrix, and Concordia indices contain partially related dimensions.
On the other hand, the GDP growth rate provides a measure of short-term dynamism rather than structural prosperity, while the Partnerships dimension is reduced to a single indicator. These limitations do not diminish the value of the exercise, but they do constrain its scope, because the 5P Index should be understood as a formative measure for cross-country comparison and not as a reflective instrument or an exhaustive characterization of each pillar. Correct interpretation should therefore consider the results of the leave-one-out tests, alternative weights, and dimensional profiles [2,3,8,11,13].
The robustness diagnostic was articulated through Spearman and Kendall correlations, which made it possible to assess the consistency of the overall ordering. Both coefficients confirm ranking stability under methodological variations; however, the maximum changes and weight simulations indicate that certain positions are sensitive to methodological decisions. Under weighting schemes close to equality, both the extremes and the blocks maintain acceptable stability; when more variable weights are allowed, the range of fluctuation increases, particularly in the middle segment. Therefore, the evidence is more robust for delimiting groups and distances than for assigning exact positions among countries with similar scores, thereby avoiding the false premise that high overall concordance should be interpreted as absolute ranking invariance [4,5,6].
Given this context, review through external benchmarks is necessary as an additional assessment. In general, the evidence of moderate association with the SDG Index (which has broader coverage) indicates that the 5P Index maintains consistency with international references, but the magnitude of the association does not allow the two sets of results to be treated as equivalent. Ultimately, the difference is consistent with their respective architectures, because the 5P Index is structured around eight indicators, uses a defined temporal window, and follows a formative design focused on profile analysis. Therefore, the empirical-comparison results confirm partial convergence rather than demonstrating functional equivalence [5,15,16].
Finally, at the operational level, the instrument facilitates the identification of gaps; for this purpose, the index should be analyzed jointly with the dimensional subindices and the uncertainty margin of the ordering. In the field of public management, the index’s main contribution lies in its ability to explain the dimensions in which shortfalls are evident, identify how the aggregation components interact, and determine which conclusions maintain robust levels under reasonable methodological changes.
6. Conclusions
In response to the general objective, the research constructed a comparable 5P Composite Index for Colombia, Mexico, and 14 countries and territories in the Middle East and its regional environment, and evaluated its stability through conceptual, statistical, ordinal, sensitivity, uncertainty, and external-convergence contrasts. This approach explicitly distinguishes instrument construction from the assessment of its robustness and demonstrates that evaluation is not limited to reporting an aggregate score.
The contribution unfolds across three levels. The first is the conceptual level, oriented toward jointly operationalizing the People, Planet, Prosperity, Peace, and Partnerships dimensions under a formative logic consistent with the 2030 Agenda [1]. The second is the methodological level, supported by the distinction between the main sample of 16 cases and the expanded database used exclusively for exploratory diagnostics and alternative weighting, incorporating explicit normalization, ordinal concordance, leave-one-out analysis, and Monte Carlo simulation with 1,000 iterations per scenario under Dirichlet weights [2,3,4,5,6,9]. At the applied level, the contribution materializes in the generation of national profiles that make it possible to visualize strengths, structural imbalances, and compensation mechanisms that cannot be identified through an isolated measure.
Regarding the limitations, the external validity of the study is constrained by the lack of exact temporal synchronization among the indicators, the temporal structure of the 2020–2023 window, the conceptual redundancy of some indicators, the representation of Prosperity and Partnerships by a single indicator, and the sample restrictions for PCA arising from selection bias due to missing data. Likewise, the internal-consistency metrics confirm that the index rejects a reflective interpretation and support the formative nature of the model, indicating redundancy in Planet (high alpha) and structural heterogeneity in Peace (negative alpha).
These conditions do not invalidate the formative approach, but they require that the analysis not stop at the aggregate score; it must therefore be complemented by examination of dimensional profiles and sensitivity tests. Linear aggregation allows compensation across dimensions, so a high score may coexist with specific shortfalls [9,12].
Future research should extend temporal and geographic coverage, include direct measures of prosperity and cooperation, review the structure of Peace and Planet, explore non-compensatory forms of aggregation, and test the stability of the results in independent samples. Within its current scope, the index is more appropriate for comparative diagnosis and gap detection than for assigning positions of a definitive nature.
Author Contributions
Conceptualization, A.A.A. and J.G.D.l.V.M.; methodology, A.A.A., J.G.D.l.V.M. and H.F.P.; formal analysis, A.A.A. and H.F.P.; investigation, A.A.A., J.G.D.l.V.M., H.F.P., J.D.F.R., J.J.R.A. and Z.R.P.; data curation, A.A.A., J.D.F.R., J.J.R.A. and Z.R.P.; writing—original draft preparation, A.A.A.; writing—review and editing, A.A.A., J.G.D.l.V.M., H.F.P., J.D.F.R., J.J.R.A. and Z.R.P.; visualization, A.A.A. and J.D.F.R.; supervision, A.A.A.; project administration, A.A.A. All authors have read and agreed to the published version of the manuscript.
Funding
This research received no external funding.
Institutional Review Board Statement
Not applicable. The study is based exclusively on aggregated, publicly available country-level data and did not involve human participants or animals.
Informed Consent Statement
Not applicable. The study did not involve individual participants or personally identifiable information.
Data Availability Statement
The study uses publicly available country-level indicators obtained from the international sources identified in the methodology and references. The processed analytical matrix, data dictionary, transformation rules and calculation files supporting the reported results are available from the corresponding author upon reasonable request, subject to the terms of use of the original data providers.
Acknowledgments
The authors acknowledge the institutional support of their respective universities and research groups during the development of this study.
Conflicts of Interest
The authors declare no conflicts of interest.
References
- United Nations. Transforming our world: The 2030 Agenda for Sustainable Development. United Nations, 2015. Available online: https://sdgs.un.org/2030agenda.
- Saisana, M.; Saltelli, A.; Tarantola, S. Uncertainty and sensitivity analysis techniques as tools for the quality assessment of composite indicators. J. R. Stat. Soc. Ser. A (Statistics in Society) 2005, 168(2), 307–323. [Google Scholar] [CrossRef]
- Becker, W.; Saisana, M.; Paruolo, P.; Vandecasteele, I. Weights and importance in composite indicators: Closing the gap. Ecol. Indic. 2017, 80, 12–22. [Google Scholar] [CrossRef]
- Permanyer, I. Assessing the robustness of composite indices rankings. Rev. Income Wealth 2011, 57(2), 306–326. [Google Scholar] [CrossRef]
- Seth, S.; McGillivray, M. Composite indices, alternative weights, and comparison robustness. Soc. Choice Welf. 2018, 51(4), 657–679. [Google Scholar] [CrossRef]
- Foster, J. E.; McGillivray, M.; Seth, S. Composite indices: Rank robustness, statistical association, and redundancy. Econom. Rev. 2013, 32(1), 35–56. [Google Scholar] [CrossRef]
- Cherchye, L.; Moesen, W.; Rogge, N.; Van Puyenbroeck, T.; Saisana, M.; Saltelli, A.; Liska, R.; Tarantola, S. Creating composite indicators with DEA and robustness analysis: The case of the Technology Achievement Index. J. Oper. Res. Soc. 2008, 59(2), 239–251. [Google Scholar] [CrossRef]
- Kelemen, A.; Szabó, Z. K.; Bozóki, S.; Szádoczki, Z.; Hartvig, Á. D. A sensitivity analysis of composite indicators: Min/max thresholds. Environ. Sustain. Indic. 2024, 23, 100453. [Google Scholar] [CrossRef]
- Greco, S.; Ishizaka, A.; Tasiou, M.; Torrisi, G. On the methodological framework of composite indices: A review of the issues of weighting, aggregation, and robustness. Soc. Indic. Res. 2019, 141(1), 61–94. [Google Scholar] [CrossRef]
- Dobbie, M. J.; Dail, D. Robustness and sensitivity of weighting and aggregation in constructing composite indices. Ecol. Indic. 2013, 29, 270–277. [Google Scholar] [CrossRef]
- Schlossárek, M.; Syrovátka, M.; Vencálek, O. The importance of variables in composite indices: A contribution to the methodology and application to development indices. Soc. Indic. Res. 2019, 145(3), 987–1006. [Google Scholar] [CrossRef]
- Mazziotta, M.; Pareto, A. Methods for constructing composite indices: One for all or all for one? Riv. Ital. Di Econ. Demogr. E Stat. 2013, 67(2), 67–80. [Google Scholar]
- Stevens, S. M. Composite environmental indices—A case of rickety rankings. PeerJ 2023, 11, e16325. [Google Scholar] [CrossRef]
- Sachs, J.; Schmidt-Traub, G.; Kroll, C.; Lafortune, G.; Fuller, G. SDG Index and Dashboards Report 2018; Bertelsmann Stiftung and Sustainable Development Solutions Network, 2018. [Google Scholar]
- Strezov, V.; Evans, A.; Evans, T. J. Assessment of the economic, social and environmental dimensions of the indicators for sustainable development. Sustain. Dev. 2017, 25(3), 242–253. [Google Scholar] [CrossRef]
- Patrick, R.; Henderson-Wilson, C.; Lawson, J.; Capetola, T.; Shaw, A.; Davison, M.; Freeman, A. Planetary health indicators for the local level: opportunities and challenges in applying the happy planet index in Victoria, Australia. Glob. Health Promot. 2022, 29(3), 14–23. [Google Scholar] [CrossRef]
- Wilson, J.; Tyedmers, P.; Pelot, R. Contrasting and comparing sustainable development indicator metrics. Ecol. Indic. 2007, 7(2), 299–314. [Google Scholar] [CrossRef]
- WEF Nexus Index WEF Nexus Index Website. 2023. Available online: https://wefnexusindex.org/.
- World Bank. World Bank Open Data: GDP growth (annual %). 2022. Available online: https://data.worldbank.org/indicator/NY.GDP.MKTP.KD.ZG.
- Yoon, J. Forecasting of real GDP growth using machine learning models: Gradient boosting and random forest approach. Comput. Econ. 2021, 57(1), 247–265. [Google Scholar] [CrossRef]
- Bakker, V.; Verburg, P. H.; Van Vliet, J. Trade-offs between prosperity and urban land per capita in major world cities. Geogr. Sustain. 2021, 2(2), 134–138. [Google Scholar] [CrossRef]
- Ahmad, M.; Ahmed, N.; Jabeen, M.; Jabeen, G.; Qamar, S.; Chandio, A. A.; Rauf, A. Empirics on heterogeneous links among urbanization, the intensity of electric power consumption, water-based emissions, and economic progress in regional China. Environ. Sci. Pollut. Res. 2020, 27, 38937–38950. [Google Scholar] [CrossRef]
- Ming, J.; Liao, X.; Zhao, X. Grey water footprint for global energy demands. Front. Earth Sci. 2020, 14, 201–208. [Google Scholar] [CrossRef]
- Lestari, E. P.; Rahayu, H. C.; Retnaningsih, T. K.; Suhartono, S. Significant role of the human development index in alleviating poverty. J. Soc. Econ. Res. 2022, 9(3), 147–160. Available online: https://ideas.repec.org/a/pkp/josere/v9y2022i3p147-160id3170.html. [CrossRef]
- United Nations Development Programme. Human Development Insights. 2021. Available online: https://hdr.undp.org/data-center/country-insights#/ranks.
- Hot or Cool Institute. Happy Planet Index. 2020. Available online: https://happyplanetindex.org/countries/.
- Global Green Growth Institute. Green Growth Index. 2022. Available online: https://ggindex-simtool.gggi.org/SimulationDashBoard/global_overview.
- Jadoon, I. A.; Mumtaz, R.; Sheikh, J.; Ayub, U.; Tahir, M. The impact of green growth on financial stability. J. Financ. Regul. Compliance 2021, 29(5), 533–560. [Google Scholar] [CrossRef]
- Kararach, G.; Nhamo, G.; Mubila, M.; Nhamo, S.; Nhemachena, C.; Babu, S. Reflections on the Green Growth Index for developing countries: A focus of selected African countries. Dev. Policy Rev. 2018, 36, 432–454. [Google Scholar] [CrossRef]
- Matrix, Democracy. Ranking of Countries by Quality of Democracy. 2020. Available online: https://www.democracymatrix.com/ranking.
- Lauth, H. J.; Schlenkrich, O. Making trade-offs visible: theoretical and methodological considerations about the relationship between dimensions and institutions of democracy and empirical findings. Politics Gov. 2018, 6(1), 78–91. [Google Scholar] [CrossRef]
- Schlenkrich, O. Identifying Profiles of Democracy. In Origin and Performance of Democracy Profiles;Vergleichende Politikwissenschaft; Springer VS: Wiesbaden, 2021; pp. 17–41. [Google Scholar] [CrossRef]
- Concordia. Concordia Partnership Index. 2022. Available online: https://concordia.net/annualsummit/2022annualsummit/2022-annual-summit-report/.
- Faling, M.; Garard, J.; Schouten, G.; Schulz, K.; Veeger, M.; Vervoort, J.; Rutting, L. Innovative participatory research methods in earth system governance. Annu. Rev. Soc. Partnersh. 2017, (12), 76–80. Available online: https://research.rug.nl/en/publications/innovative-participatory-research-methods-in-earth-system-governa.
- Filatova, I.; Nikolaichuk, L.; Zakaev, D.; Ilin, I. Public-private partnership as a tool of sustainable development in the oil-refining sector: Russian case. Sustainability 2021, 13(9)(5153), 1–23. [Google Scholar] [CrossRef]
- Vision of Humanity. Global Peace Index 2023. 2023. Available online: https://www.visionofhumanity.org/wp-content/uploads/2023/06/GPI-2023-Web.pdf.
- Hajkowicz, S. Multi-attributed environmental index construction. Ecol. Econ. 2006, 57(1), 122–139. [Google Scholar] [CrossRef]
- Singh, R. K.; Murty, H. R.; Gupta, S. K.; Dikshit, A. K. An overview of sustainability assessment methodologies. Ecol. Indic. 2009, 9(2), 189–212. [Google Scholar] [CrossRef]
Figure 1.
Scree Plot (PCA). Note. Eigenvalues associated with the principal components estimated from directionally aligned and standardized variables.
Figure 1.
Scree Plot (PCA). Note. Eigenvalues associated with the principal components estimated from directionally aligned and standardized variables.
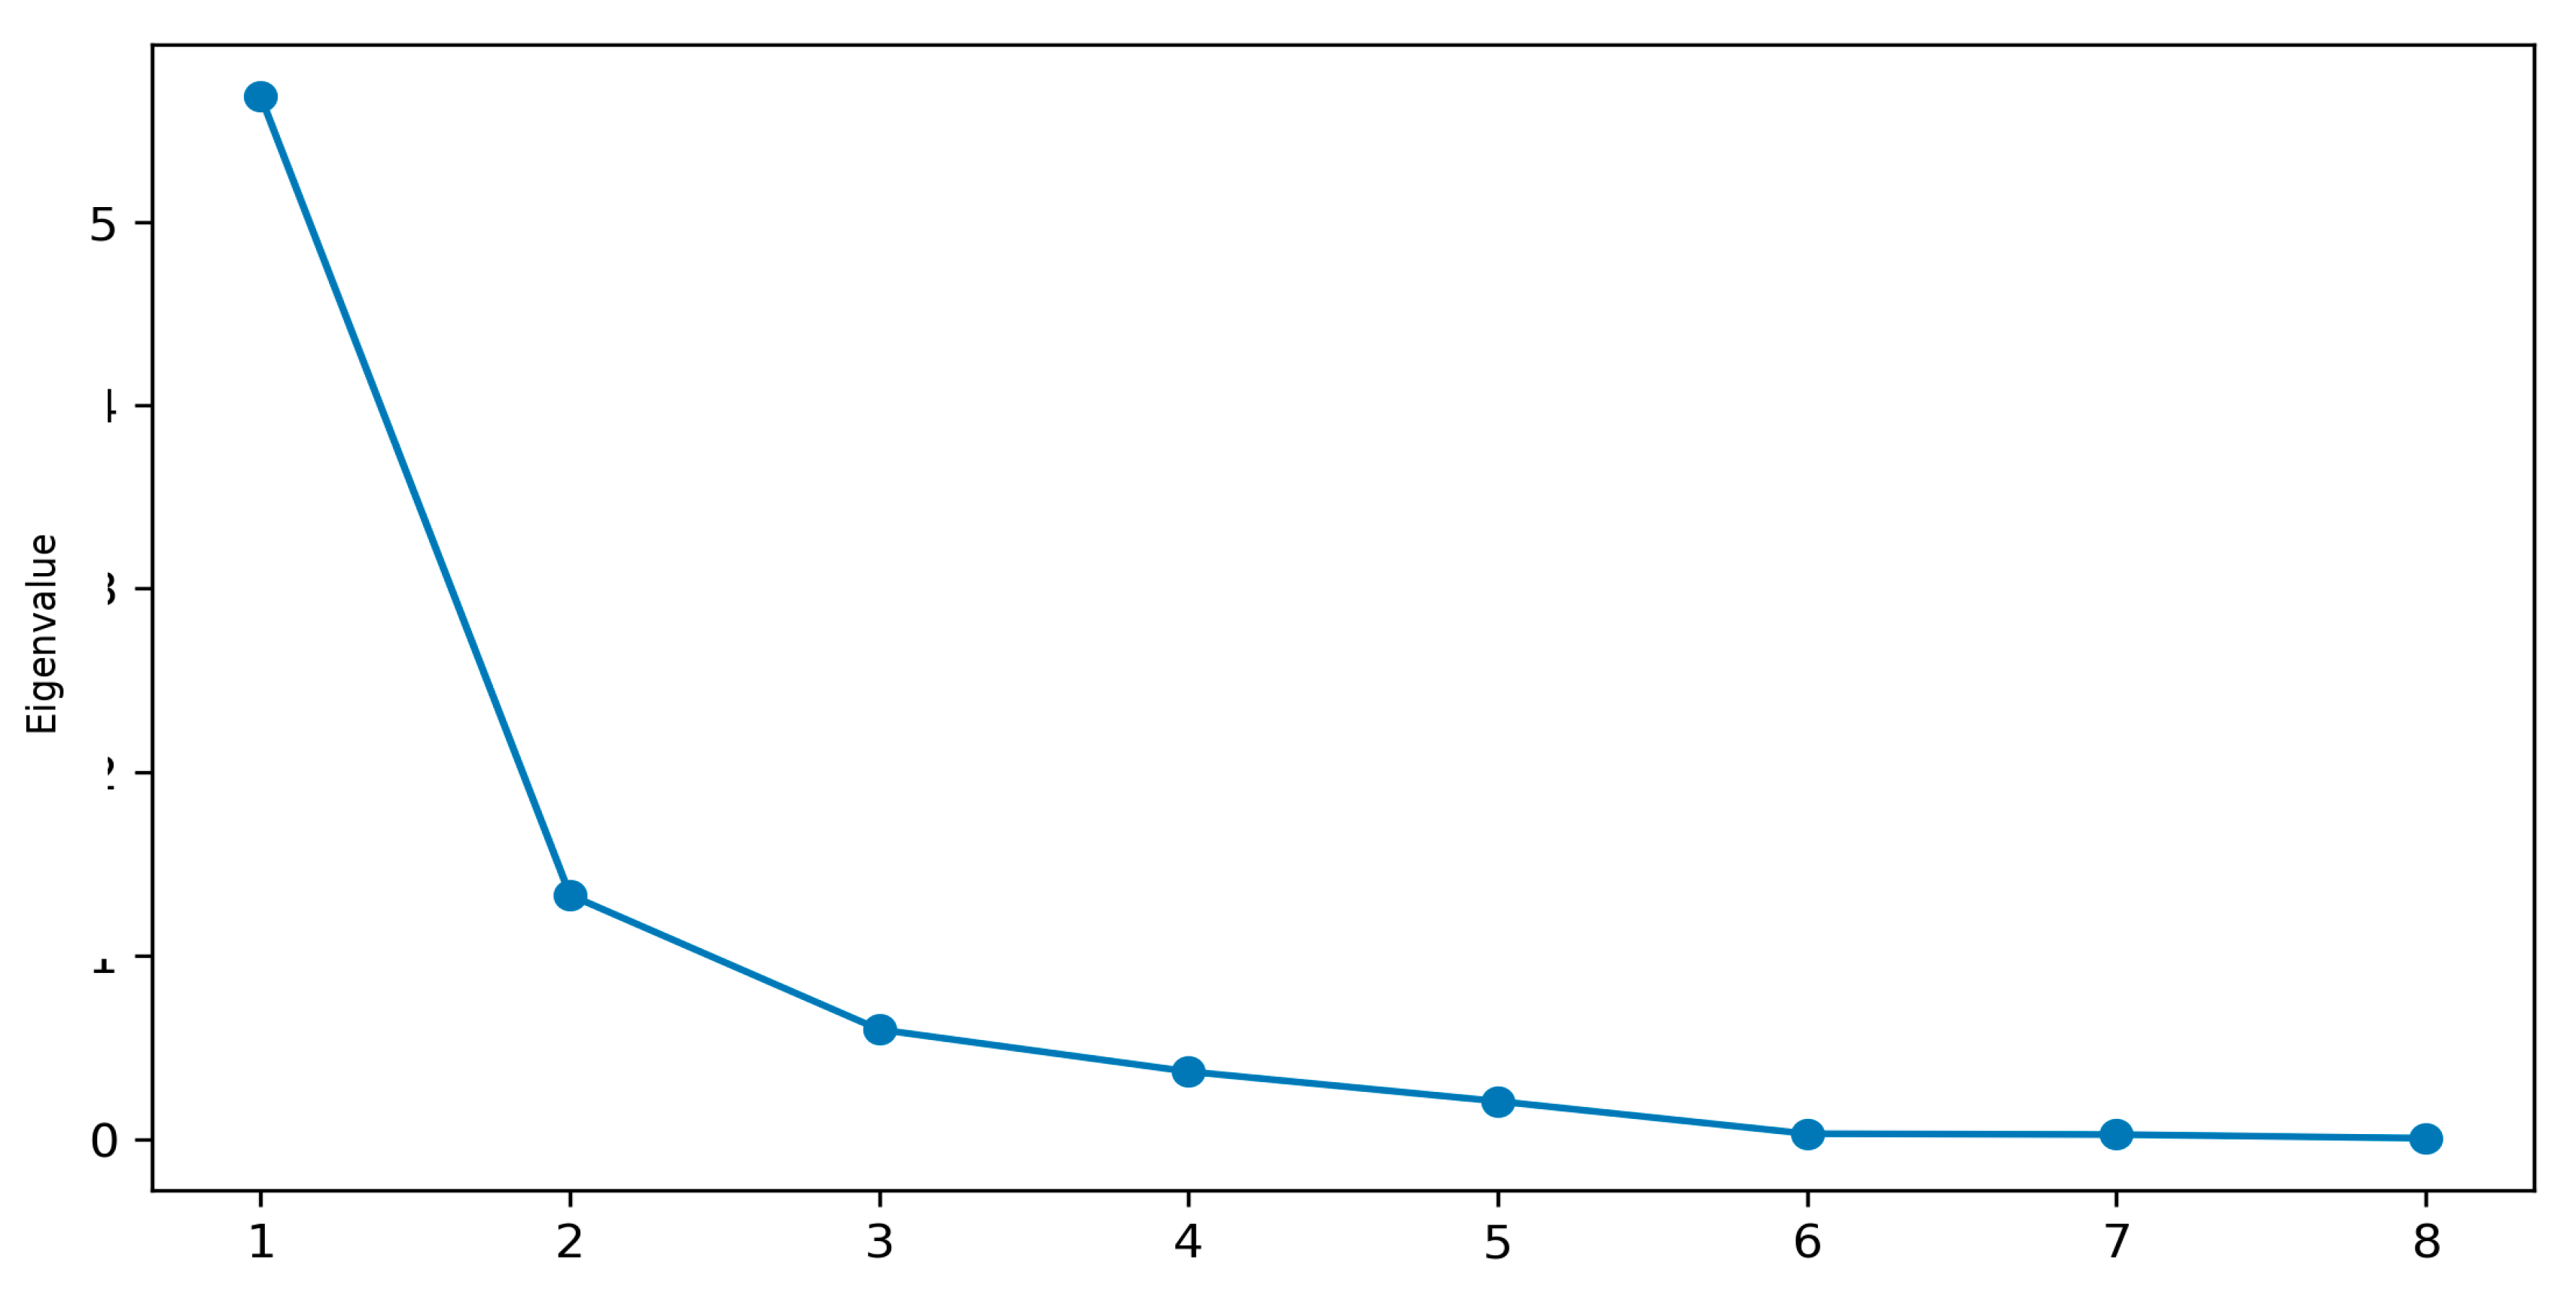
Figure 2.
Heat Map of Rotated Factor Loadings (Varimax) Note. Heat map of rotated factor loadings (Varimax) for k = 3. Larger absolute values indicate a stronger association between the indicator and the corresponding factor.
Figure 2.
Heat Map of Rotated Factor Loadings (Varimax) Note. Heat map of rotated factor loadings (Varimax) for k = 3. Larger absolute values indicate a stronger association between the indicator and the corresponding factor.
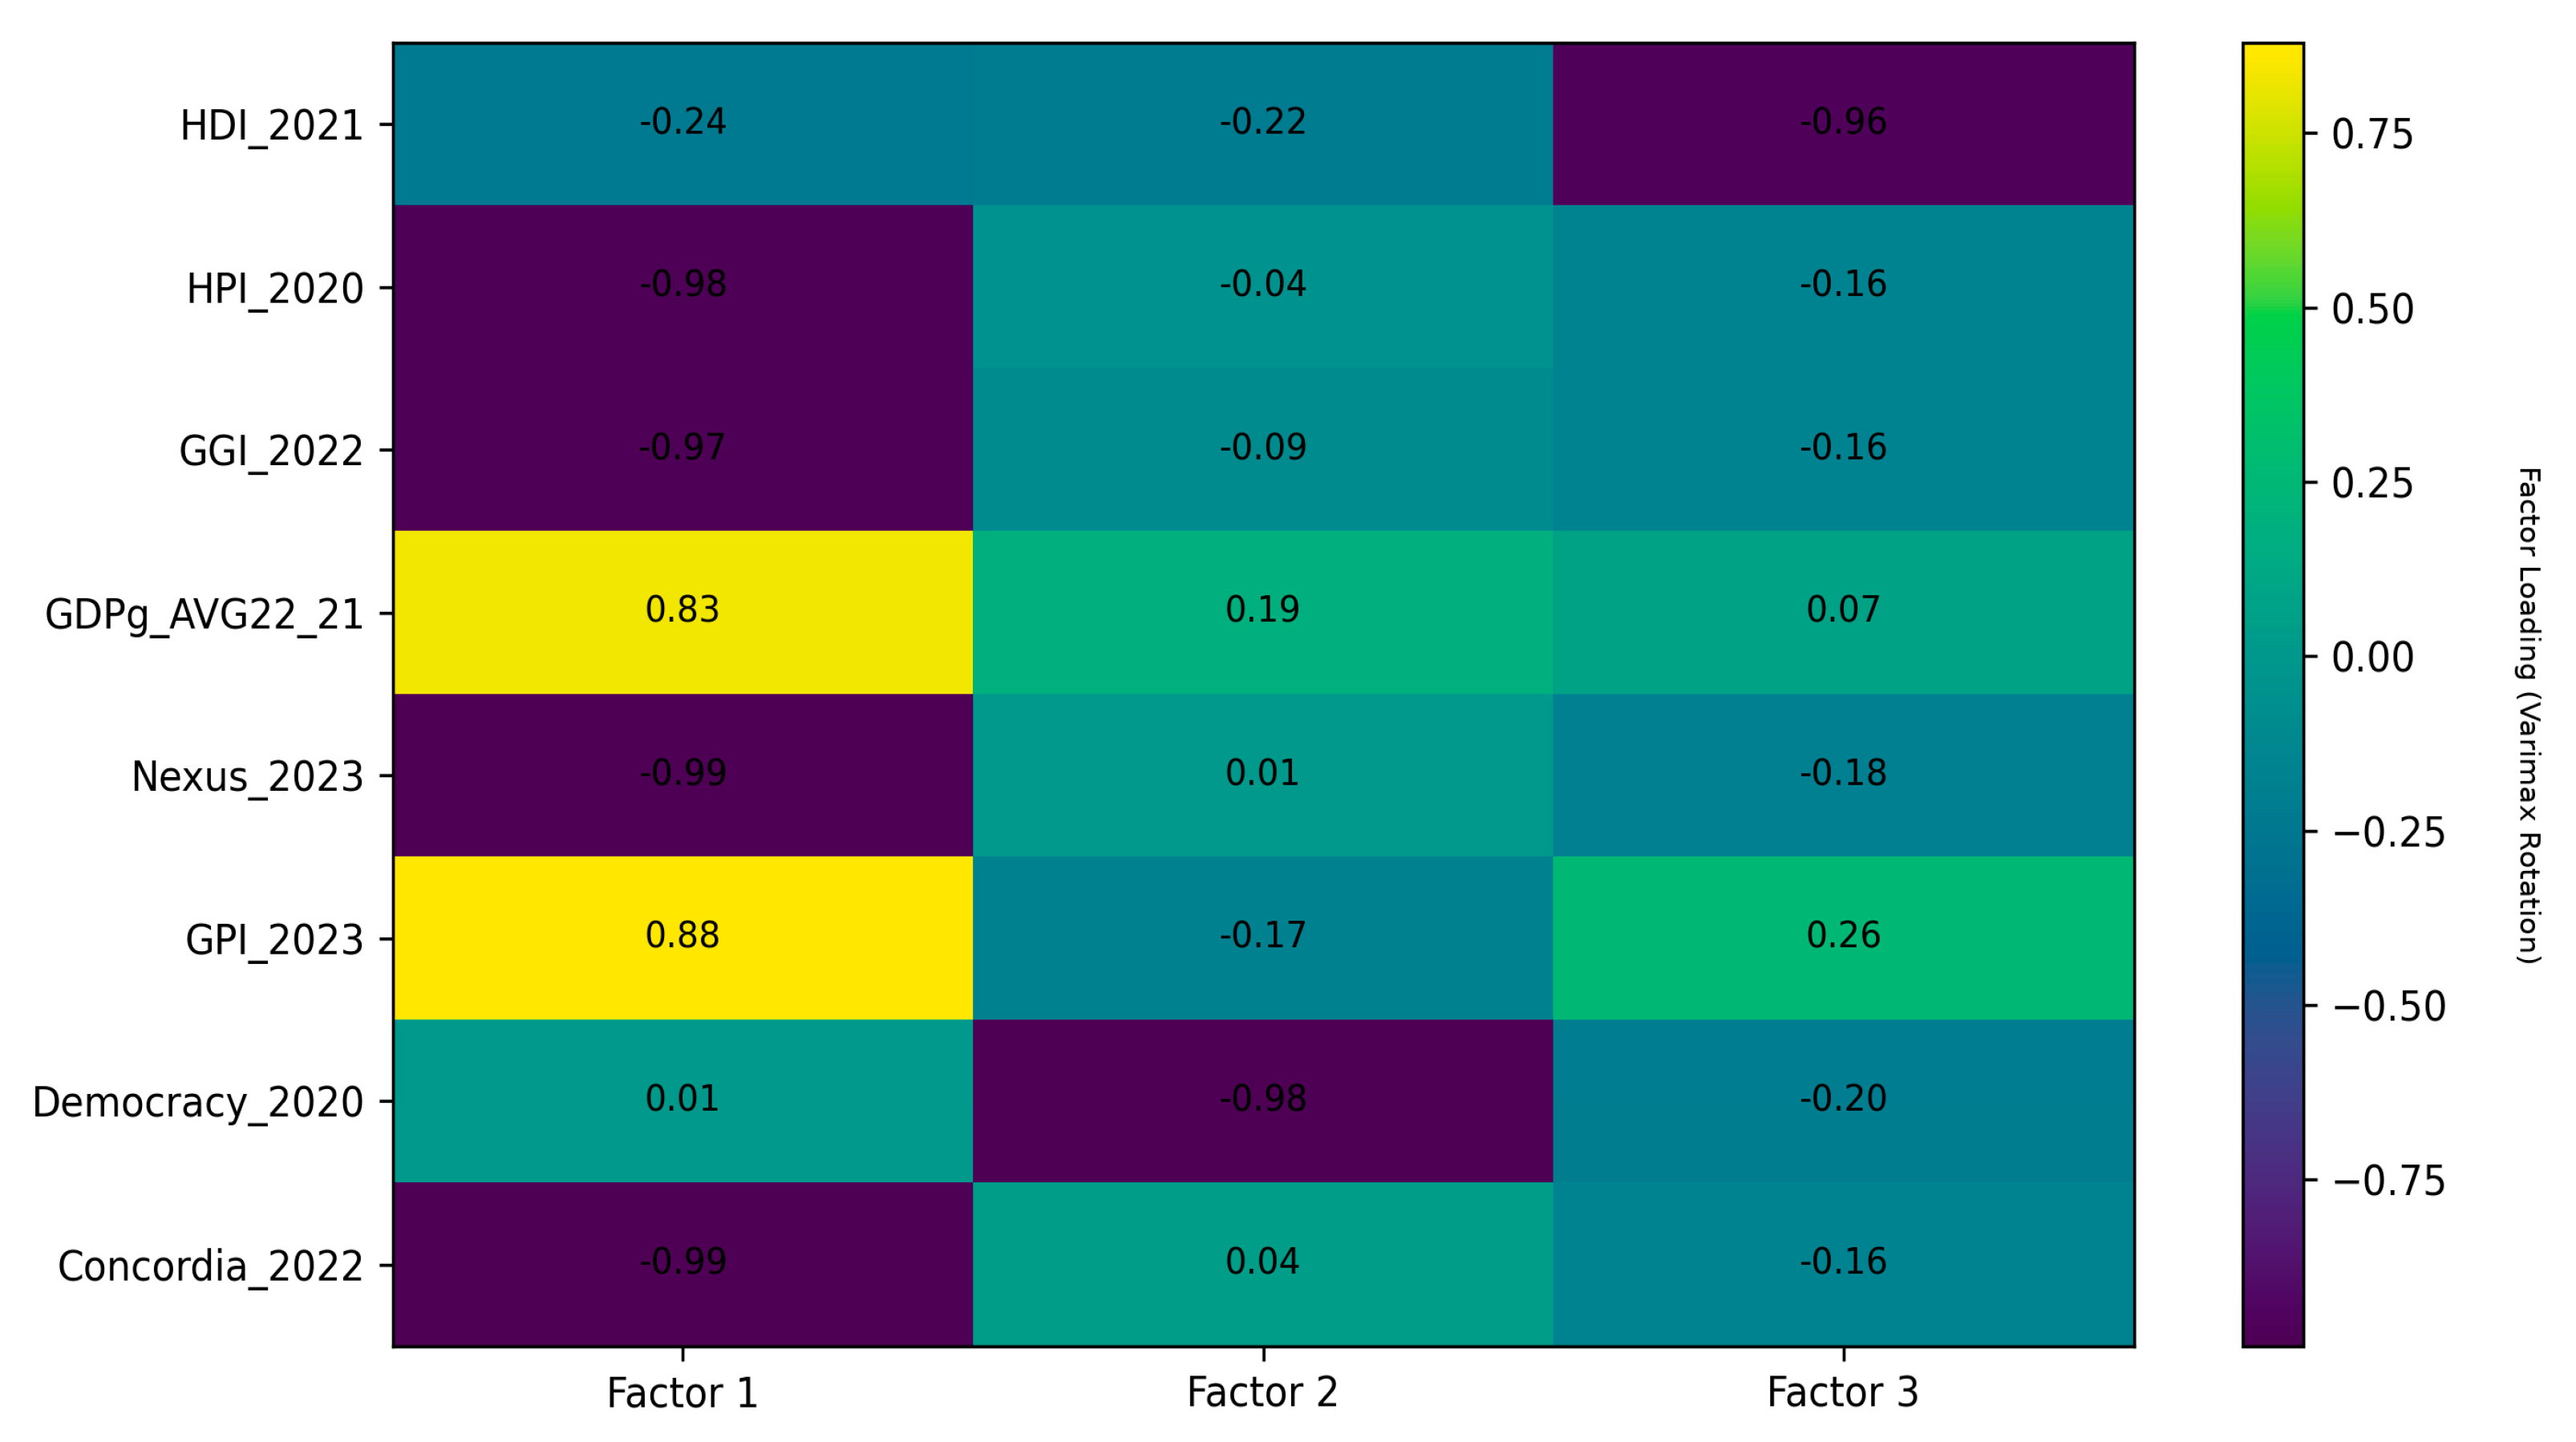
Figure 3.
Correlation Circle (PCA) Note. Correlation circle in the PC1–PC2 plane. Vector length approximates the quality of representation of each indicator; direction reflects its association with the components.
Figure 3.
Correlation Circle (PCA) Note. Correlation circle in the PC1–PC2 plane. Vector length approximates the quality of representation of each indicator; direction reflects its association with the components.
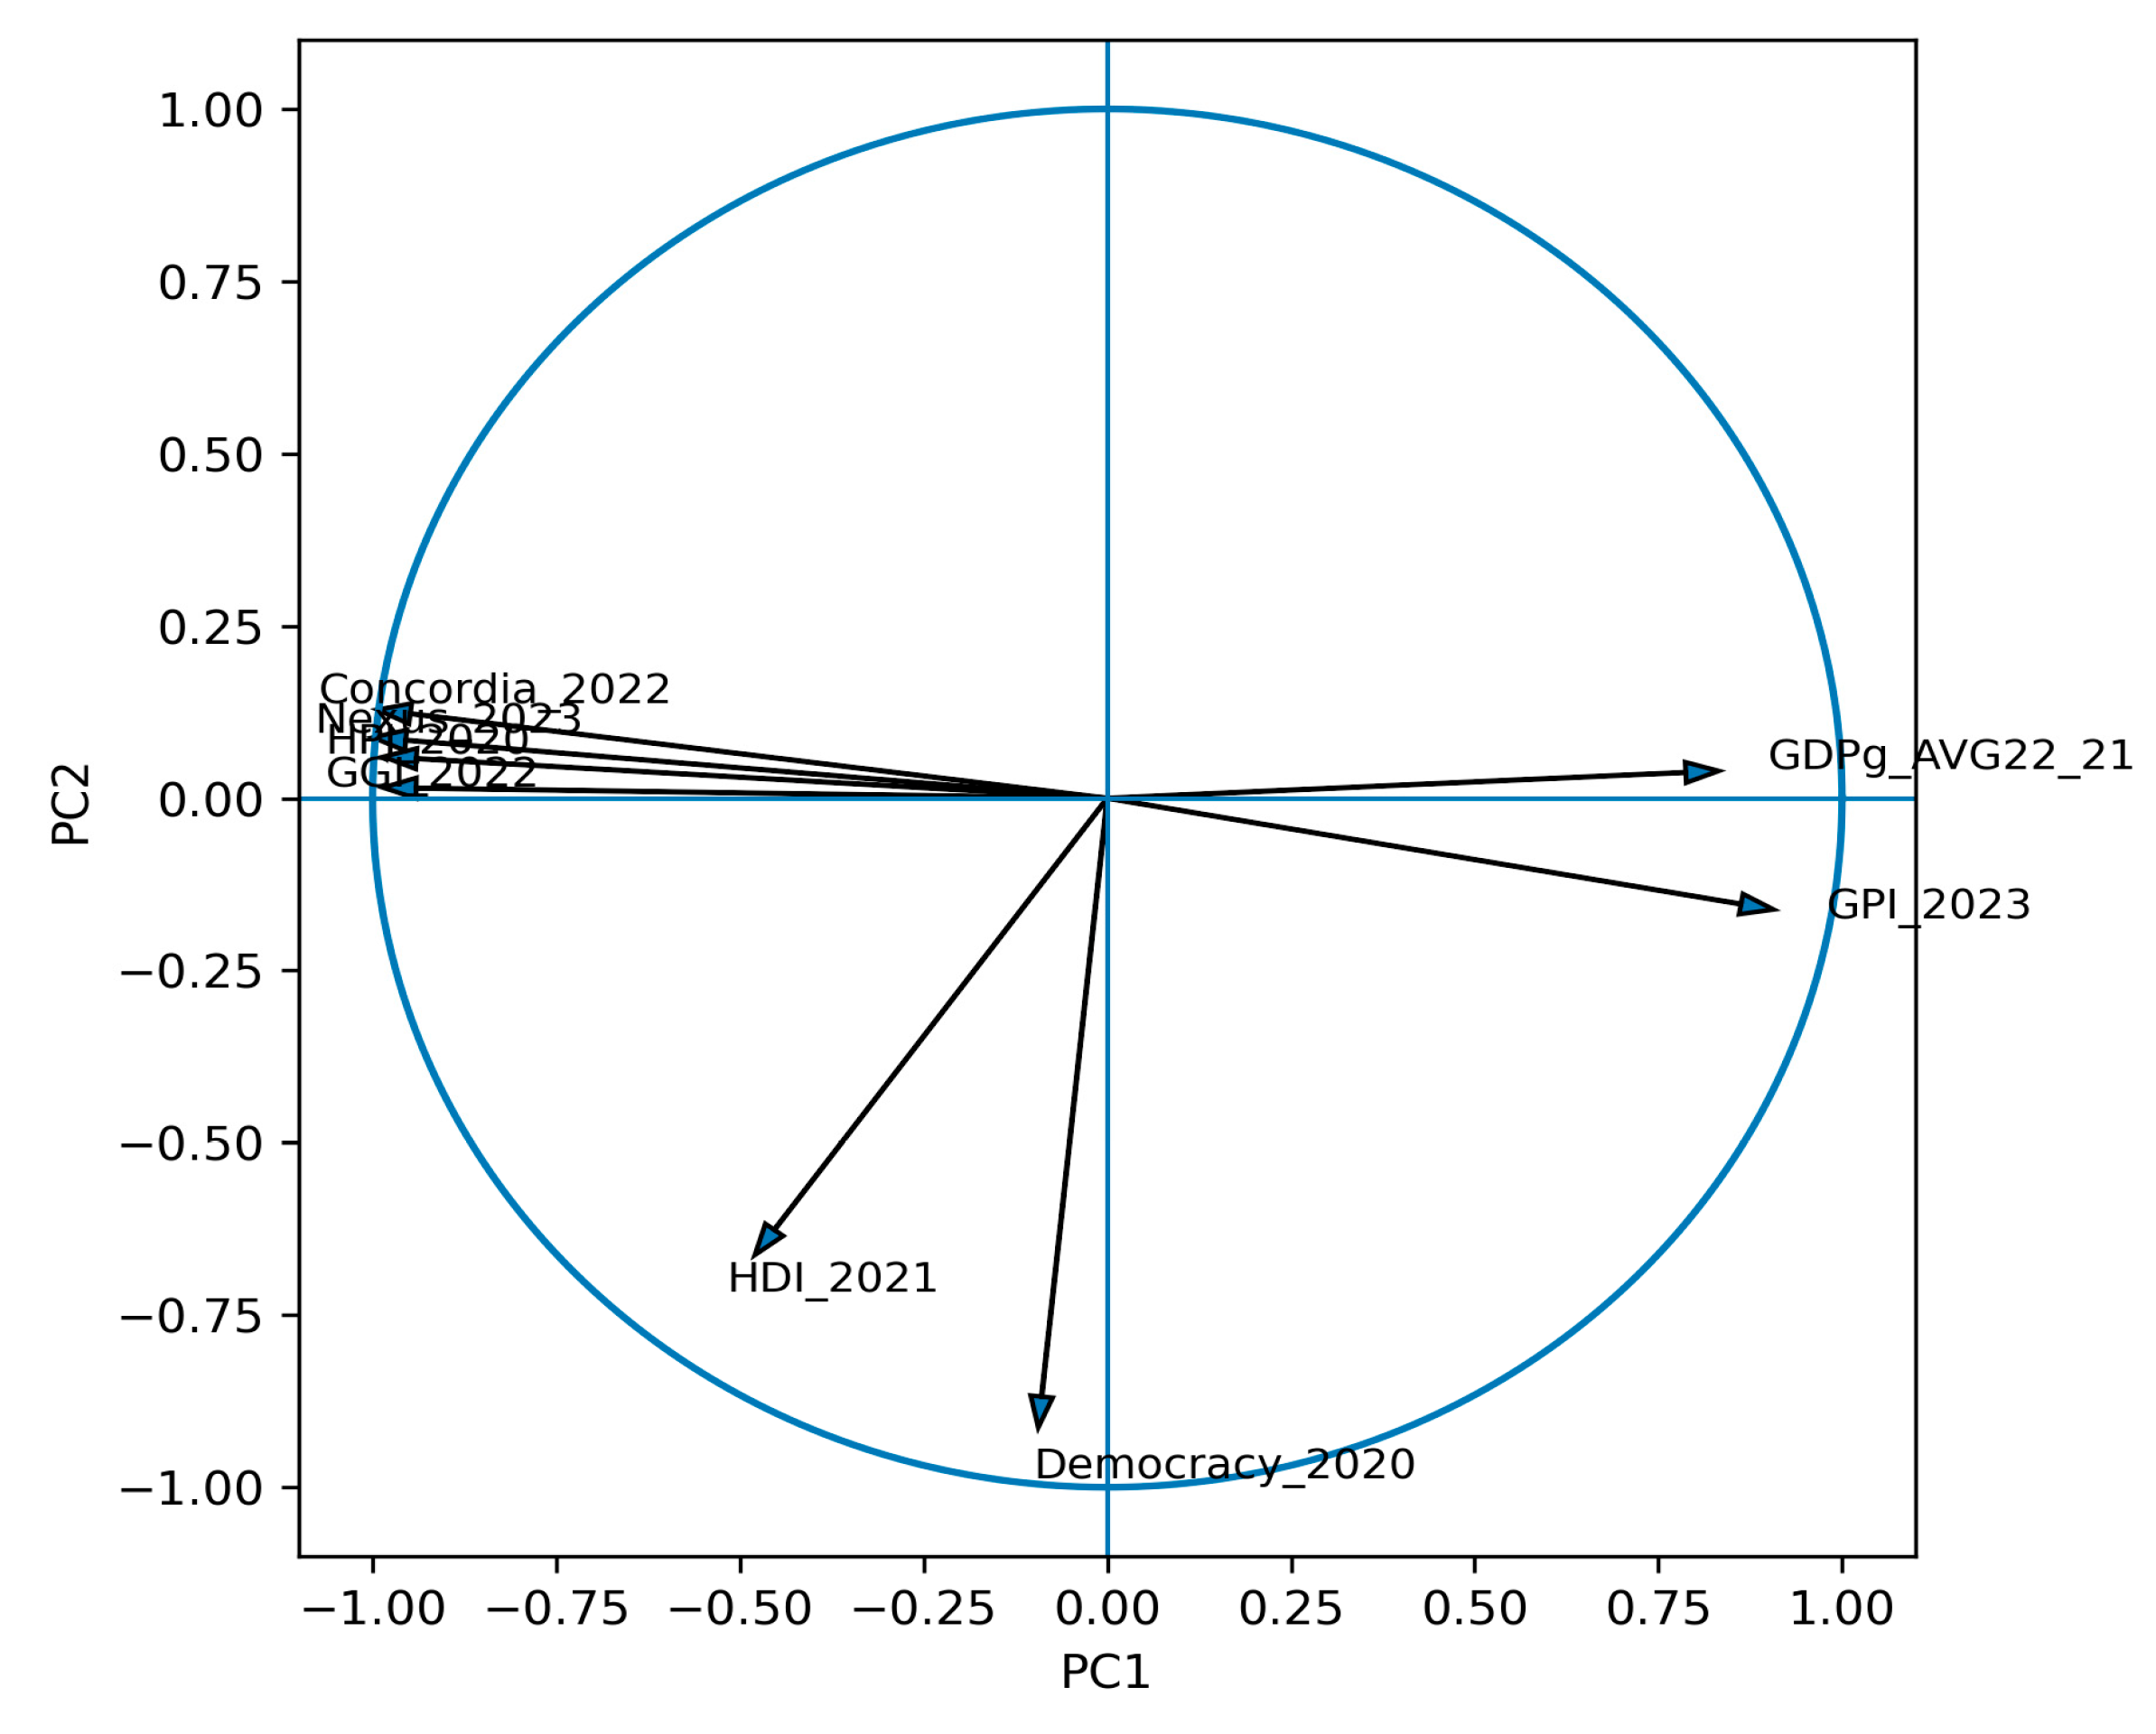
Figure 4.
Distribution of the Weighted I5P–Score and Tertile Cut-off Points. Note. Distribution of the weighted I5P–Score (PCA weights) and tertile cut-off points for descriptive classification.
Figure 4.
Distribution of the Weighted I5P–Score and Tertile Cut-off Points. Note. Distribution of the weighted I5P–Score (PCA weights) and tertile cut-off points for descriptive classification.
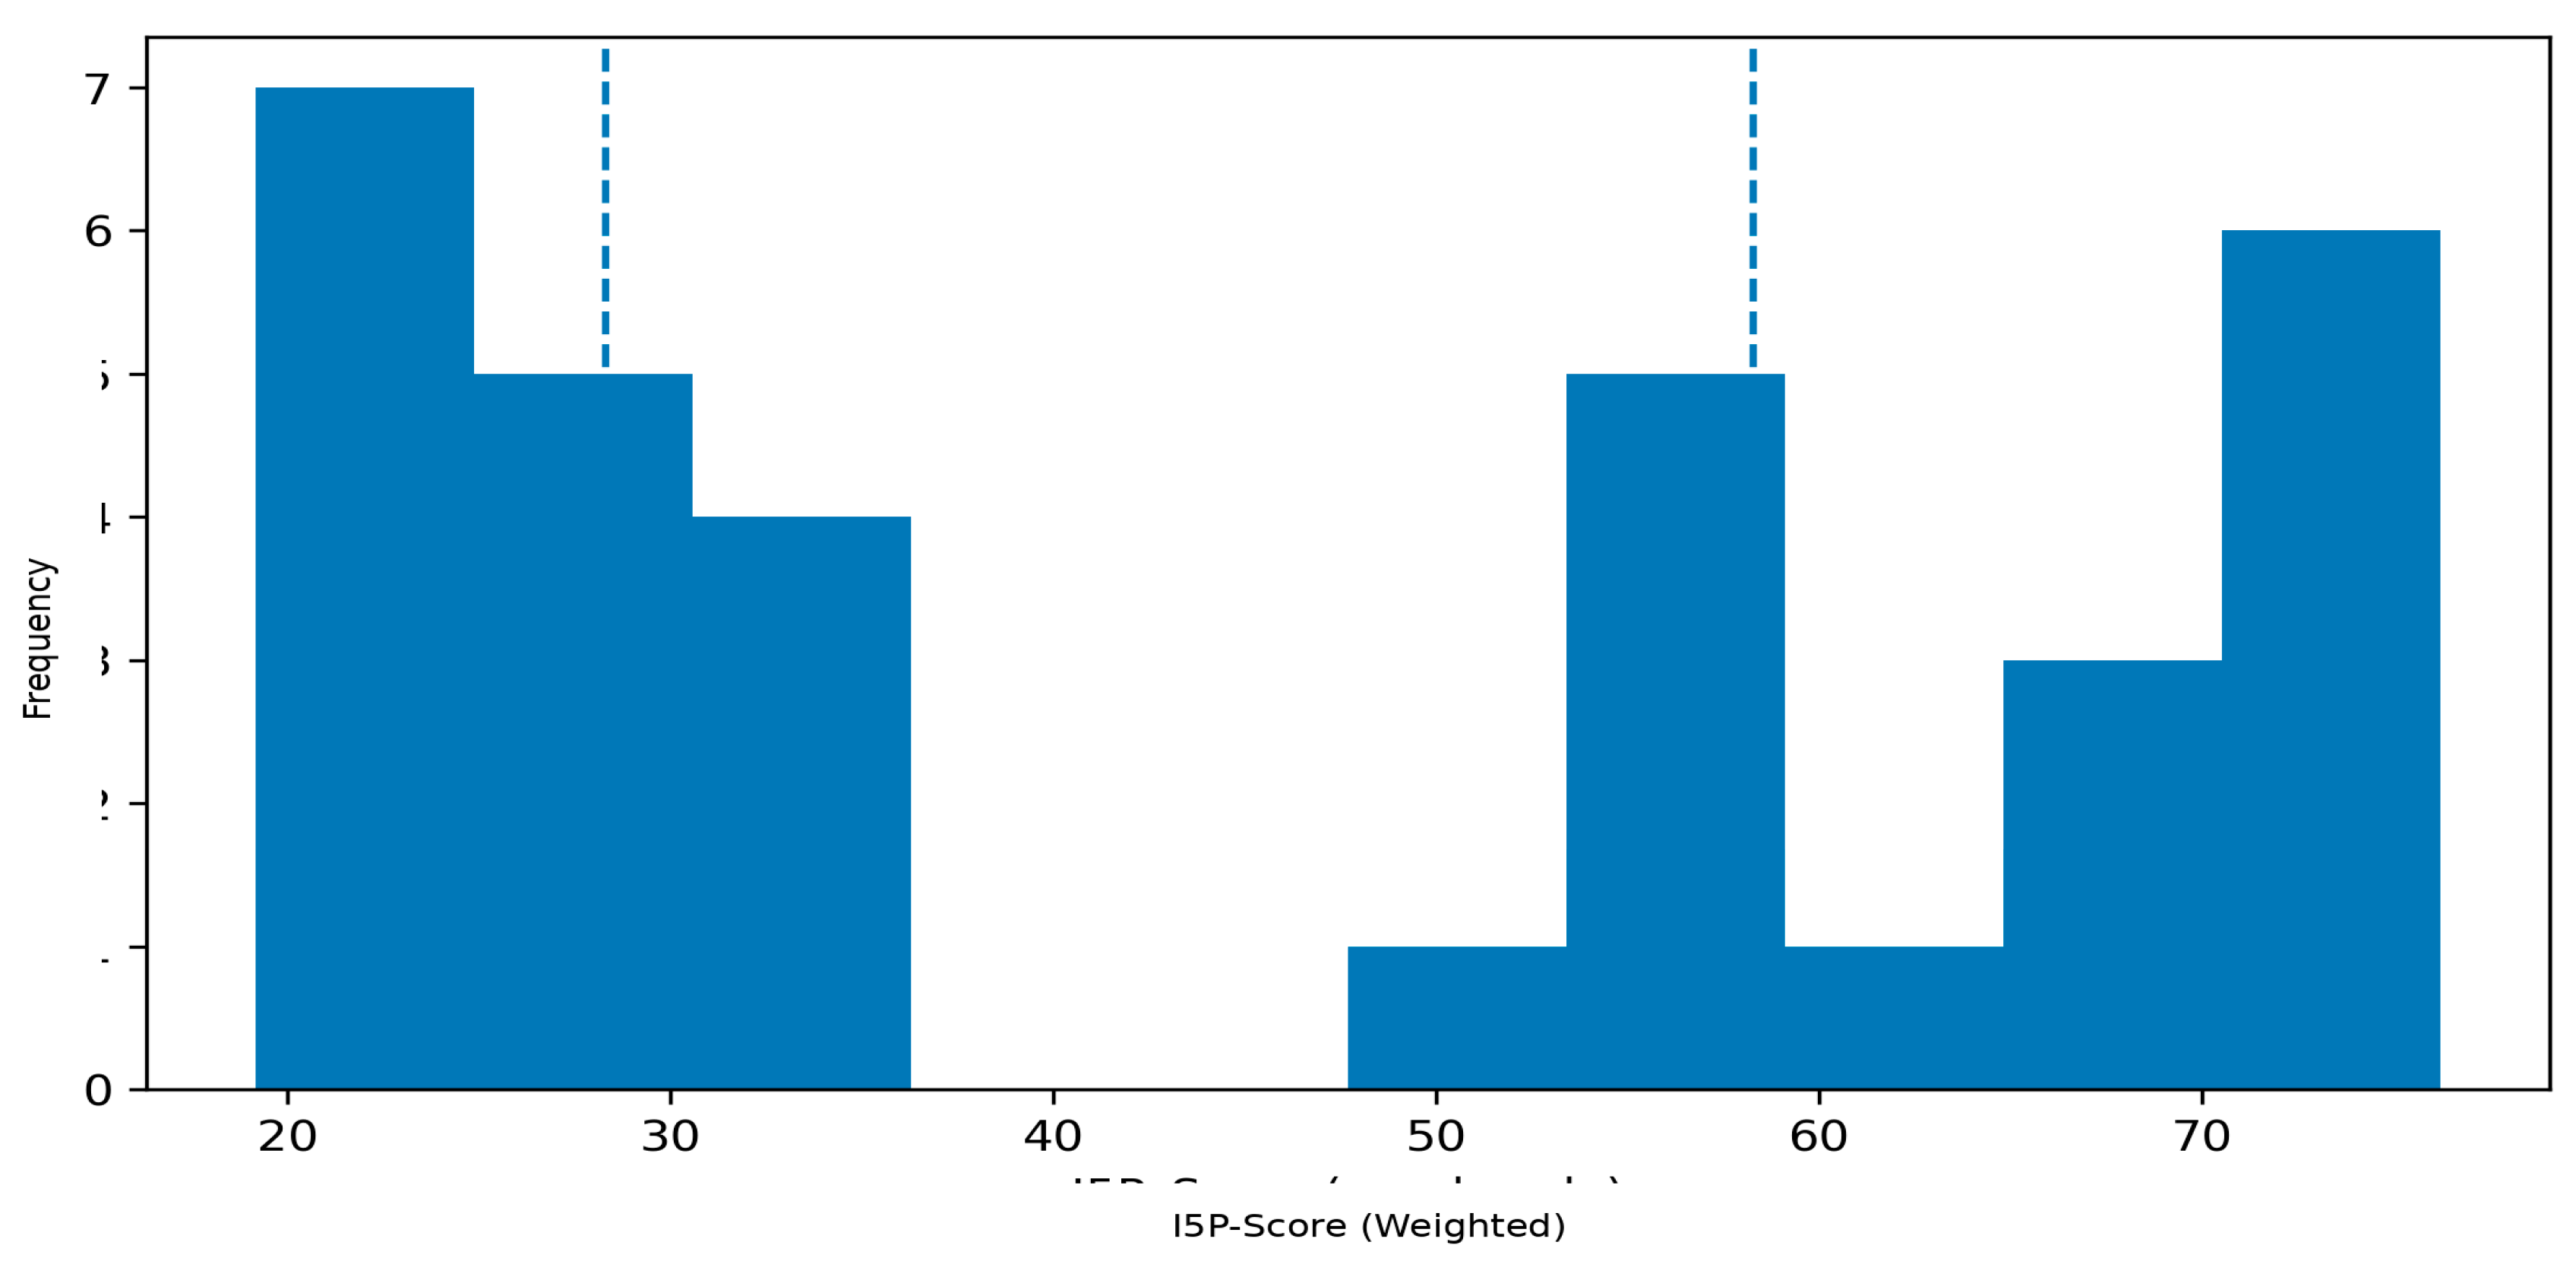
Figure 5.
5P Index by Country (Aggregate Score, 0–100 Scale). Note. Aggregate 5P Index scores (0–100) calculated from normalized indicators. Interpretation of the ranking is accompanied by dimension-level results and sensitivity/robustness tests [3,9].
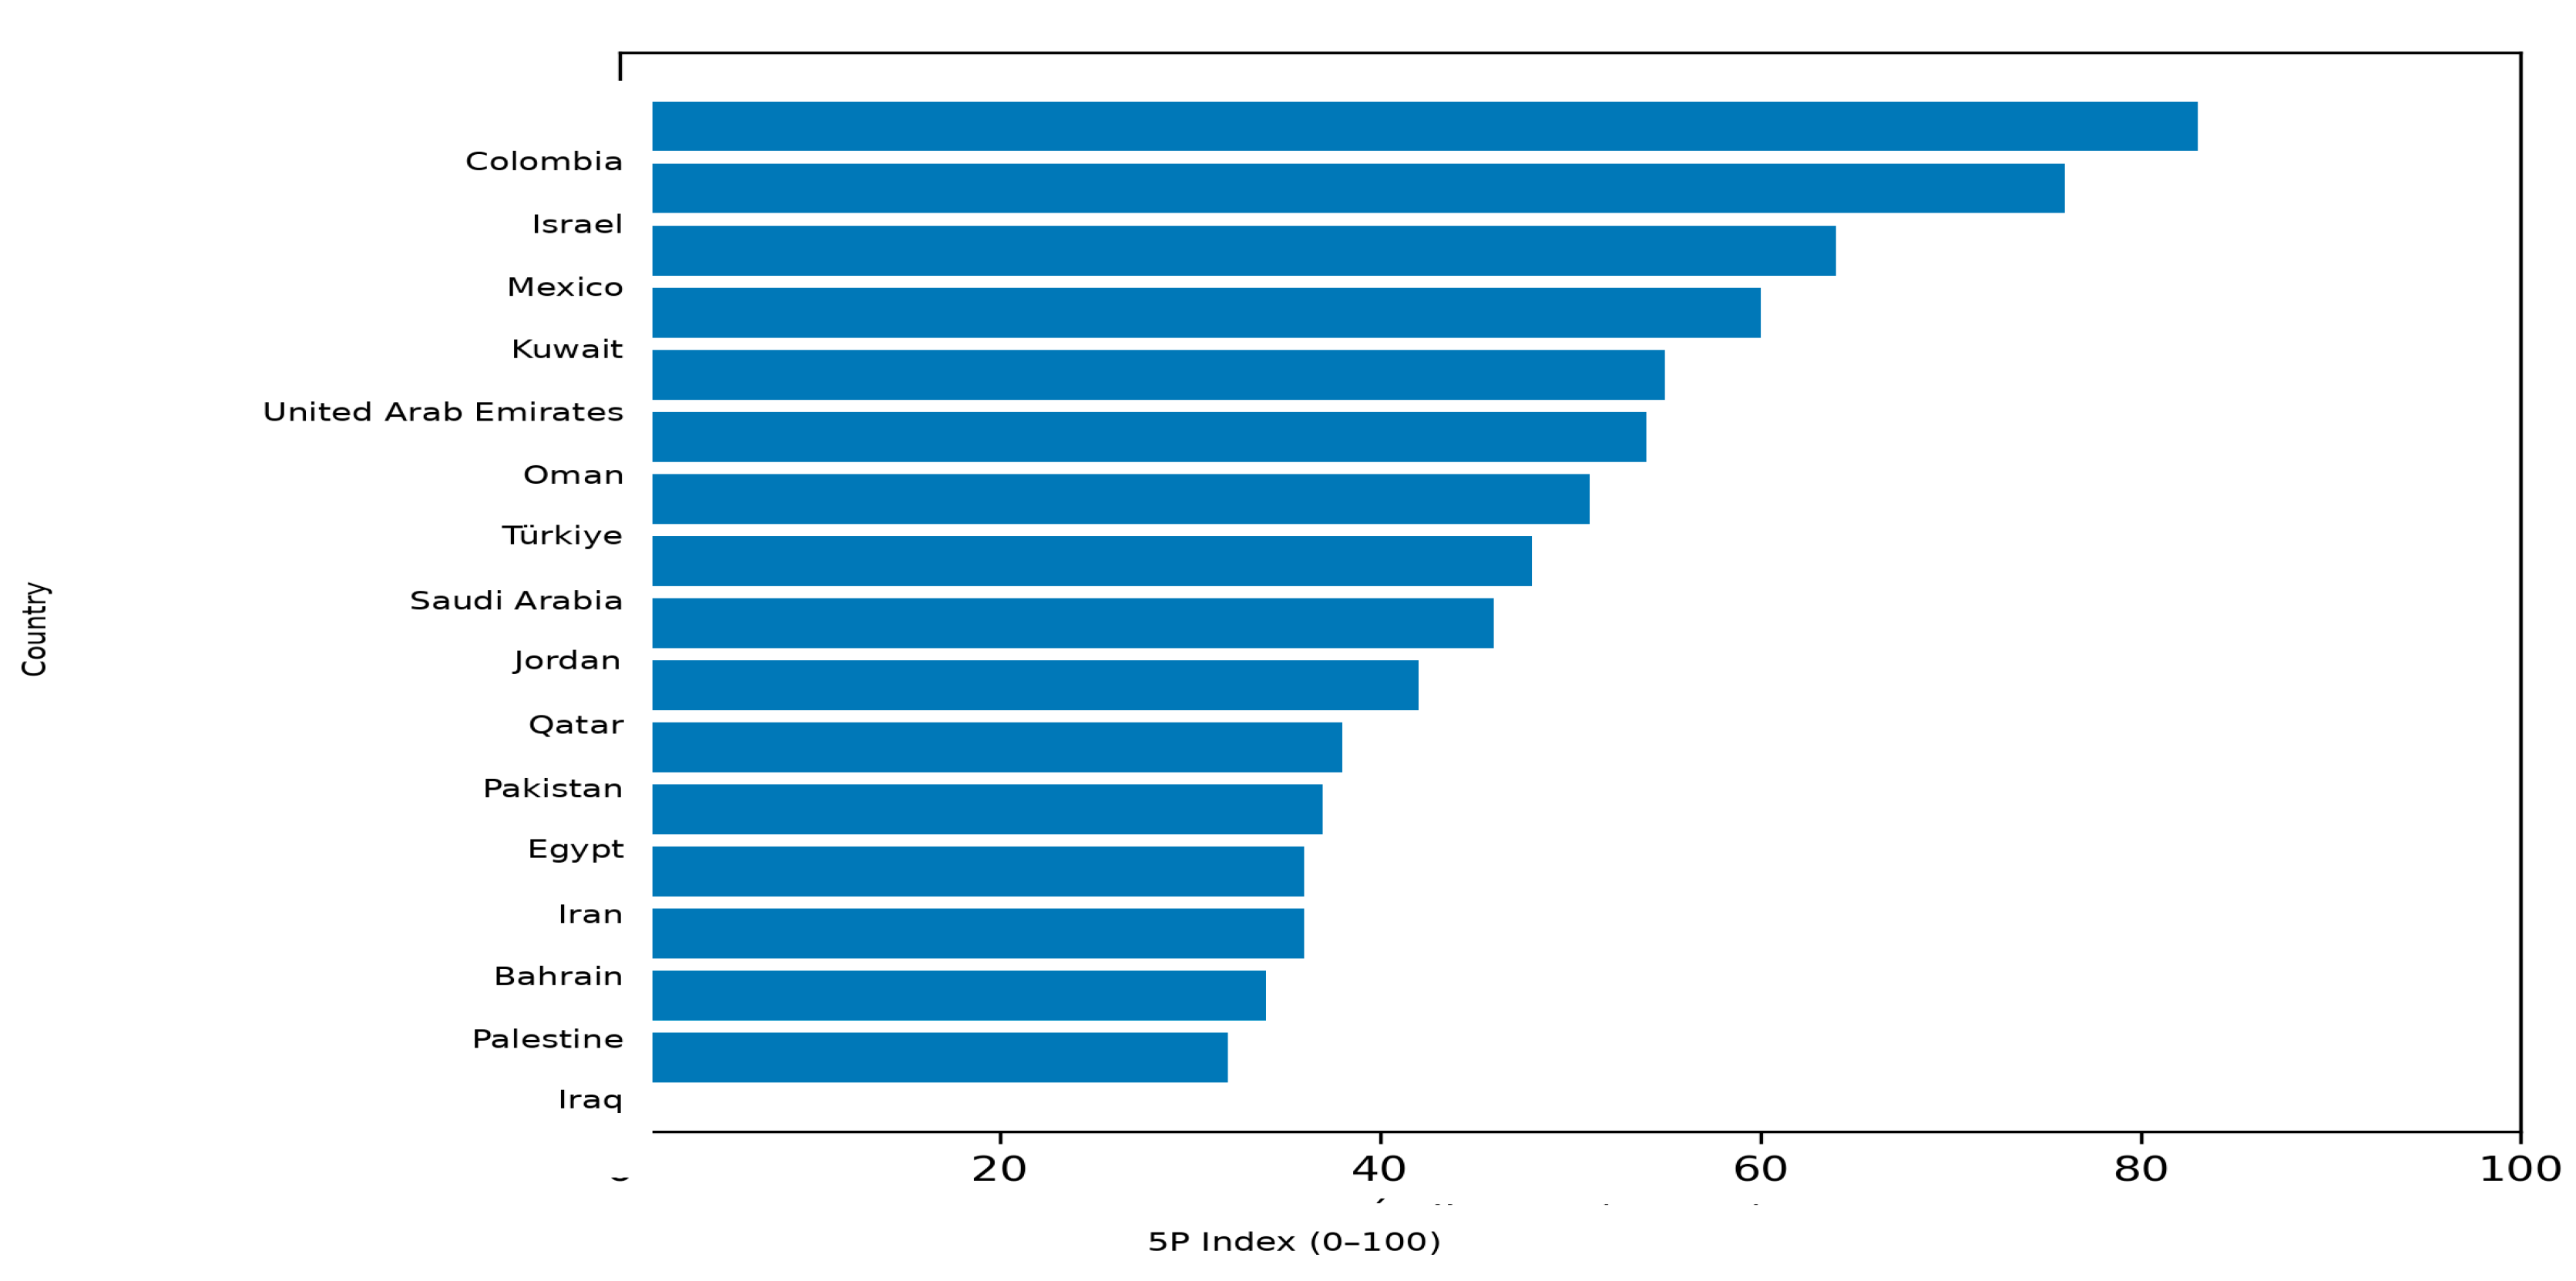

Table 1.
Coding and Screening Matrix of Candidate Indicators for the 5P Index (2020–2023 Window).
| 5P Dimension | Candidate Indicator | Operational Definition | Source | Time Window (criterion) | Directionality | Expected Coverage* | Risk of Redundancy/Dominance | Decision (F1–F4) | Justification (summary) |
|---|---|---|---|---|---|---|---|---|---|
| People | Human Development Index (HDI) | Synthetic measure of human development (health, education, and income) | UNDP | Latest data within 2020–2023 | ↑ better | High | Low | Retain (F1–F2) | Theoretical support and international comparability; proxy for human well-being. |
| People | Happy Planet Index (HPI) | Well-being and ecological efficiency (well-being vs. footprint) | HPI | Latest data within 2020–2023 | ↑ better | Medium | Medium | Retain (F1–F2), review (F3) | Complements People; requires sensitivity analysis due to dispersion/dominance. |
| Planet | Green Growth Index (GGI) | Synthetic measure of green growth | GGI | Latest data within 2020–2023 | ↑ better | Medium–High | Medium | Retain (F1–F2) | Captures environmental-productive performance; assess sensitivity due to variance. |
| Planet | WEF Nexus Index | Security/resilience of the water–energy–food nexus | WEF/Nexus | Latest data within 2020–2023 | ↑ better | Medium | Medium | Reassign to Planet (F1) | Aligned with resource security; improves Planet coherence. |
| Prosperity | GDP growth (average 2021–2022) | Proxy for economic dynamism (short/medium term) | World Bank/IMF/UN | Average 2021–2022 (within 2020–2023) | ↑ better | High | Low–Medium | Include (F1–F2) | Retained because of availability and cross-sectional comparability; its sensitivity is controlled in the robustness analysis. |
| Peace | Global Peace Index (GPI) | Peace/security (invert scale if applicable) | IEP (GPI) | Latest data within 2020–2023 | ↑ better** | Medium | Low | Retain (F1–F2) | Relevant to Peace; ensure comparable directionality. |
| Peace | Quality of Democracy | Democratic quality (institutionality) | International index | Latest data within 2020–2023 | ↑ better | Medium | Medium | Retain (F1–F2) | Captures institutionality; review redundancy if additional governance measures are added. |
| Partnerships | Concordia Partnership Index | Partnerships and cooperation | Concordia | Latest data within 2020–2023 | ↑ better | Medium | Medium | Retain (F1–F2) | Direct alignment with Partnerships; verify coverage. |
| Prosperity (not included) | GDP per capita (PPP) / GNI per capita (PPP) | Structural material prosperity (level) | World Bank/IMF/UN | Latest data within 2020–2023 | ↑ better | Medium | Medium | Exclude (F1–F3) | Excluded in this version because of missing data and measurement heterogeneity; retained as a future extension. |
Table 2.
Operational Map of the 5P Index: Dimensions, Final Indicators, and Measurement Rules (2020–2023).
Table 2.
Operational Map of the 5P Index: Dimensions, Final Indicators, and Measurement Rules (2020–2023).
| 5P Dimension | Final Indicator | Temporal Rule | Directionality | Transformation / Operational Observation |
|---|---|---|---|---|
| People | IDH | Latest available data within 2020–2023 | ↑ better | No additional transformation (subsequent normalization). |
| People | HPI | Latest available data within 2020–2023 | ↑ better | Review sensitivity due to dispersion; min–max normalization (baseline). |
| Planet | Green Growth Index | Latest available data within 2020–2023 | ↑ better | Min–max normalization (baseline). |
| Planet | WEF Nexus Index | Latest available data within 2020–2023 | ↑ better | Placed in Planet for conceptual coherence; min–max normalization (baseline). |
| Prosperity | GDP growth (average 2021–2022) | Average 2021–2022 (within 2020–2023) | ↑ better | Used because of comparative availability; ranking sensitivity to its weight is reported. |
| Peace | Global Peace Index | Latest available data within 2020–2023 | ↑ better | If the original scale is inverse, invert before normalization. |
| Peace | Quality of Democracy | Latest available data within 2020–2023 | ↑ better | No additional transformation (subsequent normalization). |
| Partnerships | Concordia Partnership Index | Latest available data within 2020–2023 | ↑ better | Verify coverage; min–max normalization (baseline). |
Note. Baseline normalization is performed using min–max over the full sample. Ranking robustness is assessed by comparing this specification with alternative normalization methods (z-scores) and weighting schemes (weight scenarios), as well as a conservative treatment of extreme values, where applicable [3,7,8,9].
Table 3.
Statistical Treatment Protocol and Exploratory Evaluation of the I5P–Score (2020–2023).
| Stage | Procedure | Operational Criterion | Purpose | Evidence reported |
|---|---|---|---|---|
| 1 | Directionality | Unify interpretation (↑ better); invert scale when applicable | Coherence and Comparability | List of inverted variables |
| 2 | Winsorization | p5–p95 (5% in each tail) by variable | Reduce outliers without eliminating cases | Thresholds and number of replacements |
| 3 | Normalization (baseline) | Min–max on a 0–100 scale | Common scale for aggregation | Normalized variables |
| 4 | 5P Scores | Simple averages by dimension | Identify drivers by pillar | 5P subindices by country |
| 5 | Weighting (PCA) | PCA on directionally aligned and standardized variables | Alternative empirical weights | Explained variance and weights |
| 6 | Covariance diagnostics | Global alpha and subindex alpha for dimensions with two indicators | Complementary description; not reflective validation | Reported α and conceptual interpretation |
| 7 | Factorability | KMO and Bartlett | Adequacy for factor techniques | KMO; χ², gl, p |
| 8 | Ranking robustness | Scenarios (weights, normalization, winsorization) + LOO | Ordering stability | ρ/τ and maximum changes |
Note. The sequence prioritizes traceability and ranking robustness; factor statistics are reported as complementary evidence.
Table 4.
Results of Statistical Treatment and Exploratory Diagnostics of the Instrument.
| Component | Result / statistic | Value | Observation |
|---|---|---|---|
| Winsorization | Percentiles applied | p5–p95 | 4 replacements per variable (n=32) |
| Winsorization | Threshold range (examples) | See Table 5 | Thresholds by variable (p5 and p95) |
| Normalization | Baseline method | Min – Max (0–100) | Applied after directionality adjustment |
| PCA | Explained variance (PC1) | 68.8% | PCA on standardized variables |
| PCA | Cumulative explained variance (PC1+PC2) | 84.9% | Second component reported as a reference |
| PCA | Weights (abs. PC1 loadings) | See Table 6 | Weights normalized to sum to 1 |
| Exploratory covariance | Global alpha (8 indicators) | 0.469 | A low value is expected in a heterogeneous formative construct; it is not used as a validity threshold. |
| Exploratory covariance | Alpha People (HDI, HPI) | 0.532 | Moderate associations between conceptually distinct measures of human development and sustainable well-being. |
| Exploratory covariance | Alpha Planet (GGI, Nexus) | 0.990 | Very high covariance; possible partial redundancy examined through sensitivity and leave-one-out analysis. |
| Exploratory covariance | Alpha Peace (GPI, Quality of Democracy) | -0.492 | Inverse relationship between components; evidence of heterogeneity, not reflective reliability. |
| KMO/Bartlett | Global KMO | 0.866 | Sampling adequacy for factor analysis |
| KMO/Bartlett | Bartlett (χ², gl) | 359.75; 28 | p < 0.001 |
| Robustness | PCA scenario vs. baseline (ρ; τ; Δ Max) | 0.888; 0.754; 10 | Rank correlations vs. baseline ranking |
| Robustness | 1% Winsor vs. baseline (ρ; τ; Δ Max) | 0.951; 0.839; 7 | Sensitivity comparison for extreme values |
| Robustness | Leave-one-out (ρ range; τ range) | 0.812–0.997; 0.645–0.976 | Δ Max range: 3–12 |
Note. Cronbach’s alpha is used solely as an exploratory diagnostic of internal covariance. The overall value (α = 0.469) and the value for People (α = 0.532) do not meet the empirical rule-of-thumb threshold of 0.70 because the 5P Index is formative and composed of independent elements. The Planet coefficient (α = 0.990) may indicate partial redundancy between the Green Growth Index and the WEF Nexus Index; therefore, this issue was contrasted through sensitivity analysis and iterative-elimination procedures (leave-one-out). In the Peace dimension, the GPI score was inverted prior to calculation; the negative value (α = -0.492) shows that security and democracy do not behave unidimensionally. For Prosperity and Partnerships, because each is composed of a single indicator, alpha is omitted in both cases.
Table 5.
Winsorization Thresholds by Variable (p5–p95).
| Variable | p5 | p95 | n replacements |
|---|---|---|---|
| HDI_2021 | 0.2935 | 0.9525 | 4 |
| HPI_2020 | 0.0196 | 55.1650 | 4 |
| GGI_2022 | 0.0284 | 67.0875 | 4 |
| GDPg_AVG22_21 | 0.0169 | 0.7502 | 4 |
| Nexus_2023 | 0.0975 | 71.9700 | 4 |
| GPI_2023 | 0.2912 | 2.6130 | 4 |
| Democracy_2020 | 0.0220 | 0.9420 | 4 |
| Concordia_2022 | 0.1260 | 54.5115 | 4 |
Note. The p5 and p95 thresholds were calculated by indicator over the study sample. Values below p5 and above p95 were replaced by the corresponding threshold value (bilateral winsorization). indicates the number of observations adjusted in each indicator. This treatment is applied before Min–Max normalization.
Table 6.
PC1 Loadings and Derived Weights (PCA).
| Indicator | PC1 Loading | Weight (abs., normalized) |
|---|---|---|
| HDI_2021 | -0.201 | 0.076 |
| HPI_2020 | -0.413 | 0.157 |
| GGI_2022 | -0.413 | 0.157 |
| GDPg_AVG22_21 | 0.349 | 0.133 |
| Nexus_2023 | -0.419 | 0.159 |
| GPI_2023 | 0.380 | 0.144 |
| Democracy_2020 | -0.039 | 0.015 |
| Concordia_2022 | -0.417 | 0.158 |
Note. PC1 corresponds to the first principal component estimated from directionally aligned and standardized variables. The weights are derived from the PC1 loadings (in absolute value) and rescaled so that their sum equals one. These weights are used as an alternative specification to contrast ranking stability with the baseline equal-weight scheme.
Table 7.
Dimensional Subindices, Global Score, Ordinal Position, and Block Classification of the 5P Composite Index.
Table 7.
Dimensional Subindices, Global Score, Ordinal Position, and Block Classification of the 5P Composite Index.
| Rank | Country | People | Planet | Prosperity | Peace | Partnerships | 5P Index | Block |
|---|---|---|---|---|---|---|---|---|
| 1 | Colombia | 82.00 | 90.00 | 84.00 | 70.00 | 91.50 | 83.50 | High |
| 2 | Israel | 90.00 | 82.00 | 75.00 | 45.00 | 88.00 | 76.00 | High |
| 3 | Mexico | 74.00 | 80.00 | 52.00 | 48.00 | 67.90 | 64.38 | High |
| 4 | Kuwait | 76.00 | 38.00 | 78.00 | 75.00 | 34.90 | 60.38 | High |
| 5 | United Arab Emirates | 82.00 | 45.00 | 68.00 | 58.00 | 20.10 | 54.62 | Medium |
| 6 | Oman | 72.00 | 50.00 | 62.00 | 61.00 | 27.50 | 54.50 | Medium |
| 7 | Türkiye | 70.00 | 55.00 | 45.00 | 42.00 | 43.00 | 51.00 | Medium |
| 8 | Saudi Arabia | 75.00 | 35.00 | 65.00 | 55.00 | 8.10 | 47.62 | Medium |
| 9 | Jordan | 65.00 | 48.00 | 35.00 | 52.00 | 31.90 | 46.38 | Medium |
| 10 | Qatar | 80.00 | 30.00 | 58.00 | 35.00 | 5.75 | 41.75 | Medium |
| 11 | Pakistan | 45.00 | 44.00 | 42.00 | 30.00 | 27.75 | 37.75 | Low |
| 12 | Egypt | 50.00 | 35.00 | 40.00 | 38.00 | 24.50 | 37.50 | Low |
| 13 | Bahrain | 72.00 | 32.00 | 45.00 | 25.00 | 5.40 | 35.88 | Low |
| 14 | Iran | 62.00 | 40.00 | 38.00 | 18.00 | 20.10 | 35.62 | Low |
| 15 | Palestine | 55.00 | 42.00 | 20.00 | 15.00 | 36.10 | 33.62 | Low |
| 16 | Iraq | 48.00 | 35.00 | 30.00 | 18.00 | 30.90 | 32.38 | Low |
Note. People, Planet, and Peace correspond to the simple average of their two constituent indicators; Prosperity and Partnerships are each represented by a single indicator. The 5P Index is the arithmetic mean of the five subindices. The block classification has a descriptive purpose: high (≥60), medium (40–59.99), and low (<40). Small differences between countries that are close in the ranking should be interpreted together with the sensitivity tests and not as conclusive substantive gaps.
Table 8.
Ranking Robustness: Scenarios and Stability (Spearman/Kendall).
| Scenario | Description | Spearman (ρ) vs. baseline ranking | Kendall (τ) vs. baseline ranking | Max. rank change |
|---|---|---|---|---|
| E0 (baseline) | Simple average of the 8 normalized indicators | — | — | — |
| E1 | Average by 5P dimensions (equal weights for People, Planet, Prosperity, Peace, and Partnerships) | 0.94 | 0.83 | 4 |
| E2 | Social-environmental weights (People 0.25, Planet 0.25, Prosperity 0.20, Peace 0.15, Partnership 0.15) | 0.94 | 0.85 | 5 |
| E3 | Institutional weights (Peace 0.25, Partnership 0.25, People 0.20, Planet 0.15, Prosperity 0.15) | 0.91 | 0.75 | 4 |
| E4 (LOO) | Leave-one-out: recompute the index excluding one indicator (8 tests) | 0.89–0.98 | 0.77–0.90 | 2–5 |
Note. corresponds to Spearman’s correlation coefficient and to Kendall’s coefficient. The coefficients are estimated by comparing each scenario ranking with the baseline ranking (E0). The maximum rank change indicates the largest absolute variation in positions observed for a country between the scenario and the baseline ranking.
Table 9.
Ranking Uncertainty (α = 50; Nearly Equal Weights).
| Country | Median | IQR | P(Top3) | P(Top5) | Best | Worst |
|---|---|---|---|---|---|---|
| Colombia | 1 | 0.000 | 1.000 | 1.000 | 1 | 1 |
| Israel | 2 | 0.000 | 1.000 | 1.000 | 2 | 2 |
| Mexico | 3 | 0.000 | 0.968 | 1.000 | 3 | 4 |
| Kuwait | 4 | 0.000 | 0.032 | 1.000 | 3 | 4 |
| United Arab Emirates | 5 | 1.000 | 0.000 | 0.532 | 5 | 7 |
| Oman | 6 | 1.000 | 0.000 | 0.464 | 5 | 7 |
| Türkiye | 7 | 0.000 | 0.000 | 0.005 | 5 | 10 |
| Saudi Arabia | 8 | 1.000 | 0.000 | 0.000 | 8 | 10 |
| Jordan | 9 | 1.000 | 0.000 | 0.000 | 7 | 10 |
| Qatar | 10 | 0.000 | 0.000 | 0.000 | 8 | 15 |
Note. The simulation with =50 represents moderate variations around nearly uniform weights (≈ 1/8 per indicator). Median indicates the country’s typical position; IQR measures stability (IQR≈0 implies an almost fixed ranking). P(Top3) and P(Top5) correspond to the proportion of iterations in which the country ranks among the top 3 and top 5, respectively. The Best and Worst fields report the best and worst positions observed under this bounded dispersion of weights.
Table 10.
Ranking Uncertainty (α = 1; Widely Varying Weights).
| Country | Median | IQR | P(Top3) | P(Top5) | Best | Worst |
|---|---|---|---|---|---|---|
| Colombia | 1 | 0.000 | 0.988 | 0.998 | 1 | 9 |
| Israel | 2 | 0.000 | 0.907 | 0.960 | 1 | 11 |
| Mexico | 3 | 2.000 | 0.512 | 0.789 | 1 | 12 |
| Kuwait | 4 | 3.000 | 0.310 | 0.731 | 1 | 14 |
| United Arab Emirates | 6 | 2.000 | 0.062 | 0.426 | 1 | 14 |
| Oman | 6 | 3.000 | 0.104 | 0.460 | 2 | 14 |
| Türkiye | 7 | 4.000 | 0.085 | 0.274 | 1 | 16 |
| Saudi Arabia | 8 | 3.000 | 0.001 | 0.053 | 3 | 16 |
| Jordan | 9 | 5.000 | 0.003 | 0.150 | 3 | 16 |
| Qatar | 10 | 7.000 | 0.030 | 0.104 | 1 | 16 |
Note. A low median (close to 1) and an IQR close to 0 indicate a stable position. A high IQR and a wide Best–Worst range suggest ranking sensitivity to changes in weights. In this application, Colombia and Israel show high stability under both values of , whereas intermediate positions show greater variation when more extreme weights are allowed ().
Table 11.
Comparison with the SDG Index from the Sustainable Development Report.
| Country | Proposed 5P Index (0–100) | SDG Index (SDR, score) |
|---|---|---|
| Colombia | 83.50 | 70.46 |
| Israel | 76.00 | 74.46 |
| Mexico | 64.38 | 70.80 |
| Kuwait | 60.38 | 63.28 |
| United Arab Emirates | 54.62 | 69.84 |
| Oman | 54.50 | 67.07 |
| Türkiye | 51.00 | 70.61 |
| Saudi Arabia | 47.62 | 65.19 |
| Jordan | 46.38 | 70.99 |
| Qatar | 41.75 | 65.09 |
| Pakistan | 37.75 | 56.97 |
| Egypt | 37.50 | 68.09 |
| Bahrain | 35.88 | 64.41 |
| Iran | 35.62 | 69.56 |
| Palestine | 33.62 | 65.61 |
| Iraq | 32.38 | 63.94 |
Note. Table 11 compares the 5P Composite Index score, constructed from eight indicators normalized on a scale from 0 to 100 with uniform weighting, with the SDG Index published by the Sustainable Development Report. The comparison is used as external evidence of partial convergence and does not imply conceptual or temporal equivalence between the two instruments. Cases without comparable information are not included in the correlation calculations.
Disclaimer/Publisher’s Note: The statements, opinions and data contained in all publications are solely those of the individual author(s) and contributor(s) and not of MDPI and/or the editor(s). MDPI and/or the editor(s) disclaim responsibility for any injury to people or property resulting from any ideas, methods, instructions or products referred to in the content. |
© 2026 by the authors. Licensee MDPI, Basel, Switzerland. This article is an open access article distributed under the terms and conditions of the Creative Commons Attribution (CC BY) license (http://creativecommons.org/licenses/by/4.0/).
Copyright: This open access article is published under a Creative Commons CC BY 4.0 license, which permit the free download, distribution, and reuse, provided that the author and preprint are cited in any reuse.