

Submitted:
25 September 2026
Posted:
28 September 2026
You are already at the latest version
Abstract
Introduction: FGF23 and osteocalcin are important regulators of mineral and bone metabolism. The association between FGF23 and undercarboxylated osteocalcin (Glu-OC) in chronic kidney disease (CKD) remains insufficiently understood. This study aimed to investigate the association between FGF23 and Glu-OC and assess whether it is independent of kidney function. Methods: This cross-sectional study included 80 adults: 12 healthy controls and 68 patients with non-dialysis CKD stages G1–G4. FGF23, Glu-OC, calcium, phosphate, PTH, and bone metabolism markers were measured. Associations were assessed using Spearman correlation, partial Spearman correlation adjusted for eGFR, and multivariable linear regression. Results: FGF23 was inversely correlated with eGFR (ρ = −0.346; p = 0.004) and positively correlated with creatinine (ρ = 0.299; p = 0.013). FGF23 was inversely associated with Glu-OC (ρ = −0.344; p = 0.004), with the association becoming stronger after adjustment for eGFR (partial ρ = -0.477; p < 0.001). In complementary multivariable models, the inverse association between FGF23 and Glu-OC persisted: Glu-OC was associated with FGF23 (β = −0.258; p = 0.024), along with ALP (β = 0.369; p = 0.001), while FGF23 was associated with Glu-OC (β = −0.266; p = 0.020), along with calcium (β = −0.366; p = 0.002). Conclusion: FGF23 is independently and inversely associated with Glu-OC in non-dialysis CKD, and this relationship persists after adjustment for kidney function. These findings support an association between FGF23 and Glu-OC in CKD–mineral and bone disorder (CKD-MBD).
Keywords:
FGF23
; undercarboxylated osteocalcin
; chronic kidney disease
; CKD-MBD
; bone–kidney axis
; bone turnover
1. Introduction
Chronic kidney disease-mineral and bone disorder (CKD-MBD) is a systemic syndrome characterized by disturbances in mineral metabolism, abnormalities in bone turnover, mineralization, and bone tissue structure, as well as extraskeletal, particularly vascular, calcification [1,2]. These disturbances develop early in the course of CKD and reflect progressive changes in the kidney-bone axis, in which the kidney and bone tissue are closely interconnected in the regulation of phosphate, calcium, and vitamin D metabolism. As kidney function declines, phosphate retention, altered fibroblast growth factor 23 (FGF23) signaling, impaired vitamin D metabolism, and secondary hyperparathyroidism progressively affect mineral homeostasis and skeletal metabolism [3,4,5]
Osteocalcin is a non-collagenous protein synthesized primarily by osteoblast-lineage cells and is closely associated with bone formation activity. Following synthesis, osteocalcin undergoes vitamin K-dependent γ-carboxylation, resulting in its carboxylated form (Gla-OC). However, some molecules remain partially or fully undercarboxylated and are detected in the circulation as undercarboxylated osteocalcin (Glu-OC) [6,7]. Although osteocalcin has traditionally been regarded primarily as a marker of bone formation, accumulating evidence indicates that it may also participate in endocrine communication between bone and peripheral tissues [8,9]. In particular, the undercarboxylated form has been investigated in relation to glucose metabolism and insulin sensitivity [9,10]. However, findings in humans remain less consistent than those from experimental models, warranting cautious interpretation of the systemic metabolic role of Glu-OC in humans [8,11,12]. FGF23 is a bone-derived endocrine hormone that plays a central role in phosphate and vitamin D homeostasis. It is produced primarily by osteocytes and osteoblast-lineage cells and exerts its principal endocrine effects through fibroblast growth factor receptors in the presence of the co-receptor α-Klotho. In the kidney, FGF23 promotes phosphate excretion and suppresses the renal synthesis of 1,25-dihydroxyvitamin D, thereby contributing to the maintenance of phosphate balance [13,14,15]. In CKD, circulating FGF23 concentrations generally increase as kidney function deteriorates and are considered an early adaptive response to disrupted phosphate homeostasis [5,14]. Persistently elevated FGF23 levels are also associated with multiple adverse clinical outcomes in CKD, although it remains unclear whether these associations reflect direct biological effects or the broader pathophysiological milieu of CKD-MBD [5,14,16,17].
FGF23 and osteocalcin are both produced by cells of the osteoblast-osteocyte lineage, suggesting a potential functional relationship between FGF23 signaling and osteocalcin metabolism [18,19]. Experimental studies indicate that FGF23 signaling may influence osteoblast-lineage cell biology and bone remodeling [20], while osteoblast and osteocyte activity contributes to the regulation of FGF23 production [21,22]. These observations support the possibility of an interconnected regulatory network linking FGF23 to osteoblast-lineage cell activity. Nevertheless, whether FGF23 is associated with the circulating Glu-OC in humans, particularly across different stages of non-dialysis CKD, remains poorly understood [23,24].
Interpretation of this relationship is further complicated by the substantial changes in calcium metabolism and bone turnover that accompany CKD progression. Declining kidney function is associated with phosphate retention, disturbances in vitamin D metabolism, and changes in parathyroid regulation, which may ultimately affect serum calcium concentrations and bone turnover [25,26,27]. Calcium is also an important component of skeletal mineralization and interacts with osteocalcin in the bone matrix [28]. Consequently, changes in calcium homeostasis may accompany alterations in the circulating forms of osteocalcin. Whether serum calcium is independently associated with Glu-OC in CKD and how such an association relates to FGF23 and bone turnover markers remain unclear.
Another important consideration is the influence of kidney function on circulating biomarker concentrations. Reduced kidney function may alter the metabolism and clearance of circulating proteins and peptides, including FGF23 [29,30]. Thus, the observed association between FGF23 and Glu-OC in CKD may, at least in part, reflect the severity of kidney dysfunction [17,24]. Assessing whether this association persists after adjustment for eGFR is therefore important in determining whether the relationship extends beyond the effect of reduced kidney function. This consideration is particularly relevant to cross-sectional studies, in which kidney function, mineral metabolism, and bone turnover are closely interrelated [24,25,27].
Despite the established role of FGF23 in CKD-MBD and the growing recognition of osteocalcin as a biologically active bone-derived protein, several questions remain unresolved [23,31]. It is unclear whether FGF23 is independently associated with circulating Glu-OC beyond the effect of kidney dysfunction, whether this relationship differs across CKD stages, and whether calcium and bone turnover markers provide additional information about the biological context of this association. Addressing these questions may contribute to a more integrated understanding of the interplay between kidney function, mineral metabolism, and osteoblast-lineage cell activity during CKD progression [23].
Therefore, the primary aim of the present study was to investigate the association between circulating FGF23 and Glu-OC in adult patients with non-dialysis CKD and to determine whether this relationship remains independent of kidney function. The secondary aims were to assess the associations of FGF23 and Glu-OC with calcium and bone turnover markers and to characterize the FGF23–Glu-OC relationship across different CKD stages.
2. Results
2.1. Clinical and Biochemical Characteristics of the Study Population
The clinical and biochemical characteristics of the study population are summarized in Table 1.
Comparison of the measured parameters across groups stratified by the degree of kidney dysfunction revealed no statistically significant difference in sex distribution (p = 0.152), whereas age differed significantly between groups (p < 0.001). As expected, eGFR progressively decreased from 103.00 mL/min/1.73 m² in controls to 16.50 mL/min/1.73 m² in CKD G4, accompanied by a significant increase in serum creatinine (p < 0.001).
Significant changes were observed in mineral metabolism parameters. Serum calcium decreased, whereas inorganic phosphate and PTH increased with worsening kidney dysfunction (p = 0.004, p < 0.001, and p < 0.001, respectively). These changes were most pronounced in CKD G4, where median Ca, Pi, and PTH values were 2.31 mmol/L, 1.52 mmol/L, and 110.35 pg/mL, respectively. Total 25(OH)D concentrations also decreased significantly across groups (p = 0.001), while ALP tended to increase with more advanced kidney dysfunction (p = 0.012).
Glu-OC showed statistically significant between-group differences (p = 0.033), increasing from 0.59 ng/mL in controls to 5.22 ng/mL in CKD G3, followed by a slight decrease in CKD G4. Gla-OC also differed significantly between groups (p = 0.035), but without a clear progressive trend. FGF23 showed significant between-group differences (p = 0.023), with the lowest median in CKD G1 (83.40 pg/mL) and the highest in CKD G4 (208.65 pg/mL), suggesting a nonlinear pattern with CKD progression. In contrast, α-Klotho did not differ significantly between groups (p = 0.722).
P1NP increased significantly with worsening kidney dysfunction (p < 0.001), reaching 5450 pg/mL in CKD G4. CTX1 also showed statistically significant between-group differences (p = 0.033), but without a consistent trend.
In summary, CKD progression was associated with characteristic disturbances in mineral and bone metabolism, including decreases in calcium and total 25(OH)D, increases in phosphate, PTH, and ALP, and a significant increase in P1NP. Significant between-group differences in Glu-OC, Gla-OC, and FGF23 further support the presence of altered regulation of bone and mineral metabolism with worsening kidney dysfunction.
2.2. Associations of FGF23 and Glu-OC with Renal Function and Mineral-Bone Metabolism
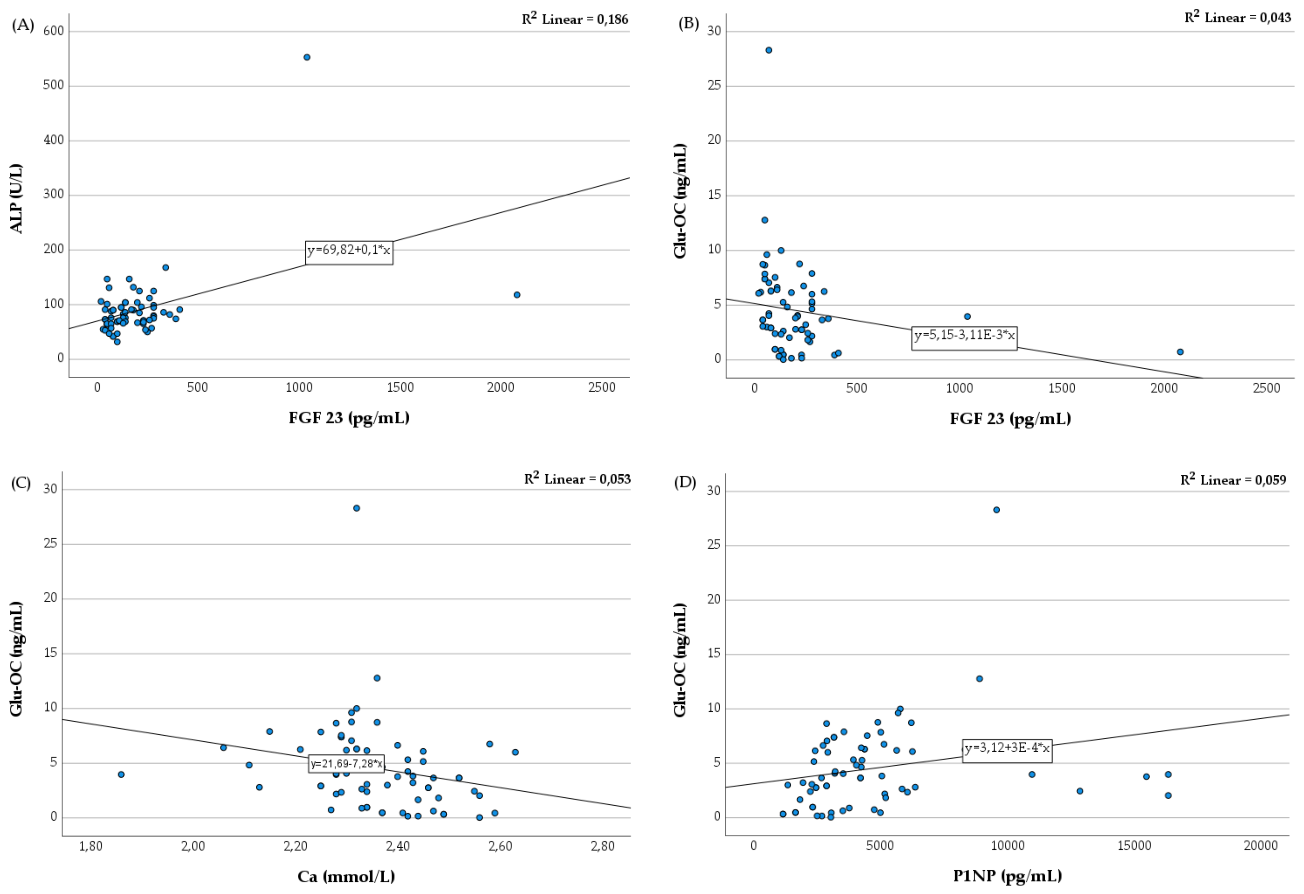
Correlation analysis revealed significant associations of FGF23 and Glu-OC with kidney function and selected parameters of mineral and bone metabolism (Table 2). FGF23 correlated negatively with eGFR (ρ = −0.346; p = 0.004) and positively with serum creatinine (ρ = 0.299; p = 0.013), indicating an association between higher FGF23 concentrations and impaired kidney function. FGF23 also correlated negatively with Glu-OC (ρ = −0.344; p = 0.004), while positive correlations were observed with Pi (ρ = 0.257; p = 0.034) and ALP (ρ = 0.286; p = 0.018).
After adjustment for eGFR, the negative association between FGF23 and Glu-OC not only persisted but became stronger (partial ρ = -0.477; p < 0.001), indicating that the relationship between the two markers was not explained solely by kidney function. Following adjustment, FGF23 also showed a positive association with serum calcium (partial ρ = 0.283; p = 0.020) and a negative association with P1NP (partial ρ = −0.276; p = 0.024), whereas the other parameters examined showed no statistically significant independent associations.
Glu-OC correlated negatively with eGFR (ρ = −0.252; p = 0.038) and positively with serum creatinine (ρ = 0.272; p = 0.025). In addition, Glu-OC showed a positive correlation with P1NP (ρ = 0.382; p = 0.001) and a negative correlation with calcium (ρ = −0.405; p < 0.001). After adjustment for eGFR, these associations persisted for P1NP (partial ρ = 0.312; p = 0.010) and calcium (partial ρ = -0.395; p = 0.001), while the association with FGF23 remained the strongest (partial ρ = -0.477; p < 0.001).
Overall, correlation analysis demonstrated a strong negative association between FGF23 and Glu-OC that was independent of eGFR. Glu-OC was also independently associated with P1NP and serum calcium, while FGF23 showed an independent positive association with calcium. These findings suggest interrelationships among FGF23, Glu-OC, and calcium regulation that cannot be explained solely by declining kidney function.
To investigate whether the relationship between FGF23 and Glu-OC varied according to the degree of kidney dysfunction, a stratified correlation analysis was performed across eGFR categories (Table 3).
No significant correlation between FGF23 and Glu-OC was observed in the control group (ρ = −0.086; p = 0.791).
In contrast to controls, patients with CKD showed significant negative correlations between FGF23 and Glu-OC in CKD G1 (ρ = −0.768; p < 0.001), CKD G2 (ρ = −0.511; p = 0.043), and CKD G3 (ρ = −0.541; p = 0.021). The association was strongest in CKD G1, while it remained moderate but statistically significant in G2 and G3. In CKD G4, the negative correlation was weaker (ρ = −0.366) and did not reach statistical significance (p = 0.163).
These results indicate that the negative relationship between FGF23 and Glu-OC is most pronounced in the early and intermediate stages of CKD and becomes weaker in advanced kidney dysfunction. Thus, the stratified analysis complements the overall correlation analysis and indicates that the strength of the association between FGF23 and Glu-OC varies according to CKD stage.
Figure 1.
Scatter plots showing linear regression analyses between serum parameters: (A) a positive correlation between alkaline phosphatase and FGF23 (R² = 0.186); (B) a negative correlation between Glu-OC and FGF23 (R² = 0.043); (C) a negative correlation between Glu-OC and total calcium (R² = 0.053); and (D) a positive correlation between Glu-OC and P1NP (R² = 0.059). Solid lines represent the fitted regression lines.
Figure 1.
Scatter plots showing linear regression analyses between serum parameters: (A) a positive correlation between alkaline phosphatase and FGF23 (R² = 0.186); (B) a negative correlation between Glu-OC and FGF23 (R² = 0.043); (C) a negative correlation between Glu-OC and total calcium (R² = 0.053); and (D) a positive correlation between Glu-OC and P1NP (R² = 0.059). Solid lines represent the fitted regression lines.
2.3. Multivariable Linear Regression Analysis of the Reciprocal Association Between FGF23 and Glu-OC
To further investigate the relationship between FGF23 and Glu-OC while accounting for potential clinical and biochemical covariates, multivariable linear regression analysis with backward elimination was performed, with serum FGF23 concentration as the dependent variable (Table 4). The final model retained eGFR, ALP, and Glu-OC. The model was statistically significant (F(3.64) = 7.842; p < 0.001) and explained 26.9% of the variance in FGF23 concentrations (R² = 0.269; adjusted R² = 0.235).
ALP showed a significant positive association with FGF23 (β = 0.369; p = 0.001), whereas Glu-OC was significantly and negatively associated with FGF23 concentration (β = −0.258; p = 0.024). eGFR showed a negative association with FGF23 that approached statistical significance (β = −0.226; p = 0.053).
Thus, after adjustment for the other predictors in the final model, Glu-OC remained independently and negatively associated with FGF23, while ALP showed an independent positive association with FGF23. The association between eGFR and FGF23 was negative and approached statistical significance.
To assess the association in the reverse direction, a second multivariable linear regression model with backward elimination was fitted, with Glu-OC concentration as the dependent variable (Table 5). The final model was statistically significant (F(3.64) = 6.409; p = 0.001) and explained 23.1% of the variance in Glu-OC concentrations (R² = 0.231; adjusted R² = 0.195). Age showed a significant positive association with Glu-OC (β = 0.353; p = 0.003), whereas serum calcium (β = −0.366; p = 0.002) and FGF23 (β = −0.266; p = 0.020) were independently and negatively associated with Glu-OC concentrations.
In both complementary multivariable models, the negative association between FGF23 and Glu-OC persisted after adjustment for the other clinical and biochemical parameters examined. In the model with FGF23 as the dependent variable, Glu-OC was independently and negatively associated with FGF23 concentration (β = −0.258; p = 0.024), while ALP showed a significant positive association with FGF23 (β = 0.369; p = 0.001), and eGFR showed a negative association that approached statistical significance (β = −0.226; p = 0.053). In the reverse model, with Glu-OC as the dependent variable, FGF23 was also independently and negatively associated with Glu-OC concentrations (β = −0.266; p = 0.020), while serum calcium showed a significant negative association (β = −0.366; p = 0.002), and age showed a significant positive association (β = 0.353; p = 0.003).
3. Discussion
3.1. FGF23, Renal Function and Bone Turnover
The present study demonstrates that serum FGF23 is associated with kidney function and markers of bone metabolism in patients with non-dialysis chronic kidney disease (CKD). FGF23 correlated negatively with eGFR and positively with serum creatinine (Table 2), consistent with the progressive activation of FGF23-related regulatory mechanisms as kidney function declines [32]. Although the increase in FGF23 across CKD stages was not linear (Table 1), its overall association with kidney function supports its role as a component of the adaptive response to disturbances in mineral homeostasis in CKD [32,33].
Of particular interest is the positive association between FGF23 and ALP, which remained statistically significant after accounting for the other factors examined in the multivariable model. ALP showed the strongest standardized association with FGF23 (β = 0.369, p = 0.001) (Table 4). This finding supports the concept that FGF23 should be viewed not solely as a regulator of phosphate metabolism but also as part of a broader functional relationship linking kidney function, bone turnover, and mineral regulation [33,34]. An association between elevated serum FGF23 levels and increased bone turnover has also been reported in bone biopsy study in patients receiving dialysis [34], although these findings are not directly equivalent to those in non-dialysis CKD. Nevertheless, owing to the cross-sectional design, the present data cannot establish whether increased bone turnover contributes to higher FGF23 concentrations, whether FGF23 influences bone cell activity, or whether the observed association reflects the interplay between these processes.
3.2. Independent Inverse Association Between FGF23 and Glu-OC
The main finding of the present study is the inverse association between FGF23 and Glu-OC. In the overall cohort, FGF23 correlated negatively with Glu-OC (ρ = −0.344, p = 0.004), and this association became substantially stronger after adjustment for eGFR (partial ρ = -0.477, p < 0.001) (Table 2). In addition, in the multivariable regression model with FGF23 as the dependent variable, Glu-OC remained independently and inversely associated with FGF23 concentrations (β = −0.258; p = 0.024) (Table 4). The association between the two markers was also confirmed in the second regression model, with Glu-OC as the dependent variable (β = −0.266, p = 0.020) (Table 5). Thus, both complementary models showed a consistent independent negative association between FGF23 and Glu-OC, alongside the association observed after adjustment for kidney function.
This finding is particularly relevant because it indicates that the observed relationship between FGF23 and Glu-OC is not explained solely by reduced kidney function. In other words, eGFR does not appear to be the only factor linking these two biomarkers. The findings support the possibility of an additional biological relationship between FGF23 signaling and osteocalcin metabolism in the context of CKD-MBD.
This interpretation is biologically plausible, as FGF23 is produced primarily by cells of the osteoblast/osteocyte lineage and participates in the regulation of mineral metabolism and bone cell function [33,35]. Experimental evidence suggests that FGF23 signaling may modify the differentiation and functional state of osteoblast-lineage cells [33,36]. However, our findings in humans do not directly demonstrate that FGF23 suppresses osteocalcin production, carboxylation, or decarboxylation. A more appropriate interpretation is that higher FGF23 concentrations are independently associated with lower Glu-OC concentrations and that this relationship may reflect changes in osteoblast/osteocyte lineage function.
Interestingly, the association between FGF23 and Glu-OC persisted and became stronger after adjustment for eGFR (Table 2). Such a pattern may arise when kidney function is a common factor influencing both markers, while an additional biological relationship exists between FGF23 and Glu-OC. This finding suggests that Glu-OC may be a potential marker reflecting not only the degree of kidney dysfunction but also changes in bone and mineral regulation.
3.3. Stage-Dependent Relationship Between FGF23 and Glu-OC
The stage-stratified analysis provides additional insight into the nature of this association. Significant inverse correlations between FGF23 and Glu-OC were observed in CKD G1 (ρ = −0.768, p < 0.001), G2 (ρ = −0.511, p = 0.043), and G3 (ρ = −0.541, p = 0.021) (Table 3). These findings suggest that the relationship between FGF23 and Glu-OC may be particularly pronounced in the early and intermediate stages of CKD.
In G4, the correlation remained negative but did not reach statistical significance (ρ = −0.366, p = 0.163) (Table 3). This finding should not automatically be interpreted as evidence that the biological relationship between FGF23 and Glu-OC is absent in advanced CKD. Rather, several additional factors may come into play at this stage, including more pronounced disturbances in calcium–phosphate homeostasis, changes in PTH and vitamin D, varying levels of bone turnover, and greater individual heterogeneity in the CKD-MBD phenotype [37]. Furthermore, the relatively small number of participants in each stage group limits the statistical power of the stage-specific analyses.
Thus, the data are more consistent with the hypothesis that the strength and determinants of the FGF23–Glu-OC association may change as CKD progresses than with a definitive loss of this relationship in G4. Larger longitudinal studies are needed to establish whether this pattern reflects true biological changes.
3.4. Glu-OC, Calcium, and Bone Formation
Another important finding is the independent inverse association between total serum calcium and Glu-OC. Glu-OC correlated negatively with calcium (ρ = −0.405, p < 0.001), and this relationship remained significant after adjustment for eGFR (partial ρ = -0.395, p = 0.001) (Table 2). In the multivariable model, calcium also remained an independent predictor of Glu-OC (β = −0.366, p = 0.002) (Table 5).
This observation is of interest in the context of progressive CKD-MBD, in which declining eGFR is accompanied by changes in calcium-phosphate homeostasis and vitamin D–PTH regulation [37]. In the present cohort, lower calcium concentrations in more advanced CKD were accompanied by higher Glu-OC concentrations. However, this relationship should not be interpreted as evidence that serum calcium directly controls osteocalcin carboxylation.
The observed association may reflect a more complex interplay among mineral availability, bone mineralization, the interaction of osteocalcin with bone mineral, and osteoblast-lineage cell activity. An additional consideration is that the present study measured total calcium rather than ionized or albumin-adjusted calcium. Therefore, the specific mechanism linking calcium status to Glu-OC remains undetermined and requires investigation in future studies.
At the same time, the positive relationship between Glu-OC and P1NP (ρ = 0.382, p = 0.001) (Table 2) supports a link between Glu-OC and osteoblast-lineage cell activity. P1NP is a marker of type I collagen synthesis and bone formation [38], while osteocalcin is synthesized by osteoblasts [6]. The persistence of this association after adjustment (partial ρ = 0.312, p = 0.010) further supports the possibility that variations in Glu-OC in CKD are related, at least in part, to alterations in bone metabolism rather than being explained solely by kidney function.
3.5. FGF23, Calcium, and Glu-OC: A Potential Integrated Axis
Taken together, the findings suggest a functional relationship among kidney function, mineral homeostasis, FGF23, and osteocalcin metabolism. On the one hand, CKD progression is associated with increased FGF23 concentrations and changes in calcium–phosphate regulation. On the other hand, both FGF23 and calcium show independent associations with Glu-OC (Table 2 and Table 5).
To integrate these findings within the broader context of CKD-MBD, a conceptual framework is proposed to illustrate the potential relationships among kidney function, mineral homeostasis, FGF23, calcium, and Glu-OC (Figure 2).
This model does not imply a unidirectional causal chain. Rather, it highlights the possibility that Glu-OC lies at the intersection of several interconnected regulatory mechanisms in CKD-MBD [33,36,37].
Of particular interest is that FGF23 and calcium are independently associated with Glu-OC, yet their concentrations change in opposite directions as CKD progresses. This may explain why the relationship between kidney function and Glu-OC is nonlinear and why Glu-OC concentrations do not simply increase or decrease progressively with advancing CKD stage (Table 1). Instead, Glu-OC may reflect the combined effects of renal, mineral, and bone regulatory mechanisms.
3.6. Role of α-Klotho
The absence of significant differences in circulating α-Klotho across the study groups and the lack of a significant correlation between α-Klotho and either FGF23 or Glu-OC (Table 1 and Table 2) do not exclude the involvement of Klotho-dependent signaling in the processes observed. Circulating soluble α-Klotho is not a direct equivalent of membrane-bound Klotho in target tissues and may be influenced by various biological and analytical factors [33,39].
Therefore, the absence of a statistical association between serum α-Klotho and the parameters examined should be interpreted as a lack of a demonstrated relationship in the present cohort, rather than as evidence that Klotho-dependent mechanisms are absent. Larger studies incorporating measures of tissue expression or functional indices of Klotho signaling could help clarify this relationship.
3.7. Potential Biological and Clinical Significance
These findings have potential implications for understanding CKD-MBD, as they indicate that changes in bone metabolism may be associated with FGF23 independently of the degree of kidney dysfunction. This broadens the traditional view of FGF23 as primarily a phosphate-regulating hormone and places its relationship with bone cell function in a wider context [33].
Glu-OC is also of interest because of its proposed extraskeletal effects. Osteocalcin has been described as a potentially active endocrine mediator that may participate in the regulation of glucose and energy metabolism [12,40,41]. However, the present study did not include direct metabolic endpoints and therefore cannot establish whether changes in Glu-OC have functional implications for insulin sensitivity or glucose metabolism in CKD.
From a clinical perspective, the findings suggest that simultaneous assessment of FGF23 and Glu-OC may provide additional information about the interplay between kidney dysfunction and bone and mineral metabolism. However, this possibility requires evaluation in larger cohorts and longitudinal studies to determine whether these biomarkers provide additional diagnostic or prognostic value beyond eGFR and standard CKD-MBD parameters.
3.8. Strengths and Limitations
A major strength of this study is the simultaneous assessment of FGF23, Glu-OC, Gla-OC, P1NP, CTX1, ALP, PTH, calcium, phosphate, total 25(OH)D, and α-Klotho in a well-defined group of patients with non-dialysis CKD stages G1–G4. This enabled examination of the FGF23–Glu-OC relationship in the context of kidney function, mineral homeostasis, and bone turnover.
An additional strength is the use of partial correlation analyses and multivariable regression. Of particular relevance, the inverse association between FGF23 and Glu-OC persisted after adjustment for eGFR (Table 2), reducing the likelihood that the finding merely reflects kidney dysfunction.
The study also has several limitations. First, its cross-sectional design precludes establishing temporal sequence or causal relationships. Therefore, the findings should be interpreted as associations, and the proposed mechanisms as biological hypotheses.
Second, the sample size was relatively small, particularly for the stage-specific analyses. This likely limits statistical power and may contribute to the lack of statistical significance in G4.
Third, no direct assessments of bone histomorphometry, bone mineral density, or tissue expression of FGF23/Klotho were performed. Consequently, it is not possible to determine directly whether the observed serum associations reflect specific changes in bone tissue.
Fourth, the use of total serum calcium rather than ionized or albumin-adjusted calcium limits the mechanistic interpretation of the inverse relationship between Ca and Glu-OC.
Finally, future studies should include larger independent cohorts, longitudinal follow-up, and direct measures of bone and mineral biology to determine whether the FGF23–Glu-OC association has independent clinical or prognostic value.
4. Materials and Methods
4.1. Study Population and Design
This cross-sectional study involved 80 adults aged 22–84 years. The study population consisted of 12 healthy controls and 68 patients with non-dialysis CKD stages G1–G4, according to the Kidney Disease: Improving Global Outcomes (KDIGO) criteria [42]. CKD stage was determined based on the estimated glomerular filtration rate (eGFR), calculated using the 2021 CKD-EPI creatinine equation and expressed in mL/min/1.73 m² [43]. Participants with acute kidney injury, CKD stage G5 or dialysis treatment, kidney transplantation, active liver disease, active inflammatory or infectious conditions, and clinically significant metabolic bone diseases were excluded.
4.2. Ethical Considerations
All participants provided written informed consent before enrollment. The study was conducted in accordance with the ethical principles for medical research outlined in the Declaration of Helsinki and was approved by the Research Ethics Committee of the Medical University–Pleven.
4.3. Blood Sample Collection and Serum Preparation
Venous blood samples were collected in the morning after an overnight fast. Samples were centrifuged at 2500 rpm for 10 min to obtain serum. Serum samples were processed and, when required, diluted according to the manufacturers’ instructions. All laboratory analyses were performed in a certified medical laboratory in accordance with standard operating procedures.
4.4. Routine Biochemical and Immunochemical Measurements
Serum creatinine (SCr), inorganic phosphate (Pi), and alkaline phosphatase (ALP) were measured using a Roche cobas c 311 clinical chemistry analyzer. Parathyroid hormone (PTH) and total 25-hydroxyvitamin D [25(OH)D] were measured using a Roche cobas e 411 analyzer with electrochemiluminescence immunoassay (ECLIA) technology (Roche Diagnostics, Mannheim, Germany).
4.5. ELISA Measurements
Serum concentrations of undercarboxylated osteocalcin (ucOC; Glu-OC), carboxylated osteocalcin (cOC; Gla-OC), fibroblast growth factor 23 (FGF23), procollagen type I N-terminal propeptide (P1NP), C-terminal telopeptide of type I collagen (CTX-I), and α-Klotho were determined using commercially available enzyme-linked immunosorbent assay (ELISA) kits according to the manufacturers’ instructions.
Glu-OC was measured using the Human Undercarboxylated Osteocalcin (ucOC) ELISA Kit (MyBioSource, San Diego, CA, USA; Cat. No. MBS700581), whereas Gla-OC was measured using the Human Carboxylated Osteocalcin ELISA Kit (MyBioSource; Cat. No. MBS753090). FGF23, P1NP, and CTX-I were measured using the Human FGF23 ELISA Kit (Cat. No. E-EL-H1116), Human P1NP ELISA Kit (Cat. No. E-EL-H0185), and Human CTX-I ELISA Kit (Cat. No. E-EL-H0835), respectively (Elabscience Bionovation Inc., Houston, TX, USA). Serum α-Klotho was measured using the Human KL (Klotho) ELISA Kit (Elabscience Bionovation Inc.; Cat. No. E-EL-H5451).
All assays were performed in accordance with the manufacturers’ protocols and standard laboratory procedures.
4.6. Statistical Analysis
Statistical analyses were performed using SPSS version 27.0 (SPSS, Inc., Chicago, IL, USA). Continuous variables were assessed for distributional normality using the Shapiro–Wilk test together with visual inspection of histograms and Q–Q plots. Normally distributed continuous variables are presented as mean ± standard deviation (SD), whereas non-normally distributed variables are reported as median and interquartile range (IQR). Categorical variables are presented as number and percentage. Between-group comparisons were performed using one-way analysis of variance (ANOVA) for normally distributed variables or the Kruskal–Wallis test for non-normally distributed variables, as appropriate. Categorical variables were compared using Pearson’s χ² test.
Associations between continuous variables were assessed using Spearman’s rank correlation coefficient (ρ). Partial Spearman correlation analyses adjusted for estimated glomerular filtration rate (eGFR) were performed to determine whether associations between FGF23 or Glu-OC and the investigated biochemical and bone turnover parameters persisted after accounting for kidney function. The association between FGF23 and Glu-OC was additionally examined separately in the control group and in each CKD stage group (G1–G4). Selected associations were illustrated using scatter plots with fitted simple linear regression lines and corresponding coefficients of determination (R²).
Two complementary multivariable linear regression models were performed using backward elimination. In the first model, serum FGF23 concentration was specified as the dependent variable, whereas in the second model, serum Glu-OC concentration was specified as the dependent variable. Both initial models included sex, age, eGFR, total serum calcium, inorganic phosphate, total 25-hydroxyvitamin D, alkaline phosphatase, P1NP, CTX1, hypertension, diabetes mellitus, vitamin D supplementation, and vitamin K2 supplementation. Glu-OC was additionally included as a candidate predictor in the FGF23 model, and FGF23 was included as a candidate predictor in the Glu-OC model. Hypertension, diabetes mellitus, vitamin D supplementation, and vitamin K2 supplementation were included as potential confounding variables in the initial multivariable models to assess and control for their potential influence. Calcium-containing preparations and phosphate binders were not included as potential confounding variables in the statistical models, as none of the participants received such therapy. Binary categorical variables were entered as indicator variables. Backward elimination was used to obtain the final models.
For the regression analyses, unstandardized regression coefficients (B), standard errors (SE), standardized regression coefficients (β), t-statistics, 95% confidence intervals (95% CI), and p-values were reported. Overall model significance was assessed using the F-test. Model fit was summarized using the coefficient of determination (R²), adjusted R², and standard error of the estimate.
All statistical tests were two-sided, and a p-value < 0.05 was considered statistically significant.
5. Conclusions
In the present study, FGF23 was independently and inversely associated with Glu-OC in patients with non-dialysis CKD. This association persisted after adjustment for eGFR and was supported by stage-specific analyses in CKD G1–G3. Lower serum calcium was also independently associated with higher Glu-OC concentrations, while the positive relationship between Glu-OC and P1NP supports its association with bone formation activity.
Taken together, these findings suggest that Glu-OC may be linked to the interplay among FGF23 signaling, mineral homeostasis, and osteoblast/osteocyte lineage function in CKD. Although the data do not establish a direct causal relationship, they support the hypothesis of an FGF23–Glu-OC axis within the broader pathophysiology of CKD-MBD.
Larger longitudinal and mechanistic studies are needed to determine whether this axis represents a biological association alone or has independent clinical relevance to the phenotyping and progression of CKD-MBD.
Author Contributions
Conceptualization, T.S., B.I. and K.K.; methodology, K.K., T.S. and B.I.; software, T.S. and B.I.; validation, K.K., T.S., B.I. and A.B.; formal analysis, T.S. and B.I.; investigation, T.S., B.I., K.K. and A.B.; resources, T.E., B.I. and A.B.; data curation, T.S., B.I. and T.E.; writing—original draft preparation, T.S., K.K., B.I. and T.E.; writing—review and editing, K.K., B.I. and T.S.; visualization, T.S., B.I. and K.K.; supervision, K.K.; project administration, T.S. All authors have read and agreed to the published version of the manuscript.
Funding
The APC was funded by Medical University-Pleven, Bulgaria.
Institutional Review Board Statement
The study was conducted in accordance with the Declaration of Helsinki, and approved by the Research Ethics Committee of Medical University - Pleven (protocol code 838 and date of approval 18 June 2025).
Informed Consent Statement
Informed consent was obtained from all subjects involved in the study.
Data Availability Statement
The original contributions presented in this study are included in the article. Further inquiries can be directed to the corresponding author.
Conflicts of Interest
The authors declare no conflict of interest.
Abbreviations
The following abbreviations are used in this manuscript:
| ALP | Alkaline Phosphatase |
| CKD | Chronic Kidney Disease |
| CKD-EPI | Chronic Kidney Disease Epidemiology Collaboration |
| CKD-MBD | Chronic Kidney Disease–Mineral and Bone Disorder |
| Ca | Calcium |
| CTX1 | Cross Linked C-Telopeptide of Type I Collagen |
| ECLIA | Electrochemiluminescence Immunoassay |
| eGFR | Estimating Glomerular Filtration Rate |
| FGF23 | Fibroblast Growth Factor 23 |
| Glu-OC | Undercarboxylated Osteocalcin |
| Gla-OC | Carboxylated Osteocalcin |
| KDIGO | Kidney Disease: Improving Global Outcomes |
| P1NP | Procollagen Type I N-Propeptide |
| P3NP | Procollagen Type III N-Propeptide |
| Pi | Inorganic Phosphate |
| PTH | Parathyroid Hormone |
| SCr | Serum Creatinine |
| Total 25(OH)D | Total 25-Hydroxyvitamin D |
References
- Haarhaus, M.; Aaltonen, L.; Cejka, D.; Cozzolino, M.; de Jong, R.T.; D’Haese, P.; Evenepoel, P.; Lafage-Proust, M.H.; Mazzaferro, S.; McCloskey, E.; et al. Management of Fracture Risk in CKD-Traditional and Novel Approaches. Clin. Kidney J. 2023, 16, 456–472. [Google Scholar] [CrossRef] [PubMed]
- Waziri, B.; Duarte, R.; Naicker, S. Chronic Kidney Disease–Mineral and Bone Disorder (CKD-MBD): Current Perspectives. Int. J. Nephrol. Renov. Dis. 2019, 12, 263–276. [Google Scholar] [CrossRef] [PubMed]
- Kanbay, M.; Aktas, O.; Copur, S.; Drueke, T.B.; Massy, Z.A. Mineral and Bone Disease in CKD and Kidney Transplantation: Controversies, Gaps, and a Path Forward. Kidney Int. Rep. 2026, 11, 106662. [Google Scholar] [CrossRef] [PubMed]
- Patel, P.; Hashmi, M.F. Chronic Kidney Disease-Mineral Bone Disorder (CKD-MBD) (updated 3 April 2024). In StatPearls; StatPearls Publishing: Treasure Island, FL, USA, 2026; early view; Available online: https://www.ncbi.nlm.nih.gov/books/NBK560742/ (accessed on 20 September 2026).
- Waitupu, A.; Pratiwi, L.; Sutanto, H.; Santoso, D.; Hertanto, D.M. Molecular Pathophysiology of Chronic Kidney Disease-Mineral and Bone Disorder: Focus on the Fibroblast Growth Factor 23-Klotho Axis and Bone Turnover Dynamics. Exp. Physiol. 2025. [Google Scholar] [CrossRef] [PubMed]
- Gundberg, C.M.; Lian, J.B.; Booth, S.L. Vitamin K-Dependent Carboxylation of Osteocalcin: Friend or Foe? Adv. Nutr. 2012, 3, 149–157. [Google Scholar] [CrossRef] [PubMed]
- Neve, A.; Corrado, A.; Cantatore, F.P. Osteocalcin: Skeletal and Extra-Skeletal Effects. J. Cell. Physiol. 2013, 228, 1149–1153. [Google Scholar] [CrossRef] [PubMed]
- Smith, C.; Lin, X.; Parker, L.; Yeap, B.B.; Hayes, A.; Levinger, I. The Role of Bone in Energy Metabolism: A Focus on Osteocalcin. Bone 2024, 188, 117238. [Google Scholar] [CrossRef] [PubMed]
- Karsenty, G. Osteocalcin: A Multifaceted Bone-Derived Hormone. Annu. Rev. Nutr. 2023, 43, 55–71. [Google Scholar] [CrossRef] [PubMed]
- Fuller, K.N.Z.; Bohne, E.M.; Mey, J.T.; Blackburn, B.K.; Miranda, V.R.; Varady, K.A.; Danielson, K.K.; Haus, J.M. Plasma Undercarboxylated Osteocalcin Dynamics with Glycemic Stress Reflects Insulin Sensitivity and Beta-Cell Function in Humans with and without T2DM. Metabol. Open 2023, 20, 100264. [Google Scholar] [CrossRef] [PubMed]
- Martiniakova, M.; Biro, R.; Kovacova, V.; Babikova, M.; Zemanova, N.; Mondockova, V.; Omelka, R. Current Knowledge of Bone-Derived Factor Osteocalcin: Its Role in the Management and Treatment of Diabetes Mellitus, Osteoporosis, Osteopetrosis and Inflammatory Joint Diseases. J. Mol. Med. 2024, 102, 435–452. [Google Scholar] [CrossRef] [PubMed]
- Booth, S.L.; Centi, A.; Smith, S.R.; Gundberg, C. The Role of Osteocalcin in Human Glucose Metabolism: Marker or Mediator? Nat. Rev. Endocrinol. 2013, 9, 43–55. [Google Scholar] [CrossRef] [PubMed]
- Wilson, R.; Mukherjee-Roy, N.; Gattineni, J. The Role of Fibroblast Growth Factor 23 in Regulation of Phosphate Balance. Pediatr. Nephrol. 2024, 39, 3439–3451. [Google Scholar] [CrossRef] [PubMed]
- Martínez-Heredia, L.; Canelo-Moreno, J.M.; García-Fontana, B.; Muñoz-Torres, M. Non-Classical Effects of FGF23: Molecular and Clinical Features. Int. J. Mol. Sci. 2024, 25, 4875. [Google Scholar] [CrossRef] [PubMed]
- Fukumoto, S. Regulation of FGF23 Production in Osteocytes. Curr. Osteoporos. Rep. 2024, 22, 273–279. [Google Scholar] [CrossRef] [PubMed]
- Vetrano, D.; De Pascalis, A.; Tomassetti, A.; Comai, G.; Di Nunzio, M.; Barbuto, S.; Sinagra, G.; La Manna, G.; Cianciolo, G. Fibroblast Growth Factor 23 and Mortality, Heart Failure and Cardiovascular Events across the Chronic Kidney Disease Spectrum - A Systematic Review and Meta-Analysis. Eur. J. Intern. Med. 2026, 106987. [Google Scholar] [CrossRef] [PubMed]
- Vervloet, M.G. FGF23 Measurement in Chronic Kidney Disease: What Is It Really Reflecting? Clin. Chim. Acta 2020, 505, 160–166. [Google Scholar] [CrossRef] [PubMed]
- Han, Y.; You, X.; Xing, W.; Zhang, Z.; Zou, W. Paracrine and Endocrine Actions of Bone - The Functions of Secretory Proteins from Osteoblasts, Osteocytes, and Osteoclasts. Bone Res. 2018, 6, 16. [Google Scholar] [CrossRef] [PubMed]
- Delgado-Calle, J.; Bellido, T. The Osteocyte as a Signaling Cell. Physiol. Rev. 2022, 102, 379–410. [Google Scholar] [CrossRef] [PubMed]
- Carrillo-López, N.; Panizo, S.; Alonso-Montes, C.; Román-García, P.; Rodríguez, I.; Martínez-Salgado, C.; Dusso, A.S.; Naves, M.; Cannata-Andía, J.B. Direct Inhibition of Osteoblastic Wnt Pathway by Fibroblast Growth Factor 23 Contributes to Bone Loss in Chronic Kidney Disease. Kidney Int. 2016, 90, 77–89. [Google Scholar] [CrossRef] [PubMed]
- Pereira, R.C.; Salusky, I.B.; Bowen, R.E.; Freymiller, E.G.; Wesseling-Perry, K. Vitamin D Sterols Increase FGF23 Expression by Stimulating Osteoblast and Osteocyte Maturation in CKD Bone. Bone 2019, 127, 626–634. [Google Scholar] [CrossRef] [PubMed]
- Yashiro, M.; Ohya, M.; Mima, T.; Nakashima, Y.; Kawakami, K.; Yamamoto, S.; Kobayashi, S.; Yano, T.; Tanaka, Y.; Sonou, T.; et al. Active Vitamin D and Vitamin D Analogs Stimulate Fibroblast Growth Factor 23 Production in Osteocyte-like Cells via the Vitamin D Receptor. J. Pharm. Biomed. Anal. 2020, 182, 113139. [Google Scholar] [CrossRef] [PubMed]
- Agoro, R.; White, K.E. Regulation of FGF23 Production and Phosphate Metabolism by Bone-Kidney Interactions. Nat. Rev. Nephrol. 2023, 19, 185–193. [Google Scholar] [CrossRef] [PubMed]
- Kratz, M.; Zelnick, L.R.; Trenchevska, O.; Jeffs, J.W.; Borges, C.R.; Tseng, H.H.; Booth, S.L.; Kestenbaum, B.R.; Utzschneider, K.M.; de Boer, I.H. Relationship Between Chronic Kidney Disease, Glucose Homeostasis, and Plasma Osteocalcin Carboxylation and Fragmentation. J. Ren. Nutr. 2021, 31, 248–256. [Google Scholar] [CrossRef] [PubMed]
- Fusaro, M.; Pereira, L.; Bover, J. Current and Emerging Markers and Tools Used in the Diagnosis and Management of Chronic Kidney Disease-Mineral and Bone Disorder in Non-Dialysis Adult Patients. J. Clin. Med. 2023, 12, 6306. [Google Scholar] [CrossRef] [PubMed]
- Pazianas, M.; Miller, P.D. Current Understanding of Mineral and Bone Disorders of Chronic Kidney Disease and the Scientific Grounds on the Use of Exogenous Parathyroid Hormone in Its Management. J. Bone Metab. 2020, 27, 1–13. [Google Scholar] [CrossRef] [PubMed]
- Cannata-Andía, J.B.; Martín-Carro, B.; Martín-Vírgala, J.; Rodríguez-Carrio, J.; Bande-Fernández, J.J.; Alonso-Montes, C.; Carrillo-López, N. Chronic Kidney Disease-Mineral and Bone Disorders: Pathogenesis and Management. Calcif. Tissue Int. 2021, 108, 410–422. [Google Scholar] [CrossRef] [PubMed]
- Li, J.; Zhang, H.; Yang, C.; Li, Y.; Dai, Z. An Overview of Osteocalcin Progress. J. Bone Miner. Metab. 2016, 34, 367–379. [Google Scholar] [CrossRef] [PubMed]
- Sharma, S.; Katz, R.; Ginsberg, C.; Bullen, A.; Vallon, V.; Thomson, S.; Moe, O.W.; Hoofnagle, A.N.; de Leeuw, P.W.; Kroon, A.A.; et al. Renal Clearance of Fibroblast Growth Factor-23 (FGF23) and Its Fragments in Humans. J. Bone Miner. Res. 2022, 37, 1170–1178. [Google Scholar] [CrossRef] [PubMed]
- Sharma, S.; Ix, J.H. Kidney Clearance of Fibroblast Growth Factor-23 in Humans. Curr. Opin. Nephrol. Hypertens. 2023, 32, 330–334. [Google Scholar] [CrossRef] [PubMed]
- Mazzaferro, S.; Cianciolo, G.; De Pascalis, A.; Guglielmo, C.; Urena Torres, P.A.; Bover, J.; Tartaglione, L.; Pasquali, M.; La Manna, G. Bone, Inflammation and the Bone Marrow Niche in Chronic Kidney Disease: What Do We Know? Nephrol. Dial. Transplant. 2018, 33, 2092–2100. [Google Scholar] [CrossRef] [PubMed]
- Isakova, T.; Wahl, P.; Vargas, G.S.; Gutiérrez, O.M.; Scialla, J.; Xie, H.; Appleby, D.; Nessel, L.; Bellovich, K.; Chen, J.; et al. Fibroblast Growth Factor 23 Is Elevated before Parathyroid Hormone and Phosphate in Chronic Kidney Disease. Kidney Int. 2011, 79, 1370–1378. [Google Scholar] [CrossRef] [PubMed]
- Martin, A.; David, V.; Quarles, L.D. Regulation and Function of the FGF23/Klotho Endocrine Pathways. Physiol. Rev. 2012, 92, 131–155. [Google Scholar] [CrossRef] [PubMed]
- Lima, F.; El-Husseini, A.; Monier-Faugere, M.C.; David, V.; Mawad, H.; Quarles, D.; Malluche, H.H. FGF-23 Serum Levels and Bone Histomorphometric Results in Adult Patients with Chronic Kidney Disease on Dialysis. Clin. Nephrol. 2014, 82, 287–295. [Google Scholar] [CrossRef] [PubMed]
- Feng, J.Q.; Ward, L.M.; Liu, S.; Lu, Y.; Xie, Y.; Yuan, B.; Yu, X.; Rauch, F.; Davis, S.I.; Zhang, S.; et al. Loss of DMP1 Causes Rickets and Osteomalacia and Identifies a Role for Osteocytes in Mineral Metabolism. Nat. Genet. 2006, 38, 1310–1315. [Google Scholar] [CrossRef] [PubMed]
- Wang, H.; Yoshiko, Y.; Yamamoto, R.; Minamizaki, T.; Kozai, K.; Tanne, K.; Aubin, J.E.; Maeda, N. Overexpression of Fibroblast Growth Factor 23 Suppresses Osteoblast Differentiation and Matrix Mineralization in Vitro. J. Bone Miner. Res. 2008, 23, 939–948. [Google Scholar] [CrossRef] [PubMed]
- Ketteler, M.; Block, G.A.; Evenepoel, P.; Fukagawa, M.; Herzog, C.A.; McCann, L.; Moe, S.M.; Shroff, R.; Tonelli, M.A.; Toussaint, N.D.; et al. Executive Summary of the 2017 KDIGO Chronic Kidney Disease–Mineral and Bone Disorder (CKD-MBD) Guideline Update: What’s Changed and Why It Matters. Kidney Int. 2017, 92, 26–36. [Google Scholar] [CrossRef] [PubMed]
- Vasikaran, S.; Eastell, R.; Bruyère, O.; Foldes, A.J.; Garnero, P.; Griesmacher, A.; McClung, M.; Morris, H.A.; Silverman, S.; Trenti, T.; et al. Markers of Bone Turnover for the Prediction of Fracture Risk and Monitoring of Osteoporosis Treatment: A Need for International Reference Standards. Osteoporos. Int. 2011, 22, 391–420. [Google Scholar] [CrossRef] [PubMed]
- Neyra, J.A.; Moe, O.W.; Pastor, J.; Gianella, F.; Sidhu, S.S.; Sarnak, M.J.; Ix, J.H.; Drew, D.A. Performance of Soluble Klotho Assays in Clinical Samples of Kidney Disease. Clin. Kidney J. 2020, 13, 235–244. [Google Scholar] [CrossRef] [PubMed]
- Lee, N.K.; Sowa, H.; Hinoi, E.; Ferron, M.; Ahn, J.D.; Confavreux, C.; Dacquin, R.; Mee, P.J.; McKee, M.D.; Jung, D.Y.; et al. Endocrine Regulation of Energy Metabolism by the Skeleton. Cell 2007, 130, 456–469. [Google Scholar] [CrossRef] [PubMed]
- Lin, X.; Brennan-Speranza, T.C.; Levinger, I.; Yeap, B.B. Undercarboxylated Osteocalcin: Experimental and Human Evidence for a Role in Glucose Homeostasis and Muscle Regulation of Insulin Sensitivity. Nutrients 2018, 10, 847. [Google Scholar] [CrossRef] [PubMed]
- Kidney Disease: Improving Global Outcomes (KDIGO) CKD Work Group. KDIGO 2024 Clinical Practice Guideline for the Evaluation and Management of Chronic Kidney Disease. Kidney Int. 2024, 105 (Suppl. 4S), S117–S314. [CrossRef] [PubMed]
- Inker, L.A.; Eneanya, N.D.; Coresh, J.; Tighiouart, H.; Wang, D.; Sang, Y.; Crews, D.C.; Doria, A.; Estrella, M.M.; Froissart, M.; et al. New Creatinine- and Cystatin C-Based Equations to Estimate GFR without Race. N. Engl. J. Med. 2021, 385, 1737–1749. [Google Scholar] [CrossRef] [PubMed]
Figure 2.
Proposed conceptual framework linking kidney function, mineral homeostasis, FGF23, calcium, and Glu-OC in CKD-MBD. The framework summarizes the observed associations and their potential biological interrelationships. It is hypothesis-generating and does not imply a unidirectional causal pathway or establish causality.
Figure 2.
Proposed conceptual framework linking kidney function, mineral homeostasis, FGF23, calcium, and Glu-OC in CKD-MBD. The framework summarizes the observed associations and their potential biological interrelationships. It is hypothesis-generating and does not imply a unidirectional causal pathway or establish causality.
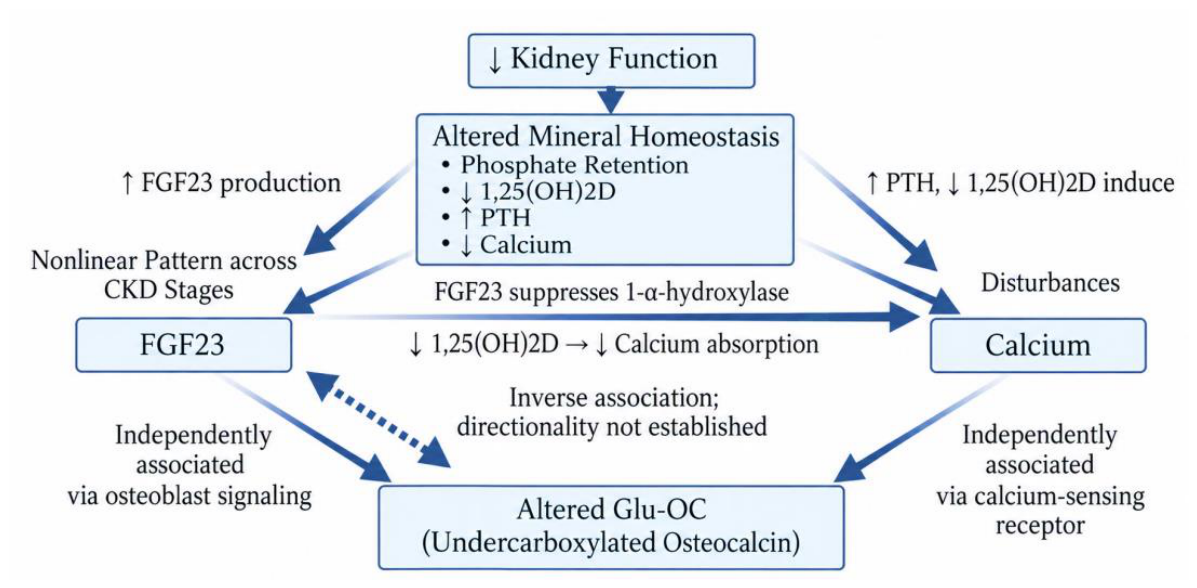

Table 1.
Descriptive summary of patient variables and biochemical parameters for each study group.
| Parameters |
Controls (n = 12) |
CKD G1 (n = 18) |
CKD G2 (n = 16) |
CKD G3 (n = 18) |
CKD G4 (n = 16) |
p-Value |
| Women, n (%) | 8 (66.7%) | 13 (72.2%) | 6 (37.5%) | 9 (50.0%) | 6 (37.5%) | 0.152 |
| Age (years) 1 | 51.17±10.49 | 56.39±13.74 | 65.19±9.07 | 67.39±9.14 | 64.44±13.23 | < 0.001* |
| eGFR (mL/min/1.73 m²) 2 | 103.00 (93.00–117.00) | 96.50 (91.00–111.75) | 69.50 (63.00–77.75) | 44.50 (34.75–48.50) | 16.50 (15.00–20.75) | < 0.001* |
| SCr (µmol/L) 2 | 78.50 (71.00–87.00) | 61.00 (55.25–74.00) | 94.00 (86.50–103.50) | 142.00 (109.00–159.50) | 284.50 (250.25–432.00) | < 0.001* |
| Ca (mmol/L) 1 | 2,50 ± 0,09 | 2,38 ± 0,09 | 2,38 ± 0,08 | 2,37 ± 0,12 | 2,31 ± 0,19 | 0.004* |
| Pi (mmol/L) 2 | 1.18 (1.16–1.26) | 1.02 (0.97–1.18) | 1.18 (1.08–1.32) | 1.11 (1.03–1.27) | 1.52 (1.23–1.69) | < 0.001* |
| ALP (U/L) 2 | 60.00 (44.00–74.00) | 73.00 (67.75–95.00) | 71.00 (55.50–85.75) | 79.00 (69.75–100.75) | 93.50 (67.25–121.75) | 0.012* |
| PTH (pg/mL) 2 | 26.30 (24.09– 29.80) | 18.85 (11.34– 49.82) | 25.95 (19–43.48) | 42.28 (31.61– 54.18) | 110.35 (32.19– 170.1) | < 0.001* |
| Total 25(OH)D (nmol/L)2 | 53.55 (48.60–59.50) | 60.7 (51.49–68.35) | 50.12 (35.20–69.76) | 44.1 (33.33–62.62) | 35.85 (30.08–41.83) | 0.001* |
| Glu-OC (ng/mL) 2 | 0.59 (0.32–4.48) | 2.93 (0.85–6.30) | 3.15 (0.76–6.18) | 5.22 (1.86–6.96) | 4.01 (2.78–6.67) | 0.033* |
| Gla-OC (ng/mL) 1 | 3.51±0.33 | 3.10±0.33 | 3.56±0.53 | 3.36±0.39 | 3.35±0.54 | 0.035* |
| FGF23 (pg/mL) 2 | 182.87 (125.00–215.93) | 83.40 (63.32–130.92) | 184.80 (108.74–248.06) | 178.67 (74.62–289.20) | 208.65 (120.94 – 265.44) | 0.023* |
| α-Klotho (ng/mL) 2 | 21.77 (6.90–25.55) | 20.95 (14.29–30.25) | 19.80 (14.80–24.07) | 23.68 (14.64–29.75) | 25.95 (9.78–41.01) | 0.722 |
| P1NP (pg/mL) 2 | 2487 (1928–3784) | 2666 (1649–3428) | 2783 (2329–4865) | 4187 (3171–6226) | 5450 (4924–12389) | < 0.001* |
| CTX1 (ng/mL) 2 | 1.86 (1.34–2.70) | 1.39 (1.16– 1.69) | 1.15 (1.00–1.54) | 1.95 (1.30–2.15) | 1.63 (1.25–2.66) | 0.033* |
Data are presented as mean (SD)¹ or median (IQR)², as appropriate. Abbreviations: eGFR, estimating glomerular filtration rate; SCr, serum creatinine; Ca, calcium; Pi, inorganic phosphate; ALP, alkaline phosphatase; PTH, parathyroid hormone; Total 25(OH)D, total 25-hydroxyvitamin D; Glu-OC, undercarboxylated osteocalcin; Gla-OC, carboxylated osteocalcin; FGF23, fibroblast growth factor 23; P1NP, procollagen type I N-propeptide; P3NP, procollagen type III N-propeptide; CTX1, cross linked C-telopeptide of type I collagen. Comparisons were performed using one-way ANOVA¹ or Kruskal–Wallis test²; categorical variables were compared using Pearson’s χ² test. *p < 0.05, statistically significant.
Table 2.
Spearman correlations of FGF23 and Glu-OC with renal, mineral metabolism, and bone turnover parameters in patients with CKD (n = 68), with partial correlations adjusted for eGFR.
Table 2.
Spearman correlations of FGF23 and Glu-OC with renal, mineral metabolism, and bone turnover parameters in patients with CKD (n = 68), with partial correlations adjusted for eGFR.
| Correlations of FGF23 | ||||
| Variable | Spearman ρ | p-Value | Partial ρ adjusted for eGFR | p-Value |
| eGFR | −0.346 | 0.004* | – | – |
| SCr | 0.299 | 0.013* | – | – |
| Glu-OC | −0.344 | 0.004* | -0.477 | < 0.001* |
| P1NP | 0.052 | 0.671 | -0.276 | 0.024* |
| PTH | 0.186 | 0.130 | -0.007 | 0.956 |
| Pi | 0.257 | 0.034* | 0.087 | 0.481 |
| Ca | 0.194 | 0.112 | 0.283 | 0.020* |
| Total 25(OH)D | −0.149 | 0.226 | 0.001 | 0.995 |
| α-Klotho | −0.074 | 0.550 | -0.103 | 0.409 |
| CTX1 | 0.103 | 0.401 | 0.046 | 0.712 |
| ALP | 0.286 | 0.018* | 0.233 | 0.058 |
| Correlations of Glu-OC | ||||
| eGFR | −0.252 | 0.038* | – | – |
| SCr | 0.272 | 0.025* | – | – |
| FGF23 | −0.344 | 0.004* | -0.477 | < 0.001* |
| P1NP | 0.382 | 0.001* | 0.312 | 0.010* |
| PTH | 0.180 | 0.143 | 0.038 | 0.757 |
| Pi | 0.134 | 0.276 | -0.012 | 0.926 |
| Ca | −0.405 | < 0.001* | -0.395 | 0.001* |
| Total 25(OH)D | −0.093 | 0.452 | 0.025 | 0.839 |
| α-Klotho | −0.013 | 0.917 | -0.039 | 0.757 |
| CTX1 | −0.159 | 0.195 | -0.199 | 0.107 |
| ALP | −0.067 | 0.585 | -0.134 | 0.278 |
Spearman’s rank correlation coefficient (ρ) was used to assess the associations between FGF23 or Glu-OC and the investigated parameters. Partial Spearman correlation coefficients (partial ρ) were calculated to assess the associations between FGF23 or Glu-OC and the investigated parameters after adjustment for estimated glomerular filtration rate (eGFR). eGFR, estimated glomerular filtration rate; SCr, serum creatinine; Glu-OC, undercarboxylated osteocalcin; P1NP, procollagen type 1 N-terminal propeptide; PTH, parathyroid hormone; Pi, serum phosphate; Ca, serum calcium; Total 25(OH)D, total 25-hydroxyvitamin D; α-Klotho, alpha-Klotho; CTX1, C-terminal telopeptide of type I collagen; ALP, alkaline phosphatase. *p < 0.05, statistically significant.
Table 3.
Spearman correlation between FGF23 and Glu-OC across different eGFR categories in patients with CKD (n = 68).
Table 3.
Spearman correlation between FGF23 and Glu-OC across different eGFR categories in patients with CKD (n = 68).
| Groups | Correlations | Spearman‘s rho | p-Value |
| Controls | FGF23 / Glu-OC | –0.086 | 0.791 |
| Group G1 | FGF23 / Glu-OC | –0.768 | < 0.001* |
| Group G2 | FGF23 / Glu-OC | –0.511 | 0.043* |
| Group G3 | FGF23 / Glu-OC | –0.541 | 0.021* |
| Group G4 | FGF23 / Glu-OC | –0.366 | 0.163 |
The strength and direction of the association between FGF23 and Glu-OC were assessed using Spearman’s rank correlation coefficient (ρ) within each study group. eGFR categories were defined according to estimated glomerular filtration rate: G1, ≥90 mL/min/1.73 m²; G2, 60–89 mL/min/1.73 m²; G3, 30–59 mL/min/1.73 m²; and G4, 15–29 mL/min/1.73 m²; FGF23, fibroblast growth factor 23; Glu-OC, undercarboxylated osteocalcin; eGFR, estimated glomerular filtration rate. *p < 0.05, statistically significant.
Table 4.
Multivariable linear regression analysis of factors associated with serum FGF23 concentrations in patients with CKD (n = 68): initial and final models.
Table 4.
Multivariable linear regression analysis of factors associated with serum FGF23 concentrations in patients with CKD (n = 68): initial and final models.
| Model | Unstandardized Coefficients | Standardized Coefficients | t | Sig. | 95,0% Confidence Interval for B | |||
| B | Std. Error | Beta | Lower Bound | Upper Bound | ||||
| 1 | (Constant) | 192.314 | 824.260 | – | 0.233 | 0.816 | -1460.942 | 1845.569 |
| Gender | -40.102 | 75.106 | -0.074 | -0.534 | 0.596 | -190.745 | 110.541 | |
| Years | 0.490 | 3.750 | 0.022 | 0.131 | 0.897 | -7.032 | 8.011 | |
| eGFR (mL/min/1.73 m²) | -2.238 | 1.572 | -0.269 | -1.424 | 0.160 | -5.391 | 0.914 | |
| Ca (mmol/L) | 54.545 | 332.548 | 0.026 | 0.164 | 0.870 | -612.463 | 721.552 | |
| Pi (mmol/L) | -81.370 | 149.480 | -0.092 | -0.544 | 0.588 | -381.188 | 218.448 | |
| Total 25(OH)D (nmol/L) | 1.120 | 1.047 | 0.142 | 1.070 | 0.290 | -0.980 | 3.219 | |
| ALP (U/L) | 1.865 | 0.702 | 0.430 | 2.656 | 0.010* | 0.456 | 3.274 | |
| Glu-OC (ng/mL) | -17.231 | 8.905 | -0.259 | -1.935 | 0.058 | -35.093 | 0.630 | |
| P1NP (pg/ml) | -0.002 | 0.016 | -0.029 | -0.151 | 0.880 | -0.034 | 0.029 | |
| CTX1 (ng/ml) | -0.015 | 14.080 | 0.000 | -0.001 | 0.999 | -28.256 | 28.227 | |
| Hypertension | -66.673 | 117.059 | -0.087 | -0.570 | 0.571 | -301.463 | 168.117 | |
| Diabetes mellitus | 44.544 | 78.553 | 0.076 | 0.567 | 0.573 | -113.013 | 202.101 | |
| Vit. D (suppl.) | 92.453 | 81.461 | 0.171 | 1.135 | 0.262 | -70.937 | 255.844 | |
| Vit. К2 (suppl.) | -66.468 | 83.271 | -0.110 | -0.798 | 0.428 | -233.489 | 100.554 | |
| 12 | (Constant) | 252.640 | 98.243 | – | 2.572 | 0.012* | 56.377 | 448.903 |
| eGFR | -1.884 | 0.957 | -0.226 | -1.970 | 0.053 | -3.795 | 0.027 | |
| ALP (U/L) | 1.600 | 0.481 | 0.369 | 3.329 | 0.001* | 0.640 | 2.560 | |
| Glu-OC (ng/mL) | -17.132 | 7.396 | -0.258 | -2.316 | 0.024* | -31.907 | -2.357 | |
Serum FGF23 concentration (pg/mL) was the dependent variable. Model 1 included all candidate predictors; Model 12 represents the final model obtained using backward elimination. Final model statistics: R = 0.518; R² = 0.269; adjusted R² = 0.235; standard error of the estimate = 238.52 pg/mL. B, unstandardized regression coefficient; SE, standard error of B; β, standardized regression coefficient; t, t-statistic; CI, confidence interval; eGFR, estimated glomerular filtration rate; Ca, total calcium; Pi, inorganic phosphate; Total 25(OH)D, total 25-hydroxyvitamin D; ALP, alkaline phosphatase; Glu-OC, undercarboxylated osteocalcin; P1NP, procollagen type I N-terminal propeptide; CTX1, C-terminal telopeptide of type I collagen; suppl., supplementation. *p < 0.05, statistically significant.
Table 5.
Multivariable linear regression analysis of factors associated with serum Glu-OC concentrations in patients with CKD (n = 68): initial and final models.
Table 5.
Multivariable linear regression analysis of factors associated with serum Glu-OC concentrations in patients with CKD (n = 68): initial and final models.
| Model | Unstandardized Coefficients | Standardized Coefficients | t | Sig. | 95,0% Confidence Interval for B | |||
| B | Std. Error | Beta | Lower Bound | Upper Bound | ||||
| 1 | (Constant) | 29.983 | 11.583 | – | 2.588 | 0.012* | 6.750 | 53.216 |
| Gender | 0.170 | 1.122 | 0.021 | 0.151 | 0.880 | -2.081 | 2.421 | |
| Years | 0.114 | 0.054 | 0.342 | 2.129 | 0.038* | 0.007 | 0.222 | |
| eGFR (mL/min/1.73 m²) | -0.024 | 0.024 | -0.192 | -1.018 | 0.313 | -0.071 | 0.023 | |
| Ca (mmol/L) | -12.182 | 4.668 | -0.385 | -2.610 | 0.012* | -21.544 | -2.820 | |
| Pi (mmol/L) | -0.923 | 2.231 | -0.069 | -0.414 | 0.681 | -5.397 | 3.552 | |
| Total 25(OH)D (nmol/L) | -0.007 | 0.016 | -0.057 | -0.431 | 0.668 | -0.038 | 0.025 | |
| ALP (U/L) | -0.007 | 0.011 | -0.108 | -0.636 | 0.527 | -0.029 | 0.015 | |
| FGF 23 (pg/ml) | -0.004 | 0.002 | -0.254 | -1.935 | 0.058 | -0.008 | 0.000 | |
| P1NP (pg/ml) | 0.000 | 0.000 | 0.136 | 0.722 | 0.473 | 0.000 | 0.001 | |
| CTX1 (ng/ml) | -0.013 | 0.210 | -0.009 | -0.062 | 0.951 | -0.434 | 0.408 | |
| Hypertension | 2.204 | 1.724 | 0.192 | 1.278 | 0.207 | -1.254 | 5.661 | |
| Diabetes mellitus | -1.184 | 1.163 | -0.134 | -1.018 | 0.313 | -3.517 | 1.149 | |
| Vit. D (suppl.) | 1.129 | 1.219 | 0.139 | 0.926 | 0.359 | -1.316 | 3.574 | |
| Vit. К2 (suppl.) | -1.927 | 1.220 | -0.212 | -1.579 | 0.120 | -4.375 | 0.521 | |
| 12 | (Constant) | 25.122 | 8.378 | – | 2.998 | 0.004* | 8.385 | 41.860 |
| Years | 0.118 | 0.038 | 0.353 | 3.105 | 0.003* | 0.042 | 0.194 | |
| Ca (mmol/L) | -11.565 | 3.643 | -0.366 | -3.175 | 0.002* | -18.842 | -4.287 | |
| FGF 23 (pg/ml) | -0.004 | 0.002 | -0.266 | -2.392 | 0.020* | -0.007 | -0.001 | |
Serum Glu-OC concentration (ng/mL) was the dependent variable. Model 1 included all candidate predictors; Model 12 represents the final model obtained using backward elimination. Final model statistics: R = 0.481; R² = 0.231; adjusted R² = 0.195; standard error of the estimate = 3.68 ng/mL. B, unstandardized regression coefficient; SE, standard error of B; β, standardized regression coefficient; t, t-statistic; CI, confidence interval; eGFR, estimated glomerular filtration rate; Ca, total calcium; Pi, inorganic phosphate; Total 25(OH)D, total 25-hydroxyvitamin D; ALP, alkaline phosphatase; Glu-OC, undercarboxylated osteocalcin; FGF23, fibroblast growth factor 23; P1NP, procollagen type I N-terminal propeptide; CTX1, C-terminal telopeptide of type I collagen; suppl., supplementation. *p < 0.05, statistically significant.
Disclaimer/Publisher’s Note: The statements, opinions and data contained in all publications are solely those of the individual author(s) and contributor(s) and not of MDPI and/or the editor(s). MDPI and/or the editor(s) disclaim responsibility for any injury to people or property resulting from any ideas, methods, instructions or products referred to in the content. |
© 2026 by the authors. Licensee MDPI, Basel, Switzerland. This article is an open access article distributed under the terms and conditions of the Creative Commons Attribution (CC BY) license (http://creativecommons.org/licenses/by/4.0/).
Copyright: This open access article is published under a Creative Commons CC BY 4.0 license, which permit the free download, distribution, and reuse, provided that the author and preprint are cited in any reuse.