

Submitted:
25 September 2026
Posted:
28 September 2026
You are already at the latest version
Abstract
This study examines the dynamic relationship between international oil price fluctuations and economic activity in Morocco, assessing the extent to which results depend on the specific measure of oil price changes and the activity indicator used. The analysis employs quarterly data from 1998Q1 to 2024Q4, focusing on real GDP, non-agricultural real GDP, and the industrial production index. Three measures are compared individually: the log change in oil prices (OIL_DH), the net oil price increase calculated over the preceding four quarters (NOPI4T), and the net increase calculated over the preceding twelve quarters (NOPI12T). Estimates are generated within a dynamic modeling framework that incorporates lags of economic activity and oil price measures, as well as a dummy variable representing the subsidy and price-indexing regime for petroleum products. The results reveal heterogeneous coefficients depending on the oil price measure and the activity indicator. For real GDP, OIL_DH is not statistically significant, whereas NOPI4T shows a statistically significant negative association—a pattern not observed with NOPI12T. Responses of non-agricultural GDP and the industrial production index also vary according to the measures used. The statistical significance of the institutional variable across all nine specifications highlights the importance of the price-setting regime in interpreting the results. Thus, the study demonstrates that the relationship between oil prices and economic activity cannot be characterized uniformly based on a single measure of oil price fluctuations.
Keywords:
oil prices
; nonlinear oil price measures
; economic activity
; subsidy regime
; price indexation
; dynamic model
; Morocco
1. Introduction
Fluctuations in oil prices play a significant role in the analysis of business cycles, particularly in economies that are highly dependent on energy imports. A rise in oil prices can increase energy and transportation costs, reduce household real income and raise firme production costs, thereby affecting consumption, investment, and economic activity. It can also exert upward pressure on domestic prices as irms pass part of the resulting cost increases on to consumers. Consequently, oil price fluctuations can simultaneously affect economic activity and inflation. Research by Hamilton (1983), Bruno and Sachs (1985), and Brown and Yücel (1999) established the main mechanisms through which oil price fluctuations affect oil-importing economies, while more recent studies demonstrate that the magnitude of these effects depends on countries structural characteristics and the conditions under which the price changes occur (Ha et al., 2023; Hwang & Kim, 2024).
Recent developments in oil markets have renewed interest in this relationship. Following the sharp drop in prices observed at the onset of the COVID-19 pandemic, oil prices rose significantly in 2021 and 2022, driven by a recovery in global demand, supply constraints, and geopolitical tensions. These movements contributed to rising energy costs and inflationary pressures across many economies. Using a large sample of countries, Ha et al. (2023) show that oil price fluctuations are a major factor associated with inflation, with effects that are particularly pronounced in energy-importing economies. Hwang and Kim (2024) also demonstrate that the impact of oil price fluctuations can vary depending on economic conditions. These results highlight the importance of not limiting the analysis to the magnitude of oil price change and raise questions about how such change should be measured in order to assess its relationship with economic activity.
The question of how to measure oil prices is precisely one of the key debates in the literature. Early studies generally used price changes between two successive periods. While this measure has the advantage of directly capturing price movements, it fails to account for the initial price level. A given increase might represent a mere recovery following a significant drop or, conversely, push the price above recently observed levels. These two scenarios can have different economic implications. Hooker (1996) demonstrated that the relationship between oil price changes and U.S. economic activity weakened after the 1970s, prompting a re-evaluation of the use of linear oil price change as the sole measure of oil price shocks.
Hamilton (1996) subsequently proposed accounting for past price trends by comparing the current price level to the maximum level observed in previous periods. Under this approach, only the portion of the increase above that benchmark is considered. Hamilton (2003) revisited this measure, showing that increases exceeding historical price levels can yield a different picture of the relationship between oil prices and economic activity. While these studies fostered the development of nonlinear oil price measures, no single measure has emerged as a universally appropriate measure across contexts.
Research on asymmetry has further challenged the use of linear change as a measure. Mork (1989) demonstrated that oil price increases can have different and notably larger effects than decreases of the same magnitude. Lee et al. (1995) proposed a measure that accounts for oil market volatility, whereas Ferderer (1996) emphasized the uncertainty associated with price fluctuations. However, conclusions regarding asymmetry depend on the specific econometric specification. Kilian and Vigfusson (2011, 2013) demonstrate that certain conclusions regarding asymmetry may depend on the econometric specification and highlight the need for appropriate testing. More recently, Charfeddine et al. (2020) show that the measures proposed by Hamilton retain explanatory power in more recent samples, while noting this explanatory power may be weaker than that observed in some earlier periods. The literature therefore does not favor a linear or nonlinear representation a priori; instead, it suggests comparing the various measures within a single empirical framework.
The question of comparison is also linked to the choice of the historical timeframe used to define an exceptional price surge. A measure based on peak levels observed over the preceding four quarters does not necessarily capture the same episodes as one constructed using a twelve-quarter window. Consequently, the choice of this reference period can alter the frequency and magnitude of surges identified as exceptional. Debates surrounding the various measures proposed in the literature, notably those associated with the work of Hamilton (1996), Mork (1989), Lee, Ferderer, and Kilian and Vigfusson, demonstrate that the definition of oil price fluctuations is an empirical choice that can affect the resulting findings. Against this backdrop, comparing multiple timeframes within a single analytical framework makes it possible to assess whether conclusions are sensitive to the historical period selected to characterize an exceptional surge.
This matter is particularly relevant for oil-importing economies, in which any volatility in global prices does not automatically lead to an equal degree of variability in domestic prices. In the case of regulated and subsidized prices, a portion of the rise in the international price may be mitigated through fiscal resources instead of being passed on to firms and households immediately. On the other hand, a greater degree of price flexibility may increase the responsiveness of economic agents to fluctuations in oil prices. For instance, Jbir and Zouari-Ghorbel (2009) demonstrate that subsidy policies have the power to modify the correlation between oil price changes and economic activity in Tunisia. More generally, research carried out in the context of importing economies proves the impact of the institutional setting and economic policies on the outcomes of international oil price changes (Lebrand et al., 2024; Souza & Mattos, 2023).
This is why Morocco serves as an apt location to address the different dimensions together. The Moroccan economy is largely dependent on energy products coming from abroad, for this reason the government of Morocco had implemented a compensation mechanism to deal with the impact of the international prices on domestic prices. OECD (2017) claims that energy products make a big portion of compensation expenses and the price setting mechanism has changed over the years in Morocco. The reform initiated in early 2010s has changed this mechanism dramatically. IMF (2015) indicates that the partial indexation mechanism, which connects the price of diesel, gasoline and industrial fuels to the international prices was introduced in September of 2013 before the full elimination of petrol price subsidies in 2014. As a result, the costs on subsidies fell from 6.6% of GDP in 2012 to 3.6% in 2014 with liberalization of prices planned for 2015 indicating that the compensation mechanism has changed.
The changes in institutions are essential for investigating the period of time going from the first quarter of 1998 until the fourth quarter of 2024. In those years, identical fluctuations in international prices can appear due to totally different mechanisms of domestic price creation. Reports by Court of Auditors (2014, 2015) highlight the fiscal pressure exerted by compensation system and the problems arising from its reforming. The reports of Compensation Fund, too, help identify the ultimate costs of the scheme. More recently, the Competition Council (2023, 2024) has analyzed the functioning of the hydrocarbons market, as well as the relations between international price indicators, costs of supply and the markets. Therefore, it became evident that the effect of the variations in oil prices on the economy of Morocco should be investigated in regard to the changes in the institutional mechanisms of price forming.
Although extensive research has been conducted about the relationship between oil prices and economic activity, very little systematic comparison has been made with regard to different methods of measuring oil price fluctuations, particularly in Morocco. The literature has typically focused separately on linear measures, nonlinear measures, and asymmetric responses. As a result, the conclusions reached may depend on the method of measurement selected, the historical period chosen to identify exceptional price swings, and the indicator of economic activity chosen. This is compounded by the fact that the way things are done in Morocco allows including a dummy variable that identifies periods of subsidization and indexation, thus accounting for transformation in the institutional setting of energy prices in Morocco. Hence, the question is whether the differences in the economic activity response stem from the selected oil price fluctuation indicator, the time period used for identifying exceptional price changes, the economic activity indicator used, or the institutional environment analyzed.
In this context, this study seeks to answer the following main question: to what extent does the impact of oil price fluctuations on Moroccan economic activity depend on how those fluctuations are measured? More specifically, the analysis examines whether the effects associated with a linear measure of oil price changes differ from those associated with two nonlinear measures based on historical benchmarks, and whether the choice of time horizon used to identify an exceptional price hike alters the results. The comparison also covers three indicators of economic activity-GDP, non-agricultural GDP, and the industrial production index, to determine whether the Moroccan economy’s response is consistent across the different sectors considered. Finally, the study examines whether the estimated relationship varies according to the periods corresponding to changes in the price compensation system.
Distinguishing between these measures is crucial. The variable OIL_DH captures period-to-period changes in oil prices, whereas NOPI4T and NOPI12T identify price increases that exceed the maximum observed over the preceding four and twelve quarters, respectively. Consequently, the latter two measures do not represent a structural oil shock do not identify a structural oil shock in terms of its underlying economic cause; rather, they serve as nonlinear measures of exceptional price hikes relative to past trends. This distinction aligns with the work of Kilian (2009) and Kilian and Hicks (2013), who demonstrate that an observed change in oil prices is insufficient on its own to identify the underlying structural cause, whether linked to supply factors, demand factors, or other developments in the oil market. The value of the comparison proposed here lies in determining whether different statistical representations of the same price movement lead to different outcomes for Moroccan economic activity. To address this question, the study uses quarterly data covering the period from 1998Q1 to 2024Q4 and separately estimates the relationships associated with three oil price measures: OIL_DH, NOPI4T, and NOPI12T. For each of these measures, the analysis focuses on real GDP, non-agricultural GDP, and the industrial production index. Dynamic modeling makes it possible to account for the persistence of economic activity and to examine the effects associated with oil price changes beyond their contemporaneous relationship effects. Comparing the estimates thus allows for distinguishing results common to the different measures from those that appear only when the price change is defined non-linearly or when the reference horizon is altered.
The evolution of the compensation system is also incorporated into the analysis via a dummy variable distinguishing periods corresponding to different institutional regimes. This variable makes it possible to examine whether the estimated relationships differ depending on the period under consideration, consistent with the transformations documented by the IMF (2015), the OECD (2017), the Court of Auditors (2014, 2015), the Compensation Fund, and the Competition Council (2023, 2024). It serves as an indicator of the shift in institutional regime rather than a direct measure of the magnitude of subsidies or a causal measure of their effect on economic activity.
The contribution of this research lies in a systematic comparison, within a single empirical framework of linear oil price variation and two nonlinear measures based on different historical horizons (four quarter and twelve quarter historical horizons). This comparison is conducted across several indicators of economic activity and situated within the context of the evolution of the Moroccan compensation system. The objective is to determine the extent to which conclusions regarding the sensitivity of economic activity to oil price fluctuations remain consistent or change when the definition of the oil price variation, the reference horizon, or the activity indicator is altered. This approach avoids assuming *a priori* that linearity or non-linearity is an inherent property of the relationship, treating it instead as an empirical question to be examined using alternative measures.
The article is organized as follows. Section 2 presents the literature review covering the relationship between oil prices and economic activity, various measures of linearity and non-linearity, the choice of reference horizons, and the role of institutional frameworks in importing economies. Section 3 outlines the data, variables, and econometric methodology. Section 4 presents the estimation results and diagnostic tests. Section 4 discusses the results, focusing on the comparison between linear and nonlinear measures, between different reference horizons, and between economic activity indicators, while considering the evolution of the compensation regime in Morocco. Finally, the conclusion presents the study’s main findings, its limitations, and avenues for future research.
2. Literature Review
The connection between oil values and economic activities has historically been a vital subject in literature relating to macroeconomics. When it comes to oil-importing nations, a growth in oil pricing can cause a negative shock, raising the costs of production, lower real disposable income, deteriorating trading conditions and reducing domestic demand, all at once. All of those elements will be playing a role in consumption, investment, and economic output. Study papers by Hamilton in 1983, Bruno and Sachs in 1985, Loungani in 1986, and Hamilton in 1988 have determined significance of oil pricing in terms of changes in economic growth rates.
Nonetheless, the effects noted are not uniform within the time, neither do they provide the same results in regard to various economies. In particular, the research conducted by Burbidge and Harrison (1984) and Brown and Yücel (1999) shows that the influence that the changes in oil prices have on the economic processes is determined by the features of particular economies and their situation in the oil market. Speaking about the countries importing oil, it should be pointed out that the investigations carried out by Papapetrou (2001), Kumar (2009), and Cunado and Pérez de Gracia (2005) reveal the variety of transmission mechanisms, particularly through real incomes, production costs, international trade, and nominal variables, which means that the effect estimated in case the oil price varies is determined by the way how this change is represented in the model being used. In effect, the same change in prices may be understood either as something ordinary or as an unprecedented change, depending on the definition of oil price change being applied.
In this literature, the oil shock is frequently represented by the linear variation of the oil price in levels or logarithms, expressed as (∆) or ∆ln (). This representation offers the advantage of simplicity and allows price movements to be directly integrated into dynamic models. However, it relies on a significant implicit assumption: that a rise and a fall of the same magnitude are economically symmetrical. Yet, this very assumption is challenged by research into the nonlinear effects of oil price changes.
The stability of the relationship between oil price volatility and economic activity has come into doubt recently. For example, Hooker (1996) shows that the relationship between oil prices and macroeconomic activity observed historically has become unstable since the 1970s. This led to efforts directed towards creating a better model of oil price shocks which would reflect the historical oil pricing behavior, rather than only the current fluctuations.
Hamilton (1996) introduced a model based on the increase in oil prices net of the peak level reached during preceding period. The model was further developed by Hamilton (2003) and falls into a broader literature discussing the nonlinear impacts of oil price fluctuations on economic activity. Other studies, including those by Lee et al. (1995), Mork (1989), Karaki, M. B. (2017), and Kilian & Vigfusson (2011), also contribute to the discussion of how to model oil price shocks.
Hence, the significance of NOPI-type measures lies not in the assumption that something nonlinear is always better than something linear, but rather in the capacity to identify price jumps exceeding historical benchmarks. This is an important distinction since no definitive ranking of these measures can be found in the existing literature. In their re-assessment of Hamilton (2003), Charfeddine, Klein, and Walther (2020) show that peak-based measures are still valid, although the value becomes weaker if more recent data are analyzed. The necessity of considering price drops is also pointed out, along with the fact that nothing indicates Hamilton’s measures can outperform linear ones in any respect. The highlighted conclusion is especially important for this research because an oilprice shock measure is not just a trivial number. Instead, it is an empirical assumption capable of changing the identification, size, and importance of the obtained results.
The construction of NOPI-type indicators raises a second, less commonly explored issue, which is the historical horizon employed for comparison. Hamilton (1996) proposes a reference horizon of around four quarters, while Hamilton (2003) takes a longer historical horizon of twelve quarters. Thus, NOPI4T and NOPI12T are not the same measures of the same shock; these two indicators capture different behavior of oil prices based on their historical depth.
Economically, this distinction is important since a current price that is higher than the maximum in the preceding four quarters is regarded as a break in the price regime, while a price that exceeds the maximum in the last twelve quarters denotes an extraordinary increase in prices over a relatively longer period. Thus, the choice of the historical horizon can have implications for the number of shocks accumulated and the econometric results.
The controversy of non-linearities sustains this issue. Mork (1989), Lee, Ni and Ratti (1995), and Ferderer (1996) say that the impacts of oil price changes are different based on their direction and size. On the other side, Kilian and Vigfusson (2011) state that some types of asymmetry might depend on the chosen parameterization and nonlinear transformations should not be treated as neutral from a statistical point of view. The statement is repeated by Kilian and Vigfusson (2013) who highlight that the efficiency of Hamilton-type measures should be proved empirically and not just stated.
Overall, the literature enables to suggest the more complex conclusion: the question is not in the search for the best measure, but in checking whether the conclusions about the effect of oil prices remain the same while the definition of the shock and the period of its occurrence are changed. This will be especially important in case one aims at studying the economy, in which the mode of the domestic price formation has also changed within the studied time frame. The sensitivity of the results to the type of the oil price changes can be studied together with changes in the institutional transmission mechanism.
However, another limitation must be distinguished from the issue of non-linearity. Kilian (2009) demonstrates that a change in the oil price is not enough, on its own, to identify the underlying cause of the shock. The same price increase could stem from a contraction in global supply, a rise in global demand, or a shock specific to the oil market. Notably, Kilian and Hicks (2013) show that certain periods of sharp price increases prior to the global financial crisis were largely driven by strong global demand.
The difference in understanding this differentiation implies that linear indicators and NOPIs denote oil price variations rather than refer to structural indicators which could provide insight about the source of the shock. High NOPI means that present price is above a certain historical average; however, this does not imply the cause of that price increase: it might stem from either demand or supply shock or combination of the two.
This explanation also sets the limits for empirical analysis: the purpose of the paper is not to uncover structural shocks in the oil market but to determine the differences in effect of oil price changes on Moroccan economy as per definition of oil price changes.
The impact of oil price fluctuations can differ based on the economic activity indicator used. Studies by Cunado and Pérez de Gracia (2005), Papapetrou (2001), and Kumar (2009) indicate that the transmission mechanism can impact output, demand and nominal variables simultaneously. Recent research conducted by Hwang and Kim (2024) shows that the impact of energy prices depends on the business cycle phase. Presno and Prestipino (2024) emphasize the importance of energy in times of high inflation.
The mixed results explain the fact that it is not enough to analyze only one aggregate indicator. Using real GDP, real non-agricultural GDP, and the industrial production index makes it possible to examine three complementary dimensions of economic activity. Real GDP provides information on the response of overall economic activity; non-agricultural GDP helps isolate economic activity that is less directly affected by agricultural fluctuations; and the industrial production index serves as an indicator more directly associated with industrial activity and its exposure to energy costs. Empirical studies indeed show that the effects of oil price fluctuations can vary depending on the components of economic activity. In several countries, transmission to non-oil GDP occurs notably through the exchange rate and public spending. In Azerbaijan, a 1% rise in the oil price is associated with a 0.0584% increase in real non-oil GDP (Majidli, F., & Guliyev, H., 2020). In Algeria, positive oil price shocks have also been linked to growth in the construction and services sectors, particularly via the public spending channel (Benameur, A. G et al.). Conversely, the effects observed in the agricultural sector are weaker or negative, depending on the country. In Colombia, a medium-term decline in industrial production following a positive oil price shock has been identified, pointing to the mechanism of “Dutch disease”. (Francis, N., & Restrepo-Ángel, S., 2018).
The transmission of oil price shocks also affects prices, with impacts varying across sectors. Increases in oil prices feed through to the consumer price index and inflation, while the effects on producer prices are particularly evident in mining and industrial activities, (Mukhtarov, Ş et al., 2020; Gülay, E., & Pazarlıoğlu, M. V., 2016). In China, available estimates indicate that different types of oil price shocks do not affect the producer prices of the 36 sub-industries studied in a uniform manner. These results suggest that analyzing the effects of oil price shocks benefits from distinguishing between the various components of economic activity, particularly when transmission mechanisms differ across agriculture, non-agricultural activities, and industry, (Deng, X., & Xu, F, 2024).
Furthermore, this approach aligns with the work of Hamilton (1983, 1996), Cunado et De Gracia (2003), Herrera et al. (2011), Serletis and Istiak (2013), Balcilar and Usman (2021), and Borozan and Cipcic (2022), all of whom highlight, using various approaches that the effects of oil price fluctuations can depend on the structure of the economy, the specific sector, and the indicator used. Consequently, comparing measures of oil price shocks is more meaningful when conducted across multiple indicators of real economic activity.
The issue of how oil price fluctuations are transmitted is particularly significant for importing economies where domestic price formation is subject to direct or indirect intervention. Malik’s (2008) study demonstrates the nonlinear interplay between the changes in oil prices and actual output in Pakistan. Similarly, Diop and Fame (2007)’s research illustrates how oil shocks affect the economic growth, trade balance and inflation in Senegal. The same authors, Rajhi et al. (2005) stress that the African oil-importing economies are vulnerable to changes in energy prices.
Nevertheless, in such countries, compensation and subsidy systems can change the pattern of the impact of external shocks. Referring to Tunisia, Jbir and Zouari-Ghorbel (2009) illustrate that oil shocks may exert an indirect influence via public spending. Hence, energy subsidies may smooth the transmission of the international price fluctuations to domestic prices temporarily, while reforms of the compensation system may reinforce it.
Thus, the relationship can be described as a chain of transmission:

From an empirical standpoint, the dichotomous subsidy regime variable makes it possible to examine whether the level of economic activity differs between subsidy and non-subsidy periods. Its coefficient thus provides information on a potential level effect of the regime on real GDP, non-agricultural real GDP, and the industrial production index (IPI). On its own, however, it does not allow for the identification of a change in the sensitivity of economic activity to oil price fluctuations.
Along these lines, the evolution of the subsidy system is more than just an institutional characteristic of Morocco; this has an impact on how price movements at the global level are being transmitted domestically. The significance of this facet explains why a dummy variable was introduced in order to distinguish between different types of institutional transmission. Morocco is considered an interesting case in terms of energy dependency as well as gradual evolution of its subsidy system. According to the analysis by the IEA1 (2014) and the Court of Auditors (2015), energy products used to occupy an important place in the subsidy system and various reforms aimed at changing the process of price formation were carried out. What is more, the IMF (2014) suggests that in 2013 various changes in the price indexation system for diesel, gas, as well as industrial oil took place, along with the overall decrease and gradual elimination of some subsidies.
This shift has also influenced the budgetary impact of the system. The information released by the IMF (2015) indicates a notable reduction in the expenses of energy subsidies from roughly 6.6% of GDP in 2012 to 3.6% in 2014 and even a decrease in 2015 is expected. The changes mentioned above indicate the significant reshaping of the institutional structure causing the response of domestic economy to international energy price changes.
Nevertheless, it is important to note that the reforms mentioned above should not be considered as direct transmission of international prices into domestic prices. The study of the Court of Auditors (2015) together with the information on the Compensation Fund and budget monitoring demonstrates that price formation process involves complicated institutional mechanisms. Recently, the IMF (2024) pointed out the ongoing reform in the energy subsidy system related to the increase in the price of butane together with compensatory measures.
Investigations carried out by the Competition Council into the gasoline and diesel markets show that domestic pricing is determined by international refined product prices, the cost of providing types of fuels, and market conditions. Therefore, it can be assumed that the institutional evolution of the compensation system can be considered a change in the mechanism by which fluctuations in oil prices pass through.
The analysis of the literature has identified three unique dimensions. The first aspect concerns the non-neutral representation of the oil price shock, where linear measures, new peak measures, and other nonlinear measures yield different results. The second aspect pertains to the fact that the economic response may differ depending on the measure of economic activity under consideration. Finally, it is important to note that the changes in the institutional regime in importing economies where domestic prices used to be influenced by compensation regimes can, in essence, change the transmission of the international oil price shock.
Nevertheless, rarely are these three aspects incorporated into one empirical framework. In the specific case of Morocco, it remains unclear in literature if the conclusions concerning oil price fluctuations on the economy would still be valid if the definition of oil price fluctuations was to switch from simple linearity to nonlinear measures of oil price movements, taking into account changes in subsidy policy. More precisely, there is a lack of evidence based on systematic comparison of both NOPI4T and NOPI12T with the use of various measures of economic performance.
The research will address this gap precisely. Within the homogeneous dynamic framework, it compares linear variation of oil prices (∆oil) with NOPI4T and NOPI12T. The impact of these measures will be measured against real GDP, real non-agricultural GDP and the industrial output index (IPI). To address the issue of energy price transformation in Morocco, the research also uses the dummy variable. It should be noted that the research does not claim that one measure is better than the others, but is aimed at establishing the influence of oil price fluctuations on economy depending on the measures used that defines the shock.
This strategy shifts the research focus from a general inquiry into the existence of an “oil effect” to a more precise question regarding the robustness of oil shock measurement: do conclusions concerning the response of Moroccan economic activity change when the same international price movement is represented by a linear variation (∆oil), a NOPI4T, or a NOPI12T, and when the institutional transmission context is taken into account ?
The literature review identifies three insights that justify the empirical approach adopted. First, the effect of oil price variability is related to its definition, that is, whether it is computed in a linear way, or in a nonlinear way within a certain time frame. Second, there is a difference between the indicators used to measure activity, and therefore, it makes sense to analyze real GDP, real non-agricultural GDP, and industrial production index together. Third, it seems that in Morocco, the changes in the compensation system and the pricing mechanism for petroleum products influenced the way in which oil price fluctuations were reflected in the national economy. Based on that, it becomes a question of whether the results still hold true when the definitions of shocks, activity indicators, and transmission regimes are changed. The subsequent section presents the data and the variables used for the comparison, as well as the dynamic modeling approach adopted for the analysis starting from the first quarter of 1998 to the fourth quarter of 2024.
The empirical investigation is organized around four parameters that can easily be determined from the estimation results. These parameters include the measure used to calculate oil price variations, the period under which significant variations are determined, the measure chosen to represent economic performance, and the institutional period being considered. The comparison between OIL_DH, NOPI4T, and NOPI12T facilitates determining if the coefficient estimates correlated with oil price variations change depending on the definition of the oil price variation and period used. The concurrent use of GDP, GDP without agriculture, and Industrial Production Index (IPI) helps realize if the coefficient estimates vary depending on the economic activity measure used. Finally, inclusion of the dummy variable showing the periods of compensation allows for determining if there is a difference in the estimates depending on the specific institutional period. In this regard, the hypotheses can be formulated as follows:
H1: The relationship between oil price fluctuations and Moroccan economic activity differs depending on the measure used to represent oil price movements, specifically, linear variation (OIL_DH) versus nonlinear measures (NOPI4T and NOPI12T).
H2.: Identifying significant oil price increases over different historical horizons is associated with distinct estimated effects on Moroccan economic activity when comparing NOPI4T and NOPI12T.
H3: The impact of oil price fluctuations varies across the economic activity indicators used, namely GDP, non-agricultural GDP (GDP_NA), and the industrial production index (IPI).
H4: Changes in the energy price subsidy regime are associated with changes in the relationship between international oil price fluctuations and Moroccan economic activity, reflecting the regime’s influence on the extent to which international prices are passed through to domestic prices.
3. Data and Methodology
3.1. Sources and Data
The analysis is confined to Morocco and uses quarterly data for the period from 1998Q1 to 2024Q4. The quarterly frequency of data matches the prestigious studies regarding the influence of oil prices on the economy conducted by Hamilton (1983) and continued by Mork (1989) and Hamilton (1996) that provide the basis for research in this area. The frequency of data enables the observer to reflect both immediate fluctuations of oil prices and differentiate between linear fluctuations and nonlinear shocks. The latter are determined based on the fact whether the current price of oil is higher than the previously set historical threshold. The quarterly frequency of data proves to be the most suitable for the construction of two indices NOPI4T and NOPI12T based on the observations over the previous four and twelve quarters respectively. The quarterly frequency is also possible to use for calculating the logarithmic value of the change of oil prices and its previous values, which allows researchers obtaining short-term oil price changes that might have been ignored in case of the use of annual frequency of data.
The empirical work relies on quarterly information stretching from the first quarter of 1998 to the fourth quarter of 2024. The real gross domestic product (GDP) and real non-agricultural GDP (GDP_NA) figures came from the quarterly national accounts published by the High Commission for Planning (HCP). The industrial production index (IPI) and international oil prices measured in US dollars (OIL$) are recorded in the databases of the International Monetary Fund (IMF), an organization that has its International Financial Statistics (IFS) database.
The data used in this study is obtained from both local and global reputable establishments to ensure the credibility, comparability, and continuity of the values employed in the econometric calculations. More details about each data type used in this article and their definitions can be found in a table presented further in this paper. Overall, the data collection process proves that although the variables of interest in this study come from various sources, they have been statistically consistent in terms of the regular usage of this type of information.

Table 1.
Description of variables and statistical sources.
| Variable | Definition | Source |
|---|---|---|
| GDP | Real Gross Domestic Product | HCP—Quarterly National Accounts |
| GDP_NA | Real non-agricultural GDP | HCP—Quarterly National Accounts |
| IPI | Industrial Price Index | FMI—IFS |
| OIL$ | Oil price in dollars | FMI—IFS |
| REER | Real Effective Exchange Rate | Bank Al-Maghrib (BAM) |
Source: Prepared by us.
Three macroeconomic variables are examined separatly in turn: real GDP, non-agricultural real GDP, and the industrial production index. The price of oil is introduced in three forms, considered separately: its linear change (OIL_DH), NOPI4T, and NOPI12T. These alternative measures make it possible to examine whether the estimated effect of oil price fluctuations depends on how oil price changes are measured, a topic central to the debate initiated by Hamilton (1996, 2003) and expanded upon in subsequent research on the nonlinearity of oil effects.
A distinctive feature of this analysis is that it accounts for changes in the price-setting mechanism for major petroleum products. During the first period (1998Q1–2002Q3), the system was based on Order No. 43-95 of 30 December 1994; this order established refinery purchase prices based on international market quotations and provided for an adjustment mechanism involving the Compensation Fund (Caisse de compensation)1. This framework was modified by Order No. 1144-02 of 15 July 2002, which introduced a new price-setting framework and marked the beginning of the second period in 2002Q4 (Compensation Fund, 2023; Court of Auditors, 2008).
The period from 2002Q4 to 2013Q4 thus corresponds to the regulatory regime resulting from this modification. Order No. 2380-06 of 23 October 2006, subsequently confirmed this framework by stipulating that any price differentials not reflected in sales prices would be covered by the Compensation Fund’s price adjustment account (Official Gazette, 2006; Court of Auditors, 2008). This period ended with the entry into force on 16 September 2013, of the Head of Government’s Order No. 3-69-13 of 19 August 2013, which established a system of partial indexation for diesel, premium gasoline, and industrial fuel oil No. 2 (Ministry of Economy and Finance, 2013; Official Gazette, 2013).
A new phase began in the first quarter of 2014. The reform initiated in 2013 was reinforced in January 2014 through the full indexation of gasoline and industrial fuel prices, while the subsidy for diesel was gradually reduced over the course of the year. This development is documented by the Court of Auditors (2014) and the Ministry of Economy and Finance of morocco, which describe the various stages of the reform leading up to the phased elimination of price subsidies for liquid petroleum products in 2015.
On this basis, an indicator variable, , is introduced to distinguish the main phases of the price-setting regime observed in the sample:
This coding is therefore based on regulatory changes introduced in 2002 and during 2013–2014, rather than on a quantitative measure of subsidy expenditure. The first period preceded the modification of the system by Order No. 1144-02; the second corresponds to the regime resulting from that modification and lasting until the introduction of the new indexation mechanism in September 2013; the third begins with the strengthening of indexation in January 2014. This interpretation aligns with the official chronology presented by the Ministry of Economy and Finance, which distinguishes between price setting prior to 2000, the suspension of indexation, adjustments made between 2004 and 2012, the resumption of indexation in 2013, full indexation in 2014, and the liberalization of liquid petroleum product prices in December 2015 (Ministry of Economy and Finance, 2018).
The relationship between oil price fluctuations and economic activity is then estimated within a dynamic modeling framework, allowing for the persistence of macroeconomic variables. For each dependent variable, the analysis considers, in turn, its lagged values, one of the three oil price measures, and the regime dummy variable. This framework makes it possible to assess whether the relationship between oil price fluctuations and the Moroccan economy varies according to the oil price measure used and the price-setting regime considered.
3.2. Defining Oil Price Variables
To examine the relationship between oil price fluctuations and macroeconomic variables, we consider, in turn, a linear specification and two nonlinear specifications. In the linear approach, the oil shock is measured by the quarterly logarithmic change in the real oil price, following the conventional approach used by Hamilton (1983):
LOILDH: the quarterly logarithmic variation of the real price of oil.
However, the literature indicates that the relationship between oil price fluctuations and economic activity can be non-linear. Notably, Hamilton (1996) highlights that oil price increases may convey different information than decreases and proposes a measure based on net oil price increases (NOPI). In this context, we employ NOPI4T, which measures the extent to which the current price exceeds the maximum observed over the preceding four quarters:
NOPI, expressed in real terms, capture the net increase in the price of oil between its real level in the current quarter and that of recent preceding quarters.
Extending this approach, Hamilton (2003) considers a longer reference, corresponding to the preceding twelve quarters. We thus adopt (NOPI12T):
NOPI, expressed in real terms, capture the net increase increase in the oil price between its real level in the current quarter and that of preceding quarters.
Thus, the linear variation captures all quarterly fluctuations in the real oil price, whereas the NOPI4T and NOPI12T measures identify increases that exceed the peak levels observed over the previous four and twelve quarters, respectively. Considering these three specifications makes it possible to assess how macroeconomic variables respond both to standard oil price fluctuations and to price hikes that are exceptional relative to past trends. The econometric estimates are performed using EViews 12 software.
4. Empirical Analysis and Results
4.1. Graphical Representation of the Study Variables
Empirical literature primarily uses the international oil price, either expressed in U.S. dollars or converted into domestic currency, to examine its relationship with domestic economic activity (Jbir & Zouari-Ghorbel, 2009; Papapetrou, 2001; Cunado & Pérez de Gracia, 2005; Kumar, 2005; Malik, 2008). Using the price in domestic currency accounts for the effect of the exchange rate on the domestic-currency cost of imported oil, deflating the domestic-currency oil price by the CPI. This approach is particularly relevant for an energy-importing economy like Morocco, where through exchange rate movements and changes in domestic price levels (Ha et al., 2023; Hwang & Kim, 2024). In this study, the various measures of the oil price shock are therefore constructed using the real oil price denominated in dirhams, to account for domestic price and exchange rate conditions in measuring oil price movements. (see Figure 1).
Oil prices in dirhams (MAD) and USD are strongly correlated (0.98)1 over the period from 1998 Q1 to 2024 Q4. Chart 11, which shows the evolution of the logarithm of oil prices in dollars and dirhams, reveals that the two series follow a nearly identical trajectory and jointly capture major oil price shocks: the increase in 2000, the 2008 peak, followed by a sharp collapse, the 2011–2012 rebound, the 2014–2016 decline, and the 2020 drop linked to the COVID-19 pandemic. Prices subsequently rose sharply in 2021–2022, amid the Russia-Ukraine war and global supply tensions. Since 2023, prices have moderated. The slight gap observed between the two curves reflects the impact of the dirham/dollar exchange rate, without materially altering their common trajectory.
From a theoretical standpoint, Hamilton (1983) was among the early studies to model the relationship between oil prices and economic activity using a linear measure of oil price changes (Δoil), positing a symmetric economic response to both increases and decreases. However, this linear specification was found to provide a less satisfactory representation, particularly following the 1986 oil price collapse, leading to the adoption of nonlinear measures better suited to capturing the nonlinear nature of oil price movements.
Hamilton (1996) thus introduced the Net Oil Price Increase (NOPI), which captures only the portion of an oil price increase that exceeds the maximum observed in previous quarters, the component that may represent an unusually large increase relative to recent historical prices. Hamilton (2003) refines this measure by a twelve-quarter horizon and demonstrates its superior predictive power relative to the corresponding linear measure. This work has thus solidified the use of the NOPI as the benchmark nonlinear proxy for oil prices, proving more robust in characterizing the relationship between oil price movements and macroeconomic aggregates.
Figure 2.
Evolution of net oil price increases based on NOPI4T and NOPI12T horizons (1998Q1–2024Q4). Source: Prepared by us.
Figure 2.
Evolution of net oil price increases based on NOPI4T and NOPI12T horizons (1998Q1–2024Q4). Source: Prepared by us.
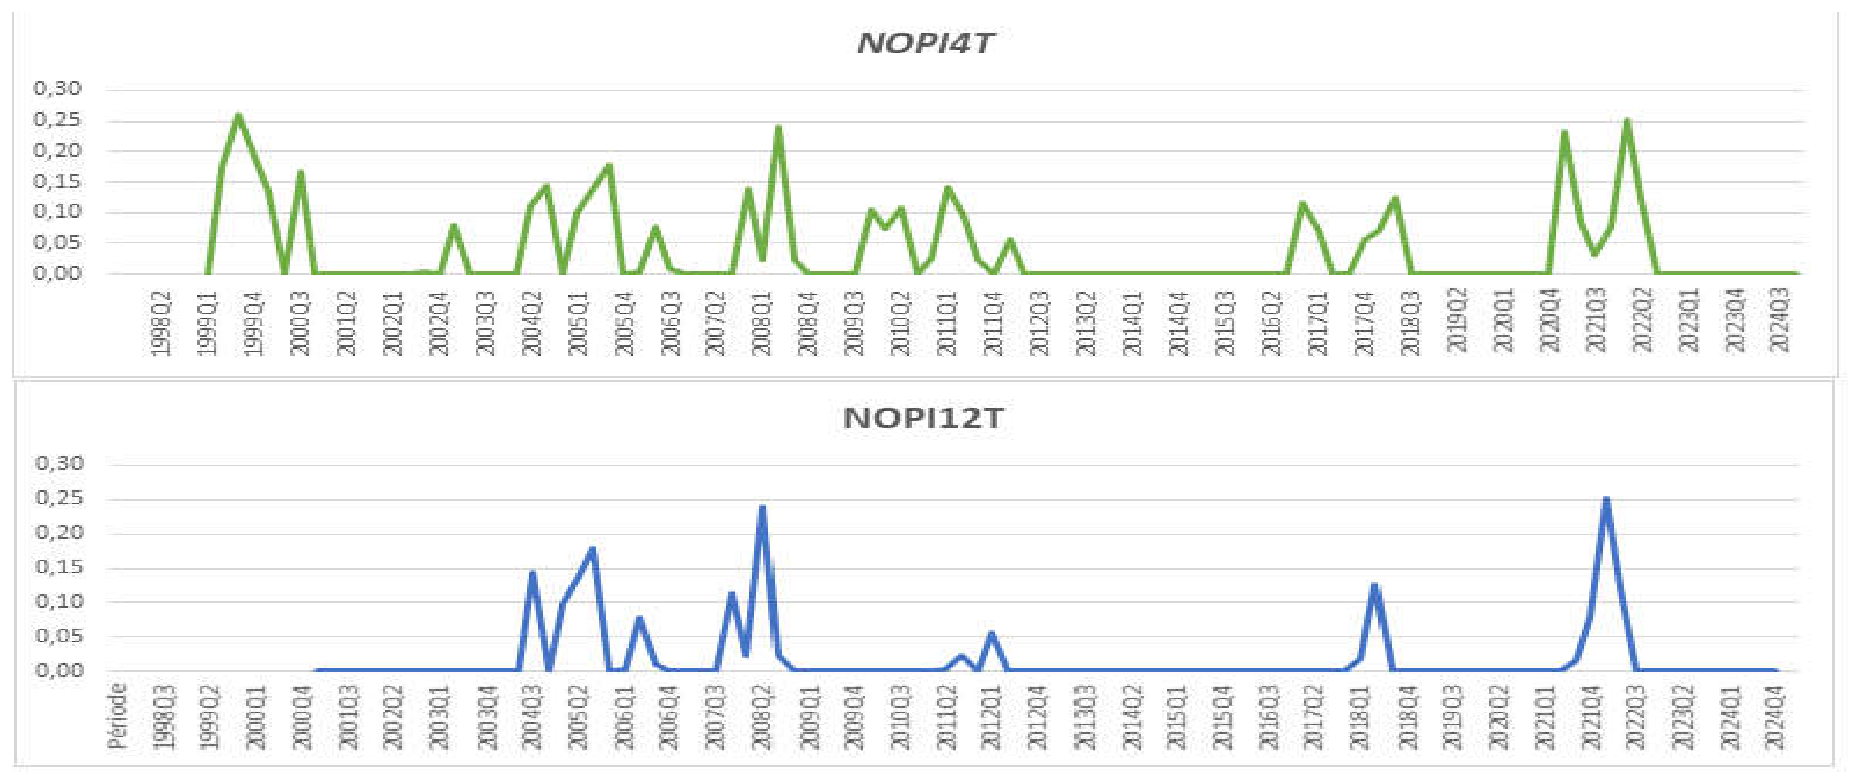
Over the 1998Q1–2024Q4 period, the NOPI4T and NOPI12T measures capture oil price increases that exceed the maximum levels observed during the preceding four and twelve quarters, respectively. Unlike conventionnel price change, these measures exclude increases that merely represent a recovery following a recent decline. They thus make it possible to distinguish unusually large oil price increases, such as the sharp increase preceding the 2008 price peak, during the 2010–2011 recovery, and amid the price rebound of 2021–2022. This distinction is particularly relevant for Morocco, where the economic impact of rising oil prices also depends on price-setting and compensation mechanisms. This approach builds on the work of Hamilton (1996, 2003), who proposed measures based on new peak levels to characterize the relationship between oil shocks and economic activity.
4.2. The Estimation Method
Dynamic model regression is adopted to account for the temporal persistence in the dependent variable and the lagged effects of the explanatory variables. This approach, previously employed by Barlet and Laure (2009) as well as Rajhi, Benabdallah, and Hmissi (2005), remains widely used in recent empirical studies employing lagged variables and dynamic specifications, particularly in studies of oil prices and macroeconomic relationships (Moreno, Figuerola-Ferretti & Muñoz, 2024; Nibbering, 2024; Chiang, 2025; Beckmann & Agyapong, 2026). The general model specification is given by:
: endogenous variable of the model for quarter (t), corresponding successively to the real GDP growth rate, the real non-agricultural GDP growth rate (GDP_NA), and the industrial production index (IPI) growth rate;
: coefficients associated with the lagged values of the endogenous variable y(t − 1), making it possible to account for the temporal dynamics and persistence of economic activity;
Ln: coefficients associated with the explanatory variables representing the different specifications of the oil price namely, the linear variation in the oil price, NOPI4T, and NOPI12T;
: exogenous variable representing the oil price measure used in the equation, namely, the linear variation, NOPI4T or NOPI12T;
: dichotomous variable representing the petroleum product subsidy regime, taking the value 0 during the subsidy period and 1 during the indexation period;
C: The model constant;
: random error term, representing unobserved factors likely to affect the endogenous variable in quarter (t).
The methodological approach utilized in this study is that of a dynamic regression, where the dependent variable is determined by the past values of the dependent variable as well as the growth rate of oil prices. The addition of the lagged variables enables accounting for the persistence of fluctuations in the economy and the lagged reaction of the Moroccan economy to changes in oil prices. In fact, any change in oil price does not have to be reflected in the economic activity right away, as its influence can be observed over time through changes in production costs, domestic prices, real income, demand, and the investment decisions made.
Three dependent variables are considered separately to examine different dimensions of economic activity: real GDP growth (DLGDP), non-agricultural real GDP growth (DLGDP_NA), and the logarithmic change in the industrial production index (DLIPI). For each of these variables, the specifications incorporate its own lagged dynamics as well as a measure of the change in the oil price. To assess the sensitivity of the results to the definition of the oil shock, three measures are employed: the logarithmic change in the oil price and the nonlinear indicators NOPI4T and NOPI12T, which capture net oil price increases over four-quarter and twelve-quarter reference horizon, respectively. This approach makes it possible to distinguish t distinguish the estimated association with a current price change from that associated with an unusually large increase that is relative to recent historical oil price levels.
The specifications based on the NOPI indicators also include a dummy variable representing the petroleum product subsidy regime. This variable takes the value 0 for the period 1998Q1–2002Q3, the value 1 for 2002Q4–2013Q4, and reverts to 0 from 2014Q1 onwards. Its inclusion allows the analysis to account for differences associated with changes in the institutional regime associated with changes in Morocco’s oil price regulation system. It also accounts for the possibility that the adjustment of domestic prices to fluctuations in international prices may be dampened or delayed by institutional subsidy and compensation mechanisms.
Finally, the model specifications rely on the assumption that the international oil price is exogenous to the Moroccan economy. This assumption is economically plausible for Morocco, given the country’s status as a price-taker on the international oil market. Morocco does not enjoy enough market power to adequately impact the international price of Brent oil. The movements observed in the Brent price thus tend to be treated as driven by factors external to the Moroccan economy, enabling the use of the international oil price as an exogenous variable in the empirical specifications.
Step 1. Descriptive statistics
Table 2.
Descriptive statistics of the variables.
| LGDP | LGDP_NA | LIPI | LOIL | |
|---|---|---|---|---|
| Mean | 11,184 | 10,967 | 5326 | 5118 |
| Median | 11,201 | 10,985 | 5341 | 5156 |
| Maximum | 11,684 | 11,478 | 5781 | 5912 |
| Minimum | 10,642 | 10,394 | 4812 | 4201 |
| Std. Dev. | 0.398 | 0.414 | 0.376 | 0.487 |
| Skewness | −0.242 | −0.318 | −0.465 | −0.521 |
| Kurtosis | 3714 | 3893 | 4184 | 4527 |
| Jarque-Bera | 0.782 | 0.834 | 3487 | 4214 |
| Observations | 108 | 108 | 108 | 108 |
Source: Authors’ calculations. Note: LGDP denotes the logarithm of real GDP, LGDP_NA the logarithm of real non-agricultural GDP, LIPI the logarithm of the industrial production index, and LOIL the logarithm of the oil price. Mean, Maximum, Minimum, and Std. Dev. correspond to the mean, maximum, minimum, and standard deviation, respectively. Skewness and Kurtosis refer to the coefficients of skewness and kurtosis, respectively. The Jarque–Bera statistic is used to assess the normality of the variable distributions. The number of observations corresponds to the size of the quarterly sample.
Descriptive statistics reveal key information regarding the central tendency, variability, and distribution of the selected variables. Notably, they highlight higher volatility in the oil price (LOIL), with a standard deviation of 0.487, compared to 0.398 for GDP, 0.414 for non-agricultural GDP, and 0.376 for the IPI. This greater dispersion is consistent with the larger variation observed in oil prices over the study period. The relatively small differences between means and medians suggest a relatively symmetric distribution. Skewness coefficients (−0.242 to −0.521) remain moderate, while kurtosis values (3.714 to 4.527) stay close to the reference value of 4. Finally, Jarque-Bera statistics (0.782 to 4.214) do not allow for the rejection of the null normality hypothesis at the 5% significance level. These results provide an initial assessment prior to examining the stationarity of the series.
Step 2. Testing for stationarity
The stationarity of the series is assessed to determine their order of integration and mitigate the risk of spurious regression in the econometric analysis of time series. To this end, three complementary tests are employed: The Augmented Dickey Fuller (ADF) test (Dickey and Fuller, 1979), the Phillips–Perron (PP) test (Phillips and Perron, 1988), and the Kwiatkowski–Phillips–Schmidt–Shin (KPSS) test. Using these tests in combination enhances the robustness of the stationarity assessment, given their differing null hypotheses. The results show that all the variables considered are non-stationary in levels but become stationary in first differences, indicating that they are integrated of order one, I(1). The potential presence of a cointegration relationship is therefore examined o assess whether a long-run equilibrium relationship exists between the variables, in accordance with the cointegration approach proposed by Engle and Granger (1987). The cointegration study confirms that there is no cointegration relationship between the price of oil and the other variables (Table 4).
Table 3.
Results of ADF, PP, and KPSS stationarity tests.
| variable | Augmented Dickey-Fuller (DFA) | PP | KPSS | integration order | |||||||
| prob (trend) |
prob (trend) |
prob (trend) |
|||||||||
| test statistic | 5% critical value | prob (trend) | test statistic | 5% critical value | prob (trend) | test statistic | 5% critical value | prob (trend) | |||
| LOIL | level | −3,93 | −4,48 | 0.04 | −3,13 | −4,48 | 0.38 | 0.27 | 0.25 | 0.00 | I(1) |
| first diff | −7,33 | −3,91 | −4,28 | −3,91 | 0.28 | 0.46 | |||||
| LGDP | level | −4,64 | −4,48 | 0.00 | −5,95 | −4,48 | 0.00 | 0.24 | 0.25 | 0.00 | I(1) |
| first diff | −13,67 | −3,91 | −27,22 | −3,91 | 0.31 | 0.56 | |||||
| LGDP_NA | level | −3,68 | −4,48 | 0.01 | −4,94 | −4,48 | 0.00 | 0.23 | 0.25 | 0.00 | I(1) |
| first diff | −8,63 | −3,91 | −28,69 | −3,91 | 0.27 | 0.56 | |||||
| LIPI | level | −2,24 | −3,91 | 0.29 | −7,90 | −4,48 | 0.00 | 0.29 | 0.25 | 0.00 | I(1) |
| first diff | −5,70 | −3,91 | −40,18 | −3,91 | 0.21 | 0.56 | |||||
Source: Authors’ calculations. Note: ADF = Augmented Dickey-Fuller test; PP = Phillips-Perron test; KPSS: Kwiatkowski–Phillips–Schmidt–Shin. The reported values correspond to the test statistics. ***, **, and * indicate significance at the 1%, 5%, and 10% levels, respectively. I(1) indicates that the series becomes stationary after first differencing.
Step 3. Determine the optimal number of lags
The optimal number of lags is determined using the Akaike Information Criterion (AIC) and the Schwarz Information Criterion (SIC), which allow for the selection of a specification that strikes a balance between goodness-of-fit and model parsimony (Akaike, 1974; Schwarz, 1978). The selected structure corresponds to the one associated with the minimum values of these criteria.
Table 5.
Results of ADF, PP, and KPSS stationarity tests.
| Dependent variable | Oil price measure | Criteria | P = 1; Q = 0 | P = 2; Q = 0 | P = 3; Q = 0 | P = 1; Q = 1 | P = 2; Q = 1 | P = 3; Q = 1 | Selected model |
| LGDP | LOILDH | AIC | −6.8334 | −6.7334 | −6.6134 | −6.6834 | −6.9734 | −6.6214 | P = 2; Q = 1 |
| SC | −6.7143 | −6.6143 | −6.5543 | −6.4543 | −6.8143 | −6.5123 | |||
| NOPI4T | AIC | −6.5445 | −6.4586 | −6.3536 | −6.9356 | −6.9004 | −6.8753 | P = 1; Q = 1 | |
| SC | −6.4123 | −6.3697 | −6.2750 | −6.7857 | −6.7104 | −6.6653 | |||
| NOPI12T | AIC | −6.9640 | −6.8882 | −6.8612 | −6.9209 | −6.8927 | −6.8678 | P = 1; Q = 0 | |
| SC | −6.8075 | −6.7301 | −6.6714 | −6.7615 | −6.7015 | −6.6447 | |||
| LGDP_NA | LOILDH | AIC | −8.3305 | −8.2334 | −8.1634 | −8.7835 | −8.9146 | −8.8250 | P = 2; Q = 1 |
| SC | −8.1404 | −8.1843 | −8.1143 | −8.6542 | −8.8564 | −8.7312 | |||
| NOPI4T | AIC | −8.4521 | −8.2714 | −8.6134 | −8.5825 | −8.8802 | −6.6214 | P = 2; Q = 1 | |
| SC | −8.2204 | −8.2145 | −8.1745 | −8.4131 | −8.7720 | −6.5123 | |||
| NOPI12T | AIC | −8.4416 | −8.3101 | −8.2902 | −8.9340 | −8.7311 | −8.6951 | P = 1; Q = 1 | |
| SC | −8.3423 | −8.2502 | −8.2112 | −8.8501 | −8.6523 | −8.5830 | |||
| LIPI | LOILDH | AIC | −3.7029 | −4.2397 | −4.1210 | −2.6711 | −4.3566 | −4.2969 | P = 2; Q = 1 |
| SC | −3.5991 | −4.1001 | −4.0449 | −2.5327 | −4.1521 | −4.0907 | |||
| NOPI4T | AIC | −2.6029 | −4.4518 | −4.3222 | −5.2101 | −5.1166 | −5.0158 | P = 1; Q = 1 | |
| SC | −2.4980 | −4.3721 | −4.2159 | −5.1241 | −5.0721 | −4.9227 | |||
| NOPI12T | AIC | −2.2929 | −4.3380 | −4.2210 | −5.6570 | −5.8204 | −5.2969 | P = 2; Q = 1 | |
| SC | −2.1891 | −4.2452 | −4.1255 | −5.5224 | −5.7714 | −5.0907 |
Source: Authors’ calculations. Note: P denotes the number of lags for the economic activity variable, and Q denotes the number of lags for the oil price measure variable. Selection is based on the Akaike (AIC) and Schwarz (SC) criteria, with the lowest value being selected.
4.3. Dynamic Specifications of the Impact of Different Oil Price Measures on Economic Activity in Morocco
After determining the order of integration of the series and transforming them into stationary form where necessary, the next step is to determine the optimal dynamic structure for each specification using lag selection criteria. The selected specifications thus allow for an examination, within a dynamic framework, of the response of real GDP, real non-agricultural GDP, and the industrial production index (IPI) to various measures of oil price changes: specifically, the linear change in oil prices (OILDH), NOPI4T, and NOPI12T. Each model also incorporates a subsidy regime dummy variable (D_SUBSIDY) to account for the role of subsidy reform and indexation in the relationship between these oil price measures and Moroccan economic activity. This variable is included in the various measures of oil prices. It takes the value 0 for the period 1998Q1–2002Q3, the value 1 for the period 2002Q4–2013Q4, and the value 0 for the period 2014Q1–2024Q4. It makes it possible to account for the change in the petroleum product price subsidy regime in Morocco and to examine its association with the level of economic activity. The value 1 corresponds to the period during which the subsidy scheme is operational, while the value 0 corresponds to the reference periods before and after that scheme.
The selected models are presented below.
1st specification: OIL_DH and economic activity indicators (GDP, non-agricultural GDP, and IPI).
Model 1: Δln( = Δln( + Δln( + Δln( + Δln ( + + ;
Model 2: Δln( = Δln ( + Δln + Δln( + Δln( + + ;
Model 3: Δln ( = Δln ( + + + + ;
2nd specification: NOPI4T and economic activity indicators (GDP, non-agricultural GDP, and IPI).
Model 4: Δln ( = Δln ( + + + + ;
Model 5: Δln ( = Δln ( + ln ( + ( + ( + + + ;
Model 6: Δln ( = Δln ( + Δln + + ( + ( + + ;
3rd specification: NOPI12T and economic activity indicators (GDP, non-agricultural GDP, and IPI).
Model 7: Δln( = Δln( + Δln + Δln( + Δln( + ;
Model 8: Δln( = Δln( + + ( + + ;
Model 9: Δln( = Δln + Δln + + ( + ( + + ;
4.4. Estimation Results
These specifications constitute the empirical framework adopted to analyze the dynamic response of key economic activity indicators to various measures of oil price fluctuations. The analysis focuses on the significance, sign, and temporal dynamics of the estimated coefficients, as well as the role of the D_SUBSIDY variable in he relationship between oil price measures and economic activity. The estimation results for the various specifications are presented in the tables below. They allow for an assessment of the dynamic relationship between oil price fluctuations and Moroccan economic activity and the identification of any changes in this relationship associated with shift in the subsidy regime.
Table 6.
Results of estimates of the linear transmission of oil price variations (OIL_DH) to Moroccan economic activity.
Table 6.
Results of estimates of the linear transmission of oil price variations (OIL_DH) to Moroccan economic activity.
| Model 1: () | Model 2: (_NA). | Model 3: (IPI) | ||||
|---|---|---|---|---|---|---|
| Variable | Coef | Prob. | Coef | Prob. | Coef | Prob. |
| DL( | −0.5550 * | 0.0002 | ||||
| DL( | −0.1185 | 0.3797 | ||||
| DL( | −0.6284 * | 0.0000 | ||||
| DL( | −0.3013 ** | 0.0150 | ||||
| DL | −0.0852 | 0.1628 | ||||
| DL | −0.7371 | 0.9843 | ||||
| DL( | 0.0039 | 0.9522 | 0.0754 | 0.1252 | 0.0458 * | 0.5782 |
| DL( | 0.0176 | 0.3821 | 0.0019 | 0.7825 | 0.0459 * | 0.6265 |
| Constante | 0.0128 * | 0.0029 | 0.0083 | 0.2081 | 0.0177 * | 0.0000 |
| 0.008535 ** | 0.0428 | 0.010742 ** | 0.0352 | 0.010942 *** | 0.0774 | |
| R2 | 0.2334 | 0.7903 | 0.4929 | |||
| R2 ajusté | 0.1892 | 0.7491 | 0.3091 | |||
| Prob. (F-statistic) | 0.0018 | 0.0000 | 0.0001 | |||
| Prob (Test d’autocorrélation Breusch-Godfrey) | 0.3247 | 0.8345 | 0.9831 | |||
| Prob (Test d’hétéroscédasticité Breusch-Pagan-Godfrey) | 0.1881 | 0.8622 | 0.3031 | |||
| Prob. (Jarque-Bera) | 0.7589 | 0.1258 | 0.1319 | |||
Source: Authors’ calculations. Notes: *, **, and *** indicate statistical significance at the 1%, 5%, and 10% levels, respectively. R2 denotes the coefficient of determination, and adjusted R2 its corrected version. The Jarque-Bera test probability assesses the normality of the residuals.
Table 7.
Estimation results for the nonlinear transmission of oil price fluctuations (NOPI4T) to Moroccan economic activity.
Table 7.
Estimation results for the nonlinear transmission of oil price fluctuations (NOPI4T) to Moroccan economic activity.
| Model 4: (GDP) | Model 5: (GDP_NA) | Model 6: (IPI) | ||||
|---|---|---|---|---|---|---|
| Variable | Coef | Prob. | Coef | Prob. | Coef | Prob. |
| DL( | −0.4105 * | 0.0002 | ||||
| DL( | ||||||
| DL( | −0.0852 | 0.1058 | ||||
| DL( | −0.3013 ** | 0.0150 | ||||
| DL | −0.5408 * | 0.0004 | ||||
| DL | ||||||
| −0.0952 * | 0.0116 | 0.2935 | 0.0003 *** | 0.0643 * | 0.0051 * | |
| 0.0157 | 0.7854 | 0.2356 | 0.4801 | |||
| Constante | 0.0055 | 0.3281 | −0.0147 | 0.0977 | 0.0043 | 0.4703 |
| 0.0239 * | 0.0015 | 0.0135 ** | 0.0452 | 0.010942 ** | 0.0374 | |
| R2 | 0.1261 | 0.5232 | 0.2110 | |||
| R2 ajusté | 0.1025 | 0.4911 | 0.1821 | |||
| Prob. (F-statistic) | 0.0034 | 0.0001 | 0.0021 | |||
| Prob(Test d’autocorrélation Breusch-Godfrey) | 0.2414 | 0.5741 | 0.6541 | |||
| Prob(Test d’hétéroscédasticité Breusch-Pagan-Godfrey) | 0.2546 | 0.6521 | 0.4214 | |||
| Prob. (Jarque-Bera) | 0.5219 | 0.4245 | 0.2101 | |||
Source: Authors’ calculations.
Table 8.
Estimation results for the nonlinear transmission of oil price fluctuations (NOPI12T) to Moroccan economic activity.
Table 8.
Estimation results for the nonlinear transmission of oil price fluctuations (NOPI12T) to Moroccan economic activity.
| Model 7: (GDP) | Model 8: (GDP_NA) | Model 9: (IPI) | ||||
|---|---|---|---|---|---|---|
| Variable | Coef | Prob. | Coef | Prob. | Coef | Prob. |
| DL( | −0,4680 * | 0.0002 | ||||
| DL( | ||||||
| DL( | −0.5663 * | 0.0000 | ||||
| DL( | −0.2401 ** | 0.2412 | ||||
| DL | −0.0852 | 0.1628 | ||||
| DL | −0.7371 | 0.9843 | ||||
| 0.0551 | 0.4201 | 0.1650 | 0.0024 | 0.4165 | 0.8502 | |
| 0.1350 | 0.0750 | |||||
| Constante | 0,0045 | 0,2145 | −0,0162 | 0,0774 | 0,0053 | 0,3762 |
| 0.0135 *** | 0.0018 | 0.0125 * | 0.0000 | 0.0275 *** | 0.0852 | |
| R2 | 0.2546 | 0.3812 | 0.6605 | |||
| R2 ajusté | 0.1671 | 0.3021 | 0.6224 | |||
| Prob. (F-statistic) | 0.0011 | 0,0002 | 0.0000 | |||
| Prob(Test d’autocorrélation Breusch-Godfrey) | 0.3247 | 0.8345 | 0.9831 | |||
| Prob(Test d’hétéroscédasticité Breusch-Pagan-Godfrey) | 0.1605 | 0.7072 | 0.2512 | |||
| Prob. (Jarque-Bera) | 0.7732 | 0.2228 | 0.1842 | |||
Source: Authors’ calculations.
5. Robustness Tests for the Estimates
5.1. Goodness-of-Fit, Overall Significance, and Residual Diagnostics
Econometric diagnostics confirm the statistical adequacy of the nine estimated specifications. Overall significance, established via Fisher-Snedecor tests (p < 0.05 for all models), indicates that the explanatory variables are jointly significant in explaining the dependent variables. Regarding residual properties, Breusch-Godfrey tests indicate no evidence of serial correlation, suggesting that the specified dynamics adequately account for temporal dependence in the residuals. Breusch-Pagan-Godfrey tests also fail to reject the null hypothesis of homoscedasticity, indicating that the the conditional variance of the errors is statistically stable and that there is no evidence of heteroscedasticity affecting the estimated standard errors. Furthermore, arque-Bera tests do not reject the null hypothesis of residual normality, supporting the use of standard asymptotic inference for the samples under consideration. Finally, the adjusted R-squared values, ranging from 10.25% to 62.24%, indicate differences in explanatory power depending on the activity variable and the oil shock measure. The consistency of these diagnostic results: absence of autocorrelation, error homoscedasticity, and residual normality, provides a set of complementary findings supporting the reliability of the statistical inferences and the chosen dynamic specification (Greene, 2000; Wooldridge, 2009).
5.2. Model Stability Test
CUSUM-based stability tests indicate that the nine models remain structurally stable throughout the estimation period. As shown in Figure 3, the recursive residual paths remains entirely within the two confidence bands at the 5% significance level. Since these bounds are not crossed, the null hypothesis of parameter stability over the period under review cannot be rejected. This result suggests that there is no evidence of systematic structural instability in the estimated relationships across the three specifications. The observed stability supports the reliability of the estimated coefficients and the robustness of their interpretation, as the estimated relationships do not appear to be driven by parameter instability within the sample studied.
5. Discussion of Results
The findings outline a significant conclusion: the link between oil rates and macroeconomic development of Morocco is defined by a measurement of the oil price touch in question. The logarithm of the price change has no statistically substantial influence on the overall GDP increase, in contrast with NOPI4T, which proves a statistically significant negative link at the 5% level. On the contrary, NOPI12T lacks significant influence on the GDP in general. Meanwhile, the same differentiation can be noticed with a non-agricultural GDP and the IPI; therefore, the Moroccan economy’s impact cannot be generalized and can vary. Therefore, this provides a confirmation to hypothesis H1, which states that fluctuations in oil prices have different economic impacts in Morocco depending on the type of measurement. This conclusion provides an answer to the research question as mentioned above: not every change in oil prices triggers some macroeconomic effect that needs to be considered as such.
The first observation concerns the absence of a statistically significant effect of the logarithmic change in oil prices on aggregate GDP growth. At first glance, this result might appear to contradict the traditional hypothesis that a net oil-importing economy should suffer the consequences of an increase in energy prices. However, it is consistent with a body of literature highlighting that the response of economic activity depends on the transmission mechanism and the institutional context. In the traditional formulation, the conventional linear measure treats an increase that sets a new peak in the same way as an increase that merely corrects a previous decline. However, as highlighted by Hamilton and more recently, Charfeddine, Klein, and Walther (2020), this representation may be insufficient when economic agents react primarily to price increases that effectively alter the reference price level. This finding regarding Morocco thus provides empirical support for this distinction: linear oil price variation is insufficient to explain GDP growth, whereas a measure targeting increases that exceed a recent reference level is more informative. This interpretation is also consistent with the cautious approach of Kilian and Vigfusson (2011, 2013), who argue that non-linearity should not be assumed *a priori* but rather established empirically.
As a result, the lack of a statistically meaningful impact of linear measures does not mean that Morocco’s economy is impervious to fluctuations in oil prices. It merely implies that throughout the 1998Q1–2024Q4 period, fluctuations in the international prices have not led to statistically significant changes in the growth rate of GDP, given the model under consideration. Various particulars of the Moroccan economy are responsible for the weak transmission of this effect. For example, before the reform of the subsidy system, fuel prices in Morocco were, to a certain degree, isolated from international price dynamics. After indexation and liberalization took place, the transmission was improved but still worked through taxation and supply conditions as well as government actions. The variable describing the subsidy system in the model is used to account for this significant institutional change.
This finding aligns with the conclusions of Rajhi, Ben Abdallah, and Hmissi (2005), who found no evident direct connection between the fluctuations of oil prices and the Moroccan economy based on the annual data. The present results also fit with the recent studies conducted on the topic aimed at explaining that the effects of oil prices on Morocco should be interpreted via the transmission mechanism rather than only based on the movements of prices in the international markets. At the same time, the current finding somewhat contradicts the results obtained by Ritahi and Echaoui (2025). The latter observed negative correlation between Brent oil prices surge and the GDP of Morocco based on VECM model applied to annual data. Although the difference between the findings is significant, it does not truly develop an empirical inconsistency between the outcomes. Specifically, their findings are based on long term relationship between Brent oil price and various macroeconomic indicators, and in the current study, the researchers focus on short term effects of the prices movements in relation with the quarterly dynamics being compared to three measures of oil price movements. The result obtained here suggests that the negative association identified in studies using Brent prices may be concentrated in specific types of price increases rather than being associated with every quarterly price fluctuation.
Furthermore, the most significant result concerns NOPI4T. Unlike the linear variation measure, the contemporaneous coefficient for NOPI4T is negative and statistically significant at the 5% level (−0.0078; p = 0.0439). This result support hypothesis H2: the estimated association of significant oil price increases depends on the historical timeframe used to identify them, as the NOPI4T measure reveals a statistically significant effect on aggregate GDP. This result indicates that aggregate GDP is negatively associated with NOPI4T when an oil price increase pushes the current price above its peak level from the preceding four quarters. Thus, the estimated association is not observed for all oil price increases of any rise in oil prices, but rather a response associated with an increase that establishes a new price level relative to the recent past.
This result aligns directly with the logic proposed by Hamilton (1996): a price increase likely to impact economic activity is one that sets a new peak, rather than one that merely represents a recovery. It is also consistent with the findings of Charfeddine, Klein, and Walther (2020), who demonstrate in their re-examination of the oil-growth relationship that “net increase” measures retain explanatory value, even if that power is weaker in recent data. However, the Moroccan case offers an additional nuance: the estimated association captured by the net increase measure is statistically significantemerges at a four-quarter horizon but not at a twelve-quarter horizon. Consequently, it is insufficient to simply contrast “linear” and “non-linear” variation; the choice of historical horizon itself alters the measure’s ability to identify a an exceptional oil price increase.
The economic interpretation of the negative coefficient is consistent with standard transmission mechanisms in an energy-importing economy. An oil price increase that exceeds the maximum observed over the previous four quarters raises the cost of imported energy products and, consequently, increases transportation and energy costs. It also reduces real disposable income when the increase is passed on to consumer prices. However, the result does not allow for a quantitative attribution of the GDP decline to any single one of these mechanisms in isolation. It merely indicates that controlling for other variables in the model oil price increases identified as exceptional using a four-quarter historical window are associated with lower growth.
This conclusion is particularly interesting in light of the findings by Moustabchir et al. (2024). Their DSGE model applied to Morocco shows that oil shocks, particularly in the context of the Russia-Ukraine war, lead to a contraction in the output gap, consumption, and investment, accompanied by a rise in inflation. The alignment with our negative NOPI4T coefficient is therefore economically consistent: in both approaches, an exceptional oil price increase is associated with a deterioration in economic activity. the difference lies in the object identified by each approach: their model isolates a structural oil shock, whereas NOPI4T identifies an exceptional rise in the observed price. This distinction precludes interpreting our result as a causal identification of the shock’s origin, in line with the caveat raised by Kilian (2009).
The result is also consistent with Saidu’s (2024) recent study on eight oil-importing African economies, though only on one specific point: the study demonstrates that the oil-GDP relationship is nonlinear and varies across countries. Conversely, the positive associations reported for several economies in that sample are not observed in the Moroccan estimates. This divergence is economically plausible: a single international shock can have varying effects depending on a country’s production structure, dependence on energy imports, domestic pricing regime, and compensation policies. The findings for Morocco should not, therefore, be generalized to other African economies; on the contrary, net-importer status alone-indicate orter status alone does not determine the direction or magnitude of the estimated oil-growth relationship.
The comparison between NOPI4T and NOPI12T represents one of the study’s main findings. NOPI12T is not statistically significant in the aggregate GDP equation. This difference does not imply that Hamilton’s measure is ineffective when using a long window; rather, it indicate that the historical horizon relevant for characterizing an exceptional price hike depends on the economic context under study.
With NOPI4T, the current price is compared to the maximum of the preceding four quarters. The measure thus detects a relatively recent break likely to rapidly influence consumption, investment, and production decisions. Conversely, NOPI12T requires the current price to exceed the maximum observed over the preceding twelve quarters. This condition is more restrictive. Consequently, some price increases that could be economically significant in the short term are not classified as net increases. The absence of statistical significance for NOPI12T may be related to the difference in the historical reference window between four and twelve quarters. Comparing the two specifications indicates that the reference horizon is a crucial factor in identifying significant oil price hikes: the statistically significant association observed with NOPI4T is not observed with NOPI12T.
This result contributes to the debatethe debate initiated by Hamilton (1996, 2003). While that earlier work highlights the value of net increases in identifying economically relevant oil price movements, the findings from Morocco indicate that the statistical relevance of the reference window may depend on the data frequency and the economic relationship being examined. They also align with the cautious stance of Kilian and Vigfusson (2011, 2013), who caution against assuming that nonlinear transformations are automatically superior. In our case, such superiority is precisely not universal: NOPI4T is statistically significant in the GDP equation, whereas NOPI12T is not.
The behavior of non-agricultural GDP provides an important complement to the results obtained for overall GDP. Unlike the latter, non-agricultural GDP is positively associated with linear changes in oil prices, with a contemporaneous coefficient of 0.0328 and a lagged coefficient of 0.0359, both significant at the 1% level. This result should not be interpreted as implying that rising oil prices directly improve the productivity of the non-agricultural economy. Rather, it indicates that, within the estimated dynamics, oil price movements are positively associated with non-agricultural GDP.
This difference between aggregate GDP and non-agricultural GDP is particularly significant in the Moroccan context. Total GDP is heavily influenced by agricultural output, which is itself highly sensitive to rainfall conditions. Consequently, the association between oil price changes and aggregate GDP growth may be masked, amplified, or offset by fluctuations in agricultural output. Thus, the absence of a statistically significant linear association with aggregate GDP growth does not necessarily imply an absence of transmission to the non-agricultural sector.
A comparison with the results for NOPI4T and NOPI12T reinforces this conclusion. The coefficient on NOPI4T becomes positive and statistically significant with a one-quarter lag in the non-agricultural GDP equation (0.1013; p = 0.0004), while the coefficient on NOPI12T is positive and statistically significant in the current quarter (0.1485; p = 0.0092). The positive sign observed for these two measures thus contrasts with the negative sign of NOPI4T in the overall GDP equation. This divergence represents an economically relevant empirical finding rather than, in itself, evidence of an econometric anomaly: it indicates that the estimated association for non-agricultural activityto episodes of exceptional oil price increases differs from that of overall economic activity. The results support hypothesis H3: the estimated association between oil price fluctuations and economic activity varies across the activity indicators used, with the estimated responses of GDP, non-agricultural GDP, and the IPI differing in terms of sign and significance.
This result contrasts with studies that generally identify a negative effect of oil price increases on output in importing economies, notably Ritahi and Echaoui (2025) for Morocco. It also differs from the negative result obtained by Moustabchir et al. (2024) within their DSGE framework. However, this divergence should be interpreted with caution. Those studies examine aggregate GDP or the output gap, whereas our specification isolates non-agricultural GDP and employs indicators of net price increases. The positive association may therefore reflect the macroeconomic conditions prevailing during certain periods of rising oil prices, rather than a beneficial causal effect of higher oil prices. Such caution is all the more necessary given that Kilian (2009) demonstrates that a price increase alone is insufficient to identify the source of the shock.
The estimates for the IPI reveal that the results are sensitive to the choice of measure for oil price fluctuations. With OIL_DH, the coefficients associated with oil price changes are not statistically significant. Conversely, the coefficient on NOPI4T is positive and statistically significant in the contemporaneous period (0.0643; p = 0.0051), whereas its lagged component does not. However, this relationship is not observed with NOPI12T. This pattern aligns with the work of Mork (1989), Lee, Ni, and Ratti (1995), and Hamilton (1996), who highlight that the relationship between oil prices and economic activity can vary depending on how oil price movements are measured.
A comparison of the three specifications thus indicate that, for the IPI, results depend on both the chosen measure of oil price fluctuations and the historical reference window used to identify exceptional increases. The positive coefficient on NOPI4T reflects a positive statistical association and does not establish a positive causal effect of oil prices on industrial production. Furthermore, diagnostic tests for this specification provide no evidence of serial correlation or heteroskedasticity and do not reject the null hypothesis of residual normality. These results underscore the sensitivity of the oil–IPI relationship to the definition of oil price movements and support the value of comparing linear and nonlinear specifications.
The Moroccan institutional context is a very important factor in interpreting the relationship between oil price fluctuations and economic activity. The dummy variable distingshing the subsidy period (2002Q4–2013Q4) has a statistically significant across all nine estimated specifications, covering GDP, non-agricultural GDP, and the Industrial Production Index (IPI), as well as the OIL_DH, NOPI4T, and NOPI12T measures. This result ndicates that the conditional level of the activity indicator in question is higher during the subsidy period (2002Q4–2013Q4) than during the non-subsidy periods, covering 1998Q1–2002Q3 and 2014Q1–2024Q4. This result highlights a statistically significant difference in the level of economic activity between the subsidy period and the non-subsidy periods, thereby providing empirical support for hypothesis H4. However, this relationship should be interpreted as a difference associated with the subsidy regime rather than as a causal effect of the reform, since the dummy variable alone does not make it possible to establish a causal relationship.
This pattern can be viewed in the context of the evolution of Morocco’s price compensation system. Prior to the reform, subsidies served to absorb a portion of international energy price fluctuations. Beginning in 2013, Morocco gradually introduced price indexation for certain petroleum products to international rates, before subsidies for these products were phased out in 2014–2015 (IMF, 2014, 2015; OECD, 2014). This shift reduced the State’s role in directly absorbing international fluctuations and increased the exposure of domestic economic agents to international market conditions.
In this context, the closure of the SAMIR refinery in 2015 is a particularly significant factor. It occurred after the indexation and subsidy-removal process had begun and altered supply conditions in the Moroccan market. The OECD highlights that, following this closure, Morocco became fully reliant on imports of oil and petroleum products, and that the loss of significant storage capacity poses a concern for security of supply (OECD, 2019). Thus, the combination of reduced price- compensation mechanisms and the refinery’s closure may have increased the exposure of consumers and businesse to international oil market conditions.
This institutional development must also be viewed in light of the literature regarding the relationship between oil prices and economic activity. Research by Mork (1989), Lee, Ni, and Ratti (1995), and Hamilton (1996, 2003) shows that the response of economic activity to oil price fluctuations can depend on the direction and magnitude of price movements. Kilian and Vigfusson (2011) also emphasize the importance of the model specification used to assess asymmetric responses. In the case of Morocco, this issue has an additional dimension, as the extent to which international price fluctuations are transmitted depends on the institutional framework governing price formation.
Furthermore, data on the functioning of the fuel market confirm that the transmission of international price fluctuations is not necessarily proportional. Notably, the Competition Council has documented discrepancies between trends in international benchmark prices and pump prices, as well as significant shifts in distributor margins during certain periods (Competition Council, 2022). This observation reinforces the view that the international price used in the estimates serves as a measure of external oil market conditions but does not necessarily reflect the prices actually paid by households and businesses.
Thus, the subsidy reform, progressive indexation, and the closure of SAMIR constitute three relevant institutional factors for understanding how the Moroccan economy’s exposure to international oil price fluctuations has evolved. The statistical significance of the institutional variable across the nine models indicates that “this institutional dimension is relevant when interpreting the results. It complements the differences observed between OIL_DH, NOPI4T, and NOPI12T, highlighting that the relationship between oil prices and economic activity depends jointly on the measure of oil price fluctuations, he historical reference window, and the institutional framework.
The study’s contribution lies in the sensitivity of the results to the measurement of oil price movements, the historical time horizon, and the activity indicator used. Regarding GDP, OIL_DH shows no significant effect, whereas OPI4T is associated with a statistically significant negative effect. With NOPI12T, this association is no longer statistically significant. The results thus demonstrate that characterizing the relationship between oil prices and economic activity depends on the empirical definition of the oil price increase and the historical window selected.
The results support H1, H2, and H3. H1 is supported by the difference between linear and nonlinear measures; H2 by the difference between the four quarter and twelve quarter horizons; and H3 by the heterogeneity of results across GDP, non-agricultural GDP, and the IPI. H4 receives partiel support: the institutional variable is statistically significant in all nine specifications at the chosen significance level, but its additive nature identifies a difference in the intercept between the periods under review rather than a change in the marginal effect of oil price movements.
This distinction is particularly relevant in the Moroccan context. The partial indexation introduced in 2013 was followed by the gradual removal of subsidies on petroleum products and the liberalization of petroleum product prices. The closure of SAMIR in 2015 subsequently increased the domestic market’s reliance imported petroleum products. These institutional changes reduced mechanisms for directly absorbing international price fluctuations, yet the analysis does not allow the specific effect of each of these changes to be econometrically isolated the specific impact of each of these transformations (IMF, 2014, 2015; OECD, 2014, 2019).
The results thus suggest that the exposure of Moroccan economic activity to oil price fluctuations cannot be assessed solely on the basis of linear price variations. Exceptional increases identified using a four-quarter reference window are significantly associated with GDP growth, whereas no statistically significant association is observed for linear variations or increases identified using a twelve-quarter reference window. This differential sensitivity across activity indicators, also highlights the importance of the production structure when analyzing the effects of oil price changes.
Finally, the results must be interpreted with the model’s parsimony in mind. The model does not distinguish the origins of oil price fluctuations, even though an observed increase may reflect supply-side shocks, global demand shocks, or oil-market-specific factors (Kilian, 2009). Similarly, the institutional variable does not capture the full range of institutional changes implemented during the period. A natural extension, therefore, would be to incorporate domestic fuel prices, distinguish between the sources of oil shocks, and explicitly test for interactions between the oil price measure and the institutional period.
6. Conclusions
The analysis shows that the relationship between oil prices and Moroccan economic activity depends on how price fluctuations are measured. The linear specification based on OIL_DH reveals no statistically significant effect on the activity indicators considered. In contrast, the NOPI4T measure indicates a statistically significant negative association of exceptional oil price hikes on aggregate GDP. This result is not observed with the NOPI12T measure. Comparing the three specifications thus demonstrates that identifying an exceptional oil price hike depends on the historical timeframe selected: a rise exceeding the maximum of the previous four quarters does not necessarily correspond to an increase exceeding the maximum of the previous twelve quarters. The observed differences in estimates therefore stem, at least in part, from the different types of episodes identified by each measure.
The estimated response of economic activity also varies across the indicators used. GDP, non-agricultural GDP, and the Industrial Production Index do not exhibit the same signs or levels of statistical significance. Consequently, it would be inappropriate to infer the Moroccan economy’s response to oil price fluctuations based solely on GDP. This heterogeneity is particularly significant in an oil-importing economy, where the impact of an international price fluctuation depends on the structure of economic activity and the way in which that fluctuation is transmitted to economic agents.
The Moroccan context provides an important element for interpreting these results. During part of the period under study, compensation mechanisms may have limited the pass-through of international energy price fluctuations to domestic prices. Thus, an increase in international prices did not necessarily translate into an increase of the same magnitude in the price paid by households and businesses. The results obtained using the linear measure, together with the positive coefficients observed in some specifications, must be interpreted in light of this characteristic. The evidence presented supports the idea of the incomplete transmission of international shocks to the domestic economy; however, it does not provide enough grounds to link this phenomenon to the compensation scheme. The fact that the institutional variable is statistically significant across the nine specifications also highlights the fact that there were differences due to the particular periods taken into consideration but causes between reforms and the relationship between oil price and economic activity were not established.
The time under review ought also to be analyzed against a backdrop characterized by several exceptional shocks. The COVID-19 pandemic caused a considerable decline of the global economy and important disruptions in the market of oil, the Russia—Ukraine war started in 202 exacerbated the situation in the energy markets increasing worldwide prices. It is highly possible that such events affected oil prices simultaneously with the Moroccan economic activity. Consequently, the coefficients associated with the most recent observations call for cautious interpretation: the measures used in this study capture price movements but do not allow these fluctuations to be directly attributed to specific geopolitical or health-related factors or to particular supply shocks. Explicitly accounting for these factors would therefore constitute a natural extension of the analysis.
Findings reveal important information concerning the non-linearity debate. On the contrary, their implications do not allow us to conclude that NOPI4T is a better indicator than OIL_DH or NOPI12T. These findings demonstrate that the selected measure changes the identification of price increase instances and its impact. This statement is in line with studies showing the need for empirical validation of nonlinear measures and their implications that vary over time, horizon, and economic variable. Moreover, in this context, the measures analyzed reflect the status of oil prices rather than the character of the shock. In particular, the increase in prices can be defined by supply factors and global demand, which do not always lead to the same outcomes for the Moroccan economy.
Nevertheless, the outcomes of the results are limited because the data is not available. One major limitation is that it was not possible to find a long enough quarterly time series data before 1998 to expand the computation to earlier periods and analyze the relationship between oil prices and economic activity in different cycles and economic conditions. This point is highly important for the NOPI calculations as the obtained indices are based on the comparison of current prices with previous periods. Thus, the findings have to be interpreted within the limits of the available time span. Furthermore, another limitation of the dummy variable is that it identifies a difference in the level of activity between regimes but does not, on its own, make it possible to determine whether the sensitivity of activity to oil price fluctuations differs across regimes.
There are two potential directions for future research. First, creating a longer quarterly dataset would allow verifying the findings in the different time periods whenever they become available. Second, the pass-through of international prices to domestic prices can be evaluated directly. The pass-through measure separated for each of the various types of energy products would give an opportunity to find out to what extent the compensation mechanism reduced the influence of the international prices, as well as find out if any change in the dynamics of this process happened over time.
Finally, extending the analysis to structural models would make it possible to distinguish between the different sources of oil price fluctuations and avoid treating every observed increase as the same type of oil price shock. Regime-switching or time-varying parameter models could, in turn, examine whether the estimated relationship has changed alongside the evolution of the compensation system. Such extensions would allow for a better separation of three potential sources of variation in the results: the statistical definition of oil price movements, the structure of Moroccan economic activity, and the evolution of the institutional mechanism for domestic price formation.
On the whole, the findings suggest that it is impossible to apply a single linear specification in describing the interplay between oil prices and Moroccan economy. This is attributable to the fact that the understanding of oil price increase, the reference time-frame and the indicator of economic activity have an impact on the expected results; meanwhile, the compensation regime emerges as an institutional factor that plays an important part in understanding the reasons for the observed weak or diverse relationships. Speaking about total GDP, it must be stressed that among the three alternatives available, only the NOPA4T measure demonstrates a significant connection between the increased oil price. Specifically, this is the only measure that discloses significant and immediate relationship between the oil prices and GDP for four quarters but not for 12 quarters. However, this pattern does not extend to the non-agricultural GDP or industrial index, which emphasizes the necessity to choose the correct indicator.
Funding
This research received no external funding.
Institutional Review Board Statement
Not applicable.
Informed Consent Statement
Not applicable.
Data Availability Statement
The original contributions presented in this study are included in the article. Further inquiries can be directed to the corresponding author.
Conflicts of Interest
The authors declare no conflicts of interest.
| 1 | International Energy Agency. |
| 2 | |
| 3 | The real oil price in dirhams is deflated by the Moroccan Consumer Price Index, whereas the price in dollars is deflated by the global Consumer Price Index. |
References
- Akaike, H. A new look at the statistical model identification. IEEE Trans. Autom. Control 1974, 19, 716–723. [Google Scholar] [CrossRef]
- Arrêté du ministre de l’énergie et des mines n° 43–95 du 27 rajeb 1415 (30 décembre 1994) relatif à la fixation des prix de reprise en raffinerie et de vente des combustibles liquides et du butane.
- Arrêté du ministre de l’industrie, du commerce, de l’énergie et des mines n° 1144-02 du 4 joumada I 1423 (15 juillet 2002) modifiant l’arrêté du ministre de l’énergie et des mines n°43-95 du 27 rajeb 1415 (30 décembre 1994) relatif à la fixation des prix de reprise en raffinerie et de vente des combustibles liquides et du butane.
- Arrêté du ministre délégué auprès du Chef dп gouvernement, chargé des affaires générales et de la gouvernance n° 3894-13 du 23 safar 1435 (27 décembre 2013) modifiant et complétant l’arrêté n° 2380-06 du 30 ramadan 1427 (23 octobre 2006) relatif à la fixation des prix de reprise en raffinerie et de vente des combustibles liquides et du butane.
- Balcilar, M.; Usman, O. Exchange rate and oil price pass-through in the BRICS countries: Evidence from the spillover index and rolling-sample analysis. Energy 2021, 229, 120666. [Google Scholar] [CrossRef]
- Beckmann, J.; Agyapong, J. Media Sentiment and Oil Price Expectations; SAGE: Los Angeles, CA, USA, 2026. [Google Scholar]
- Benameur, A.G.; Belarbi, Y.; Toumache, R. The macroeconomic effects of oil prices fluctuations in Algeria: An SVAR approach. Les. Cah. CREAD 2020, 36, 59–82. [Google Scholar]
- Borozan, D.; Cipcic, M.L. Asymmetric and nonlinear oil price pass-through to economic growth in Croatia: Do oil-related policy shocks matter? Resour. Policy 2022, 76, 102736. [Google Scholar] [CrossRef]
- Brown, S.P.A.; Yücel, M.K. Oil prices and U.S. aggregate economic activity: A question of neutrality. Econ. Financ. Policy Rev. 1999, 1999, 16–23. [Google Scholar]
- Bruno, M.; Sachs, J.D. Economics of Worldwide Stagflation; Harvard University Press: Cambridge, MA, USA, 1985. [Google Scholar] [CrossRef]
- Burbidge, J.; Harrison, A. Testing for the effects of oil-price rises using vector autoregressions. Int. Econ. Rev. 1984, 25, 459–484. [Google Scholar] [CrossRef]
- Caisse de compensation. (2009–2018). Rapports d’activité. Royaume du Maroc.
- Charfeddine, L.; Klein, T.; Walther, T. Reviewing the oil price–GDP growth relationship: A replication study. Energy Econ. 2020, 88, 104786. [Google Scholar] [CrossRef]
- Chiang, T.C. Effect of Climate Changes, Induced Risks, and Oil Price Appreciation on Energy Stock Returns in World Markets. In International Studies of Economics; John Wiley & Sons: Hoboken, NJ, USA, 2025. [Google Scholar]
- Conseil de la Concurrence (2023). Communiqué relatif aux accords transactionnels concernant les sociétés actives dans l’approvisionnement, le stockage et la distribution du gasoil et de l’essence. Royaume du Maroc.
- Conseil de la concurrence (2024). Rapport annuel 2023. Royaume du Maroc.
- Conseil de la concurrence. (2024). Reporting du 1er trimestre de l’année 2024 relatif au suivi des engagements pris par les sociétés de distribution en gros du gasoil et d’essence dans le cadre des accords transactionnels conclus avec le Conseil de la concurrence. Royaume du Maroc.
- Cour des comptes (2014). e système de compensation au Maroc: Diagnostic et propositions de réforme. Royaume du Maroc, Cour des comptes.
- Cunado, J.; De Gracia, F.P. Do oil price shocks matter? Evidence for some European countries. Energy Econ. 2003, 25, 137–154. [Google Scholar] [CrossRef]
- Cunado, J.; Pérez de Gracia, F. Oil prices, economic activity and inflation: Evidence for some Asian countries. Q. Rev. Econ. Financ. 2005, 45, 65–83. [Google Scholar] [CrossRef]
- Deng, X.; Xu, F. Asymmetric effects of international oil prices on China’s PPI in different industries—Research based on NARDL model. Energy 2024, 290, 130113. [Google Scholar] [CrossRef]
- Dickey, D.A.; Fuller, W.A. Distribution of the estimators for autoregressive time series with a unit root. J. Am. Stat. Assoc. 1979, 74, 427–431. [Google Scholar] [CrossRef]
- Diop, M.M.; Fame, A. Impact de la hausse du prix du pétrole sur la stabilité macroéconomique. Direction de la Prévision et des Études Économiques, Document de travail n° 1.
- Engle, R.F.; Granger, C.W.J. Co-integration and error correction: Representation, estimation, and testing. Econometrica 1987, 55, 251–276. [Google Scholar] [CrossRef] [PubMed]
- Ferderer, J.P. Oil price volatility and the macroeconomy. J. Macroecon. 1996, 18, 1–26. [Google Scholar] [CrossRef]
- Francis, N.; Restrepo-Ángel, S. Sectoral and aggregate response to oil price shocks in the Colombian economy: SVAR and Local Projections approach. Borradores de Economía, (Borradores de Economía; No. 1055).
- Greene, W.H.; Zhang, C. Econometric Analysis; Prentice Hall: Upper Saddle River, NJ, USA, 2000; Volume 5. [Google Scholar]
- Gülay, E.; Pazarlıoğlu, M.V. The empirical role of real crude oil price and real exchange rate on economic growth: The case of turkey. Ege Acad. Rev. 2016, 16, 627–639. [Google Scholar]
- Hamilton, J.D. Oil and the macroeconomy since World War II. J. Political Econ. 1983, 91, 228–248. [Google Scholar] [CrossRef]
- Hamilton, J.D. This is what happened to the oil price-macroeconomy relationship. J. Monet. Econ. 1996, 38, 215–220. [Google Scholar] [CrossRef]
- Hamilton, J.D. What is an oil shock? J. Econom. 2003, 113, 363–398. [Google Scholar] [CrossRef]
- Herrera, A.M.; Lagalo, L.G.; Wada, T. Oil price shocks and industrial production: Is the relationship linear? Macroecon. Dyn. 2011, 15, 472–497. [Google Scholar] [CrossRef]
- Hooker, M.A. What happened to the oil price-macroeconomy relationship? J. Monet. Econ. 1996, 38, 195–213. [Google Scholar] [CrossRef]
- Hwang, I.; Kim, J. Oil price shocks and macroeconomic dynamics: How important is the role of nonlinearity? Empir. Econ. 2024, 66, 1043–1074. [Google Scholar] [CrossRef]
- IEA. Energy Policies Beyond IEA Countries: Morocco 2014, Energy Policies Beyond IEA Countries; IEA: Paris, France, 2014. [Google Scholar] [CrossRef]
- International Monetary Fund (IMF). Morocco: Staff Report for the 2014 Article IV Consultation. IMF Staff Country Reports, 2015(043); International Monetary Fund: Washington, DC, USA, 2015. [Google Scholar] [CrossRef]
- International Monetary Fund. Morocco: Request for an Arrangement Under the Precautionary and Liquidity Line and Cancellation of the Current Arrangement (IMF Staff Country Report No. 14/241); International Monetary Fund: Washington, DC, USA, 2014. [Google Scholar]
- International Monetary Fund. Morocco: Staff Report for the 2013 Article IV Consultation (IMF Staff Country Report No. 14/65); International Monetary Fund: Washington, DC, USA, 2014. [Google Scholar] [CrossRef]
- International Monetary Fund. Morocco: Ex Post Evaluation of Exceptional Access Under the 2012 Precautionary and Liquidity Line Arrangement (IMF Staff Country Report No. 15/231); International Monetary Fund: Washington, DC, USA, 2015. [Google Scholar]
- International Monetary Fund. Morocco: Staff Report for the 2014 Article IV Consultation (IMF Staff Country Report No. 15/43); International Monetary Fund: Washington, DC, USA, 2015. [Google Scholar] [CrossRef]
- International Monetary Fund. Morocco: 2015 Article IV Consultation—Press Release; staff Report; and Statement by the Executive Director for Morocco (IMF Staff Country Report No. 16/35); International Monetary Fund: Washington, DC, USA, 2016. [Google Scholar] [CrossRef]
- Jbir, R.; Zouari-Ghorbel, S. Recent oil price shock and Tunisian economy. Energy Policy 2009, 37, 1041–1051. [Google Scholar] [CrossRef]
- Karaki, M.B. Nonlinearities in the response of real GDP to oil price shocks. Econ. Lett. 2017, 161, 146–148. [Google Scholar] [CrossRef]
- Kilian, L. Not all oil price shocks are alike: Disentangling demand and supply shocks in the crude oil market. Am. Econ. Rev. 2009, 99, 1053–1069. [Google Scholar] [CrossRef]
- Kilian, L.; Hicks, B. Did unexpectedly strong economic growth cause the oil price shock of 2003–2008? J. Forecast. 2013, 32, 385–394. [Google Scholar] [CrossRef]
- Kilian, L.; Vigfusson, R.J. Nonlinearities in the oil price-output relationship. Macroecon. Dyn. 2011, 15, 337–363. [Google Scholar] [CrossRef]
- Kilian, L.; Vigfusson, R.J. Are the responses of the U.S. economy asymmetric in energy price increases and decreases? Quant. Econ. 2011, 2, 419–453. [Google Scholar] [CrossRef]
- Kilian, L.; Vigfusson, R.J. Do oil prices help forecast U.S. real GDP? The role of nonlinearities and asymmetries. J. Bus. Econ. Stat. 2013, 31, 78–93. [Google Scholar] [CrossRef]
- Kumar, S. The macroeconomic effects of oil price shocks: Empirical evidence for India. Econ. Bull. 2009, 29, 15–37. [Google Scholar]
- Lee, K.; Ni, S.; Ratti, R.A. Oil shocks and the macroeconomy: The role of price variability. Energy J. 1995, 16, 39–56. [Google Scholar] [CrossRef]
- Loungani, P. Oil price shocks and the dispersion hypothesis. Rev. Econ. Stat. 1986, 68, 536–539. [Google Scholar] [CrossRef]
- Majidli, F.; Guliyev, H. How oil price and exchange rate affect non-oil GDP of the oil-rich country: Azerbaijan? Int. J. Energy Econ. Policy 2020, 10, 123–130. [Google Scholar] [CrossRef]
- Malik, A. Crude oil price, monetary policy and output: The case of Pakistan. Pak. Dev. Rev. 2008, 47, 425–436. [Google Scholar] [CrossRef]
- Ministère de l’Économie et des Finances, Direction des Études et des Prévisions Financières. (2016). Situation et perspectives de l’économie nationale. Royaume du Maroc.
- Ministère de l’Économie et des Finances. (2014). Rapport sur la compensation. Royaume du Maroc.
- Moreno, P.; Figuerola-Ferretti, I.; Muñoz, A. Forecasting oil prices with non-linear dynamic regression modeling. Energies 2024, 17, 2182. [Google Scholar] [CrossRef]
- Mork, K.A. Oil and the macroeconomy when prices go up and down: An extension of Hamilton’s results. J. Political Econ. 1989, 97, 740–744. [Google Scholar] [CrossRef]
- Mukhtarov, Ş.; Aliyev, S.; Zeynalov, J. The effect of oil prices on macroeconomic variables: Evidencfrom azerbaijan. Int. J. Energy Econ. Policy 2020, 10. [Google Scholar] [CrossRef]
- Nibbering, D. Forecasting carbon emissions using asymmetric grouping. J. Forecast. 2024. [Google Scholar] [CrossRef]
- Organisation de Coopération et de Développement Économiques. OECD Economic Surveys: Morocco 2024; OECD Publishing: Paris, France, 2024. [Google Scholar] [CrossRef]
- Papapetrou, E. Oil price shocks, stock market, economic activity and employment in Greece. Energy Econ. 2001, 23, 511–532. [Google Scholar] [CrossRef]
- Phillips, P.C.B.; Perron, P. Testing for a unit root in time series regression. Biometrika 1988, 75, 335–346. [Google Scholar] [CrossRef]
- Presno, I.; Prestipino, A. Oil price shocks and inflation in a DSGE model of the global economy. FEDS Notes. Board of Governors of the Federal Reserve System. [CrossRef]
- Rajhi, T.; Benabdallah, M.; Hmissi, W. Impact des Chocs Pétroliers sur les Économies Africaines: Une Enquête Empirique; Banque Africaine de Développement: Abidjan, Côte d’Ivoire, 2005. [Google Scholar]
- Saidu, M.T. Does price of oil and inflation have an impact on the GDP of Africa’s largest net oil importers? Evidence from a non-linear heterogeneous panel ARDL. OPEC Energy Rev. 2024, 48, 36–47. [Google Scholar] [CrossRef]
- Schwarz, G. Estimating the dimension of a model. Ann. Stat. 1978, 6, 461–464. [Google Scholar] [CrossRef]
- Serletis, A.; Istiak, K. Is the oil price–output relation asymmetric? J. Econ. Asymmetries 2013, 10, 10–20. [Google Scholar] [CrossRef]
- Shen, Y.; Gu, Z.; Abeysinghe, T.; Shi, X. Revisiting the impact of oil price shocks on macroeconomic performance: An international perspective. Econ. Model. 2025, 144, 106964. [Google Scholar] [CrossRef]
Figure 1.
Logarithm of the real oil price in USD and DH (1998Q1–2024Q4). Source: Prepared by us.
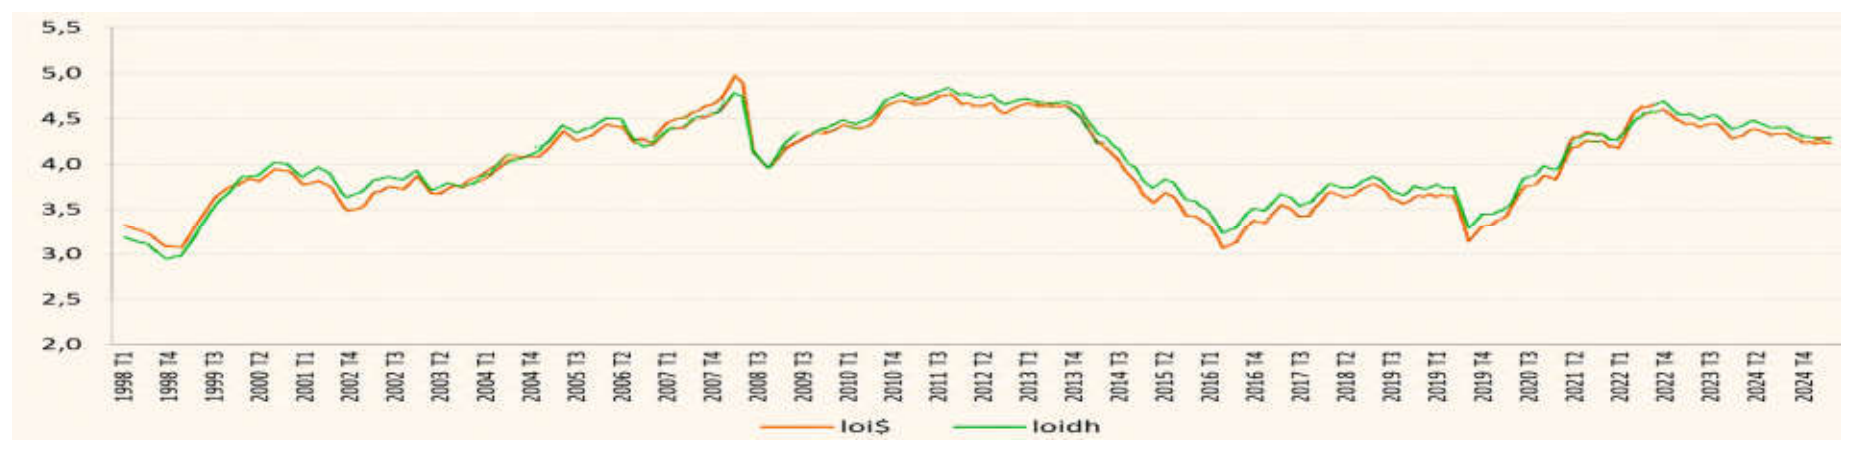
Figure 3.
Stability test results for the nine models. Source: Authors’ calculations.
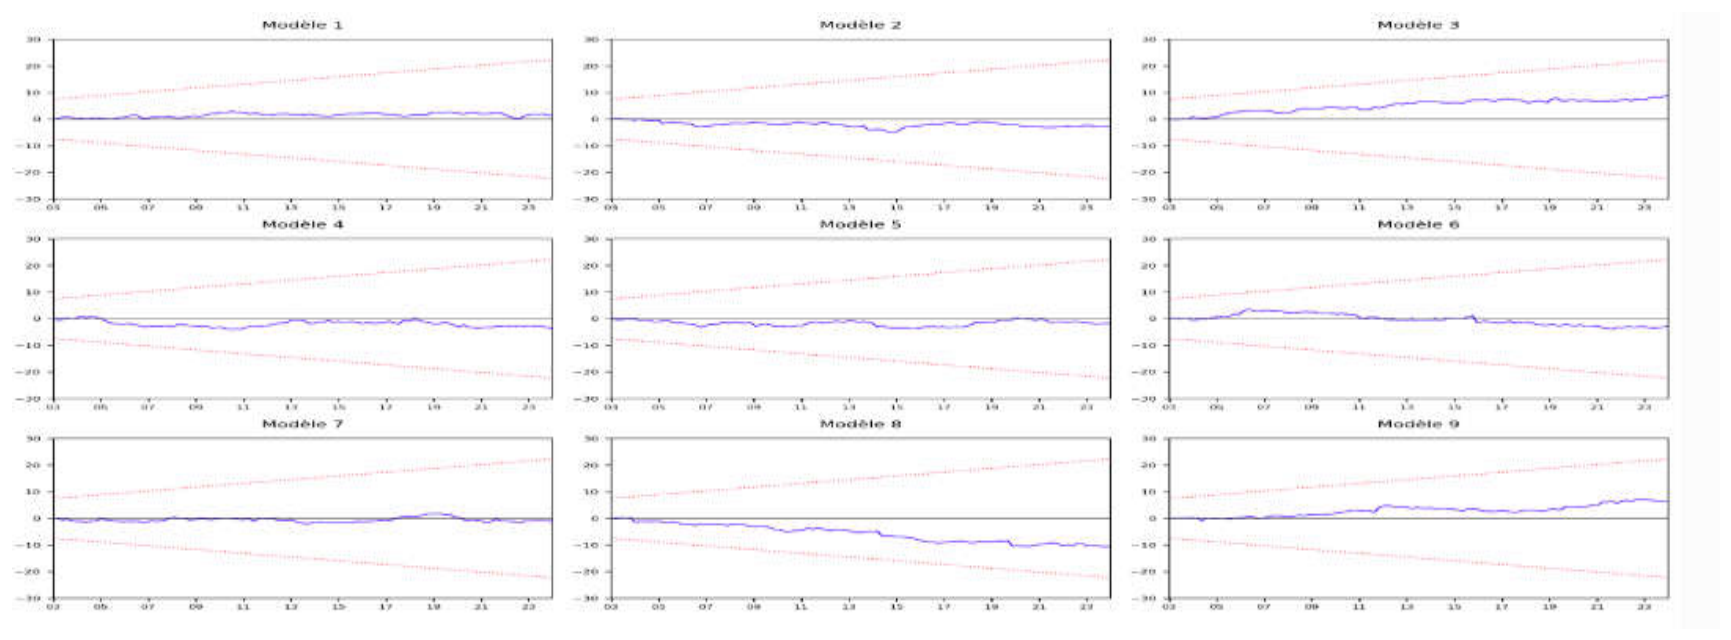
Table 4.
Summary of Engle–Granger cointegration tests.
| Activity Variable | ADF Statistic for Residuals | p-Value (MacKinnon) | Critical Value at 5% | Decision | Cointegration |
|---|---|---|---|---|---|
| LGDP | −0.7482 | 0.7821 | −1.9457 | H0 not rejected | No |
| LGDP_NA | −3.7585 | 0.3726 | −3.4940 | H0 non rejetée | No |
| LIPI | −4.8416 | 0.4188 | −3.4892 | H0 not rejected | No |
Source: Authors’ calculations. Note: The Engle–Granger cointegration test is based on the ADF test applied to the residuals of the long-run relationship. H0: the residuals are non-stationary, indicating the absence of cointegration. Rejection of H0 indicates the existence of a cointegration relationship. The p-values are those of MacKinnon (1996).
Disclaimer/Publisher’s Note: The statements, opinions and data contained in all publications are solely those of the individual author(s) and contributor(s) and not of MDPI and/or the editor(s). MDPI and/or the editor(s) disclaim responsibility for any injury to people or property resulting from any ideas, methods, instructions or products referred to in the content. |
© 2026 by the authors. Licensee MDPI, Basel, Switzerland. This article is an open access article distributed under the terms and conditions of the Creative Commons Attribution (CC BY) license (http://creativecommons.org/licenses/by/4.0/).
Copyright: This open access article is published under a Creative Commons CC BY 4.0 license, which permit the free download, distribution, and reuse, provided that the author and preprint are cited in any reuse.