

Submitted:
25 September 2026
Posted:
28 September 2026
You are already at the latest version
Abstract
Vehicular Ad-Hoc Networks (VANETs) face rapid topology changes, intermittent connectivity, and density-dependent contention. Conventional reactive protocols such as Ad hoc On-demand Distance Vector (AODV) discover routes on demand but do not explicitly favor relays with compatible motion. This paper presents FlockHocNet, a decentralized reactive VANET routing protocol that maps the flocking rules of cohesion, alignment, and separation to relay suitability. Each vehicle derives a local flocking score from one-hop position and velocity, propagates the weakest score along route requests, and combines this bottleneck with link, latency, and hop-quality terms during route selection. FlockHocNet also integrates flocking-aware request prioritization, provisional fast replies, guarded backup routes, link-layer feedback, Link Expiration Time prediction, and two-hop local repair. The protocol is implemented in ns-3.46.1 and evaluated against AODV using 600 paired simulations on two real OpenStreetMap road graphs in Montreal, with SUMO-generated mobility, five network sizes, and 30 paired seeds per size and environment. At 100 vehicles, FlockHocNet improves mean packet delivery ratio by 8.04% on the highway and 17.98% in the urban scenario; urban normalized routing load decreases by 58.28%. The results show that flocking compatibility is most effective when sufficient relay diversity exists, while sparse networks expose an overhead-reliability trade-off.
Keywords:
VANET
; FlockHocNet
; bio-inspired routing
; flocking
; Boids
; AODV
; mobility-aware routing
; link stability
; predictive route maintenance
; ns-3
1. Introduction
Vehicular Ad-hoc Networks (VANETs) are a communication substrate for cooperative intelligent transportation systems (ITS), enabling direct vehicle-to-vehicle (V2V) and, where infrastructure is present, vehicle-to-infrastructure (V2I) exchange for safety, traffic coordination, sensing, and infotainment services [1,2]. The networking problem differs fundamentally from comparatively slower mobile ad hoc settings: vehicles move rapidly along constrained road structures, relative velocities can be large, neighborhood membership changes quickly, and wireless links may disappear before a route discovered only moments earlier has delivered useful traffic. Routing therefore has to balance path reachability, delay, route lifetime, signaling cost, and adaptation speed rather than optimize only shortest paths.
Classic topology-based Mobile Ad-Hoc Network (MANET) protocols provide important baselines. Ad hoc On-demand Distance Vector (AODV) creates routes on demand through route-request (RREQ) flooding and sequence-number-based freshness [3]; Dynamic Source Routing (DSR) carries source routes and relies heavily on route caching [4]; and Optimized Link State Routing (OLSR) proactively maintains topology information through optimized relay dissemination [5]. In rapidly changing vehicular topologies, these design choices create different liabilities: reactive discovery can be repeated after link breaks, cached paths can become stale, and proactive dissemination can consume control capacity even when many destinations are inactive. Geographic forwarding reduces global state by using local position information, as exemplified by Greedy Perimeter Stateless Routing (GPSR) [6], while urban schemes such as Greedy Traffic-Aware Routing (GyTAR) incorporate traffic and road-junction structure [7]. Nevertheless, a relay that is geographically attractive at the current instant can still be a poor choice if it is moving rapidly away, crossing the trajectory, or residing near the edge of the useful local neighborhood. Recent direction-aware work confirms that motion compatibility remains a central source of routing stability in highly dynamic VANETs [8].
A second line of research uses multi-criteria, learning, or bio-inspired optimization to turn local observations into more adaptive routing decisions. Recent work has explored junction stability with Intelligent Water Drops [9], ant-colony optimization for multi-junction or clustered routing [10,11], link-stability optimization inspired by sticky bacteria [12], fuzzy mobility-aware route selection [13], and learning-assisted AODV variants [14]. Bio-inspired VANET routing is not new as a general paradigm [15]; however, many swarm-inspired designs perform global or path-level optimization, and not all mechanisms labelled “flocking” implement explicit local analogues of the canonical flock rules.
FlockHocNet takes a different approach. It starts from Reynolds’ distributed flocking model [16], in which coherent collective behavior emerges from local rules, and translates the three rules into network relay suitability: cohesion favors useful local proximity, alignment favors velocity compatibility, and separation avoids excessively short, redundant relays. Vehicles are never steered by the routing protocol; their trajectories remain externally determined. The resulting local flocking quality influences whether a node relays an RREQ, when it rebroadcasts, and how complete candidate routes are scored. Independent networking mechanisms then address route latency and continuity: a distance-based link-quality proxy, a neighbor-density contention proxy, guarded standby routes, link-layer failure feedback, constant-velocity link-expiration prediction, and local two-hop repair.
The research question is therefore: Can explicit local flocking compatibility improve the robustness of reactive VANET routing across changing node density without requiring global topology or infrastructure? This paper addresses that question at the integrated-protocol level through an implementation-grounded specification and a paired AODV comparison.
The main contributions are:
- an explicit and independently parameterized mapping of cohesion, alignment, and separation to one-hop relay quality, including a bottleneck flocking metric carried by RREQs;
- a reactive route-discovery and selection process that combines flocking eligibility, flocking-ranked RREQ delay, quality-of-service (QoS)-aware candidate scoring, provisional fast route replies (RREPs), and guarded risk-aware backups;
- a predictive maintenance design that clearly separates the biological mapping from non-biological engineering mechanisms, notably constant-velocity Link Expiration Time (LET), link degradation tests, link-layer feedback, and two-hop repair;
- an ns-3.46.1 scalability evaluation comprising 600 paired AODV/FlockHocNet runs over two Montreal OpenStreetMap road graphs with mobility generated by Simulation of Urban MObility (SUMO) and five network sizes, with paired bootstrap confidence intervals, Wilcoxon signed-rank tests, Holm correction, and paired effect sizes.
The remainder of the paper is organized as follows. Section 2 critically reviews recent VANET routing and identifies the research gap. Section 3 presents the flocking mapping, assumptions, and notation. Section 4 specifies the complete FlockHocNet protocol and algorithms. Section 5 provides a worked analytical example and the experimental methodology. Section 6 reports the results and discusses complexity, trade-offs, and limitations. Section 7 concludes the paper and outlines future work.
2. Related Work and Research Gap
This section positions FlockHocNet within the main VANET routing families relevant to its design. It first reviews topology-based, geographic, and mobility-aware approaches, then considers learning, clustering, software-defined, and bio-inspired routing before synthesizing the comparison and identifying the specific research gap addressed by FlockHocNet.
2.1. Topology-Based, Geographic, and Mobility-Aware Routing
Topology-based routing remains relevant because it provides mature mechanisms for route freshness, loop avoidance, and path repair. AODV’s reactive behavior avoids maintaining unused end-to-end paths, yet route-request flooding and rediscovery can become costly under repeated topology changes [3]. DSR reduces periodic control traffic but source-route caches are vulnerable to mobility-induced staleness [4]. OLSR reduces flooding redundancy through multipoint relays but still pays a proactive state-maintenance cost [5]. A recent comparative VANET study of AODV, OLSR, and Destination-Sequenced Distance-Vector (DSDV) routing again illustrates that no single topology-based strategy dominates all throughput, delay, jitter, and overhead conditions [17].
Position-based protocols avoid maintaining complete end-to-end topology. GPSR forwards greedily toward a destination and uses perimeter recovery when greedy progress is impossible [6]. Urban geographic protocols introduced road and intersection awareness; GyTAR, for example, combines geographic progress with traffic density and dynamic junction selection [7]. The cross-layer position-based design of Katsaros et al. later demonstrated a multi-metric approach combining predicted position, road information, link-quality indicators, and utilization [18]. More recent designs continue this trend. Kumar and Raw proposed a location-aware hybrid architecture assisted by roadside units (RSUs) and cloud infrastructure for software-defined VANETs [19], while Nabil et al. used cross-layer link-quality prediction and virtual multibackbones for highway forwarding [20]. Xu et al. combine message priority, free-node selection, and movement direction [21]; Zhang and Ye isolate direction-awareness as a lightweight mechanism in VANET-GPSR+ [8]. These works support the importance of mobility context, but most are geographic, infrastructure-assisted, or optimized around a different forwarding model than on-demand multi-route discovery.
2.2. Learning, QoS, Clustering, and Software-Defined Routing
Learning-based and multi-objective methods can adapt routing to more complex state. Ul Hassan et al. augment AODV with artificial neural network (ANN) methods and security mechanisms [14], while Swamynathan et al. combine driver-behavior prediction with an enhanced AODV/location-aided strategy [22]. Abdullah proposes fuzzy aggregation of bandwidth, delay, hop count, and mobility prediction to improve route stability [13]. These approaches can capture nonlinear relationships, but inference, training, or rule calibration may add complexity and may require state beyond a strictly local neighbor view.
Clustering and centralized or hierarchical control improve scalability by reducing the number of nodes participating directly in global decisions. Kaur et al. evaluate RSU-assisted clustering for emergency dissemination [23]; Behura et al. combine multi-objective cluster-head selection with secure routing and attack classification [24]; and Darabkh et al. integrate clustering, SDN, fog computing, and an AODV fallback [25]. The broader software-defined networking (SDN)-VANET literature highlights programmability and global network awareness, but also introduces controller reachability, infrastructure, and control-plane design questions [26]. FlockHocNet instead targets infrastructure-free distributed V2V routing, where each relay can compute its decision from local beacons plus information accumulated in a route request.
2.3. Bio-Inspired and Swarm-Intelligence Routing
Bio-inspired routing uses decentralized adaptation, population-based search, or stigmergic principles to handle network dynamics; a comprehensive survey by Bitam et al. identifies ant, bee, and other nature-inspired families and their VANET-specific strengths and costs [15]. Recent work demonstrates continued interest. Azzoug and Boukra apply Intelligent Water Drops to junction-based route-stability estimation [9]. Lee et al. use ant-colony optimization (ACO) for multi-junction traffic-aware routing [10]; Ramamoorthy combines location assistance and ant-colony routing for secure VANET communication [27]; and Pidy Pidy et al. integrate adaptive clustering with ACO for stable data delivery [11]. Zhang et al. use a sticky-bacteria algorithm together with link-stability criteria [12], while Sumit et al. employ chaotic multi-verse optimization for secure routing in smart-city VANETs [28]. These protocols show that swarm intelligence can improve search or stability, but their biological mechanisms are typically metaheuristic optimizers rather than a direct, per-neighbor implementation of flocking rules.
Reynolds’ original flocking model is distinct because global coherence emerges from three local behaviors—cohesion, alignment, and separation—without a centralized planner [16]. This structure is attractive for VANET routing: forwarding is also a sequence of local decisions under incomplete information. The key design challenge is to map these behavioral rules to networking quantities without claiming that the protocol controls physical motion. FlockHocNet therefore interprets them only as relay-selection preferences and keeps engineering predictors, such as LET, conceptually separate. Table 1 summarizes how these representative approaches differ from FlockHocNet in routing model, mobility awareness, link-stability treatment, and biological mechanism.
2.4. Research Gap and Motivation
The literature reveals three persistent gaps. First, mobility-aware forwarding often uses one or two instantaneous quantities—distance, direction, or estimated lifetime—without representing the competing local effects of proximity, velocity compatibility, and excessively short/redundant forwarding. Second, swarm-based VANET routing frequently employs a metaheuristic to optimize junctions, clusters, or complete paths; comparatively less attention has been given to an explicit Reynolds-style mapping that acts at every local relay decision. Third, many proposals combine biological terminology with engineering predictors without separating what is biologically inspired from what is simply a networking mechanism. FlockHocNet addresses these gaps by (i) defining three normalized, independently switchable local flocking terms; (ii) propagating their bottleneck value within a reactive RREQ so that path selection remains sensitive to the weakest mobility-compatible hop; and (iii) explicitly labeling LET, backup management, and repair as non-biological engineering components. The novelty is therefore not “bio-inspired routing” in general, but the integration of explicit local flocking-rule analogues into reactive discovery, relay timing, candidate scoring, and route-stability assessment.
3. FlockHocNet Design Principles and System Model
This section establishes the conceptual and mathematical foundations of FlockHocNet. It defines the flocking-to-routing analogy, states the network and local-state assumptions, summarizes the protocol parameters, and introduces the link-quality and contention proxies used by the routing mechanisms developed in the next section.
3.1. Biological Inspiration as a Routing Analogy
FlockHocNet uses Reynolds’ flocking rules as a design analogy [16]. The mapping is intentionally narrow. A vehicle’s physical trajectory is not changed by the protocol. Instead, a forwarding node evaluates whether a one-hop neighbor resembles a locally compatible flock member. Cohesion rewards neighbors that remain within a useful interaction region; alignment rewards similar movement direction and speed; and separation penalizes extremely short hops that provide little forwarding diversification. The three effects are combined into a dimensionless relay-quality score.
Consider node i and neighbor j. Let be their positions, their velocities, and
The cohesion analogue is
where m by default. Unlike a binary distance gate, (2) decays continuously to zero at the interaction radius.
The separation analogue is
with m. Hence only very short candidate hops are penalized; a candidate at or beyond 12 m receives the maximum separation term.
For the alignment analogue, define speed magnitudes and . When both exceed a small implementation threshold m/s,
If both are effectively stopped, ; if only one is stopped, . Speed similarity is
where m/s by default, and
Finally,
with . Each term and the final score lie in . If kinematics are unavailable, the implementation assigns a neutral rather than falsely assuming perfect compatibility. If the biological layer is disabled, the flocking contribution is removed from routing decisions.
3.2. Network Assumptions and Local State
The protocol assumes an Internet Protocol version 4 (IPv4) multi-hop V2V ad hoc network. Every vehicle runs the same routing logic and has a mobility model that exposes current position and velocity; the Global Positioning System (GPS), inertial sensing, or simulator-provided kinematics are possible sources. No central controller, global topology database, or RSU is required for routing. V2I can coexist at the system level, but the FlockHocNet mechanisms specified here are decentralized V2V mechanisms.
Vehicles periodically broadcast HELLO packets every s with a 0–20 ms random jitter. The HELLO payload contains the origin IPv4 address, timestamp, position , and velocity . Position and velocity components are serialized in centimeters as signed 32-bit integers. The HELLO payload is 36 bytes; including the one-byte FlockHocNet type field yields 37 bytes before User Datagram Protocol (UDP), Internet Protocol (IP), and medium access control (MAC) headers. A neighbor is considered stale after s without a HELLO. The neighbor table is therefore a one-hop kinematic cache from which , , link proxies, and LET can be computed. The symbols and default parameter values used throughout the protocol specification are summarized in Table 2.
3.3. Networking Quality Proxies
FlockHocNet uses a normalized distance-based link-quality proxy rather than claiming direct received signal strength indicator (RSSI) or signal-to-interference-plus-noise ratio (SINR) measurement. For separation d,
clipped to , with m and . If a neighbor measurement is unavailable, is used as a neutral value.
A second quantity estimates contention rather than measured residual bandwidth. If is the number of alive neighbors of node i,
with . This term is called a contention/neighbor-density proxy; it should not be interpreted as a physical-layer bandwidth measurement.
4. Proposed FlockHocNet Routing Protocol
Building on the local metrics defined above, this section specifies the complete FlockHocNet routing workflow. It describes control-message exchange and neighbor maintenance, flocking-aware route discovery, candidate scoring and guarded backup selection, and predictive failure recovery with local two-hop repair.
4.1. Control Messages and Neighbor Maintenance
FlockHocNet defines seven control types: route request (RREQ), route reply (RREP), route error (RERR), route-reply acknowledgment (RREP_ACK), HELLO, REPAIR, and repair acknowledgment (REPAIR_ACK). In the current implementation, an RREQ carries hop count, request identifier, destination, origin, origin timestamp, and three 16-bit normalized bottleneck fields: minimum link quality, minimum contention/bandwidth quality, and minimum flocking quality. These fields permit a destination to compare multiple requests without storing the complete path at every relay. The RREQ payload is 27 bytes (28 bytes including the type field), the RREP payload is 20 bytes (21 with type), RERR is 4 bytes (5 with type), and REPAIR is 23 bytes (24 with type).
Each HELLO reception refreshes the sender’s neighbor-table entry. Neighbor expiry and link-layer retry-limit feedback can invoke link-failure handling. This dual detection mechanism is important because a missing HELLO detects longer-lived disappearance, while MAC retry failure can expose a forwarding failure earlier.
4.2. Flocking-Aware Route Discovery
When a source needs a route, it initializes the three RREQ path bottlenecks to one. At a receiver, the sender’s cached kinematics are used to compute . A non-destination relay suppresses the RREQ copy if
The destination is exempt from this local suppression so that reachable destination copies can still be collected.
For an eligible relay, the path values are updated by a weakest-hop rule:
The use of makes the route sensitive to a single strongly incompatible mobility transition instead of allowing good hops to average away a weak one. Forwarders suppress duplicate RREQs, while the destination intentionally accepts multiple copies during a candidate-collection interval.
Flocking quality also controls RREQ timing. Instead of assigning the same random jitter to all eligible relays, the forwarding delay is
so locally compatible relays tend to rebroadcast earlier. The random term breaks ties and reduces synchronized retransmission. This mechanism is a networking analogue of decentralized local response; it is not a claim that routing changes vehicle motion. Algorithm 1 summarizes the resulting RREQ processing logic executed at an intermediate relay.
| Algorithm 1:Flocking-Aware RREQ Processing at Relay i |
|
4.3. Candidate Collection and Route Scoring
The destination collects candidates for ms. A provisional fast RREP can be sent after ms using the best candidate seen so far, while collection continues for optimized primary and backup selection. The source retries an unanswered discovery after ms, with at most two retries by default.
For each candidate path, latency quality and hop quality are normalized as
The primary non-biological QoS score is
with . The final route score is
The weights are normalized in the implementation if modified, so they remain interpretable as relative contributions. Increasing makes the route more conservative with respect to the weakest flocking-compatible hop; decreasing it approaches the non-biological QoS scorer. Within , increasing strengthens velocity alignment preference, increasing favors closer membership in the interaction region, and increasing more strongly penalizes ultra-short candidates.
Backup routes use
with , followed by the same flocking blend. A guarded backup must have a distinct previous hop, score at least 0.50, no more than one extra hop relative to the primary, and a primary-score deficit no greater than 0.12. Risk-aware advertisement is enabled: if the primary bottleneck link quality is at or below 0.75, the alternate should provide at least 0.05 additional bottleneck quality. Backup lifetime is capped at 3 s. These constraints reduce stale or nearly redundant standby routes. Algorithm 2 formalizes the primary-route ranking and guarded-backup selection procedure applied to the collected candidate set.
| Algorithm 2:Primary and Guarded Backup Selection |
|
4.4. Predictive Link Assessment and Route Maintenance
FlockHocNet deliberately separates flocking from mobility prediction. The constant-velocity Link Expiration Time (LET) is an engineering predictor, not a biological rule. Let
The predicted exit from radio range satisfies
With , , and , the positive future root for a currently connected pair is
when , , and the discriminant is nonnegative.
The implementation derives a default link-quality stability threshold from the cohesion radius when no explicit value is set:
For m, m, and , . A link is marked unstable if at least one of the following holds: it is already outside ; ; bio-flocking is enabled and ; the observed link proxy drops by at least 0.20; distance grows by at least 50 m between observations; or s. Proactive repair exists as an exposed attribute but is disabled in the Full configuration used here; instability information still supports route validity and recovery logic.
When a forwarding failure occurs, recovery proceeds locally when possible. A directly reachable destination can be used immediately. Otherwise, a valid guarded backup may be promoted. If no suitable backup exists and two-hop repair is enabled, the node searches alive neighbors for a bridge around the broken next hop. The local candidate must satisfy the cohesion-derived quality threshold on both local legs and achieve an estimated route score of at least 0.35. A REPAIR message is sent and must be acknowledged within 25 ms. Failure of repair or backup activation leads to RERR propagation and, if demand remains active, a fresh RREQ. Data awaiting discovery/repair are queued for at most 30 s, with a default maximum queue length of 64 packets. Algorithm 3 summarizes the ordered recovery procedure, from direct reuse and backup promotion to two-hop repair and final rediscovery.
| Algorithm 3:Failure Recovery and Two-Hop Repair |
|
5. Analytical Illustration and Experimental Methodology
This section connects the protocol equations to both an illustrative routing decision and the empirical evaluation. It first provides a worked relay-selection example, then details the ns-3/SUMO implementation and paired simulation design, and finally defines the evaluation metrics and statistical analysis.
5.1. Worked Relay-Selection Example
Consider a forwarding vehicle at m moving east at 20 m/s. Three one-hop candidates are available, as illustrated in Figure 1. Vehicle is located 100 m east of and moves east at 21 m/s, is located 60 m to the north and moves north at 20 m/s, while is located 145 m away and moves west at 20 m/s. The destination D lies east of the candidate-relay region.
For , m gives . Since both velocities point east, ; their speed difference is 1 m/s, so and . Because m, . Equation (7) yields
For perpendicular at 60 m, , , , , and . For opposite-moving at 145 m, , , , , giving . Because , does not relay this RREQ copy. Between and , rebroadcasts earlier on average because its flocking quality is higher.
The route-level blend can also alter a seemingly attractive shortest-path decision. Suppose candidate route has , discovery delay 20 ms, three hops, and . Then , , , and . Route has stronger bottleneck link quality , 35 ms delay, two hops, but a weaker flocking bottleneck . Its but its final score falls to . FlockHocNet therefore selects : the extra hop is accepted because the route avoids a mobility-incompatible weak point. An AODV decision under equal freshness would generally favor hop count rather than this explicit motion-compatibility bottleneck, illustrating the conceptual distinction without treating the example as an experimental result.
5.2. Implementation and Evaluation Design
FlockHocNet is implemented as an ns-3 IPv4 routing protocol and evaluated with ns-3.46.1 [29]. Vehicular mobility is generated by Simulation of Urban MObility (SUMO) [30] on two real road graphs extracted from OpenStreetMap (OSM) in Montreal. The resulting mobility traces are synthetic SUMO trajectories constrained by real road geometry; they are not measurements of observed Montreal traffic. This distinction is important because road-topology realism does not by itself imply empirical traffic realism.
The first environment is a downtown/Ville-Marie graph covering approximately longitude and latitude . The second is a Decarie/A-15/A-40 corridor graph covering approximately longitude and latitude . Frozen OSM snapshots are used to construct repeatable SUMO networks. Figure 2 shows the two simulation road graphs. SUMO applies a 30-s warm-up before the exported 300-s networking interval, a 0.2-s microscopic simulation step, and 0.5-s mobility-trace sampling. Three vehicle-behavior profiles vary speed factor, acceleration, deceleration, and driver imperfection so that the traffic population is not governed by a single homogeneous driving model.
Five fixed vehicle populations are evaluated, . For each road environment and population, 30 mobility seeds are generated. AODV and FlockHocNet receive the same mobility trace, source-destination pair file, ns-3 seed, and run number for each paired observation. With two road environments, five populations, 30 paired mobility realizations, and two routing protocols, the campaign contains
network simulations.
Eight endpoint-disjoint UDP source-destination pairs are selected near application start using a connected-multihop-first policy followed by a farthest-disjoint fallback when necessary. Both protocols receive identical pairs in each paired run. Each source sends 512-byte application packets at 64 kbit/s, giving a nominal aggregate offered application load of kbit/s, excluding routing and lower-layer overhead. Sources start with small random jitter in the interval 20–21 s and stop at 295 s; the networking simulation ends at 300 s.
The physical-layer (PHY) and medium access control (MAC) configuration uses the Institute of Electrical and Electronics Engineers (IEEE) 802.11p standard in ad hoc mode, a 10-MHz channel, channel 178 at approximately 5.89 GHz, a constant orthogonal frequency-division multiplexing (OFDM) rate of 6 Mbit/s for data and control, and transmit power of 20 dBm. Propagation uses YansWifiChannel with constant-speed delay and Two-Ray Ground loss. No small-scale fading, building obstruction, or shadowing process is added. The present evaluation therefore isolates routing behavior under deterministic distance-dependent propagation more than it represents the full variability of an urban vehicular radio channel. The complete simulation configuration is summarized in Table 3.
The Full FlockHocNet configuration enables the biological layer, cohesion, alignment, separation, fast RREP, guarded backup routes, adaptive scoring, link-layer feedback, and two-hop repair. Proactive repair is disabled. The evaluation measures the integrated Full protocol against AODV; the 600-run campaign does not contain biological-rule ablations, so the experiment cannot causally assign the measured gain to any single flocking term.
5.3. Metrics and Statistical Analysis
The principal reliability metric is packet delivery ratio (PDR)
Payload goodput is computed from received application payload over the measurement duration. Mean end-to-end delay and jitter are computed over delivered application packets. Routing cost is characterized primarily by normalized routing load (NRL), i.e., routing-control transmissions relative to delivered data traffic, together with routing-control bytes and routing overhead rate recorded by the campaign.
For each scenario, density, and metric, the 30 FlockHocNet observations are paired with the corresponding 30 AODV observations. Let and be the two measurements for run i and . We report mean values, paired bootstrap 95% confidence intervals for the mean difference, two-sided Wilcoxon signed-rank tests, and paired Cohen effect size
Holm correction is applied across the five density comparisons within each scenario/metric family. Statistical significance is assessed at adjusted . Because delay is defined only for packets that arrive, very low-PDR cases are interpreted cautiously to avoid survivor bias.
6. Results, Complexity, and Discussion
This section reports the paired simulation results and interprets them in relation to FlockHocNet’s design objectives. It examines delivery reliability, routing overhead, delay and goodput, then analyzes computational complexity and discusses the principal design trade-offs and limitations.
6.1. Packet Delivery Ratio and Density Scaling
Figure 3 shows the central result. In the Decarie/highway scenario, FlockHocNet is essentially indistinguishable from AODV at 20 and 40 vehicles: mean PDR changes from 0.01208 to 0.01170 ( relative) and from 0.06668 to 0.06646 (), respectively, with no significant paired difference after Holm correction. At 60 vehicles, FlockHocNet reaches 0.21416 versus 0.20272 for AODV (), but the adjusted test remains non-significant. The advantage becomes significant at 80 vehicles (0.40998 versus 0.38715, , adjusted , ) and at 100 vehicles (0.52908 versus 0.48969, , adjusted , ).
The downtown/urban scenario exhibits a stronger density transition. At 20 and 40 vehicles, the relative gains are modest ( and ) and do not reach the adjusted 0.05 threshold. At 60 vehicles, mean PDR rises from 0.77601 to 0.86291 (, adjusted , ). At 80 vehicles it rises from 0.80125 to 0.88081 (, adjusted ), and at 100 vehicles from 0.75677 to 0.89286 (, adjusted , ). The paired confidence intervals are entirely positive for these three dense urban cases.
The density dependence is consistent with FlockHocNet’s mechanism. When few relays exist, filtering RREQs by and exchanging periodic HELLOs cannot create connectivity that is physically absent; the protocol may instead spend additional control effort while searching for a compatible relay. As density grows, the candidate set becomes richer, allowing flocking-based eligibility and path scoring to reject unstable transitions without eliminating all useful alternatives. The urban results suggest that this relay diversity is particularly valuable when local motion directions are heterogeneous.
6.2. Routing Overhead and the Reliability–Cost Trade-Off
Figure 4 shows that reliability improvement is not free. In the Decarie/highway scenario, FlockHocNet’s mean NRL is higher than AODV at every density: approximately , , , , and from 20 to 100 vehicles, with statistically significant paired differences. This is attributable to HELLO-based kinematic state, multi-candidate discovery, backup signaling, and recovery functions operating in a topology where delivered application traffic is low at sparse densities. Because NRL normalizes by delivered data, extremely low PDR also magnifies the ratio.
In the downtown/urban scenario, the overhead penalty contracts as density increases. FlockHocNet NRL is at 20 vehicles, at 40, and at 60. At 80 vehicles, the mean difference becomes negative (), although the paired bootstrap interval for the mean difference crosses zero and should therefore be treated cautiously despite the Wilcoxon/Holm result. At 100 vehicles, the reduction is unambiguous: NRL decreases from 8.087 for AODV to 3.374 for FlockHocNet (), the paired bootstrap interval is entirely negative, adjusted , and . In this dense urban regime, the cost of FlockHocNet’s periodic and candidate-selection control is more than compensated by fewer unsuccessful deliveries and rediscovery-related transmissions per delivered packet.
6.3. Delay, Goodput, and Interpretation
Payload goodput follows PDR closely because the offered application rate is fixed across protocols. Consequently, PDR is the more informative primary reliability figure and goodput is treated as a corroborating outcome rather than an independent mechanism-level finding. Delay results require more care. In highway cases with very low delivery, FlockHocNet reports much lower mean delay than AODV; however, a mean over the small subset of packets that survive does not represent delay for the many lost packets. The same caution applies to the 20-vehicle urban case. At denser urban settings (60–100 vehicles), paired delay differences are not consistently significant after correction, indicating that the principal robust advantage in this campaign is delivery reliability rather than universal latency reduction.
Figure 5 directly visualizes the run-paired PDR effect. The transition from near-zero or uncertain differences at low density to clearly positive differences at high density is especially visible in the urban scenario. This plot is useful because it emphasizes that the statistical unit is the matched run, not an unpaired comparison of aggregate means.
The numerical values underlying the principal density-dependent PDR comparisons are consolidated in Table 4, including paired confidence intervals, Holm-adjusted significance levels, and paired effect sizes.
6.4. Complexity Analysis
Let denote the alive one-hop degree at node i, N the number of vehicles, E the current communication links, and K the number of RREQ candidates received at a destination. HELLO processing and each individual flocking-score computation are . Evaluating all local neighbors for repair is . Routing-table and queue operations depend on implementation containers but remain local to stored routes and queued packets.
A route discovery preserves the worst-case broadcast nature of a reactive protocol: in a connected graph, RREQ dissemination is receptions and broadcasts in the worst case. Flocking suppression and ranked rebroadcast timing reduce the practical number and ordering of forwarders but do not change that asymptotic bound. Candidate scoring is and sorting is . Guarded-backup scanning is . Two-hop repair in the implementation iterates local bridge candidates and performs constant-time geometric checks per candidate, giving relative to current local state.
Per-node state is for neighbor entries, active/backup routing entries, and queued packets. Communication overhead has three components: periodic HELLO traffic proportional to network-wide, on-demand RREQ/RREP/RERR signaling, and conditional backup/repair traffic. The results in Figure 4 show that the constant cost of richer local state is substantial when delivery is sparse but can be amortized when density provides many viable relays.
6.5. Design Trade-offs and Limitations
The first trade-off is eligibility versus reachability. A high or can reject motion-incompatible relays and improve path stability when alternatives exist, but can over-prune sparse networks. The second is stability versus signaling: 1-s HELLOs and multiple RREQ candidates improve local knowledge but increase control traffic. The third is latency versus optimization: the 2-ms provisional RREP reduces initial wait, while the 50-ms collection window allows the destination to find a better primary and backup. The fourth is local robustness versus stale alternatives: guarded backup lifetime and score/hop constraints intentionally limit how long a standby route is trusted.
Several limitations bound the claims of this paper. First, the experimental campaign evaluates the integrated Full FlockHocNet against AODV, but does not contain the biological and engineering ablations exposed by the implementation. Therefore, the observed improvements cannot yet be causally decomposed into cohesion, alignment, separation, fast RREP, backup, and two-hop-repair contributions. Second, the mobility traces are synthetic SUMO trajectories on real OSM road graphs. This improves road-topology realism and repeatability but does not constitute validation on observed Montreal traffic trajectories; the heterogeneous driver profiles remain simulator-generated. Third, the campaign uses Two-Ray Ground without additional fading, building blockage, or shadowing, so measured V2V channel dynamics may alter the relative benefit of the distance-based link proxy. Fourth, AODV is a strong conventional baseline but does not span the full contemporary design space represented by geographic, fuzzy, clustering, and swarm-based protocols in Table 1. Finally, the current parameter values are implementation defaults rather than globally optimized constants. Their use is reproducible, but sensitivity analysis is necessary before claiming scenario-independent optimality.
These limitations do not invalidate the central result: under matched conditions, the integrated protocol has a clear density-dependent PDR advantage over AODV, especially in the downtown/urban scenario. They do constrain the interpretation to protocol-level effectiveness rather than proof that every individual biological rule independently contributes to that gain.
7. Conclusion and Future Work
This paper introduced FlockHocNet, a reactive VANET routing protocol that translates local flocking principles into relay-selection quality. Cohesion, alignment, and separation are defined as normalized one-hop metrics derived from vehicle position and velocity, combined into , propagated as a weakest-hop path quantity, and incorporated into both RREQ forwarding priority and candidate route scoring. The routing design complements this biological layer with QoS scoring, provisional fast replies, guarded risk-aware backups, link-layer failure feedback, constant-velocity LET prediction, and two-hop repair. A key methodological distinction is maintained throughout: LET and route-repair logic are predictive networking mechanisms and are not presented as biological rules.
Across 600 paired ns-3.46.1 runs using SUMO-generated mobility on two Montreal OSM road graphs, FlockHocNet’s benefit increases with network density. In the 100-vehicle Decarie/highway case, mean PDR improves by 8.04% relative to AODV; in the 100-vehicle downtown/urban case, the improvement is 17.98%. At the same urban density, normalized routing load decreases by 58.28%, suggesting that better route continuity can eventually compensate for the protocol’s richer control plane. Conversely, sparse cases show little or no PDR advantage and markedly higher NRL. FlockHocNet should therefore be viewed as an adaptive stability-oriented protocol whose value depends on having sufficient local relay diversity, not as a universally superior replacement for AODV under all connectivity regimes.
Future work should first perform the already supported ablations: Full versus no-bio, no-cohesion, no-alignment, no-separation, no-fast-RREP, no-backup, and no-two-hop-repair, using exactly paired mobility and application conditions. The current SUMO/OSM methodology should then be broadened to additional urban, highway, and mixed road graphs, wider density and speed ranges, varying offered loads, larger populations, and empirical vehicle trajectories where available. Propagation should include fading, shadowing, blockage, and direct PHY/MAC link-quality measurements. Comparisons should include at least one current geographic or mobility/stability-aware baseline in addition to AODV. Finally, route lifetime, route-discovery frequency, link-break frequency, backup promotion, repair success, and route-switch frequency should be instrumented directly so that improvements in application PDR can be linked quantitatively to the protocol mechanisms that produce them.
Author Contributions
B.M. conceived and designed FlockHocNet, implemented the protocol, designed and executed the simulation campaign, analyzed the results, and wrote and approved the manuscript.
Funding
This research received no external funding.
Institutional Review Board Statement
Not applicable. This work reports network and traffic simulation experiments and does not involve human participants, personal data, or animals.
Informed Consent Statement
Not applicable. This study does not involve human participants, and no identifiable participant information is reported.
Data Availability Statement
The experiments use simulator-generated mobility and networking data. The SUMO/OSM mobility methodology, paired ns-3 design, road-graph bounds, and principal simulation parameters required to interpret the reported campaign are documented in this preprint. Code availability: the source package contains the manuscript source and figures; it does not include the FlockHocNet ns-3 implementation or the mobility-generation scripts.
Conflicts of Interest
The author declares no conflicts of interest.
Abbreviations
The following abbreviations are used in this manuscript:
| ACO | Ant Colony Optimization |
| AODV | Ad hoc On-Demand Distance Vector |
| ANN | Artificial Neural Network |
| DSDV | Destination-Sequenced Distance-Vector |
| DSR | Dynamic Source Routing |
| GPS | Global Positioning System |
| GPSR | Greedy Perimeter Stateless Routing |
| GyTAR | Greedy Traffic-Aware Routing |
| IEEE | Institute of Electrical and Electronics Engineers |
| IP | Internet Protocol |
| IPv4 | Internet Protocol version 4 |
| ITS | Intelligent Transportation Systems |
| LET | Link Expiration Time |
| MAC | Medium Access Control |
| MANET | Mobile Ad Hoc Network |
| NRL | Normalized Routing Load |
| OFDM | Orthogonal Frequency-Division Multiplexing |
| OLSR | Optimized Link State Routing |
| OSM | OpenStreetMap |
| PDR | Packet Delivery Ratio |
| PHY | Physical Layer |
| QoS | Quality of Service |
| RERR | Route Error |
| REPAIR_ACK | Repair Acknowledgment |
| RREP | Route Reply |
| RREP_ACK | Route Reply Acknowledgment |
| RREQ | Route Request |
| RSU | Roadside Unit |
| RSSI | Received Signal Strength Indicator |
| SDN | Software-Defined Networking |
| SINR | Signal-to-Interference-plus-Noise Ratio |
| SUMO | Simulation of Urban MObility |
| UDP | User Datagram Protocol |
| V2I | Vehicle-to-Infrastructure |
| V2V | Vehicle-to-Vehicle |
| VANET | Vehicular Ad Hoc Network |
References
- Dutta, A.; Campoverde, L.M.S.; Tropea, M.; Rango, F.D. A Comprehensive Review of Recent Developments in VANET for Traffic, Safety & Remote Monitoring Applications. J. Netw. Syst. Manag. 2024, 32, 73. [Google Scholar] [CrossRef]
- Tirumalasetti, R.; Singh, S.K.; Roy, P.K.; Mishra, S. A Systematic Review of VANET Routing Protocols for Intelligent Transport Systems (ITSs). J. Adv. Transp. 2026, 2026, 7999623. [Google Scholar] [CrossRef]
- Perkins, C.E.; Belding-Royer, E.M.; Das, S. 2003. Ad hoc On-Demand Distance Vector (AODV) Routing. Technical Report RFC 3561, IETF. [Google Scholar] [CrossRef]
- Johnson, D.B.; Maltz, D.A. Dynamic Source Routing in Ad Hoc Wireless Networks. In Mobile Computing; Imielinski, T., Korth, H.F., Eds.; Kluwer Academic Publishers, 1996; pp. 153–181. [Google Scholar]
- Clausen, T.; Jacquet, P. 2003. Optimized Link State Routing Protocol (OLSR). IETF. Technical Report RFC 3626. [Google Scholar] [CrossRef]
- Karp, B.; Kung, H.T. GPSR: Greedy Perimeter Stateless Routing for Wireless Networks. In Proceedings of the Proceedings of the 6th Annual International Conference on Mobile Computing and Networking (MobiCom); 2000; pp. 243–254. [Google Scholar] [CrossRef]
- Jerbi, M.; Senouci, S.M.; Rasheed, T.; Ghamri-Doudane, Y. Towards Efficient Geographic Routing in Urban Vehicular Networks. IEEE Trans. Veh. Technol. 2009, 58, 5048–5059. [Google Scholar] [CrossRef]
- Zhang, Z.; Ye, N. VANET-GPSR+: A Lightweight Direction-Aware Routing Protocol for Vehicular Ad Hoc Networks. Sensors 2026, 26, 2525. [Google Scholar] [CrossRef]
- Azzoug, Y.; Boukra, A. Improved Junction-Based Routing for VANETs Using a Bio-Inspired Route Stability Approach. Ad. Hoc Netw. 2024, 153, 103346. [Google Scholar] [CrossRef]
- Lee, S.W.; Heo, K.S.; Kim, M.A.; Kim, D.K.; Choi, H. Multiple-Junction-Based Traffic-Aware Routing Protocol Using ACO Algorithm in Urban Vehicular Networks. Sensors 2024, 24, 2913. [Google Scholar] [CrossRef]
- Pidy, L.T.P.; Ngossaha, J.M.; Karunathilake, T.; Tsakou, S.B.; Förster, A. An Efficient Cluster-Based Routing Protocol for Enhanced Data Delivery and Stability in VANETs: Cluster-Based Ant-Colony Routing With Adaptive Cluster Head. IET Netw. 2025, 14, e70013. [Google Scholar] [CrossRef]
- Zhang, J.; Zhang, L.; Zhang, D.; Zhang, T.; Wang, S.; hui Zou, C. New Routing Method Based on Sticky Bacteria Algorithm and Link Stability for VANET. Ad. Hoc Netw. 2025, 166, 103682. [Google Scholar] [CrossRef]
- Abdullah, A.M. A Fuzzy Logic-Based Routing Protocol for Improved Route Stability and Efficiency in Vehicular Ad Hoc Networks. Computing 2026, 108, 103. [Google Scholar] [CrossRef]
- ul Hassan, M.; Al-Awady, A.A.; Ali, A.; Sifatullah; Akram, M.; Iqbal, M.M.; Khan, J.; Ali, Y.A.A. ANN-Based Intelligent Secure Routing Protocol in Vehicular Ad Hoc Networks (VANETs) Using Enhanced AODV. Sensors 2024, 24, 818. [Google Scholar] [CrossRef]
- Bitam, S.; Mellouk, A.; Zeadally, S. Bio-Inspired Routing Algorithms Survey for Vehicular Ad Hoc Networks. IEEE Commun. Surv. Tutor. 2015, 17, 843–867. [Google Scholar] [CrossRef]
- Reynolds, C.W. Flocks, Herds and Schools: A Distributed Behavioral Model. In Proceedings of the Proceedings of the 14th Annual Conference on Computer Graphics and Interactive Techniques (SIGGRAPH); 1987; pp. 25–34. [Google Scholar] [CrossRef]
- El-Dalahmeh, M.; El-Dalahmeh, A.; Adeel, U. Analysing the Performance of AODV, OLSR, and DSDV Routing Protocols in VANET Based on the ECIE Method. IET Netw. 2024, 13, 377–394. [Google Scholar] [CrossRef]
- Katsaros, K.; Dianati, M.; Tafazolli, R.; Kernchen, R. CLWPR - A Novel Cross-Layer Optimized Position Based Routing Protocol for VANETs. In Proceedings of the 2011 IEEE Vehicular Networking Conference (VNC), 2011; pp. 139–146. [Google Scholar] [CrossRef]
- Kumar, M.; Raw, R.S. RC-LAHR: Road-Side-Unit-Assisted Cloud-Based Location-Aware Hybrid Routing for Software-Defined Vehicular Ad Hoc Networks. Sensors 2024, 24, 1045. [Google Scholar] [CrossRef]
- Nabil, M.; Kafhali, S.E.; Hajami, A.; Haqiq, A. Cross-Layer Greedy-Based Routing in VANETs: Virtual Multibackbones Approach. Appl. Comput. Intell. Soft Comput. 2024, 2024, 5750055. [Google Scholar] [CrossRef]
- Xu, F.; Yang, C.; Chen, H.; Ahmed, M.; Deng, M.; Lyu, Y. VANETs Routing Optimization: Combining Message Priority, Free Nodes, and Mobility Direction. IEEE Access 2025, 13, 23331–23343. [Google Scholar] [CrossRef]
- Swamynathan, C.; Ravi, V.; Ranganayakulu, D.; Kandasamy, R. Driver Behaviour Prediction and Enhanced Ad Hoc On-Demand Distance Vector Routing Protocol in VANET. Int. J. Commun. Syst. 2024, 37, e5650. [Google Scholar] [CrossRef]
- Kaur, R.; Singla, C.; Singh, H.; Bhardwaj, R.; Sharma, P.; Aggarwal, A.; Alsekait, D.M.; Elminaam, D.S.A. A Comprehensive Framework for Emergency Message Dissemination in Urban VANET Scenarios: A Comparative Analysis of Clustering-Based Routing Protocols. IEEE Access 2024, 12, 174284–174296. [Google Scholar] [CrossRef]
- Behura, A.; Kumar, A.; Jain, P.K. A Multi-Objective Approach for Secure Cluster Based Routing & Attack Classification in VANETs. Peer-To-Peer Netw. Appl. 2025, 18, 119. [Google Scholar] [CrossRef]
- Darabkh, K.A.; Al-Mistarihi, M.F.; Al-Maaitah, M.I. Next-Generation Routing for Autonomous Vehicle Networks Based on Innovative Clustering: Integrating SDN and Fog Computing Along with AODV upon Failure. J. Supercomput. 2025, 81, 379. [Google Scholar] [CrossRef]
- Hussein, N.H.; Koh, S.P.; Yaw, C.T.; Tiong, S.K.; Benedict, F.; Yusaf, T.; Kadirgama, K.; Tan, C.H. SDN-Based VANET Routing: A Comprehensive Survey on Architectures, Protocols, Analysis, and Future Challenges. IEEE Access 2025, 13, 126801–126861. [Google Scholar] [CrossRef]
- Ramamoorthy, R. An Enhanced Location-Aided Ant Colony Routing for Secure Communication in Vehicular Ad Hoc Networks. Hum.-Centric Intell. Syst. 2024, 4, 25–52. [Google Scholar] [CrossRef]
- Sumit; Chhillar, R.S.; Dalal, S.; Dalal, S.; Lilhore, U.K.; Samiya, S. A Dynamic and Optimized Routing Approach for VANET Communication in Smart Cities to Secure Intelligent Transportation System via a Chaotic Multi-Verse Optimization Algorithm. Clust. Comput. 2024, 27, 7023–7048. [Google Scholar] [CrossRef]
- Riley, G.F.; Henderson, T.R. The ns-3 Network Simulator. In Modeling and Tools for Network Simulation; Wehrle, K., Güneş, M., Gross, J., Eds.; Springer: Berlin, Heidelberg, 2010; pp. 15–34. [Google Scholar] [CrossRef]
- Lopez, P.A.; Behrisch, M.; Bieker-Walz, L.; Erdmann, J.; Flotterod, Y.P.; Hilbrich, R.; Lucken, L.; Rummel, J.; Wagner, P.; Wiessner, E. Microscopic Traffic Simulation Using SUMO. In Proceedings of the 2018 21st International Conference on Intelligent Transportation Systems (ITSC), 2018; pp. 2575–2582. [Google Scholar] [CrossRef]
Figure 1.
Worked one-hop relay-selection scenario showing the relative positions and motion directions of , candidate relays –, and destination D.
Figure 1.
Worked one-hop relay-selection scenario showing the relative positions and motion directions of , candidate relays –, and destination D.
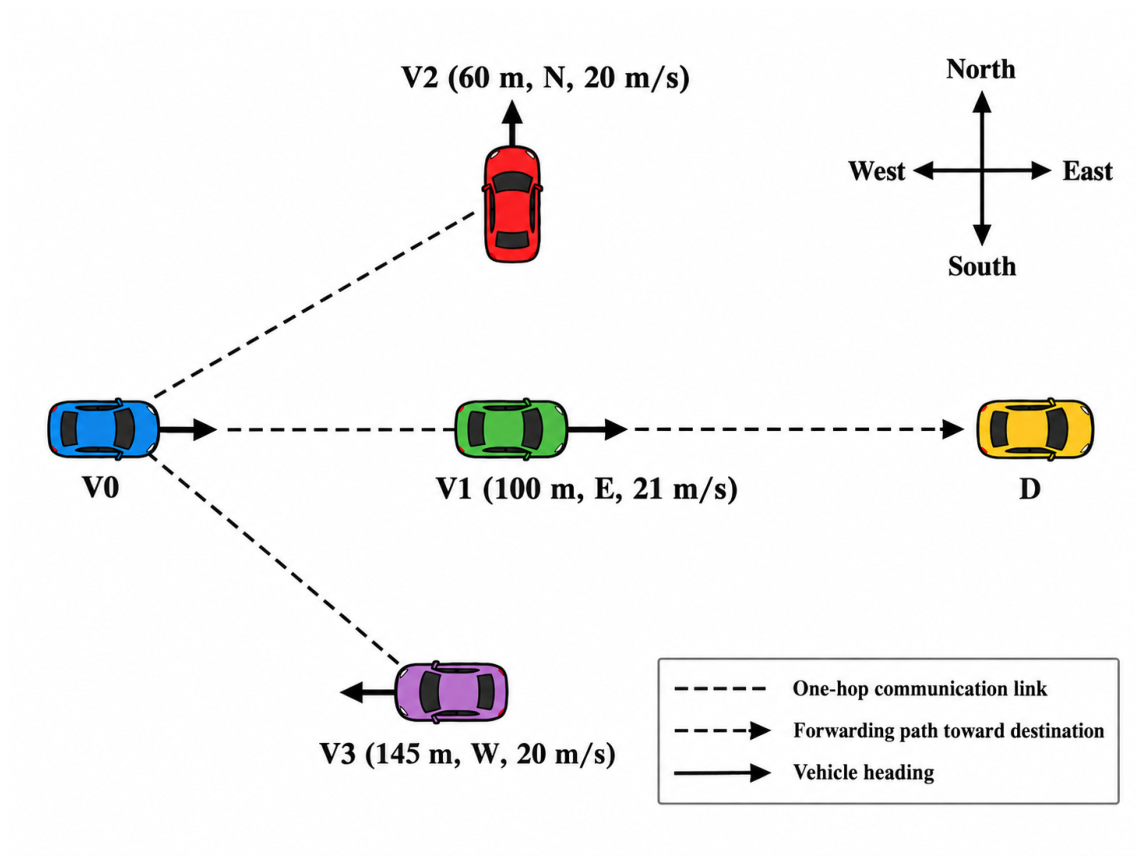
Figure 2.
Montreal road graphs used for the SUMO mobility campaign. The road geometry is extracted from OpenStreetMap, while the vehicle trajectories are generated synthetically by SUMO.
Figure 2.
Montreal road graphs used for the SUMO mobility campaign. The road geometry is extracted from OpenStreetMap, while the vehicle trajectories are generated synthetically by SUMO.
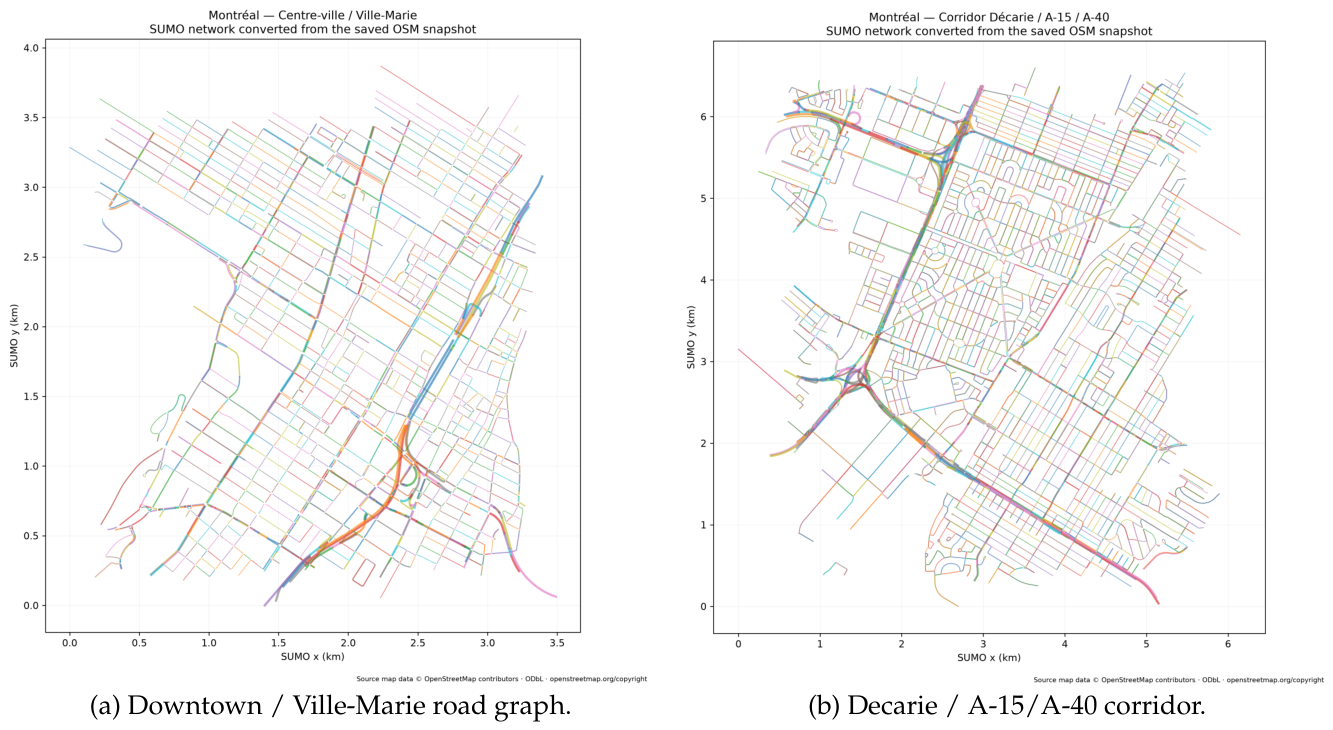
Figure 3.
Mean packet delivery ratio versus number of vehicles. Error bars are bootstrap 95% confidence intervals.
Figure 3.
Mean packet delivery ratio versus number of vehicles. Error bars are bootstrap 95% confidence intervals.
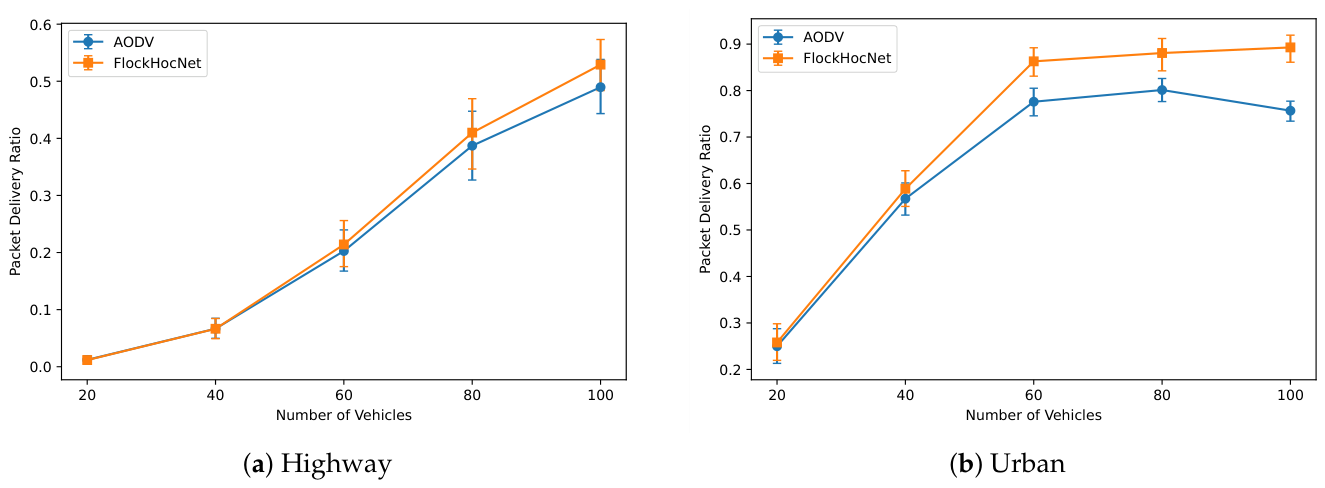
Figure 4.
Normalized routing load versus number of vehicles. FlockHocNet is expensive in sparse cases but becomes more control-efficient than AODV in the densest urban condition.
Figure 4.
Normalized routing load versus number of vehicles. FlockHocNet is expensive in sparse cases but becomes more control-efficient than AODV in the densest urban condition.
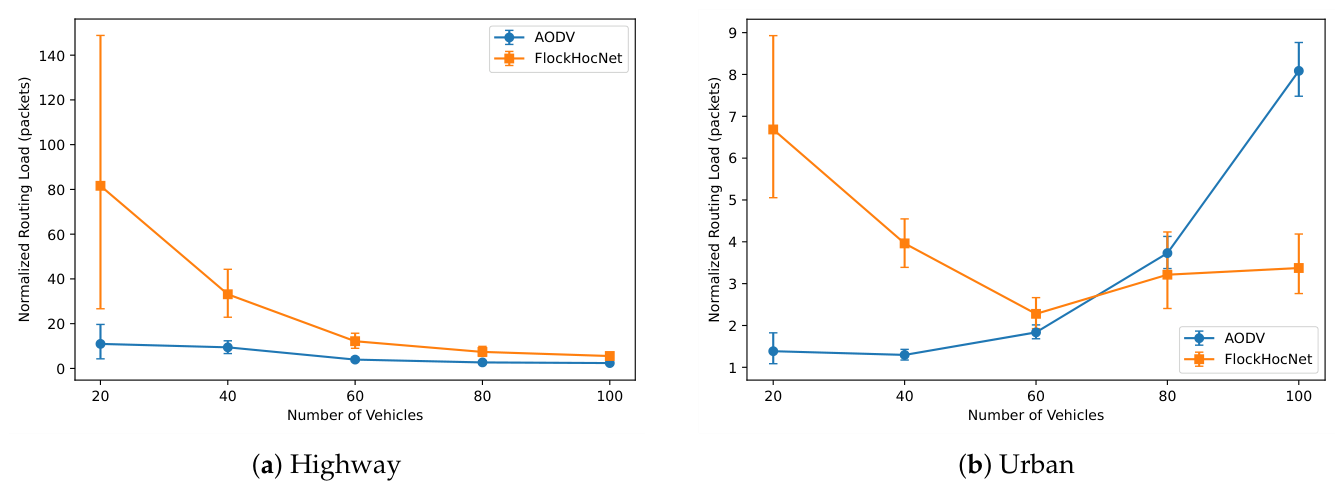
Figure 5.
Paired PDR difference . Positive values favor FlockHocNet.
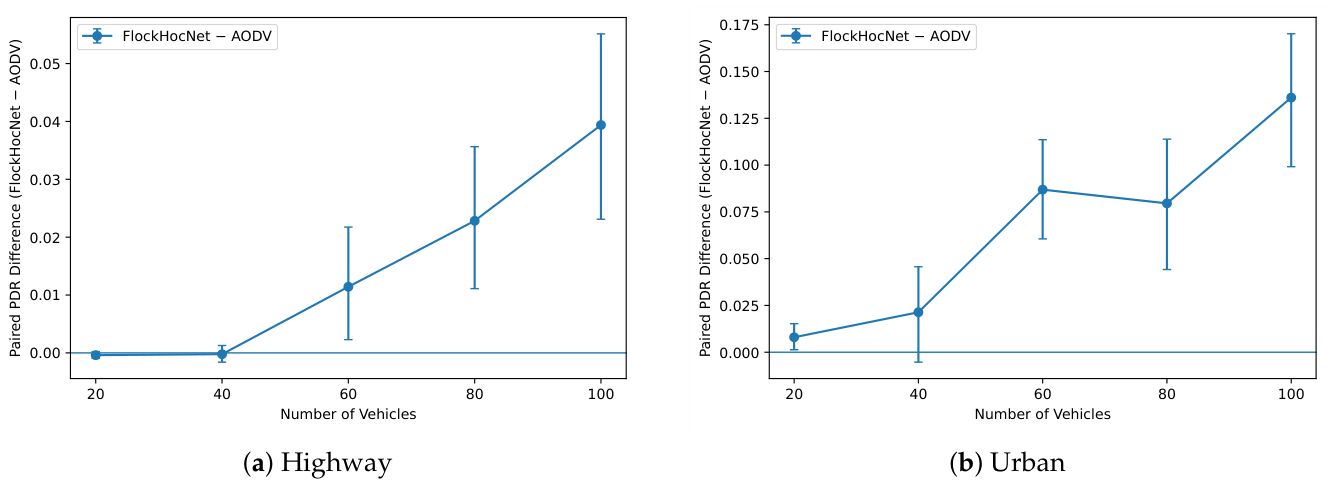

Table 1.
Positioning of FlockHocNet Relative to Representative Routing Approaches.
| Protocol / study | Year | Routing approach | Mobility awareness | Link stability | Bio-inspired mechanism | Main routing metrics | Main strength | Main limitation |
|---|---|---|---|---|---|---|---|---|
| AODV [3] | 2003 | Reactive topology-based | Indirect | Reactive to failure | No | Hop/freshness | Mature on-demand routing | Repeated discovery under rapid breaks |
| GPSR [6] | 2000 | Geographic greedy/perimeter | Position | Indirect | No | Geographic progress | Local state, scalable forwarding | Instantaneous position may ignore motion compatibility |
| GyTAR [7] | 2009 | Urban junction-based geographic | Density/road context | Road-connectivity oriented | No | Junction score, density, distance | Urban traffic awareness | Map/junction dependence |
| Katsaros et al. [18] | 2011 | Cross-layer position based | Position/velocity/heading | physical- and medium-access-control-layer informed | No | Road distance, angle, utilization, link indicators | Rich local cross-layer decision | Requires multiple cross-layer/map inputs |
| Azzoug and Boukra [9] | 2024 | Junction-based route stability | Speed/history | Explicit road-segment stability | Intelligent Water Drops | Stability and path consistency | Predictive urban route stability | Metaheuristic and map/junction dependence |
| Lee et al. [10] | 2024 | Multi-junction traffic-aware | Traffic density | Indirect | ACO | Junction distance/density | Multi-junction optimization | Urban-map dependence and ACO computation |
| Nabil et al. [20] | 2024 | Cross-layer greedy | Position/velocity/direction | Predicted link-quality persistence | No | Link quality, progress | Cross-layer forwarder robustness | Highway-centered design |
| Ramamoorthy [27] | 2024 | Location-aided secure routing | Location | Indirect | ACO | Location/path/security factors | Joint routing and security | Optimization overhead |
| Pidy Pidy et al. [11] | 2025 | Cluster-based adaptive routing | Relative velocity/proximity | Cluster stability | ACO | Stability, clustering, path cost | Adaptive cluster stability | Cluster maintenance and optional RSU dependence |
| Sticky-bacteria routing [12] | 2025 | Link-stabilized path optimization | Speed, direction, density | Explicit | Sticky bacteria | Distance, angle, neighbor count, speed difference, traffic | Multi-factor stability optimization | Global/metaheuristic search cost |
| Xu et al. [21] | 2025 | Priority-aware relay selection | Movement direction | Indirect | No | Priority, hop/time-to-live, direction, proximity | Direction-aware forwarding | Does not explicitly implement flocking or reactive path bottlenecks |
| VANET-GPSR+ [8] | 2026 | Lightweight geographic | Direction | Probabilistic link-lifetime rationale | No | Direction and deviation angle | Low-complexity direction awareness | Geographic/GPSR-specific forwarding |
| Abdullah [13] | 2026 | Fuzzy mobility/reliability aware | Mobility prediction | Route lifetime | No | Bandwidth, delay, hops, lifetime | Explicit stability-efficiency trade-off | Fuzzy-rule and multi-input calibration |
| FlockHocNet | 2026 | Reactive multi-candidate | Position + velocity | Flocking bottleneck + LET + feedback | Explicit cohesion, alignment, separation | Link, latency, hops, contention proxy, flocking | Local flocking-compatible discovery and predictive repair | Control cost in sparse networks; weights require broader calibration |
Table 2.
Main Symbols and Default Parameters.
| Symbol | Meaning | Default / range |
|---|---|---|
| distance used as approximate transmission-range parameter | 300 m | |
| cohesion interaction radius (ProximityThreshold) | 150 m | |
| short-range separation distance | 12 m | |
| alignment speed-difference scale | 10 m/s | |
| cohesion/alignment/separation weights | .35/.45/.20 | |
| minimum local flocking quality for RREQ relay | .25 | |
| route-level flocking blend factor | .35 | |
| exponent in distance-based link-quality proxy | 2 | |
| contention scaling factor | 10 neighbors | |
| delay normalization constant | 100 ms | |
| HELLO interval | 1 s | |
| neighbor timeout | 3 s | |
| destination RREQ collection window | 50 ms | |
| provisional fast-RREP delay | 2 ms | |
| RREQ reply timeout | 200 ms | |
| link-break warning horizon | 5 s | |
| signal-proxy drop threshold | .20 | |
| distance-growth instability threshold | 50 m | |
| route/active-route lifetime | 30 s |
Table 3.
Simulation Configuration
| Parameter | Value |
|---|---|
| Network simulator | ns-3.46.1 |
| Mobility engine | SUMO; real OSM road graphs, synthetic vehicle trajectories |
| Road environments | Montreal downtown/Ville-Marie; Montreal Decarie/A-15/A-40 corridor |
| SUMO warm-up | 30 s before exported network interval |
| SUMO step / trace sampling | 0.2 s / 0.5 s |
| Driver heterogeneity | 3 profiles varying speed factor, acceleration, deceleration, and driver imperfection |
| Vehicle counts | 20, 40, 60, 80, 100 |
| Paired mobility realizations | 30 per road environment and population |
| Protocols | AODV, FlockHocNet Full |
| Total ns-3 simulations | 600 |
| Network simulation duration | 300 s |
| Application interval | nominally 20–295 s; per-flow start jitter within 20–21 s |
| UDP application flows | 8 endpoint-disjoint source-destination pairs |
| Packet size / source rate | 512 B / 64 kbit/s |
| Nominal aggregate offered rate | 512 kbit/s |
| PHY/MAC | IEEE 802.11p ad hoc, 10 MHz, channel 178, 6 Mbit/s OFDM |
| Transmit power | 20 dBm |
| Propagation | Two-Ray Ground; no added fading process |
| Experiment seed | 20260816; paired run index 1–30 |
| FlockHocNet enabled features | Bio-flocking; cohesion, alignment, separation; fast RREP; guarded/risk-aware backup; adaptive scoring; link-layer feedback; two-hop repair |
| FlockHocNet disabled feature | Proactive repair |
Table 4.
Key Paired PDR Results (30 Runs per Cell).
| Scenario | N | AODV mean | FlockHocNet mean | Relative change | 95% confidence interval of paired diff. | Holm p | |
|---|---|---|---|---|---|---|---|
| Highway | 20 | 0.01208 | 0.01170 | 0.160 | |||
| Highway | 40 | 0.06668 | 0.06646 | 0.397 | |||
| Highway | 60 | 0.20272 | 0.21416 | 0.201 | 0.420 | ||
| Highway | 80 | 0.38715 | 0.40998 | 0.0111 | 0.640 | ||
| Highway | 100 | 0.48969 | 0.52908 | 0.855 | |||
| Urban | 20 | 0.24997 | 0.25799 | 0.0587 | 0.412 | ||
| Urban | 40 | 0.56738 | 0.58876 | 0.0587 | 0.301 | ||
| Urban | 60 | 0.77601 | 0.86291 | 1.127 | |||
| Urban | 80 | 0.80125 | 0.88081 | 0.814 | |||
| Urban | 100 | 0.75677 | 0.89286 | 1.341 |
Disclaimer/Publisher’s Note: The statements, opinions and data contained in all publications are solely those of the individual author(s) and contributor(s) and not of MDPI and/or the editor(s). MDPI and/or the editor(s) disclaim responsibility for any injury to people or property resulting from any ideas, methods, instructions or products referred to in the content. |
© 2026 by the author. Licensee MDPI, Basel, Switzerland. This article is an open access article distributed under the terms and conditions of the Creative Commons Attribution (CC BY) license.
Copyright: This open access article is published under a Creative Commons CC BY 4.0 license, which permit the free download, distribution, and reuse, provided that the author and preprint are cited in any reuse.