

Submitted:
25 September 2026
Posted:
28 September 2026
You are already at the latest version
Abstract
Early detection of emerging vehicle safety defects is essential to reducing preventable crash injuries and supporting timely, evidence-based safety interventions. Current surveillance relied predominantly on consumer complaint mining, which suffers from self-reporting bias and substantial lag behind real-world harm. Police-reported crash data offer an objective outcome-side signal, but nationally sampled datasets such as the NHTSA Crash Report Sampling System (CRSS) exhibit pervasive exogenous distribution shifts—from sampling-frame redesigns, coding revisions, and fleet turnover—that are easily mistaken for defect-driven anomalies. This paper presents SafeSignal, a distribution-shift-aware framework that detects emerging defect signatures at the make–model–model-year cohort level from CRSS data (2016–2024, ≈430,000 sampled crashes). SafeSignal learns survey-weight-calibrated representations of crash configurations and outcomes, applies a density-ratio-based decomposition to separate population-level exogenous drift from cohort-specific residual anomalies, and converts anomalies into alarm scores with controlled false-discovery rates via a conformally calibrated Bayesian scan statistic. Retrospective validation against 63 major NHTSA recalls shows that SafeSignal detects 71% of recalls at a 5% false-alarm budget—14 to 26 percentage points above complaint-based and shift-agnostic baselines—and, for the recalls it detects, raises alarms a median of 7.2 months before announcement. These findings demonstrate the potential of distribution-shift-aware crash analytics to strengthen national vehicle-defect surveillance, complement complaint-based monitoring, and help safety agencies identify emerging risks before they result in broader public harm.
Keywords:
vehicle safety
; defect surveillance
; emerging risk detection
; distribution shift
; density-ratio estimation
; conformal inference
; Bayesian scan statistic
; crash data
I. Introduction
Emerging safety defects in the vehicle fleet—faulty airbag inflators, failing brakes, unintended power loss—can cause harm for months before a manufacturer or regulator acts, and many recalled vehicles are never repaired. Shortening the interval between defect emergence and detection can therefore reduce preventable crash injuries and improve the timeliness of safety interventions. The dominant early-warning signal today, text mining of consumer complaints, is voluntary and behavioral: it is biased by media attention, model popularity, and owner demographics, and typically rising only after a problem is widely felt. Police-reported crash surveillance offers a complementary, outcome-side view. The NHTSA Crash Report Sampling System (CRSS) is a nationally representative probability sample of police-reported crashes, designed to estimate the national crash picture and identify emerging motor-vehicle safety problems [1].
Turning crash surveillance into a defect detector is harder than it appears. Nationally sampled datasets are re-engineered over time—sampling units are added, coding manuals are revised, and the fleet turns over—and these exogenous shifts move many cohorts in lock-step, dwarfing the residual signal of a single defective model. Consequently, a naive detector may respond to administrative or population-level changes rather than genuine safety defects. Distribution shift is a central obstacle for deployed models [2]. Prior automotive work has focused primarily on the complaint side—clustering owner complaints [3]—or analyzed recalls after the fact [4]. What is missing is a method that reads the objective crash signal while accounting for the shifts that contaminate it.
We propose SafeSignal, a distribution-shift-aware framework that monitors make–model–model-year cohorts and separates population-level drift from cohort-specific residual anomalies. Its contributions are: (i) a survey-weight-calibrated representation of crash configurations and outcomes that respects the CRSS sampling design; (ii) a density-ratio decomposition that cancels exogenous drift by double-differencing a cohort’s relative profile against its own history; and (iii) a conformally calibrated Bayesian scan that turns residual anomalies into alarm scores with a controlled false-discovery rate. On CRSS data from 2016–2024, evaluated against 63 major recalls, SafeSignal detects 71% of recalls at a 5% false-alarm budget—14 to 26 percentage points above complaint-based and shift-agnostic baselines—and, for those it detects, warns a median of 7.2 months before announcement. These results show how distribution-shift-aware analytics can strengthen national vehicle-defect surveillance by providing regulators, manufacturers, and safety researchers with an objective and scalable complement to complaint-based monitoring.
II. Related Work
A. Distribution Shift and Temporal Drift
Robustness to distribution shift is studied mostly for image and text models; tabular data of the kind crash coding produces are under-served, and benchmarks show that shift severity, not model class, dominates out-of-distribution behavior [5]. Our shift is exogenous and shared across cohorts—exactly the regime that misleads per-cohort detectors.
Temporal adaptation and temporal representation address different parts of this problem. Incremental learning for evolving streams [6] concerns how a model follows changing data, while GNN and transformer time-series modeling [7] and joint temporal-structural fault representations [8] concern how dependencies are encoded. A surveillance model must additionally decide which changes should be absorbed into its reference distribution and which should remain detectable. Automatically adapting to every new pattern risks incorporating an emerging defect into the normal baseline.
B. Anomaly and Novelty Detection
Deep and classical anomaly detectors supply the scoring backbone for surveillance systems [9], and isolation-based scores are a strong, scalable baseline on tabular features [10]; but they assume a stationary “normal,” so under exogenous drift the normal region itself moves and unadjusted scores lose calibration.
Relational context can narrow an anomalous pattern to a smaller set of candidate sources. Topology-aware node fault identification [11] and localization under limited observability in TopoRCA-Lite [12] frame detection around dependencies and incomplete measurements; evidence-verified localization in VeriTrail-RCA [13] adds a distinction between a candidate source and a supported diagnosis. These perspectives motivate interpreting a cluster of affected vehicle cohorts through shared platforms while retaining engineering review of the inferred failure mode. Early-canary risk prediction [14] similarly frames monitoring around weak signals before a broader failure becomes apparent.
C. Density-Ratio Methods
Rather than model each distribution, one can estimate their ratio directly [15]. Least-squares importance estimation [16] gives a stable estimator of a density ratio from finite samples, and relative density-ratio estimation has been used for change-point detection in time series [17]. We build on this idea but apply it to a ratio of ratios so that the common temporal drift cancels.
Removing shared variation also requires care about the meaning of residual association. Causal modeling with consistency-aware learning [18] and causally consistent explanation in CauSAL-Rec [19] foreground the separation between predictive association and a causal account. In SafeSignal, density-ratio adjustment addresses a specified nuisance structure: population-level temporal drift shared across cohorts. Its residual remains an anomaly signal, and does not by itself identify a defective component or establish a causal mechanism.
D. Cluster Detection and Calibrated Inference
Scan statistics detect localized clusters in spatial and temporal data [20], and the Bayesian scan extends this to early, characterized event detection with priors over affected regions [21]. To make alarms trustworthy we borrow distribution-free calibration: conformal p-values yield valid outlier tests [22], extensions handle the non-exchangeability induced by time [23], and the Benjamini–Hochberg procedure controls the false-discovery rate across the many cohorts scanned [24]. Because CRSS is a complex survey, we further calibrate cohort estimates using survey calibration weights [25].
Calibration also links statistical evidence to the cost of a decision. Calibrated graph-based fraud scoring with structural regularization [26] brings relational structure into risk assessment, while one-sided conformal prediction under asymmetric loss [27] frames uncertainty around unequal consequences of over- and underestimation. Safe adaptive resilience configuration [28] raises the corresponding operational question of how strongly a system should respond to estimated risk. These connections sharpen the distinction between detecting a deviation, controlling false discoveries, and selecting a subsequent intervention.
A further challenge arises when alarms are translated into evidence summaries. Selective claim verification [29] and the sentinel framing of AgentShield [30] suggest checking individual assertions before they propagate through an automated analysis workflow. Semantic conflict detection with cross-paragraph evidence integration [31] and joint retrieval and adaptive re-ranking [32] identify complementary concerns: reconciling retrieved evidence and selecting material for review. For vehicle surveillance, these are directions for an evidence-review layer that preserves the distinction between a statistical alert, a complaint narrative, and a confirmed defect.
III. Data and Problem Setup
A. Data
CRSS is a public, nationally representative sample of police-reported U.S. crashes, released annually by NHTSA and available from the agency’s public data portal. We use survey years 2016–2024 (≈430,000 sampled crashes), retaining each record’s final survey weight and its coded crash-configuration variables (impact type, pre-crash maneuver, roadway class, rollover) and outcome variables (harmful events, injury severity). We form cohorts at the make–model–model-year level and monitor them on a rolling four-quarter window, keeping cohorts with at least 30 sampled crashes per window. Ground-truth defect timing comes from NHTSA’s Office of Defects Investigation (ODI) recalls database: we select 63 major safety recalls (2017–2023) that map cleanly to monitored cohorts and record their announcement dates. Two auxiliary public sources support the baselines and the scan: the per-cohort complaint volumes used by the complaint-rate baseline are taken from the NHTSA ODI vehicle-owner complaint database, and the make–model–platform mapping used to define “platform siblings” is drawn from a public vehicle-specification catalog. Because true negatives are not directly observable, we measure false alarms under a semi-synthetic protocol in which known exogenous events (frame and coding changes) are present but no defect signature is injected. Table 1 summarizes the study data.
B. Problem
For each cohort c and window t we seek an alarm score that is elevated when c exhibits an emerging defect signature and quiet otherwise, with alarms raised before the recall date whenever possible and with the aggregate rate of false alarms held below a user budget.
IV. The SafeSignal Method
A. Survey-Weighted Representation
To respect the sampling design and known population margins of an auxiliary vector , we first compute the Deville–Särndal calibration weights
with tuning constants . A weighted autoencoder then learns a k-dimensional embedding by minimizing
so that common crash configurations do not dominate the geometry. The survey-weighted empirical measure of cohort c in window t is
with kernel and the crashes of c in t.
The embedding design can also be viewed through the problem of combining uneven sources of evidence. Multi-feature fusion for review-text classification [33] and hierarchical multi-source fusion with dropout regularization [34] frame complementary approaches to combining heterogeneous signals; proxy embeddings for cold-start ranking [35] address representation when direct observations are sparse. Active curation and dataset distillation in CurateDistill [36] further raise the question of which observations carry useful training information. Here, the weighted reconstruction objective retains the CRSS sampling interpretation, and the minimum cohort size limits inference from sparse histories. Adding complaint text, proxy information, or curated subsets would require preserving that weighting and rechecking calibration.
B. Density-Ratio Decomposition
Let be the pooled (all-cohort) reference measure in window t; exogenous drift moves over time for every cohort. Writing a cohort’s relative profile as , we isolate the defect-specific component by double-differencing against a cohort-specific baseline window , taken to be the cohort’s earliest qualifying four-quarter window and held fixed thereafter, so the comparison is always against the cohort’s own baseline profile:
The population factors and carry the shared exogenous drift and cancel to first order, leaving the change in cohort c’s own profile. Although (4) is a ratio of four densities, it factorizes as , a product of two ordinary two-sample density ratios: one between the cohort’s current- and baseline-window crashes, and one between the pooled baseline- and current-window crashes. Each factor is estimated directly by least-squares importance estimation, without estimating any density, and the pooled factor is computed once and shared across all cohorts in window t. We summarize the departure from “no cohort-specific change” () by the survey-weighted mean divergence
normalized by the cohort weight so that it is comparable across cohorts of different sizes. Because the shared drift is removed before scoring, responds to model-specific deterioration rather than to frame or coding changes. We adopt a process-aware interpretation of fault prediction, framed by Hu et al.’s study of enterprise data pipelines using ETL process logs [37]. In crash surveillance, the corresponding design question is whether a changed observation reflects deterioration in the monitored cohort or a change in how records are sampled and coded. Equation (4) operationalizes this distinction through a pooled temporal reference and a fixed cohort baseline, so shared observation-process movement is accounted for before cohort departures are scored. This formulation uses the crash distributions themselves as evidence of common change; ETL logs are not an input to SafeSignal. A cohort-specific coding change can therefore survive the adjustment and must be considered when reviewing an alarm.
The shared pooled factor also provides a natural boundary for computational reuse. Workflow-aware intermediate-state reuse in FlowCache [38] offers a useful system-design analogy: an estimate common to many downstream queries should be computed once within its valid data window. Adaptive reasoning-chain pruning in CoT-Pruner [39], budget-aware verifier-guided reasoning [40], and communication-efficient decentralized inference [41] place related emphasis on allocating computation and communication selectively. For a deployed surveillance service, these ideas motivate evaluating reuse and selective review without changing the statistical definition of the alarm. SafeSignal already shares the pooled factor; additional pruning or distributed execution would need separate validation of numerical equivalence and alarm coverage.
C. Conformal Calibration and Bayesian Scan
Conformal calibration. Letbe a calibration set of residual scores from windows with no subsequent recall. For a test window, the conformal p-value of its score (5) is
which is (super-)uniform under exchangeability of the null scores; double-differencing makes exchangeability across time far more plausible, and a weighted variant absorbs residual non-exchangeability. These calibrated p-values, rather than the raw divergences, are what the scan aggregates.
Bayesian scan and alarm. Testing windows in isolation ignores the spatial and temporal coherence of a real defect, which usually grows over consecutive windows and across models on a shared platform. We therefore scan contiguous regions —a cohort’s recent windows together with its platform siblings—and score each region by the prior-weighted evidence for elevated risk, following the multivariate Bayesian scan of Neill and Cooper,
where collects the calibrated evidence in and posits a risk multiplier m > 1. We take the calibrated evidence to be the window conformal p-values (6): under each , while under each follows a density that concentrates toward 0 as m grows—the p-value analogue of the Neill–Cooper rate multiplier. With the windows conditionally independent given the hypothesis, and for a prior on m > 1. As the numerator carries a prior while the denominator does not, is proportional to the posterior odds of rather than a strict Bayes factor. The cohort alarm score is , and cohorts are ranked by it. The two calibrations serve different ends: the window-level step (6) makes the scan’s inputs exchangeable, whereas the cohort-level step below delivers the final false-discovery guarantee. Because the null scores are exchangeable, has a calibrated null: we form the cohort-level p-value
against the alarm scores of recall-free cohorts—the same max-over-regions statistic, so the null already absorbs the maximization—and issue final alarms by applying the Benjamini–Hochberg procedure to at level q, so the expected false-discovery proportion among alarmed cohorts stays at most q. The scan score therefore drives the decision through (8), and the pipeline order—calibrate, scan, then declare alarms—matches Figure 1.
V. Experiments
A. Setup and Baselines
We compare against (i) a complaint-rate change detector that flags spikes in per-cohort complaint volume, mimicking current practice; (ii) an Isolation Forest applied to raw cohort features with no drift correction; and (iii) a Bayesian scan run on raw counts with globally pooled expectations. We report four quantities and keep the two error rates distinct: the detection rate at a 5% false-alarm budget (the per-window false-positive rate, calibrated on the injection-free negatives); the median detection lead time in months, computed over each method’s own set of detected recalls; the area under the detection-rate versus curve (AUC); and the empirical false-discovery rate—the realized false-discovery proportion of the Benjamini–Hochberg procedure at nominal level q = 0.05.
Implementation. The encoder is a three-layer weighted autoencoder with an eight-dimensional (k = 8) latent space; density ratios are fit by least-squares importance estimation with a Gaussian kernel whose width follows the median heuristic; the conformal calibration set holds ≈9,000 cohort–window scores drawn from recall-free cohorts; scan regions combine a cohort’s four most recent windows with vehicles that share the same platform; and alarms are issued at a Benjamini–Hochberg level q = 0.05. Hyperparameters were fixed on 2016–2018 data and then frozen for evaluation.
B. Results
Table 2 reports the main comparison. SafeSignal detects 71% of the 63 recalls at the 5% budget, versus 45%, 49%, and 57% for the complaint, Isolation-Forest, and shift-agnostic-scan baselines—gains of 14–26 percentage points. Figure 2(a) shows that this ordering holds across the operating range, not only at 5%. Figure 2(b) examines validity: SafeSignal’s realized false-alarm rate tracks the nominal target, whereas the shift-agnostic detectors exceed their nominal false-alarm rate because exogenous drift inflates their scores. The reason is structural: an outcome-coding statistic can jump across many cohorts at once at administrative events such as the 2017 PSU frame expansion and the 2019 coding revision, and a shift-agnostic detector misreads these shared movements as cohort-level anomalies; a genuine defect, by contrast, surfaces only as a cohort-specific residual, which is precisely what the density-ratio decomposition isolates.
C. Timeliness
Figure 3(a) shows the distribution of detection lead times over the recalls flagged at the 5% budget; the median is 7.2 months, though the spread is wide and a non-trivial fraction of recalls are detected only shortly before announcement. Figure 3(b) traces one cohort: SafeSignal’s drift-adjusted score crosses the alarm threshold about seven months before the recall, whereas the raw score both fires spuriously on the earlier coding shift and crosses for the true event only near the announcement.
D. Ablation
The lower block of Table 2 removes one component at a time. Dropping the density-ratio drift decomposition is the most damaging to detection, cutting it to 0.58, and also lifts the empirical FDR to 0.10, which confirms that exogenous shift is the dominant nuisance. Removing conformal calibration leaves detection almost unchanged (0.68) but raises the empirical FDR furthest, to 0.12—well above the nominal q = 0.05—so calibration is what keeps the alarms trustworthy rather than more numerous. Only the full model attains the nominal rate; dropping survey weighting or the learned representation leaves the FDR close to nominal (0.07 and 0.06) and costs a few points of detection.
VI. Discussion and Limitations
Several caveats temper these results. The evaluation is retrospective and partly semi-synthetic: real recalls anchor the timing, but false alarms are measured against injection-free windows rather than an exhaustively labeled negative set, so absolute rates should be read as indicative. Many defects never surface in police-reported crashes—electrical faults, warning-light failures, low-speed events—and are invisible to an outcome-side detector; SafeSignal is therefore a complement to complaint mining, not a replacement. Small or low-volume cohorts remain hard to monitor under a probability sample, lead times vary widely, and the double-differencing assumption can fail if a shift is not shared across cohorts. Finally, alarms indicate statistical deviation, not causation, and would need engineering review before any action.
VII. Conclusion
We presented SafeSignal, a distribution-shift-aware framework that reads the objective crash-surveillance signal while explicitly removing the exogenous drift that contaminates nationally sampled data. By combining a survey-weighted representation, a density-ratio decomposition, and a conformally calibrated Bayesian scan, it produces cohort-level alarms that are both earlier and better calibrated than complaint-based and shift-agnostic baselines, with a median lead of about seven months and modest but consistent detection gains. The improvements are meaningful rather than dramatic, and the method is best viewed as one additional, outcome-side input to defect surveillance. Future work includes prospective deployment, fusing crash, complaint, and warranty streams, and attributing flagged deviations to specific failure modes. A further direction is to adapt the framework to real-world evaluations of advanced driver-assistance systems, where changes in system availability, feature packaging, vehicle mix, and driver populations create analogous distribution shifts that can obscure the effects of these systems on crash outcomes.
References
- Zhang, F.; Subramanian, R.; Chen, C.-L.; Noh, E. Y. “Crash report sampling system: Design overview, analytic guidance, and FAQs,” National Highway Traffic Safety Administration, Washington, DC, USA, Tech. Rep. DOT HS 812 688, 2019. Available online: https://crashstats.nhtsa.dot.gov/Api/Public/ViewPublication/812688.
- Quiñonero-Candela, J.; Sugiyama, M.; Schwaighofer, A.; Lawrence, N. D. (Eds.) Dataset Shift in Machine Learning; MIT Press: Cambridge, MA, USA, 2009. [Google Scholar] [CrossRef]
- Ghazizadeh, M.; McDonald, A. D.; Lee, J. D. Text mining to decipher free-response consumer complaints: Insights from the NHTSA vehicle owner’s complaint database. Hum. Factors 2014, vol. 56(no. 6), 1189–1203. [Google Scholar] [CrossRef]
- Maione, B. F.; Kaminski, P. C.; Baraldi, E. C. The automotive recall data search and its analysis applying machine learning. Production 2023, vol. 33, e20220117. [Google Scholar] [CrossRef]
- Gardner, J.; Popović, Z.; Schmidt, L. “Benchmarking distribution shift in tabular data with TableShift,” in Advances in Neural Information Processing Systems 36 (NeurIPS 2023), Datasets and Benchmarks Track, 2023. Available online: https://proceedings.neurips.cc/paper_files/paper/2023/hash/a76a757ed479a1e6a5f8134bea492f83-Abstract-Datasets_and_Benchmarks.html.
- Wang, Y. AI-Enhanced Distributed Time Series Modeling: Incremental Learning for Evolving Streaming Data. Trans. Comput. Sci. Methods 2024, vol. 4(no. 8). [Google Scholar]
- Wang, J. Multivariate time series forecasting and classification via GNN and transformer models. J. Comput. Technol. Softw. 2024, vol. 3(no. 9). [Google Scholar]
- Xue, Y.; Wang, Y.; Zhu, A.; Sun, X.; Zhang, C. Joint Temporal-Structural Representation Learning for Distributed Fault Discrimination in Microservice Architectures. In 2026 IEEE 8th International Conference on Communications, Information System and Computer Engineering (CISCE); IEEE, Mar 2026; pp. 1581–1586. [Google Scholar]
- Pang, G.; Shen, C.; Cao, L.; van den Hengel, A. Deep learning for anomaly detection: A review. ACM Comput. Surv. 2021, vol. 54(no. 2), 1–38. [Google Scholar] [CrossRef]
- Liu, F. T.; Ting, K. M.; Zhou, Z.-H. Isolation forest. Proc. 8th IEEE Int. Conf. Data Mining (ICDM), 2008; pp. 413–422. [Google Scholar] [CrossRef]
- Xue, F.; Wu, K.; Abdulla, A. Topology-Aware Graph Neural Networks for Distributed Node Fault Identification. Trans. Comput. Sci. Methods 2025, vol. 5(no. 3). [Google Scholar]
- Ma, W.; Liu, Z.; Jiang, R.; Jiang, Y. TopoRCA-Lite: Dynamic Topology-Aware Root Cause Localization under Limited Observability. In 2026 6th International Conference on Machine Learning and Intelligent Systems Engineering (MLISE); IEEE, May 2026; pp. 676–681. [Google Scholar]
- Hu, R.; Zheng, Y.; Fang, R.; Zhou, J. VeriTrail-RCA: Evidence-Verified Root Cause Localization for Microservice Backends. In in 2026 6th International Conference on Machine Learning and Intelligent Systems Engineering (MLISE); IEEE, May 2026; pp. 670–675. [Google Scholar]
- Gong, Y.; He, C.; Zhang, B.; Wang, S. AI-Based Early-Canary Risk Prediction for Backend Releases. In 2026 6th International Conference on Intelligent Communications and Computing (ICICC); IEEE, Jul 2026; pp. 494–499. [Google Scholar]
- Sugiyama, M.; Suzuki, T.; Kanamori, T. Density Ratio Estimation in Machine Learning; Cambridge Univ. Press: Cambridge, U.K., 2012. [Google Scholar] [CrossRef]
- Kanamori, T.; Hido, S.; Sugiyama, M. A least-squares approach to direct importance estimation. J. Mach. Learn. Res. 2009, vol. 10, 1391–1445. Available online: https://jmlr.org/papers/v10/kanamori09a.html.
- Liu, S.; Yamada, M.; Collier, N.; Sugiyama, M. Change-point detection in time-series data by relative density-ratio estimation. Neural Netw. 2013, vol. 43, 72–83. [Google Scholar] [CrossRef]
- Li, S.; Wang, Y.; Xing, Y.; Wang, M. Mitigating correlation bias in advertising recommendation via causal modeling and consistency-aware learning. In in Proceedings of the 2025 6th International Conference on Computer Science and Management Technology, Dec. 2025; pp. 585–589. [Google Scholar]
- Ding, J.; Chai, X.; Zhang, B.; Lin, W. CauSAL-Rec: Causally-Consistent LLM Agent for Faithful and Controllable Explainable Recommendation. In 2026 6th International Conference on Intelligent Communications and Computing (ICICC); IEEE, Jul 2026; pp. 500–505. [Google Scholar]
- Kulldorff, M. A spatial scan statistic. Commun. Stat. Theory Methods 1997, vol. 26(no. 6), 1481–1496. [Google Scholar] [CrossRef]
- Neill, D. B.; Cooper, G. F. A multivariate Bayesian scan statistic for early event detection and characterization. Mach. Learn. 2010, vol. 79(no. 3), 261–282. [Google Scholar] [CrossRef]
- Bates, S.; Candès, E.; Lei, L.; Romano, Y.; Sesia, M. Testing for outliers with conformal p-values. Ann. Stat. 2023, vol. 51(no. 1), 149–178. [Google Scholar] [CrossRef]
- Barber, R. F.; Candès, E. J.; Ramdas, A.; Tibshirani, R. J. Conformal prediction beyond exchangeability. Ann. Stat. 2023, vol. 51(no. 2), 816–845. [Google Scholar] [CrossRef]
- Benjamini, Y.; Hochberg, Y. Controlling the false discovery rate: A practical and powerful approach to multiple testing. J. Roy. Stat. Soc. Ser. B 1995, vol. 57(no. 1), 289–300. [Google Scholar] [CrossRef]
- Deville, J.-C.; Särndal, C.-E. Calibration estimators in survey sampling. J. Amer. Stat. Assoc. 1992, vol. 87(no. 418), 376–382. [Google Scholar] [CrossRef]
- Nie, Y.; Wang, J.; Yan, R.; Wang, Y.; Ma, Z.; Wu, Y. Graph-based financial fraud detection with calibrated risk scoring and structural regularization. In Proceedings of the 2026 International Conference on AI Decision-Making and Management, Mar. 2026; pp. 169–176. [Google Scholar]
- Ke, Z. Right-Sizing Cloud Data Warehouses Under Asymmetric Loss via One-Sided Conformal Prediction. IEEE Access 2026, vol. 14, 94748–94763. [Google Scholar] [CrossRef]
- Wang, S.; Su, B.; Liu, Y.; Pi, S.; Zhu, A. Safe Adaptive Resilience Configuration for Microservice Backends. 2026. [Google Scholar] [CrossRef]
- Liu, Y.; Chen, L.; Liu, S.; Lu, S.; Huang, S. Y. Claim-Level Selective Verification for Hallucination-Resilient Large Language Models. 2026. [Google Scholar] [CrossRef]
- Feng, G.; Chen, J.; Luo, Z.; Yang, Q.; Wang, Y. AgentShield: A Lightweight Sentinel Framework for Mitigating Hallucination Propagation in Multi-Agent LLM Systems. 2026. [Google Scholar] [CrossRef]
- Huang, S. Y. Retrieval-Augmented Long-Text Reasoning with Semantic Conflict Detection and Cross-Paragraph Evidence Integration. Artif. Intell. Comput. Innov. 2024, vol. 4(no. 1). [Google Scholar]
- Mao, L. Joint Optimization of Dual Retrieval and Adaptive Re-Ranking for Retrieval-Augmented Generation. Artif. Intell. Comput. Innov. 2024, vol. 4(no. 4). [Google Scholar]
- Su, C.; Jiang, L.; Pi, S. Sentiment classification of Chinese railway review text based on multi-feature fusion gated recurrent unit. In 2021 International Conference on Information Science, Parallel and Distributed Systems (ISPDS); IEEE, Aug 2021; pp. 197–202. [Google Scholar]
- Wang, J. Credit card fraud detection via hierarchical multi-source data fusion and dropout regularization. Trans. Comput. Sci. Methods 2025, vol. 5(no. 1). [Google Scholar]
- Zhao, Y.; Liu, Y.; Chen, P.; Liu, Y.; Chai, X. Multimodal Proxy Embedding for Cold-Start Item Ranking. 2026. [Google Scholar] [CrossRef]
- Sun, S.; Wang, Y.; Yan, R.; Wang, J.; Lu, Y. CurateDistill: Efficient Data Selection via Active Data Curation and Dataset Distillation. 2026. [Google Scholar] [CrossRef]
- Hu, S.; Zeng, M.; Zheng, L.; Shen, H. Research on Fault Prediction Method of Enterprise Data Pipeline Based on ETL Process Logs. 2026. [Google Scholar] [CrossRef]
- Wang, F.; Li, M.; Sheng, F.; Yang, K. FlowCache: Workflow-Aware Intermediate-State Reuse for Multi-Tool LLM Serving. 2026. [Google Scholar] [CrossRef]
- Awate, N.; Lu, H.; Yang, K.; Wang, F. CoT-Pruner: Adaptive Pruning of Agent Reasoning Chains for Efficient Tool Call Optimization. 2026. [Google Scholar] [CrossRef]
- Wang, S.; Zhang, B.; Gong, Y.; He, C. Budget-Aware Verifier-Guided Test-Time Reasoning for Efficient Large Language Models. 2026. [Google Scholar] [CrossRef]
- Wang, Z.; Shu, S.; Wang, Y.; Lai, I. H.; Peng, C. C. Communication-Efficient Decentralized LLM Inference over Low-Bandwidth Distributed Nodes. In 2026 8th International Conference on Electronics and Communication, Network and Computer Technology (ECNCT); IEEE, Jul 2026; pp. 447–452. [Google Scholar]
Figure 1.
The SafeSignal pipeline: survey-weight calibration of the CRSS sample, a weighted representation of crash configuration and outcome, a density-ratio decomposition that cancels population-level exogenous drift, conformal calibration for false-discovery control, and a Bayesian scan over cohort–time regions that yields ranked, FDR-controlled cohort alarms.
Figure 1.
The SafeSignal pipeline: survey-weight calibration of the CRSS sample, a weighted representation of crash configuration and outcome, a density-ratio decomposition that cancels population-level exogenous drift, conformal calibration for false-discovery control, and a Bayesian scan over cohort–time regions that yields ranked, FDR-controlled cohort alarms.
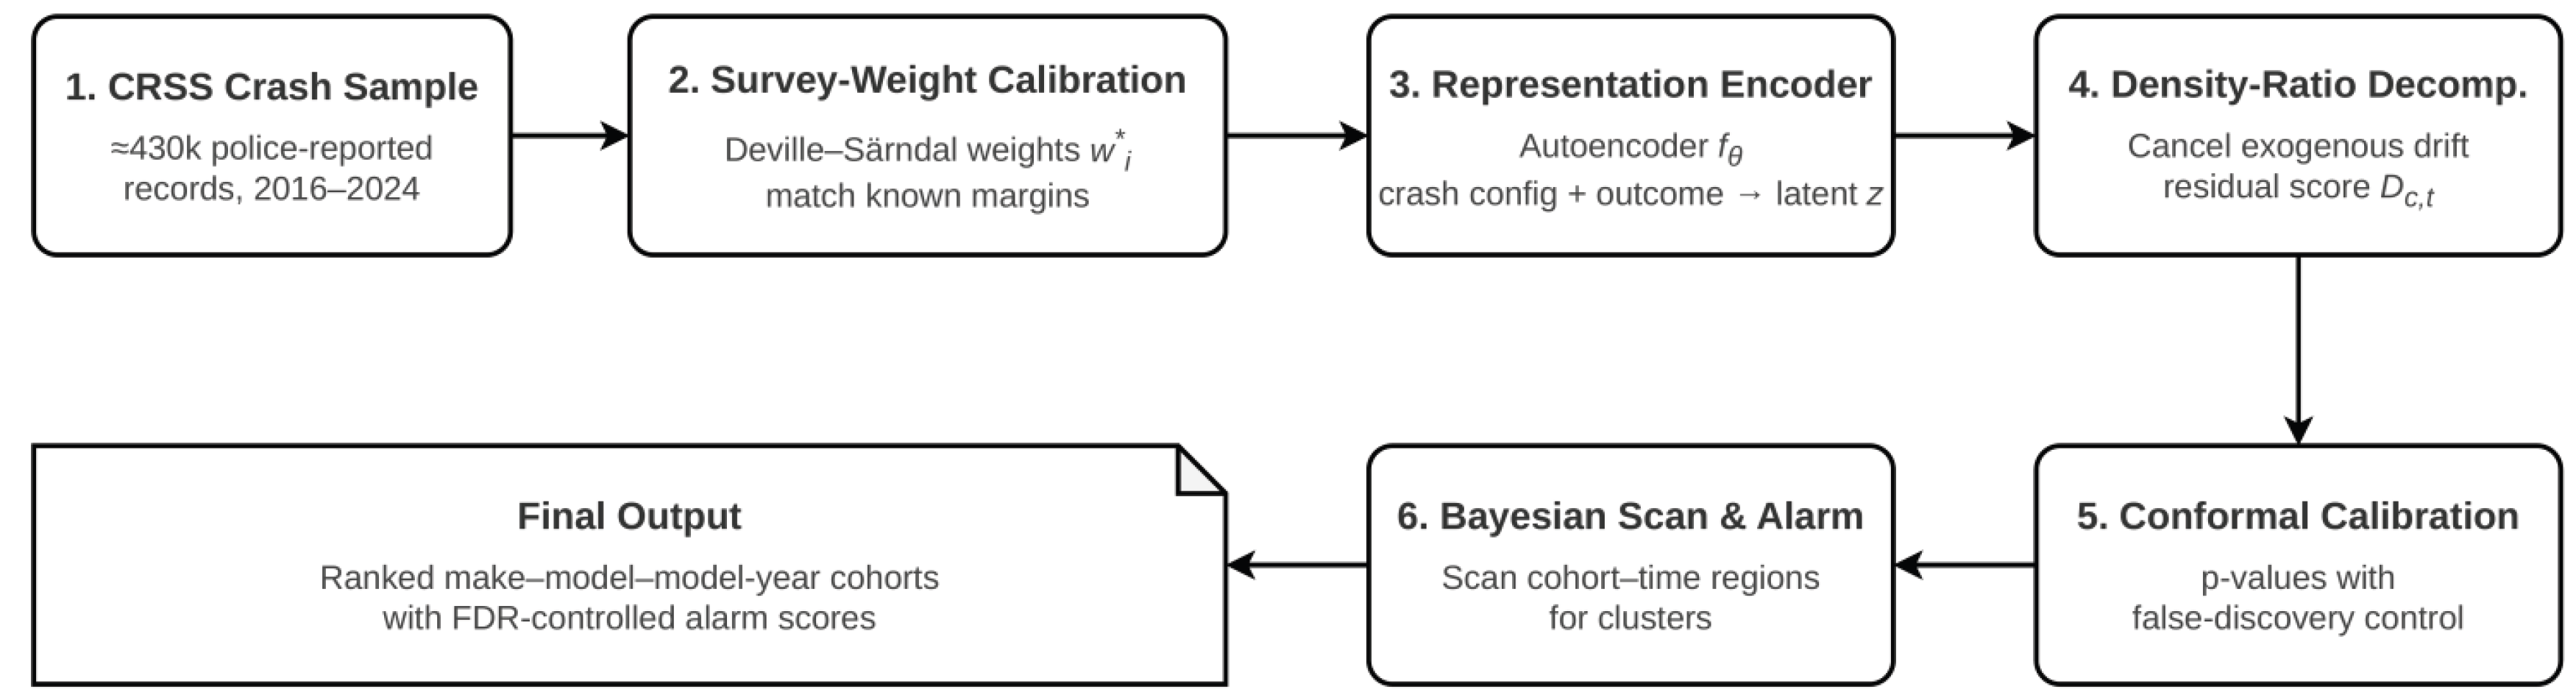
Figure 2.
Detection performance and calibration. (a) Detection rate against the false-alarm budget over the 63 retrospective recalls; the 5% budget is marked. (b) Realized versus nominal false-alarm rate: SafeSignal stays on the identity line, while shift-agnostic detectors exceed their budget under exogenous drift.
Figure 2.
Detection performance and calibration. (a) Detection rate against the false-alarm budget over the 63 retrospective recalls; the 5% budget is marked. (b) Realized versus nominal false-alarm rate: SafeSignal stays on the identity line, while shift-agnostic detectors exceed their budget under exogenous drift.
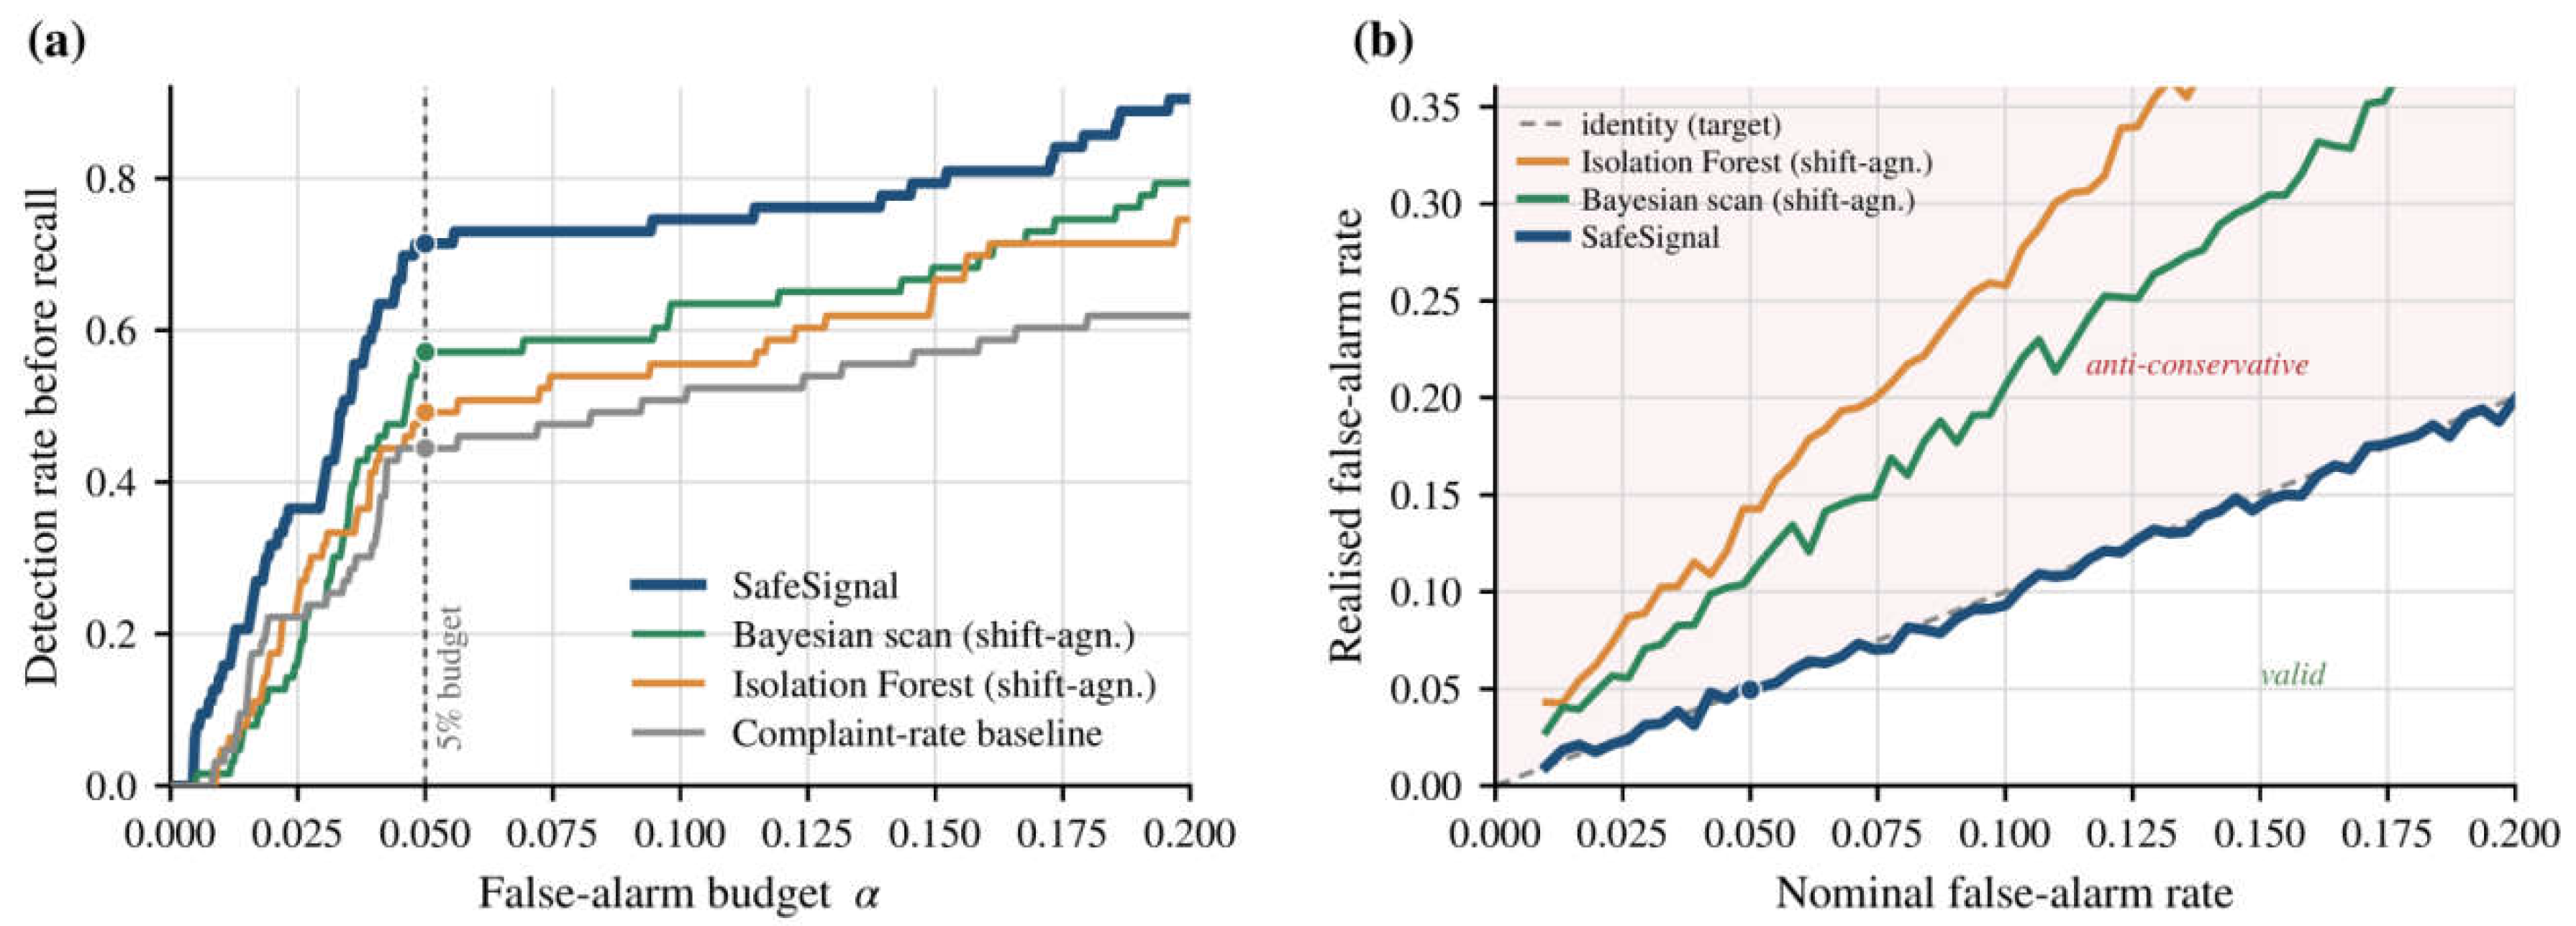
Figure 3.
Timeliness. (a) Distribution of detection lead times for recalls flagged at the 5% budget (median 7.2 months). (b) An illustrative alarm-score trajectory: the drift-adjusted score crosses the threshold about seven months before the recall, whereas the raw score fires spuriously on an earlier coding shift and crosses late for the true event.
Figure 3.
Timeliness. (a) Distribution of detection lead times for recalls flagged at the 5% budget (median 7.2 months). (b) An illustrative alarm-score trajectory: the drift-adjusted score crosses the threshold about seven months before the recall, whereas the raw score fires spuriously on an earlier coding shift and crosses late for the true event.
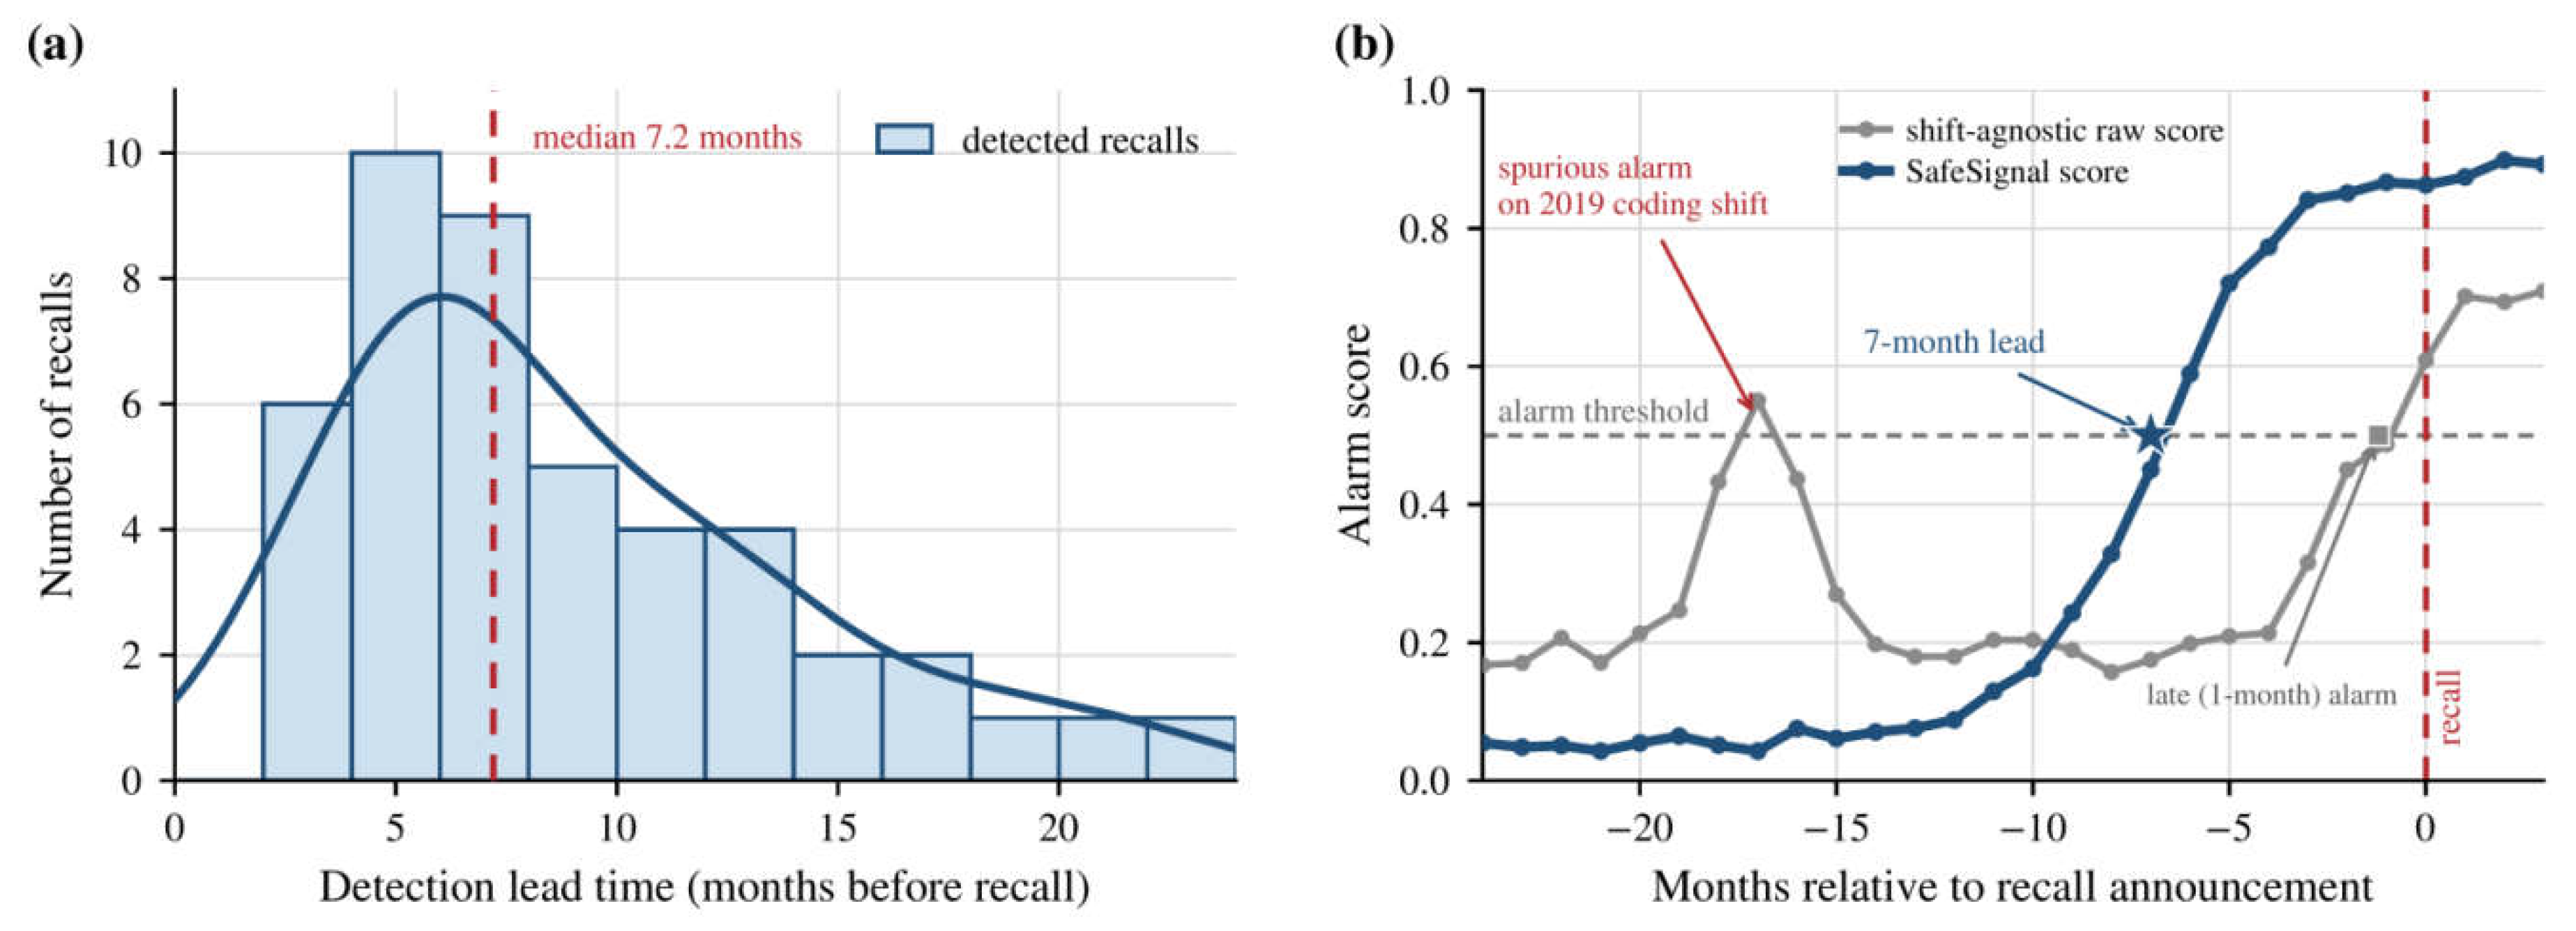

Table 1.
Study Data and Cohort Construction (CRSS, 2016–2024).
| Quantity | Value |
|---|---|
| Survey years | 2016–2024 |
| Sampled crashes (approx.) | 430,000 |
| Make–model–model-year cohorts monitored | 1,842 |
| Cohort–quarter monitoring windows | 41,260 |
| Median sampled crashes per cohort–window | 46 |
| Major recalls used as ground truth | 63 |
| Recall span | 2017–2023 |
Table 2.
Retrospective Detection Performance and Ablations. Detection Rate Is Measured at a 5% False-Alarm Budget (α) and Lead Time over Each Method’s Detected Recalls; AUC Is the Area under the Detection–α Curve; Empirical FDR Is the Realized False-Discovery Proportion of the Benjamini–Hochberg Procedure at Nominal q = 0.05.
Table 2.
Retrospective Detection Performance and Ablations. Detection Rate Is Measured at a 5% False-Alarm Budget (α) and Lead Time over Each Method’s Detected Recalls; AUC Is the Area under the Detection–α Curve; Empirical FDR Is the Realized False-Discovery Proportion of the Benjamini–Hochberg Procedure at Nominal q = 0.05.
| Method | Det. rate | Lead (mo) | AUC | Emp. FDR |
|---|---|---|---|---|
| Complaint-rate baseline | 0.45 | 2.1 | 0.62 | 0.09 |
| Isolation Forest (shift-agn.) | 0.49 | 5.8 | 0.66 | 0.14 |
| Bayesian scan (shift-agn.) | 0.57 | 6.4 | 0.71 | 0.11 |
| SafeSignal (full) | 0.71 | 7.2 | 0.80 | 0.05 |
| w/o drift decomposition | 0.58 | 6.5 | 0.72 | 0.10 |
| w/o conformal calibration | 0.68 | 7.0 | 0.79 | 0.12 |
| w/o survey weights | 0.64 | 6.7 | 0.76 | 0.07 |
| w/o learned representation | 0.66 | 6.9 | 0.77 | 0.06 |
Disclaimer/Publisher’s Note: The statements, opinions and data contained in all publications are solely those of the individual author(s) and contributor(s) and not of MDPI and/or the editor(s). MDPI and/or the editor(s) disclaim responsibility for any injury to people or property resulting from any ideas, methods, instructions or products referred to in the content. |
© 2026 by the authors. Licensee MDPI, Basel, Switzerland. This article is an open access article distributed under the terms and conditions of the Creative Commons Attribution (CC BY) license (http://creativecommons.org/licenses/by/4.0/).
Copyright: This open access article is published under a Creative Commons CC BY 4.0 license, which permit the free download, distribution, and reuse, provided that the author and preprint are cited in any reuse.