

Submitted:
24 September 2026
Posted:
24 September 2026
You are already at the latest version
Abstract
Municipal solid waste (MSW) pyrolysis is a promising route for recovering energy from non-recyclable fractions while reducing landfill volumes, yet most previous studies address waste characterization, kinetics, process simulation, and economic feasibility separately. This study integrates all four dimensions for representative MSW fractions from Guatemala City, combining laboratory-scale slow-pyrolysis experiments, Arrhenius-based kinetic modelling, industrial-scale process simulation, and a discounted-cash-flow economic evaluation, with the resulting kinetic and multivariable yield models cross-validated against independent literature data from the Central American region. Plastic fractions produced the highest bio-oil yields and calorific values, approaching those of fossil fuels, while organic and lignocellulosic fractions favored biochar formation. Multivariable regression models for prediction of biofuel yield and calorific value in relation to different chemical constituents of feedstock have produced prediction errors within +/-10%. Presence of chlorine and sulfur in co-plasticized materials restricts utilization of bio-oil in combustion engines. Process Simulation has shown that integrating bio-oil refinery into the petrochemical industry is feasible. However, the economic analysis indicated that project viability depends on the successful integration of waste-treatment services with revenues generated from biofuels and energy recovery. These integrated results confirm the technical and economic viability of pyrolysis as a circular-economy waste management strategy for Central American cities, provided the business model combines a waste-treatment-service component with energy recovery.
Keywords:
municipal solid waste
; pyrolysis
; waste-to-energy
; circular economy
; process simulation
; kinetic modelling
1. Introduction
The experiments were conducted in a laboratory-scale pyrolysis reactor equipped with a temperature control system and operated under an inert atmosphere. The de-sign of the experimental setup, involving the reactor, condenser, product collection system, and heating unit, is shown in Figure 1. Prior to the experiments, waste samples were classified, pulverized, and dried. The experimental temperature range was 300-600 °C. Quintuplicate experiments were performed at each temperature. Bio-oil, gas, and biochar were collected for further analysis. Thermogravimetric analysis and thermochemical kinetic modeling, based on thermochemical degradation equations, the Arrhenius equation, and the Boltzmann sigmoidal model, were used to analyze the thermochemical behavior.
The multivariable models to forecast yields and calorific values were also developed, based on the waste samples' elemental composition. These models were created using the data for typical waste generated from the sectorial classifications offered by Guatemala's Ministry of Environment and Natural Resources [19]. Process simulation was done using the Berkeley Madonna® and SuperPro Designer® to assess the industrial scale-up potential. Prospective economic analysis was done using the discounted cash flow method for a period of 10 years and considering several advanced business model scenarios.
1.1. Experimental Design and System Configuration
This study was developed using an experimental-computational approach focused on the slow pyrolysis of MSW, integrating laboratory-scale tests, kinetic modelling, and process simulation. Slow pyrolysis was selected due to its suitability for heterogeneous raw materials, extended residence times, and greater operational stability, characteristics widely documented for MSW and mixed plastic fractions [2,3]. In contrast to fast pyrolysis, which operates with high heating rates (>100 °C s⁻¹) and residence times on the order of seconds, this work was carried out under controlled heating rates (<10 °C min⁻¹), prioritizing the completion of mass and energy balances and the detailed characterization of the products, following the approach of Lu et al. [20].
The four stages of the methodological framework adopted in this study were implemented as follows: first, actual municipal solid waste samples from Guatemala City were characterized in terms of their composition and physicochemical properties; next, slow decomposition experiments were conducted in the laboratory under optimal conditions to analyze the solid, liquid, and gaseous products generated. Next, kinetic parameters and multi-stage predictive models were developed and verified based on experimental measurements and literature data; finally, the evaluated models were incorporated into large-scale simulations and used in economic analysis to assess the feasibility, scale, installation requirements, and economic efficiency of the process under various waste management scenarios.
1.2. Materials and Equipment
The samples consisted of municipal solid waste collected from selected collection centers in Guatemala City during the period 2023-2025, classified according to the national waste characterization regulations published by MARN [19]. In this study, we analyzed the organic, paper/cardboard, plastic, and sanitary waste fractions. We excluded glass and metals because they make a negligible contribution to thermochemical conversion processes [3]. It is important to mention that the sanitary waste fraction (14%) has disposable diapers and sanitary napkins. These absorbent materials may contain cellulose-fiber and superabsorbent-polymers, which may introduce some disruptions to the degradation process and kinetics compared to regular paper. Additionally, multivariable models for predicting yields and calorific values were developed based on the elemental composition of the waste, using experimental data for typical waste from the categories defined for Guatemala by the Ministry of Environment and Natural Resources [19].
Slow pyrolysis tests were performed in a fixed-bed batch reactor with a nominal capacity of 100 g, constructed of AISI 304 stainless steel and coupled to a Thermo Scientific F6030CM electric muffle furnace (operating range 25-1200 °C; accuracy ±1 °C). The generated vapors were directed to a glass condenser with countercurrent water cooling. Mass quantification of samples and products was performed using an Ohaus Value 300 Xtreme semi-analytical balance with a resolution of ± 0.1 g.
Preliminary thermal characterization of the residues was carried out using thermogravimetric analysis (TGA) to identify characteristic degradation ranges associated with slow-pyrolysis regimes, following characterization and kinetic-modelling approaches previously validated for mixed MSW streams [21,22,23]. The calorific value of the liquid products was determined using an IKA C200 bomb calorimeter, while the elemental chemical composition was analyzed using CHNS/O analysis and gas chromatography coupled to mass spectrometry (GC-MS), following protocols commonly applied to pyrolysis oils [6].
1.3. Experimental Protocol and Process Simulation
Representative samples of each waste fraction identified for Guatemala City were subjected to experimental pyrolysis. Each experiment included preparation of the feedstock, thermal degradation, limited by the availability of oxygen, product recovery, and the characterization of the solid, liquid, and gaseous fractions. The data from laboratory scale experiments were the basis for the construction of kinetic and process models.
The evolution of the pyrolysis reaction was represented using a simplified kinetic approach based on mass conversion. The rate of degradation of the feedstock was described according to Eq. (1):
The temperature dependence of the kinetic constant was represented using the Arrhenius equation:
Substitution of Eq. (2) into Eq. (1) yields:
The formation of pyrolysis products was estimated using product-specific yields according to:
Because the heating rate was expressed in, reaction time was expressed in minutes. Consequently, the conversion rate was obtained in ,, requiring the Arrhenius pre-exponential factor A to be reported in , to preserve dimensional consistency. Likewise, activation energies were converted from to prior to kinetic calculations to ensure consistency with the universal gas constant (R = 8.31446 J ).
The kinetic equations were coded in Berkeley Madonna® using a fourth-order Runge-Kutta numerical integration scheme. Simulations using experimentally deter-mined heating profiles and product yields were performed to model reaction progression, product generation and conversion over time [21].
Then, the process was modeled using SuperPro Designer® for industrial-scale assessment. The elements were feed preparation, pyrolysis, condensation, product recovery and auxiliary equipment sizes that were included in the simulation.
Equipment capacities, material balances, and utility requirements obtained from the simulations were later used as inputs for the economic feasibility analysis [10,26].
The integration of kinetic modelling and process simulation enabled the evaluation of laboratory-scale reaction behaviour and industrial-scale process performance within a unified engineering framework. This approach facilitated the identification of critical operating parameters, equipment requirements, and scale-up opportunities for municipal solid waste valorization systems.
Fixed-bed pyrolysis, condensation, and by-product removal operations were included in the simulation. The experimental plan followed a stepwise approach that integrated characterization of feedstock, laboratory-scale production of pyrolysis resulting in the formulation of kinetic models, and assessment of the industrial-scale production process. Representative samples of municipal solid waste were first fully characterized, and explicitly slowed pyrolysis tests were performed on them. The data obtained from the tests were used to determine kinetic parameters and formulate multivariable pre-diction models. Finally, the validated models were used to simulate various industrial operations in order to analyze their efficiency, the necessary machinery, their scalability, and their feasibility [27,28].
1.4. Data Analysis and Validation
The waste elemental prediction equations are formed from seven variables (C, N, H, O, S, Cl, and metals). During equation development, other variables were included, but only the aforementioned seven were included in the final prediction equations.
While equation development is not the main focus of this work, it was important to determine the accuracy and precision of the equations developed, therefore, models were assessed based on relative errors and correlation coefficients. Relative errors were assessed against an acceptance level of 5% to evaluate model performance. These acceptance levels are supported by recently published research on the pyrolysis of municipal solid waste and plastics [6].
Furthermore, the methodological approach adopted is consistent with the general principles of life cycle assessment, allowing the technical and energy results obtained to serve as a basis for integrated environmental assessments in later stages of project development [29].
The general form of the multivariable predictive model is given by Equation (5):
Cross-species and cross-breeding regression models were built based on the experimental and bibliographic data sets constructed over the course of this research. The generated equations were then employed to forecast biofuel productions and heating values as functions of residue composition.
To evaluate the accuracy of the models, we retrieved coefficient of determination (R²) and Mean Absolute Percentage Error (MAPE). These indicators were selected to quantify the goodness-of-fit of the predictive equations and to verify compliance with the established acceptance criterion of prediction errors below 5% for technical variables.
A. Coefficient of Determination . The coefficient of determination was calculated according to Eq. (6):
B. Mean Absolute Percentage Error (MAPE) The Mean Absolute Percentage Error was determined using Eq. (7):
where
Value measured experimentally in the laboratory (or reported in simulated databases).
: Numerical value predicted by the regression equation or by the Runge-Kutta integration.
Arithmetic mean of the experimental values.
: Total number of data points or runs evaluated.
2. Results and Discussion
2.1. Composition of Municipal Solid Waste and Suitability for Pyrolysis
The characterization of MSW in Guatemala City showed that approximately 89% by mass of the total stream is technically viable for treatment through pyrolysis, including organic waste, non-recyclable sanitary waste, plastics, and paper/cardboard. The organic fraction represents about 56% by mass, followed by sanitary waste (14%), plastics (13%), and paper/cardboard (6%). The glass and metal fractions, which together represent less than 5%, were excluded due to their low organic content and lack of thermochemical reactivity [2].
Plastic waste showed a high carbon content (>75% by mass) and virtually zero moisture, while organic and lignocellulosic waste showed high oxygen and moisture content (30-50%), factors that directly influence the reaction kinetics and the energy efficiency of the process, consistent with Márquez et al. [10].
The characterization identified eight main categories of MSW in Guatemala City. The average composition showed a predominance of organic waste, followed by sanitary waste, plastics, and paper/cardboard (Table 1); the remaining fractions corresponded to mixed waste, glass, hazardous waste, and metals. The characterization of municipal solid waste in Guatemala City based on MARN [19], revealed a clear predominance of the organic fraction, which accounted for approximately 56% of the total stream. Sanitary waste accounted for 14 percent of all types of waste generated. Plastics and paper/cardboard accounted for 13 percent and 6 percent, respectively. The rest comprised mixed waste, 4 percent; glass, 3%; hazardous waste, 2%; and metals, 2%. The analysis showed that about 89% of the total waste generated in the region could be converted to various chemicals by applying heat and/or steam, justifying the application of pyrolysis to convert the waste to energy in the region. The high proportion of organic and plastic residues further suggests opportunities for the simultaneous production of biochar and high-energy liquid fuels, respectively.
2.2. Product Yields and Calorific Values of Pyrolysis Products
The distribution of pyrolysis products showed a strong dependence on waste type and composition. Organic and garden-waste fractions generated bio-oil yields in the mid-range of 35-60%, accompanied by relatively high solid fractions (on average 30-45%). The calorific values of the bio-oils were lower than those of fossil fuels, while biochar showed values comparable to commercial solid fuels (24-36 MJ kg⁻¹) (Table 2). Biochar derived from food waste showed an ash content greater than 25%, which reduces its calorific value and limits its use as a high-quality solid fuel.
In contrast, plastic waste showed the capacity to reach higher calorific values, implying better energy performance. The yields and energy properties obtained for representative plastic waste fractions are summarized in Table 2. Bio-oil yields reached 60-80%, with calorific values between 41.7 and 44.2 MJ kg⁻¹, fully comparable to conventional diesel or gasoline [8,9]. These results confirm that plastic waste maximizes energy recovery, while organic waste is better integrated into combined valorization schemes.
Paper and cardboard waste yielded bio-oil between 40 and 60% and biochar between 20 and 40%. The liquid fraction generated calorific values between 22 and 30 MJ kg⁻¹, and the solid fraction between 14 and 20 MJ kg⁻¹, values comparable to those obtained for traditional solid fuels such as coal or wood [30]. The corresponding product yields and calorific values for representative paper and cardboard waste fractions are presented in Table 2.
Multivariable models were developed to predict yields and energy properties from elemental composition (C, H, O, N, S, Cl, and metals). These models showed prediction errors of less than 5% for plastic, paper/cardboard, and sanitary waste, and less than 10% for highly heterogeneous lignocellulosic waste, a significant improvement over the simplified correlations reported in the literature, where errors typically exceed 10-15% [21,26].
These models reveal an inverse relationship between the proportion of bio-oil (and its calorific value) and the percentage of oxygen, nitrogen, sulfur, and chlorine contained in each residue-whether as part of the chemical structure or as a contaminant introduced during pyrolysis. This finding is consistent with that reported by Miandad et al. [9] and Demirbas [30].
2.3. Multivariable Predictive Equations
The regression coefficients reported in Table 3 were subsequently incorporated into predictive equations describing product yields and energy properties as a function of waste elemental composition. These equations constitute practical engineering tools that permit rapid estimation of pyrolysis performance indicators without requiring extensive experimental campaigns, thereby supporting preliminary feasibility studies, process design, and waste-to-energy planning activities.
Using the coefficients reported in Table 3, the final predictive equations for biofuel yields and calorific values were formulated as follows.
Solid biofuel calorific value (MJ kg⁻¹) HHVsolid = 152.77 - 132.04X1 - 84.37X2 - 93.34X3 - 153.43X4 - 158.26X5 - 149.24X6 - 142.59X7.......(8)
Liquid biofuel calorific value (MJ kg⁻¹) HHVliquid = 231.43 - 194.90X1 - 191.87X2 - 162.80X3 - 214.20X4 - 219.61X5 - 210.88X6 - 239.84X7.......(9)
Gaseous biofuel calorific value (MJ m⁻³) HHVgas = 144.59 - 119.37X1 - 71.14X2 - 116.30X3 - 154.39X4 - 153.20X5 - 141.61X6 - 132.66X7.......(10)
Gaseous biofuel yield (%)Yieldgas = 3.44 - 3.20X1 - 3.15X2 - 4.04X3 - 3.19X4 - 3.45X5 - 3.14X6 - 2.84X7.......(11)
Liquid biofuel yield (%)Yieldliquid = -2.88 + 3.67X1 + 4.15X2 + 3.71X3 + 3.03X4 + 3.26X5 + 3.27X6 + 3.10X7.......(12)
Solid biofuel yield (%)Yieldsolid = 0.39 - 0.43X1 - 0.94X2 + 0.47X3 + 0.19X4 + 0.23X5 - 0.09X6 - 0.21X7.......(13)
where X1 is the carbon content (%), X2 is the nitrogen content (%), X3 is the hydrogen content (%), X4 is the oxygen content (%), X5 is the sulfur content (%), X6 is the chlorine content (%), and X7 is the metal content (%) in the original waste stream.
The coefficients show the elemental composition of the feedstock affects the product yield and energy characteristics. From an engineering perspective, these predictive equations provide a quantitative framework for screening potential feedstocks, evaluating resource recovery opportunities, and identifying waste streams with greater suitability for thermochemical conversion.
Feedstocks with high oxygen, sulfur, and chlorine content, as well as certain metals, contain low energy and poor quality biofuels. Biofuels generated from feedstocks with a high carbon and hydrogen content are of a high energy and quality. These results are in line with the reported thermochemical characteristics of municipal solid waste pyrolysis and other wastes used in the energy sector.
2.4. Reaction Kinetics and Residence Times
The kinetic analysis showed significant differences between the waste categories. Plastic waste reached almost complete conversion in considerably shorter times than organic and cellulosic waste (Figure 2). After fitting temperature ramps using sigmoidal functions in Berkeley Madonna®, the kinetic models reached correlation coefficients greater than 0.90, substantially improving on the initial fits based on linear heating, in line with co-pyrolysis kinetic studies of mixed organic and plastic feedstocks reported for other waste streams [10,22,31]. Machine-learning-assisted kinetic fitting has similarly been shown to improve the description of synergistic effects between co-processed waste fractions [32]. In Figure 2, the vertical axis shows the mass of reactants remaining in the pyrolysis reactor (kg) and the horizontal axis the reaction time (h); the red curve represents food waste, the green curve sanitary (toilet-paper) waste, and the blue curve high-density polyethylene. The vertical axis in Figure 2b refers to mass of liquid product accumulated (kg), and the horizontal one to reaction times (h); here, black curve stands for organic waste, blue curve for paper waste and red curve for high-density polyethylene. Plastic waste as shown in Figure 2b, has a much higher overall conversion than the organic and cellulosic fractions with practically complete degradation at very short residence time. In the same fashion, it was also found that plastics as feedstocks yield with higher rates of bio-oil than those obtained from other evaluated categories of waste (see Figure 2b).
The activation energies determined for plastic waste ranged from 190 to 240 kJ mol⁻¹, which explains its rapid thermal degradation. From a waste-management perspective, this behavior translates into higher processing capacities and smaller reactor volumes for plastic-rich streams. The predicted evolution of reactant consumption during pyrolysis for representative waste fractions is shown in Figure 2.
2.5. Process Simulation and Scale-Up Evaluation
The industrial process simulation using SuperPro Designer® was performed considering base cases with different waste flows. The simulation of industrial-scale processes (3 to 35 t d⁻¹) allowed for the sizing of critical equipment. The sizing results showed deviations of less than 20% compared to reference industrial plants, acceptable for pre-feasibility studies. The reactor and the condensation system were identified as the critical equipment for scale-up. It was also found that the gas-cleaning system (alkaline scrubber) represents between 12% and 18% of total investment cost when processing mixtures with more than 10% PVC, making its inclusion essential in realistic scenarios, consistent with the additional dechlorination costs reported for PVC-containing waste streams [33]. The simulation procedure and preliminary estimation of capital and operating costs were based on classic chemical-plant design and economics methodologies, widely accepted for industrial pre-feasibility studies [34,35]. The overall process flow diagram implemented in SuperPro Designer® for industrial-scale simulation is presented in Figure 3.
The industrial-scale equipment sizing obtained from the simulation, compared against reference values reported for commercial pyrolysis plants, is summarized in Table 4. The comparison with commercially available systems allowed the identification of design margins, equipment-sizing requirements, and potential optimization opportunities for future waste-to-energy facilities.
In all simulations, the required pyrolysis reactor volume was smaller than what is currently commercially available and the condensation areas that were indicated from the simulation were larger than are generally seen in commercial applications. This difference indicates that commercial designs may be out of scale for the reactor and under scaled for the condensation step for Guatemalan MSW composition and represents an optimization opportunity. The variations in predictions due to simplifying assumptions not considering unexpected operation conditions were well within the ranges of physically realizable equipment and commercially available equipment simulations. The results achieved are in accordance with the recent developments on the technical applicability of pyrolysis as a part of sustainable municipal solid waste management systems. The simulated procedure exhibited satisfactory technical performance reflecting a means which could be used for the assessment of waste to energy technologies based on circular economy criteria.
2.6. Economic Performance and Sensitivity of the Business Model
The economic analysis indicated that financial viability depends heavily on the waste management model adopted. Scenarios that include a charge for waste treatment or disposal showed positive net present value (NPV) and internal rate of return (IRR), while scenarios based solely on biofuel sales showed marginal returns, a pattern consistent with techno-economic assessments of electricity generation from plastic-waste pyrolysis oil, where feedstock cost and product price were identified as the main drivers of project viability [37]. Scenario 1 charges for treatment of 100% of the waste processed by the plant, in addition to biofuel sales; Scenario 2 applies the treatment charge to 50% of the waste processed, in addition to biofuel sales; and Scenario 3 relies solely on biofuel sales. This result confirms that pyrolysis should be conceived primarily as a waste management service with associated energy recovery, and not as an isolated fuel-production plant, in agreement with environmental and economic assessments of decentralized waste-to-energy models that similarly identify treatment-fee revenue as decisive for project feasibility [3,6,38]. The corresponding economic indicators for the three scenarios are presented in Table 5.
The economic evaluation followed standard project-management practice for capital-intensive investments, incorporating profitability, risk, and time-horizon criteria consistent with internationally recognized project-management frameworks [39]. The waste-treatment-fee model achieved internal rates of return exceeding 20% and payback periods between 3 and 5 years. However, the analysis did not consider decommissioning costs or potential environmental liabilities (e.g., hazardous-waste management from the gas scrubber), so it is recommended that these be included in more detailed feasibility studies at the conceptual engineering stage.
Beyond the specific case study evaluated, the methodology developed in this work provides a transferable framework that combines experimentation, predictive modelling, process simulation, and economic evaluation. The proposed approach may support engineering decision-making, preliminary process design, and planning of waste-to-energy projects in regions with similar municipal solid waste characteristics.
3. Conclusions
The present study demonstrates that pyrolysis represents a technically feasible and potentially economically viable strategy for the management of non-recyclable municipal solid waste fractions in Guatemala City. The integration of experimental characterization, kinetic modelling, multivariable predictive equations, process simulation, and techno-economic assessment provided a comprehensive framework for evaluating waste-to-energy alternatives under a circular economy approach.
Plastic-rich waste fractions generated the highest bio-oil yields and calorific values, whereas organic and lignocellulosic fractions favored biochar production. The predictive models developed in this work successfully related product yields and energy properties to elemental waste composition, achieving satisfactory prediction accuracy and supporting preliminary engineering assessments of alternative feedstocks.
The process simulation results confirmed the technical feasibility of industrial-scale implementation and identified the reactor and condensation systems as critical design units for scale-up. Economic analysis demonstrated that project viability depends strongly on integrating waste-treatment fees with revenues derived from energy recovery, highlighting the importance of adopting integrated, circular-economy-oriented, and financially sustainable waste management business models.
Beyond the specific case study evaluated, the methodology developed in this work provides a transferable framework that combines experimentation, predictive modelling, process simulation, and economic evaluation. The proposed approach may support engineering decision-making, preliminary process design, and planning of waste-to-energy projects in regions with similar municipal solid waste characteristics.
Author Contributions
L.E.Ñ.G.: Conceptualization, Methodology, Investigation, Data curation, Formal analysis, Writing original draft; A.N.V.S.: Investigation, Formal analysis, Visualization, Writing-review and editing; G.G.Z.R.: Software, Process simulation, Validation, Formal analysis; A.J.R.B.: Investigation, Experimental work, Validation, Data curation; A.L.L.: Validation, Formal analysis, Writing-review and editing; E.G.E.M.: Formal analysis, Data curation, Validation, Writing-review and editing; M.A.C.P.: Methodology, Validation, Supervision, Writing-review and editing; L.V.L.: Validation, Formal analysis, Writing-review and editing; M.A.Z.A.: Conceptualization, Supervision, Project administration, Resources, Writing-review and editing.
Funding
This research did not receive any specific grant from funding agencies in the public, commercial, or not-for-profit sectors.
Institutional Review Board Statement
Not applicable.
Informed Consent Statement
Not applicable.
Data Availability Statement
The raw data supporting the conclusions of this article will be made available by the authors on request.
Acknowledgments
This manuscript is from the doctoral dissertation by Luis Ernesto Núñez González, "Desarrollo de herramientas de evaluación técnica y económica basadas en métodos de modelado para la aplicación industrial de la pirólisis de residuos sólidos en la Ciudad de Guatemala," completed at Universidad de Investigación e Innovación de México (UIIX). The scientific results presented in this article originate from the research conducted within that doctoral work. The authors would like to thank Dr. Miguel Ángel Cruz Pérez for the english translation.
Declaration of Generative AI and AI-Assisted Technologies in the Writing Process
While writing this manuscript, the authors relied solely on Microsoft Copilot and OpenAI ChatGPT for assistance with language translation and English grammar/style corrections. ChatGPT-4.0 was used exclusively to improve the visual clarity and presentation quality of Figures 1–3, and correct a few words in the document. After using these tools, the authors reviewed and edited the content as needed and take full responsibility for the content of the published article. No generative AI tools were used to create, analyze, interpret, validate, or modify research data, results, or scientific conclusions. The scientific results reported in this manuscript originate from the doctoral thesis entitled “Desarrollo de herramientas de evaluación técnica y económica basadas en métodos de modelación para la aplicación industrial de pirólisis de residuos sólidos en la ciudad de Guatemala”, developed by the first author. The manuscript is unpublished original scientific work that has yet to appear in a scientific journal of peer review. AI assistance has been integrated into the manuscript, but has been critically reviewed and edited by authors, taking full responsibility for the manuscript.
Conflicts of Interest
The authors declare that they have no known competing financial interests or personal relationships that could have appeared to influence the work reported in this paper.
References
- Kaza, S.; Yao, L.; Bhada-Tata, P.; Van Woerden, F. What a Waste 2.0. World Bank. 2018. Available online: https://openknowledge.worldbank.org/handle/10986/30317 (accessed on 15 September 2026).
- López, G.; Artetxe, M.; Amutio, M.; et al. Thermochemical conversion of municipal solid waste: a review. Waste Manag. 2020, 102, 1–15. [CrossRef]
- Arena, U. Process and technological aspects of municipal solid waste gasification. Waste Manag. 2014, 34, 625–639. [CrossRef]
- Zhang, H.; Xiao, R.; Huang, H.; Xiao, G. Thermochemical conversion of MSW for energy and material recovery. Waste Manag. 2022, 138, 47–59. [CrossRef]
- Geissdoerfer, M.; Savaget, P.; Bocken, N.; Hultink, E. The circular economy — a new sustainability paradigm? J. Clean. Prod. 2017, 143, 757–768. [CrossRef]
- Jeswani, H.K.; Chilvers, A.; Azapagic, A. Environmental sustainability of waste plastic pyrolysis. Sci. Total Environ. 2019, 667, 594–604. [CrossRef]
- Chen, D.; Yin, L.; Wang, H.; He, P. Pyrolysis technologies for municipal solid waste: A review. Waste Manag. 2014, 34(12), 2466–2486. [CrossRef]
- Al-Salem, S.M.; Antelava, A.; Constantinou, A.; Manos, G.; Dutta, A. A review on thermal and catalytic pyrolysis of plastic solid waste. J. Environ. Manage. 2017, 197, 177–198. [CrossRef]
- Miandad, R.; Barakat, M.A.; Aburiazaiza, A.S.; et al. Catalytic pyrolysis of plastic waste. Energy Convers. Manage. 2019, 181, 512–528. [CrossRef]
- Márquez, A.; Patlaka, E.; Sfakiotakis, S.; Ortiz, I.; Sánchez Hervás, J. Pyrolysis of municipal solid waste: a kinetic study through multi-step reaction models. Waste Manag. 2023, 172, 171–181. [CrossRef]
- Lehmann, J.; Joseph, S. Biochar for Environmental Management. Routledge. 2015.
- Mohan, D.; Pittman, C.U.; Steele, P. Biochar production and applications. Energy Fuels 2019, 20, 848–889. [CrossRef]
- Sun, Y.N.; Tao, J.Y.; Chen, G.Y.; Yan, B.B.; Cheng, Z.J. Distribution of Hg during sewage sludge and municipal solid waste co-pyrolysis: influence of multiple factors. Waste Manag. 2020, 107, 276–284. [CrossRef]
- European Commission. Circular Economy Action Plan. 2020. Available online: https://ec.europa.eu (accessed on 15 September 2026).
- EPA. Advancing Sustainable Materials Management. 2022. Available online: https://www.epa.gov/smm (accessed on 15 September 2026).
- IEA Bioenergy. Energy Recovery from Waste. 2016. Available online: https://www.ieabioenergy.com (accessed on 15 September 2026).
- IRENA. Innovation Outlook: Waste-to-Energy. 2020. Available online: https://www.irena.org (accessed on 15 September 2026).
- United Nations Environment Programme (UNEP). Global Waste Management Outlook 2021. 2021. Available online: https://www.unep.org/resources/report/global-waste-management-outlook-2021 (accessed on 15 September 2026).
- MARN. Guía para elaborar Estudios de Caracterización de Residuos Sólidos Comunes. Ministerio de Ambiente y Recursos Naturales, Guatemala. 2021. Available online: https://www.marn.gob.gt/wpfd_file/guia-para-elaborar-estudios-de-caracterizacion-de-residuos-solidos-comunes/ (accessed on 15 September 2026).
- Lu, J.-S.; Chang, Y.; Poon, C.-S.; Lee, D.-J. Slow pyrolysis of municipal solid waste (MSW): A review. Bioresour. Technol. 2020, 312, 123615. [CrossRef]
- White, J.E.; Catallo, W.J.; Legendre, B.L. Biomass pyrolysis kinetics. J. Anal. Appl. Pyrolysis 2011, 91, 1–33. [CrossRef]
- Gai, C.; Dong, Y.; Zhang, T. Kinetic analysis of MSW pyrolysis. Energy 2013, 54, 208–214. [CrossRef]
- Chhabra, V.; Bhattacharya, S.; Shastri, Y. Pyrolysis of mixed municipal solid waste: characterisation, interaction effect and kinetic modelling using the thermogravimetric approach. Waste Manag. 2019, 90, 152–167. [CrossRef]
- ISO. ISO 8217: Petroleum Products - Fuels (Class F). 2014. Available online: https://www.iso.org/standard/63554.html (accessed on 15 September 2026).
- ISO. ISO 21644: Solid Recovered Fuels - Classification. 2018. Available online: https://www.iso.org/standard/70103.html (accessed on 15 September 2026).
- Zhang, A.; Yu, Z.; Ren, H. Kinetics and thermodynamics of MSW pyrolysis. Energy Sources, Part A 2021, 43, 3001–3015. [CrossRef]
- Towler, G.; Sinnott, R. Chemical Engineering Design. Elsevier. 2021. Available online: https://www.sciencedirect.com/book/9780081026115 (accessed on 15 September 2026).
- Viltres, H.; Alarcón, J. Process simulation of fast pyrolysis plants. Chem. Eng. Res. Des. 2022, 179, 392–404. [CrossRef]
- ISO. ISO 14040: Environmental Management - Life Cycle Assessment - Principles and Framework. 2018. Available online: https://www.iso.org/standard/37456.html (accessed on 15 September 2026).
- Demirbas, A. Chemical and fuel properties of biochar. Energy Sources, Part A 2009, 31(6), 566–572. [CrossRef]
- Chen, R.; Zhang, S.; Yang, X. Thermal behaviour and kinetic study of co-pyrolysis of microalgae with different plastics. Waste Manag. 2021, 126, 331–339. [CrossRef]
- Li, S.; Qu, R.; Hu, E.; Liu, Z.; Xiong, Q.; Yu, J.; Zeng, Y.; Li, M. Co-pyrolysis kinetics and enhanced synergy for furfural residues and polyethylene using artificial neural network and fast heating. Waste Manag. 2025, 195, 177–188. [CrossRef]
- Yuan, G.; Chen, D.; Yin, L.; Wang, Z.; Zhao, L.; Wang, J.Y. High efficiency chlorine removal from polyvinyl chloride (PVC) pyrolysis with a gas-liquid fluidized bed reactor. Waste Manag. 2014, 34(6), 1045–1050. [CrossRef]
- Peters, M.S.; Timmerhaus, K.D.; West, R.E. Plant Design and Economics for Chemical Engineers. McGraw-Hill. 2019.
- Turton, R.; Bailie, R.; Whiting, W.; et al. Analysis, Synthesis and Design of Chemical Processes. Pearson. 2018.
- Beston Group. Waste Plastic Pyrolysis Plant Technology Overview. 2023. Available online: https://bestoncompany.com (accessed on 15 September 2026).
- Cudjoe, D.; Brahim, T.; Zhu, B. Assessing the economic and ecological viability of generating electricity from oil derived from pyrolysis of plastic waste in China. Waste Manag. 2023, 168, 354–365. [CrossRef]
- Liu, H.; Liu, T.; Wei, G.; Zhao, H.; Li, T.; Weng, F.; Guo, X.; Wang, Y.; Lin, Y. Environmental and economic assessment of rural domestic waste gasification models in China. Waste Manag. 2022, 154, 160–174. [CrossRef]
- Project Management Institute (PMI). PMBOK Guide. 2021. Available online: https://www.pmi.org (accessed on 15 September 2026).
Figure 1.
General diagram of the simulated industrial-scale pyrolysis process. Source: simulation in SuperPro Designer®.
Figure 1.
General diagram of the simulated industrial-scale pyrolysis process. Source: simulation in SuperPro Designer®.
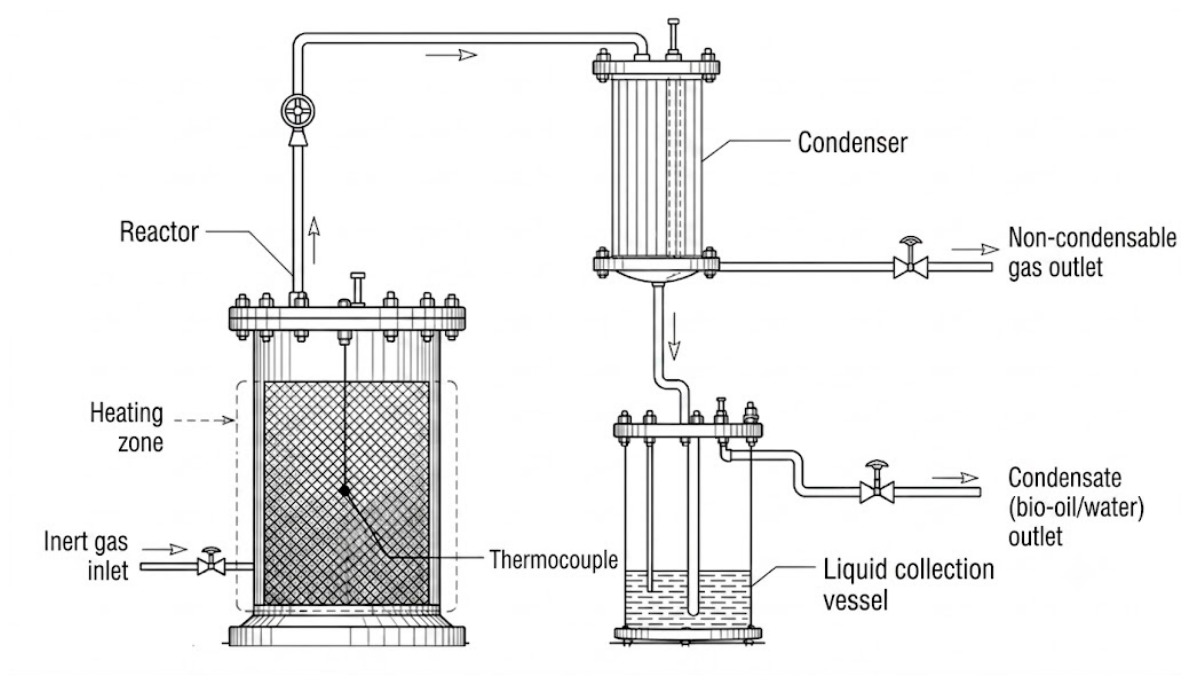
Figure 2.
Kinetic model predictions for representative municipal solid waste fractions: (a) evolution of reactant mass fraction during pyrolysis and (b) predicted accumulation of pyrolysis products as a function of reaction time.
Figure 2.
Kinetic model predictions for representative municipal solid waste fractions: (a) evolution of reactant mass fraction during pyrolysis and (b) predicted accumulation of pyrolysis products as a function of reaction time.
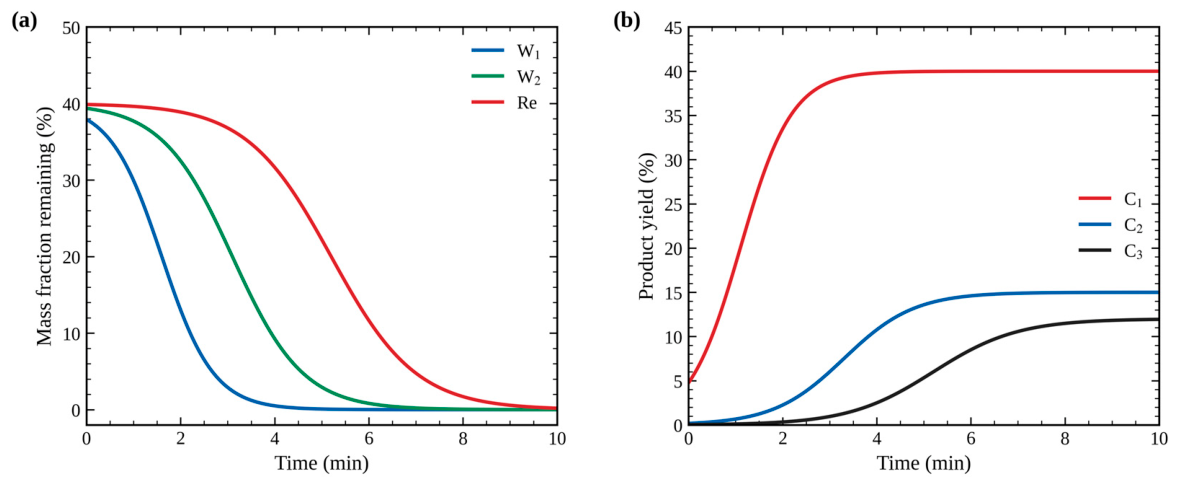
Figure 3.
General diagram of the simulated industrial-scale pyrolysis process. Source: simulation in SuperPro Designer®.
Figure 3.
General diagram of the simulated industrial-scale pyrolysis process. Source: simulation in SuperPro Designer®.
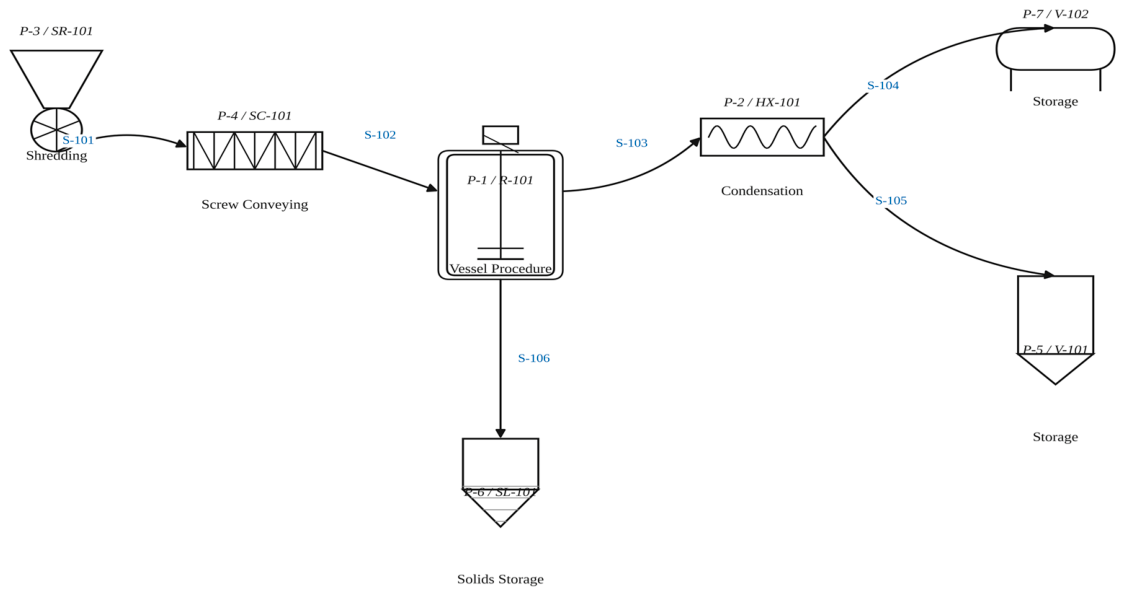

Table 1.
Average composition of municipal solid waste in Guatemala City.
| Material | Share of total mass |
| Organic material | 56% |
| Sanitary waste | 14% |
| Plastic | 13% |
| Paper and cardboard | 6% |
| Mixed / other | 4% |
| Glass | 3% |
| Hazardous waste | 2% |
| Metals | 2% |
Note, prepared by the authors based on municipal solid waste characterization data reported by MARN [19].
Table 2.
Typical yields and calorific values of pyrolysis products derived from representative municipal solid waste fractions.
Table 2.
Typical yields and calorific values of pyrolysis products derived from representative municipal solid waste fractions.
| Feedstock | Solid (%) | Liquid (%) | Gas (%) | Solid HV (MJ/kg) | Liquid HV (MJ/kg) | Gas HV (MJ/m³) |
| Food waste | 25–35 | 40–50 | 20–30 | 15–20 | 25–30 | 10–15 |
| Dry leaves | 30–40 | 35–45 | 20–25 | 18–22 | 28–32 | 12–16 |
| Branches and wood | 25–35 | 40–50 | 20–30 | 20–25 | 30–35 | 15–20 |
| Fruit peels | 20–30 | 45–55 | 15–25 | 12–15 | 20–25 | 8–12 |
| Grass | 20–30 | 50–60 | 10–20 | 10–15 | 18–22 | 7–10 |
| PET | 15–20 | 45–55 | 25–35 | 24–28 | 31–34 | 18–22 |
| HDPE | 5–10 | 70–80 | 10–20 | 28–32 | 43–45 | 20–25 |
| PP | 5–10 | 65–75 | 15–25 | 28–32 | 41–43 | 20–25 |
| PS | 10–15 | 60–70 | 15–25 | 28–32 | 39–41 | 20–25 |
| PVC | 15–20 | 45–55* | 25–35 | 18–22 | 35–37* | 10–15 |
| White paper | 20–30 | 50–60 | 10–20 | 14–18 | 25–30 | 10–15 |
| Newspaper/newsprint | 25–35 | 45–55 | 10–20 | 12–16 | 22–27 | 9–12 |
| Corrugated board | 30–40 | 40–50 | 10–20 | 16–20 | 27–32 | 11–14 |
| Laminated paperboard | 25–35 | 45–55 | 10–20 | 15–19 | 25–30 | 10–13 |
| Recycled paperboard | 20–30 | 50–60 | 10–20 | 14–18 | 22–28 | 9–12 |
Note: Values represent typical ranges obtained from experimental results and literature sources analyzed in this study. HV = Heating Value. The asterisk (*) denotes values potentially influenced by chlorine-containing compounds derived from PVC. Prepared by the authors.
Table 3.
Regression coefficients of the multivariable models for predicting biofuel yields and calorific values.
Table 3.
Regression coefficients of the multivariable models for predicting biofuel yields and calorific values.
| Predicted property | a | X1 | X2 | X3 | X4 | X5 | X6 | X7 |
| Solid biofuel calorific value | 152.77 | -132.04 | -84.37 | -93.34 | -153.43 | -158.26 | -149.24 | -142.59 |
| Liquid biofuel calorific value | 231.43 | -194.90 | -191.87 | -162.80 | -214.20 | -219.61 | -210.88 | -239.84 |
| Gaseous biofuel calorific value | 144.59 | -119.37 | -71.14 | -116.30 | -154.39 | -153.20 | -141.61 | -132.66 |
| Gaseous biofuel yield (%) | 3.44 | -3.20 | -3.15 | -4.04 | -3.19 | -3.45 | -3.14 | -2.84 |
| Liquid biofuel yield (%) | -2.88 | 3.67 | 4.15 | 3.71 | 3.03 | 3.26 | 3.27 | 3.10 |
| Solid biofuel yield (%) | 0.39 | -0.43 | -0.94 | 0.47 | 0.19 | 0.23 | -0.09 | -0.21 |
Note: X1 = carbon content (%), X2 = nitrogen content (%), X3 = hydrogen content (%), X4 = oxygen content (%), X5 = sulfur content (%), X6 = chlorine content (%), and X7 = metal content (%) in the original waste stream. Prepared by the authors.
Table 4.
Comparison of reference and simulated values for key equipment design characteristics of the plastic-waste pyrolysis process at different feed flows.
Table 4.
Comparison of reference and simulated values for key equipment design characteristics of the plastic-waste pyrolysis process at different feed flows.
|
Design characteristic |
Ref. 3 t/d | Sim. 3 t/d | Ref. 6 t/d | Sim. 6 t/d | Ref. 16 t/d | Sim. 16 t/d | Ref. 35 t/d | Sim. 35 t/d |
| Reactor volume (m³) | 7.54 | 6.8 | 22.81 | 22.62 | 43.72 | 41.47 | 47.08 | 45.24 |
| Mill power (kW) | 4 | 3.5 | 5.5 | 6 | 7.5 | 7 | 15 | 12.5 |
| Condenser area (m²) | 7.58 | 8.5 | 17.8 | 20 | 35.6 | 36.2 | 74.4 | 82.5 |
| Thermal energy per batch (kJ) | 1,673,600 | 1,400,000 | 2,510,400 | 2,400,000 | 3,347,200 | 3,400,000 | Continuous flow | Continuous flow |
| Operating mode | Batch | Batch | Batch | Batch | Batch | Batch | Continuous | Continuous |
Note, source prepared by the authors using SuperPro Designer® and reference data from Beston Group [36].
Table 5.
Economic indicators for plastic-waste pyrolysis, cash flow over 10 years, plant scale of 6 t/d.
Table 5.
Economic indicators for plastic-waste pyrolysis, cash flow over 10 years, plant scale of 6 t/d.
| Indicator | Scenario 1 | Scenario 2 | Scenario 3 |
| WACC | 12% | 12% | 12% |
| IRR | 26.5% | 12.8% | -10.1% |
| NPV | Q 430,578.13 | Q 19,471.59 | -Q 413,272.13 |
| Payback period (years) | 3.5 | 8 | N/A |
| Benefit-cost ratio (BCR) | Q 1.14 | Q 1.03 | Q 0.92 |
Note, values in Guatemalan quetzales (GTQ).
Disclaimer/Publisher’s Note: The statements, opinions and data contained in all publications are solely those of the individual author(s) and contributor(s) and not of MDPI and/or the editor(s). MDPI and/or the editor(s) disclaim responsibility for any injury to people or property resulting from any ideas, methods, instructions or products referred to in the content. |
© 2026 by the authors. Licensee MDPI, Basel, Switzerland. This article is an open access article distributed under the terms and conditions of the Creative Commons Attribution (CC BY) license (http://creativecommons.org/licenses/by/4.0/).
Copyright: This open access article is published under a Creative Commons CC BY 4.0 license, which permit the free download, distribution, and reuse, provided that the author and preprint are cited in any reuse.