

Submitted:
23 September 2026
Posted:
24 September 2026
You are already at the latest version
Abstract
Alzheimer's disease (AD) is a neurologic condition that is categorized by a progressive loss of neurons with time. It is a particularly frequent kind of dementia and mostly impacts cognitive and motor functions. It’s prevalent in the elderly population, but the onset occurs at an incredibly early age. Early identification of AD is crucial for the successful management of the condition and for the development of novel treatments that can halt or reverse it. Because clinical symptoms may appear after substantial pathological changes have occurred, early diagnosis remains challenging despite major advances in imaging and fluid biomarkers. The situation is made worse by the expensive diagnostic techniques that are time-consuming and that cannot detect AD at an early stage. There is a better chance for potential treatments to work in the preliminary stages as no significant neuronal damage has occurred in its initial stages, which is why early detection is critical. There are many screening techniques, but they do not yet have the necessary sensitivity and specificity to correctly diagnose the condition. One approach to improve the diagnostic method for early AD detection is based on combining two or more diagnostic methods. The multi-modal approach is more effective in detecting AD early in its progression as well as differentiating it from other neurological conditions. This approach also allows for the accurate classification of patients into various stages of the disease. This review covers two topics: Alzheimer's neuropathology hypotheses and diagnostic methods. It gives an overview of different hypotheses including amyloid, tau, inflammation, oxidative stress, and mitochondrial dysfunction. The review also examines various diagnostic methods such as gait and speech analysis, and multi-modal approaches.
Keywords:
AD
; early diagnosis
; neurodegeneration
; amyloid plaques
; neurofibrillary tangles
; cognitive impairment
; motor dysfunction
; diagnostic techniques
; multi-modal approach
1. Introduction
Alzheimer’s Disease is a progressive neurological disease that slowly affects the person’s cognitive and motor functions. AD accounts for sixty to seventy percent of all recorded instances of dementia, making it the most frequently observed of all types of dementia [1]. According to the World Health Organization, 57 million people were living with dementia worldwide in 2021, and over 60% lived in low- and middle-income countries [2]. There is currently no cure for AD, although symptomatic treatments are available and disease-modifying anti-amyloid therapies such as lecanemab and donanemab have received FDA approval [3,4]. An earlier study found that commencing acetylcholinesterase inhibitor (AChEI) therapy in the initial stages may provide the most benefit in terms of retaining function, which may enhance patient quality of life and save healthcare expenditures [5]. Neuronal cell death is caused by the buildup of amyloid plaques and also neurofibrillary tangles [6]. Plaques and tangles accumulate very slowly, so it is expected that early therapy intervention will be more helpful for Alzheimer’s. While no treatment can reverse the damage caused by the disease, early intervention may slow the disease. As some behaviors have been demonstrated to delay the advancement of the disease, early identification of the condition will also assist the patient in making the appropriate lifestyle modifications [7]. Early detection will also help monitor different therapies and disease progression. Several major studies have investigated the relationship between early intervention and treatment outcomes [8]. Studies include “Dominantly Inherited Alzheimer Network Trial (DIAN-TU)” with the “ClinicalTrials.gov number NCT01760005” [9], the “Alzheimer’s Prevention Initiative (NCT01998841)” [10], and the “Anti-Amyloid Treatment in Asymptomatic AD study (A4 Study)” with the ClinicalTrials.gov number NCT02008357 [11].
Alzheimer’s detection requires proper specialized clinics and specialists that can effectively diagnose the disease [12]. Neurofibrillary tangles and amyloid plaques seen in the brain after autopsy allow doctors to confidently confirm the presence of AD. [13]. Studies have shown that diagnostic methods like CSF, PET, and MRI can be used to gauge the accumulation of plaques and tangles and atrophy of the brain due to Alzheimer’s [14,15,16]. This development has led to assessing the extent of accumulation and plaques and tangles on a living patient without the need for an autopsy. Current biomarker-based assessment of AD includes amyloid PET and validated CSF biomarkers, while accurate plasma biomarkers are increasingly being incorporated into diagnostic frameworks [17]. The problem with these methods is that they are time-intensive and financially prohibitive [18]. Methods like CSF require a lumbar puncture which is extremely invasive in nature and for that reason, some patients do not agree with it. There is also a limited amount of equipment available that is used for diagnosis, and it is also used mostly for other purposes too [12]. The need for a screening technique that is affordable, non-invasive, and simple to use for detecting Alzheimer’s early on is crucial given the invasive and time-consuming nature of current diagnostic methods, as well as the limited availability of geriatricians and Neurospecialists.
This review paper provides an overview of the causes and advancement of Alzheimer’s disease and examines the various diagnostic techniques available and their effectiveness. It will also address the multimodal technique which is currently gaining some attention and its comparison to a unimodal approach which is highly effective in identifying the disease.
2. Pathophysiology of AD
Alois Alzheimer, a German psychiatrist, published the first description of the illness that bears his name, in 1906. He identified neurofibrillary tangles and amyloid plaques in the brain that resulted in progressive degeneration [19]. Extensive research has been conducted since its discovery to increase our knowledge and understanding of the causes, diagnosis, and treatment of AD. While numerous aspects remain unexplained, Alzheimer’s is increasingly recognized as a complicated disorder influenced by a variety of causes. The main causes of AD are often thought to be the accumulation of amyloid and tau proteins, oxidative stress, and inflammation.
The Amyloid Precursor Protein (APP) plays an important role in the pathogenesis of AD. Proteolytic processing of APP generates amyloid-beta (Aβ) peptides, which can aggregate and contribute to plaque formation,. Researchers identified beta-amyloid (Aβ) as the primary component of plaques associated with AD in 1984 [20]. In subsequent research conducted in 1991, investigations into genetics unveiled that mutations within the APP gene have the potential to generate abnormal forms of beta-amyloid; which, in particular family groupings, may be a factor in the early development of AD [21].
Based on such findings, numerous researchers believe that the aggregation of beta-amyloid (Aβ) initiates a chain reaction of detrimental events and functional disruptions in neurons, eventually leading to the onset of dementia [22]. Subsequent research provided further evidence supporting beta-amyloid’s substantial role in the progression of AD, yet the precise underlying mechanisms remain unknown. As a result, the most promising treatment options try to prevent amyloid plaque formation. Treatment possibilities for AD include therapies that target beta-amyloid and its receptors. These methods include the use of vaccinations, and antibodies aimed against beta-Amyloid Modulators or inhibitors of gamma-secretase and beta-secretase, amyloid degrading proteases, microRNAs, and amyloid dyes are further potential therapy options [23].
The pathology of AD is significantly influenced by the tau protein. It typically participates in the organization and strength of microtubules. However, in AD, it experiences abnormal deviations after translation and clumps together, forming neurofibrillary tangles (NFTs) [24]. The exact mechanisms by which tau protein contributes to AD are still being studied, but it is believed that the atypical aggregation of tau protein disrupts the regular functioning and signal transmission among neurons, leading to neuronal death and brain damage [20]. Researchers are proposing new therapies to prevent tau protein accumulation in AD, such as inhibiting aggregation, proteolysis, and tau phosphorylation, promoting tau clearance, and stabilizing microtubules [25].
An immune system’s normal response to an injury or infection is inflammation. However, persistent inflammation in the brain can be damaging and aid in the emergence of AD. Inflammatory molecules are released by activated ‘microglia,’ the immune cells residing in the brain; which can harm neurons and encourage more inflammation [26]. Furthermore, inflammation can make it more difficult for the brain to eliminate waste products and toxins, which promotes the aggregation of amyloid and tau proteins [27]. To mitigate neuronal damage, researchers are putting forward therapy options that address chronic inflammation [28].
Neurons require a lot of energy, and there is a lot of ATP requirement and consumption in the brain, which is met by mitochondria, a cell’s ‘power house’ [29]. Neuronal function is dependent on mitochondrial integrity and well-functioning bioenergetics. However, with Alzheimer’s disease, a variety of variables, including elevated oxidative stress, impaired Ca2+ homeostasis, and a disrupted mitochondrial genome, can impair mitochondrial function [30,31]. Such defects cause mitochondrial dysfunction in neurons, resulting in a detrimental downturn that eventually leads to neuronal dysfunction, which is a characteristic of AD [29]. Moreover, abnormal amyloid-beta levels can also induce abnormalities in mitochondria [32]. According to studies, the size and number of mitochondria in AD’s patients are altered; additionally, there is uneven mitochondrial distribution in pyramidal neurons and poor mitochondrial protein import [33,34]. This evidence suggests the pivotal role of M in AD, and therapeutical approaches that target mitochondria are under consideration [35,36].
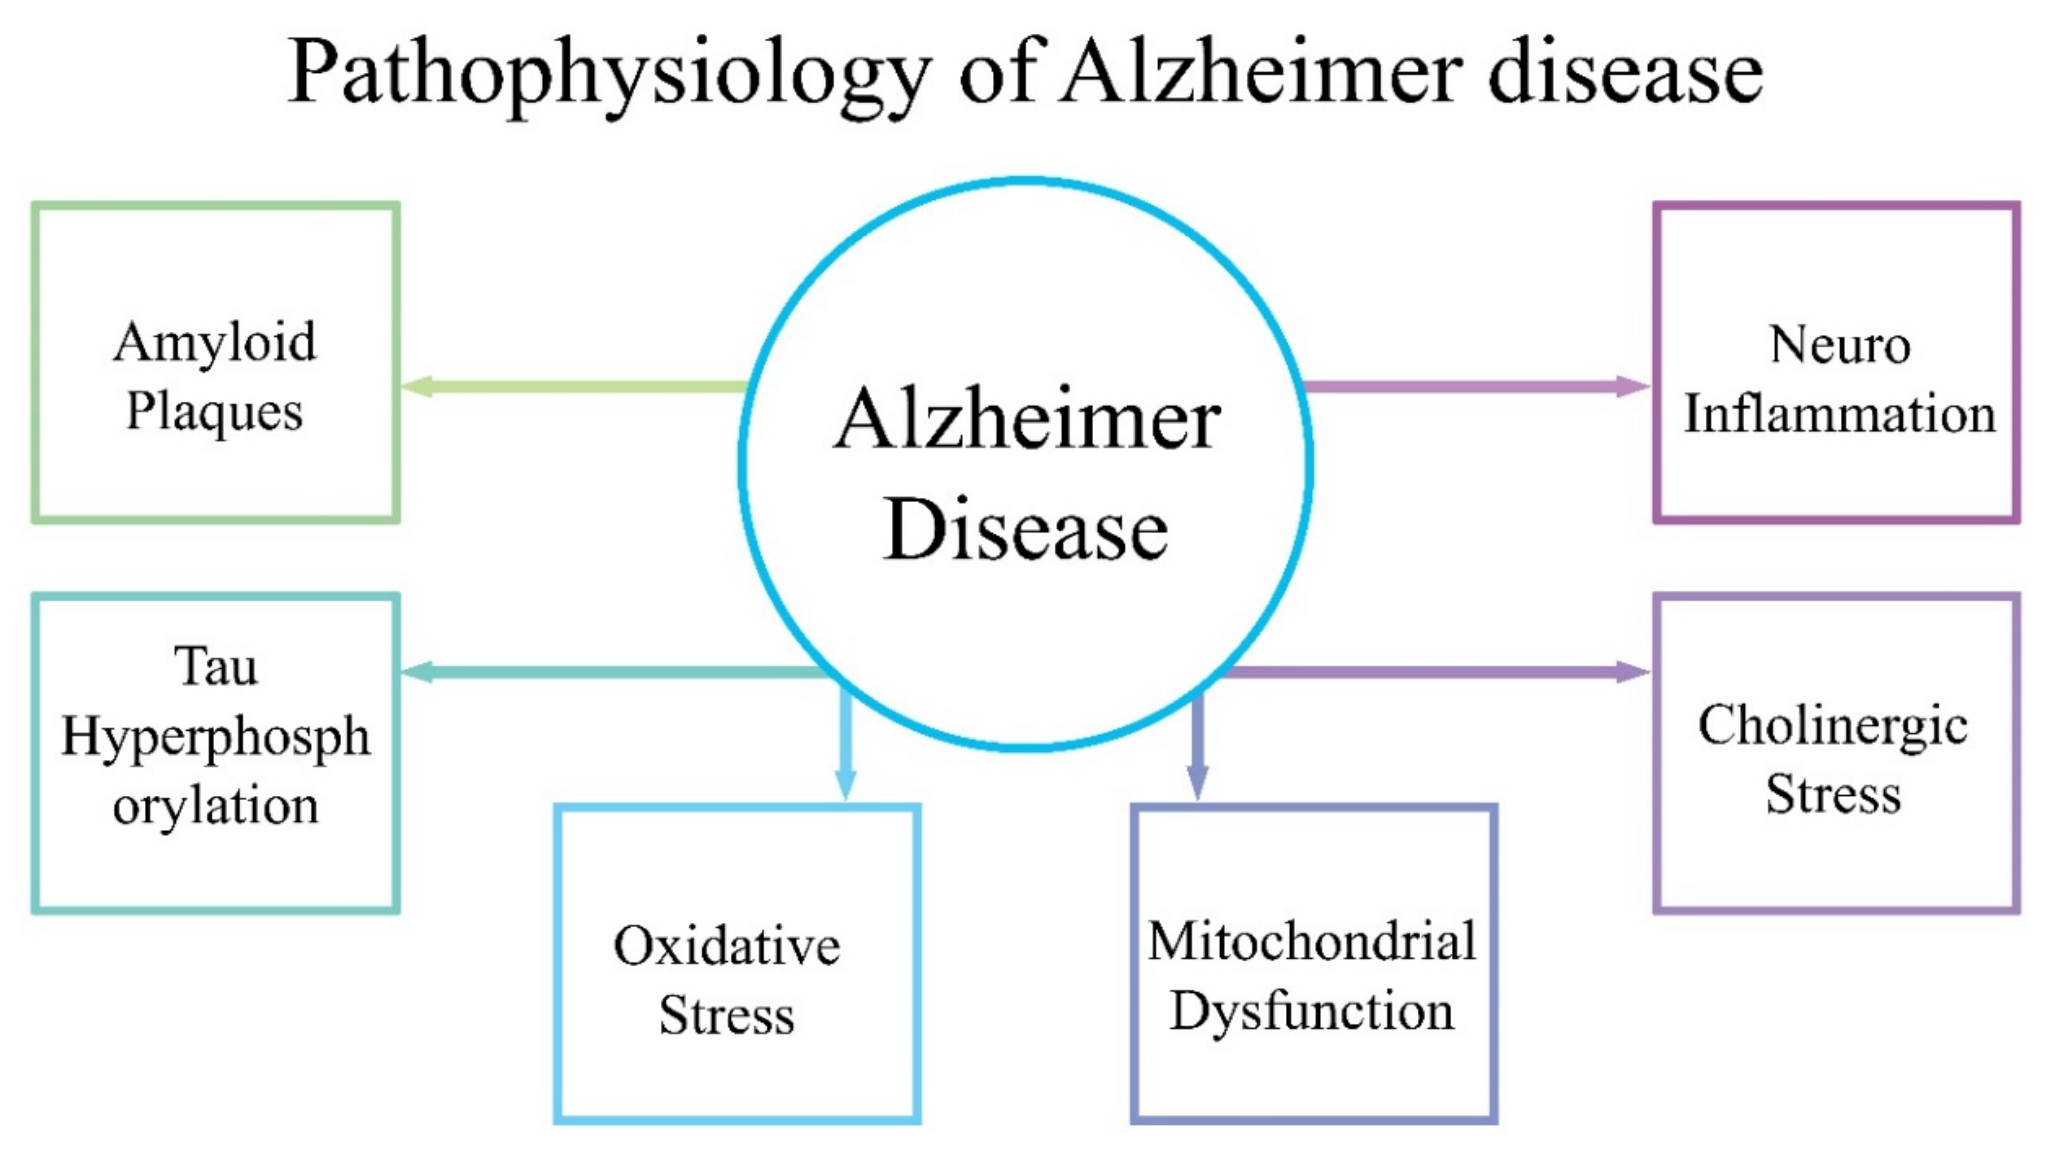
Two of the many factors that are linked to the onset of AD include oxidative stress and cholinergic stress. Oxidative stress is the result of an imbalance between the body’s antioxidant defenses and the production of reactive oxygen species (ROS). Cellular components like DNA, lipids, and proteins may be harmed by oxidation as a result of this imbalance. [37]. Cholinergic stress can occur as a result of impaired cholinergic transmission and cholinergic system dysfunction. The cholinergic system is a network of neurons that communicate with one another using the neurotransmitter acetylcholine (ACh). ACh which plays an essential role in memory and learning, is believed to be impaired in AD. Cholinergic system malfunction and decreased cholinergic transmission can both lead to cholinergic stress. ACh which plays an essential role in memory and learning, is believed to be impaired in AD. [38]. Recent studies suggest a connection between cholinergic stress and oxidative stress, which may contribute to AD progression via several processes. Cholinergic stress can facilitate oxidative stress by weakening the antioxidant defense mechanism and boosting the production of ROS. On the other hand, oxidative stress can also damage the cholinergic system by causing the deterioration of cholinergic neurons and decreasing the activity of the enzymes needed to produce acetylcholine. [39]. Pathophysiology of Alzheimer disease is summed up in the figure below.
Figure 1.
Figure describes various factors that can contribute to the onset and progression of Alzheimer’s Disease.
Figure 1.
Figure describes various factors that can contribute to the onset and progression of Alzheimer’s Disease.
3. Propagation of Alzheimer’s Disease
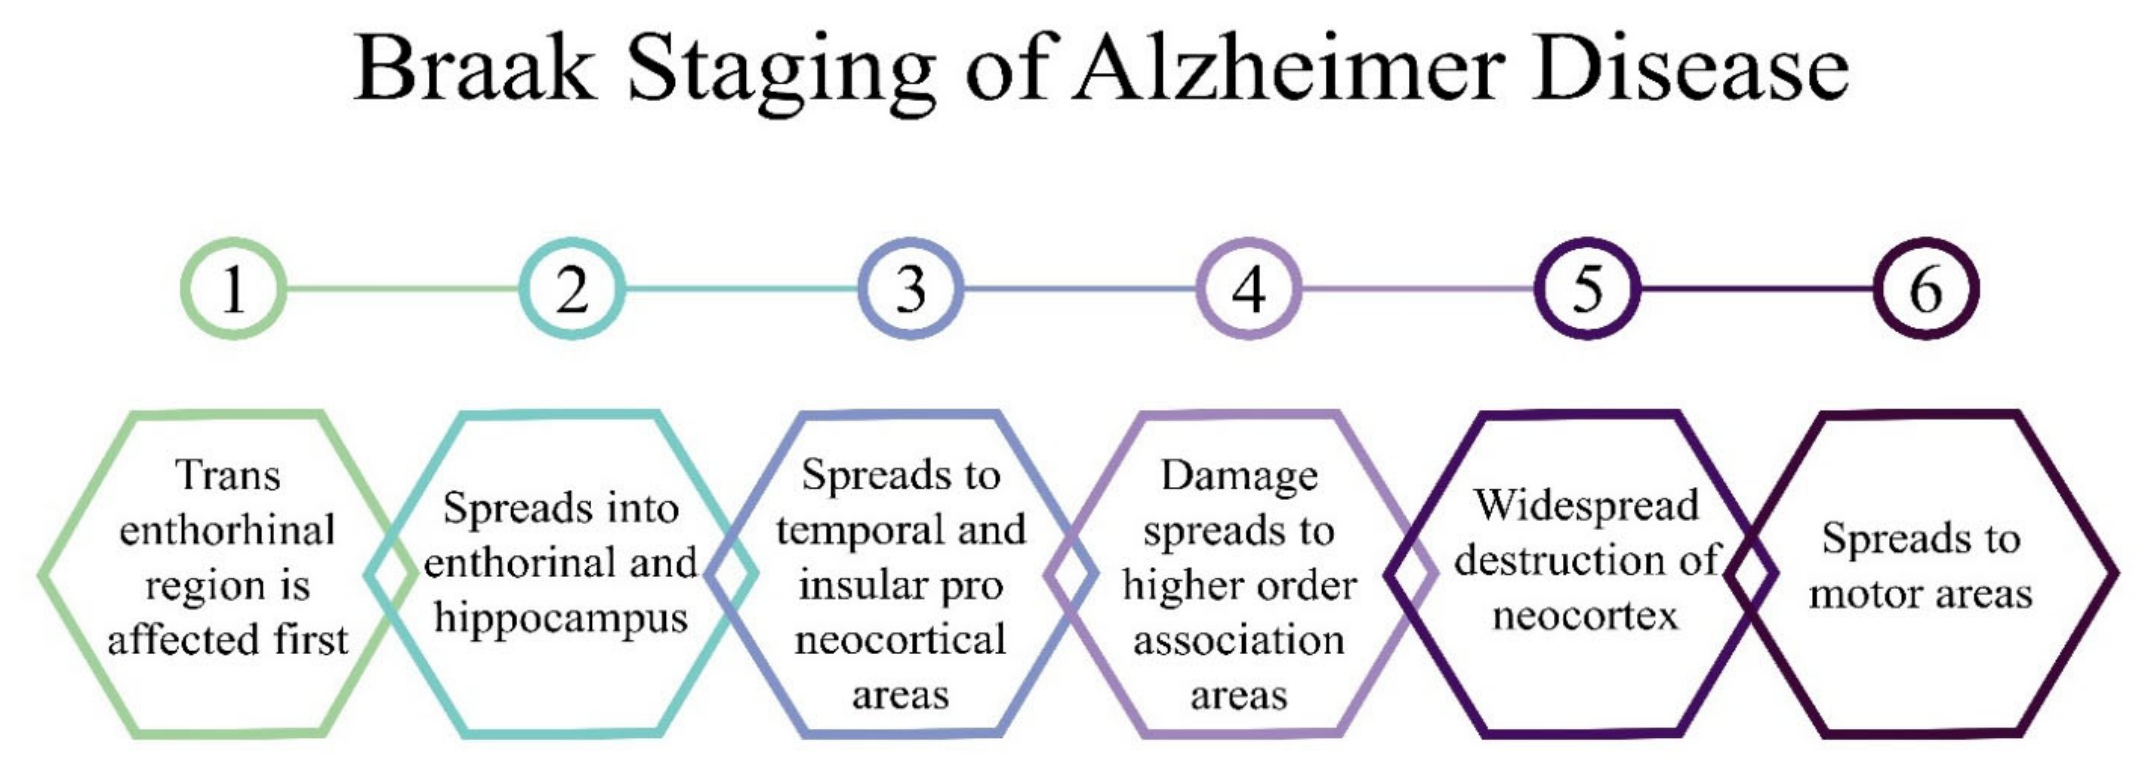
Certain classes of neurons are more prone to the abnormalities present in AD. The infiltration is remarkably similar and shows minor variation from patient to patient. The spread follows a predictable pattern and starts in glutamatergic cells in the trans-entorhinal region and then slowly spreads into the entorhinal cortex before it spreads into the hippocampus [40]. The neuron cells that were myelinated late during the development phase are the first ones disease gets into and the ones that were myelinated first are the most resistant to AD [41]. The spread follows an inverse pattern of cortical myelination. Based on the severity of encroachment, Alzheimer’s can be classified into six distinct stages which are also called the Braak staging system [40]. The trans entorhinal region is the first area affected by the disease. This region develops late and is responsible for navigation and perception of time [42]. During the first stage, the tau abnormality is only seen in the trans-entorhinal cortex which slowly spreads into the entorhinal and hippocampus in the second stage [43]. The staging system shows a strong association with cognitive impairment as well. Patients in stage 1 and 2 shows no manifestation of cognitive symptoms and are classified as CDR (Clinical Dementia Rating) 0 [43]. Clinically this phase represents the pre-clinical phase of the disease.
The trans entorhinal region and the entorhinal regions are severely affected in this stage with Modest changes in the hippocampal formation, in temporal and insular Pro neocortical areas, and in a few subcortical nuclei [44]. The mature neocortex is free of neurofibrillary tangles at this stage. Stage 4 starts with the damage spread from the entorhinal region to higher-order association areas. The first symptoms of the disease appear at this stage [45] as the destruction is severe enough to hinder the flow of information between the higher-order limbic system and the prefrontal cortex [46]. Asymmetrical affliction is also seen in certain patients occasionally [47]. The asymmetry of the disease in the hemisphere may be present, but it goes through its typical stages. One hemisphere may be lagging a stage but asymmetry with a hemisphere lagging 2 or more stages has not been observed so far [47]. Due to initial clinical symptoms, stages 3 and 4 are considered the morphological counterparts of incipient Alzheimer’s. At stage 5, the symptoms are severe enough to hinder the patient’s quality of life and that is why diagnosis is made usually at this stage. Stage 5 is associated with widespread destruction of the neocortex, especially brain-association areas and the infestation spread superolateral towards the motor areas in stage 6 [47]. The atrophy of the brain is macroscopically detectable in this stage. The figure below shows different stages of alzheimer disease and also the areas it affects in each stage.
Figure 2.
Figure shows different stages of the progression of Alzheimer’s disease.
4. Diagnostic Methods
4.1. PET Scan as an Alzheimer’s Diagnostic Tool
PET scan is a widely used method and is used extensively to detect many diseases. Brain scans using PET can be used to detect Alzheimer’s. The method is widely used in the diagnosis of AD due to its sensitivity to detect the disease [48]. Alzheimer’s neuropathology precedes cognitive symptoms, and PET can identify the illness before symptoms appear. [49] but the problem with this method is its exuberantly high cost [12]. There are a few tracer elements available with the help of which clinicians can diagnose certain neurological conditions like AD [16]. The tracer element most used for Alzheimer’s detection is 2-fluoro-2-deoxy-d-glucose (F-FDG) [48]. This tracer element can help track the metabolism of glucose in the brain. Specific brain regions experience a decrease in the rate of brain glucose metabolism as AD progresses. The performance on cognitive tests is correlated with this decrease in brain glucose metabolism [50]. The decline was observed years before any clinical signs associated with Alzheimer’s disease [51]. The patient’s frontal, parietotemporal, and posterior cingulate cortices show the most dramatic decrease. [52]. PET scans, particularly those employing 18F-FDG, offer a high sensitivity of up to 90% in detecting Alzheimer’s early on its advancement [53]. However, the specificity of the imaging technique for differentiating AD from other dementias is very low. According to longitudinal studies, FDG-PET may both pinpoint MCI patients who will later acquire AD and predict when healthy persons would develop MCI [52]. The hypothetical model which explains level of abnormality in biomarkers in different clinical stages of Alzheimer disease is given in the graph below.
Certain neurotransmitter systems are also impaired in AD and with the help of specialized tracers, we can detect the abnormality of the neurotransmitter systems in AD patients. The affected neurotransmitter systems include cholinergic, serotonergic, and dopaminergic systems. Postmortem study reports show a reduction in the level of acetylcholine(ACH) [55]. Moreover, studies suggest a decrease in the activity of enzymes important for ACH production and metabolism while a reduction in butyrylcholinesterase activity which is localized in glial cells and amyloid plaques indicating an increase in the prevalence of amyloid plaques [56]. The reduction in ACH activity is also seen in AD patients using certain radio ligands compared with same-age controls [57]. MCI patients had an 8-15% drop in cortical ACH activity [58]. Reduced ACH activity in MCI patients helped predict when MCI will turn into AD. [59]. Changes in dopaminergic as well as serotonergic systems have also been observed in AD patients during autopsy [60]. Single photon emission CT(SPECT) using a tracer I-FP-CIT, showed a reduction in dopamine reuptake transporters in Lewy bodies dementia patients while no reduction in the case of AD [61]. A multicenter clinical trial has demonstrated the effectiveness of I-FP-CIT SPECT in distinguishing between AD and dementia with Lewy bodies [62]. Reduced levels of a 5-HT receptor were found in the hippocampus of AD patients after a PET scan, pointing to problems in their serotonergic systems [63].
Figure 1.
Progression in the level of different biomarkers with disease progression. Figure adapted from [54].
Figure 1.
Progression in the level of different biomarkers with disease progression. Figure adapted from [54].
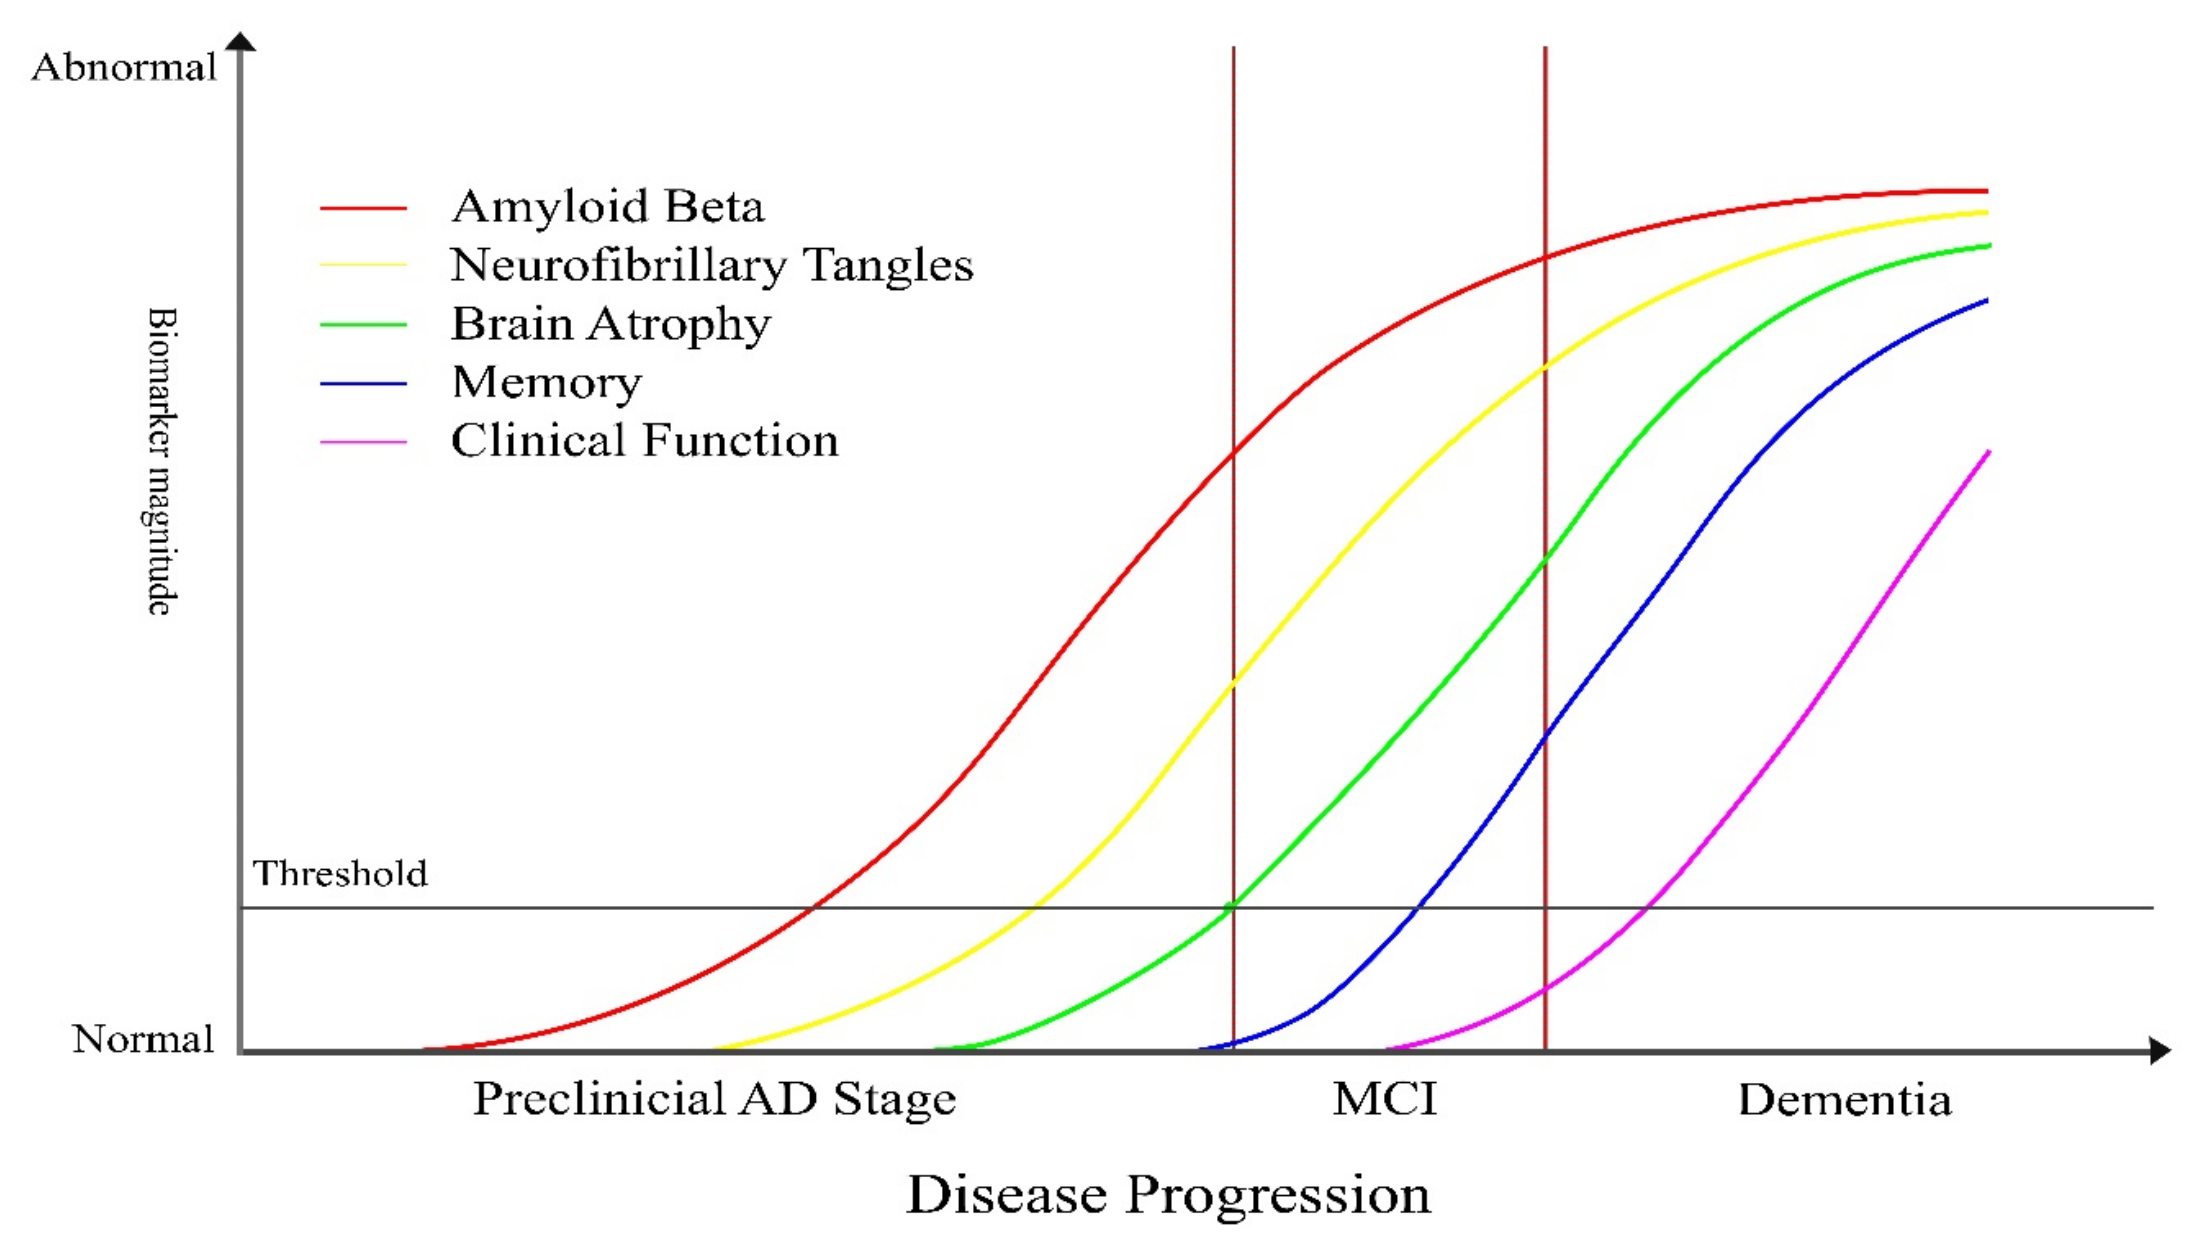
Figure 2.
Shows Brain scans of Control, amnestic, Non-amnestic MCI, and AD patients using FDG and PIB. PIB shows better separation between different groups than FDG. Schematic created based on findings reported in [64].
Figure 2.
Shows Brain scans of Control, amnestic, Non-amnestic MCI, and AD patients using FDG and PIB. PIB shows better separation between different groups than FDG. Schematic created based on findings reported in [64].
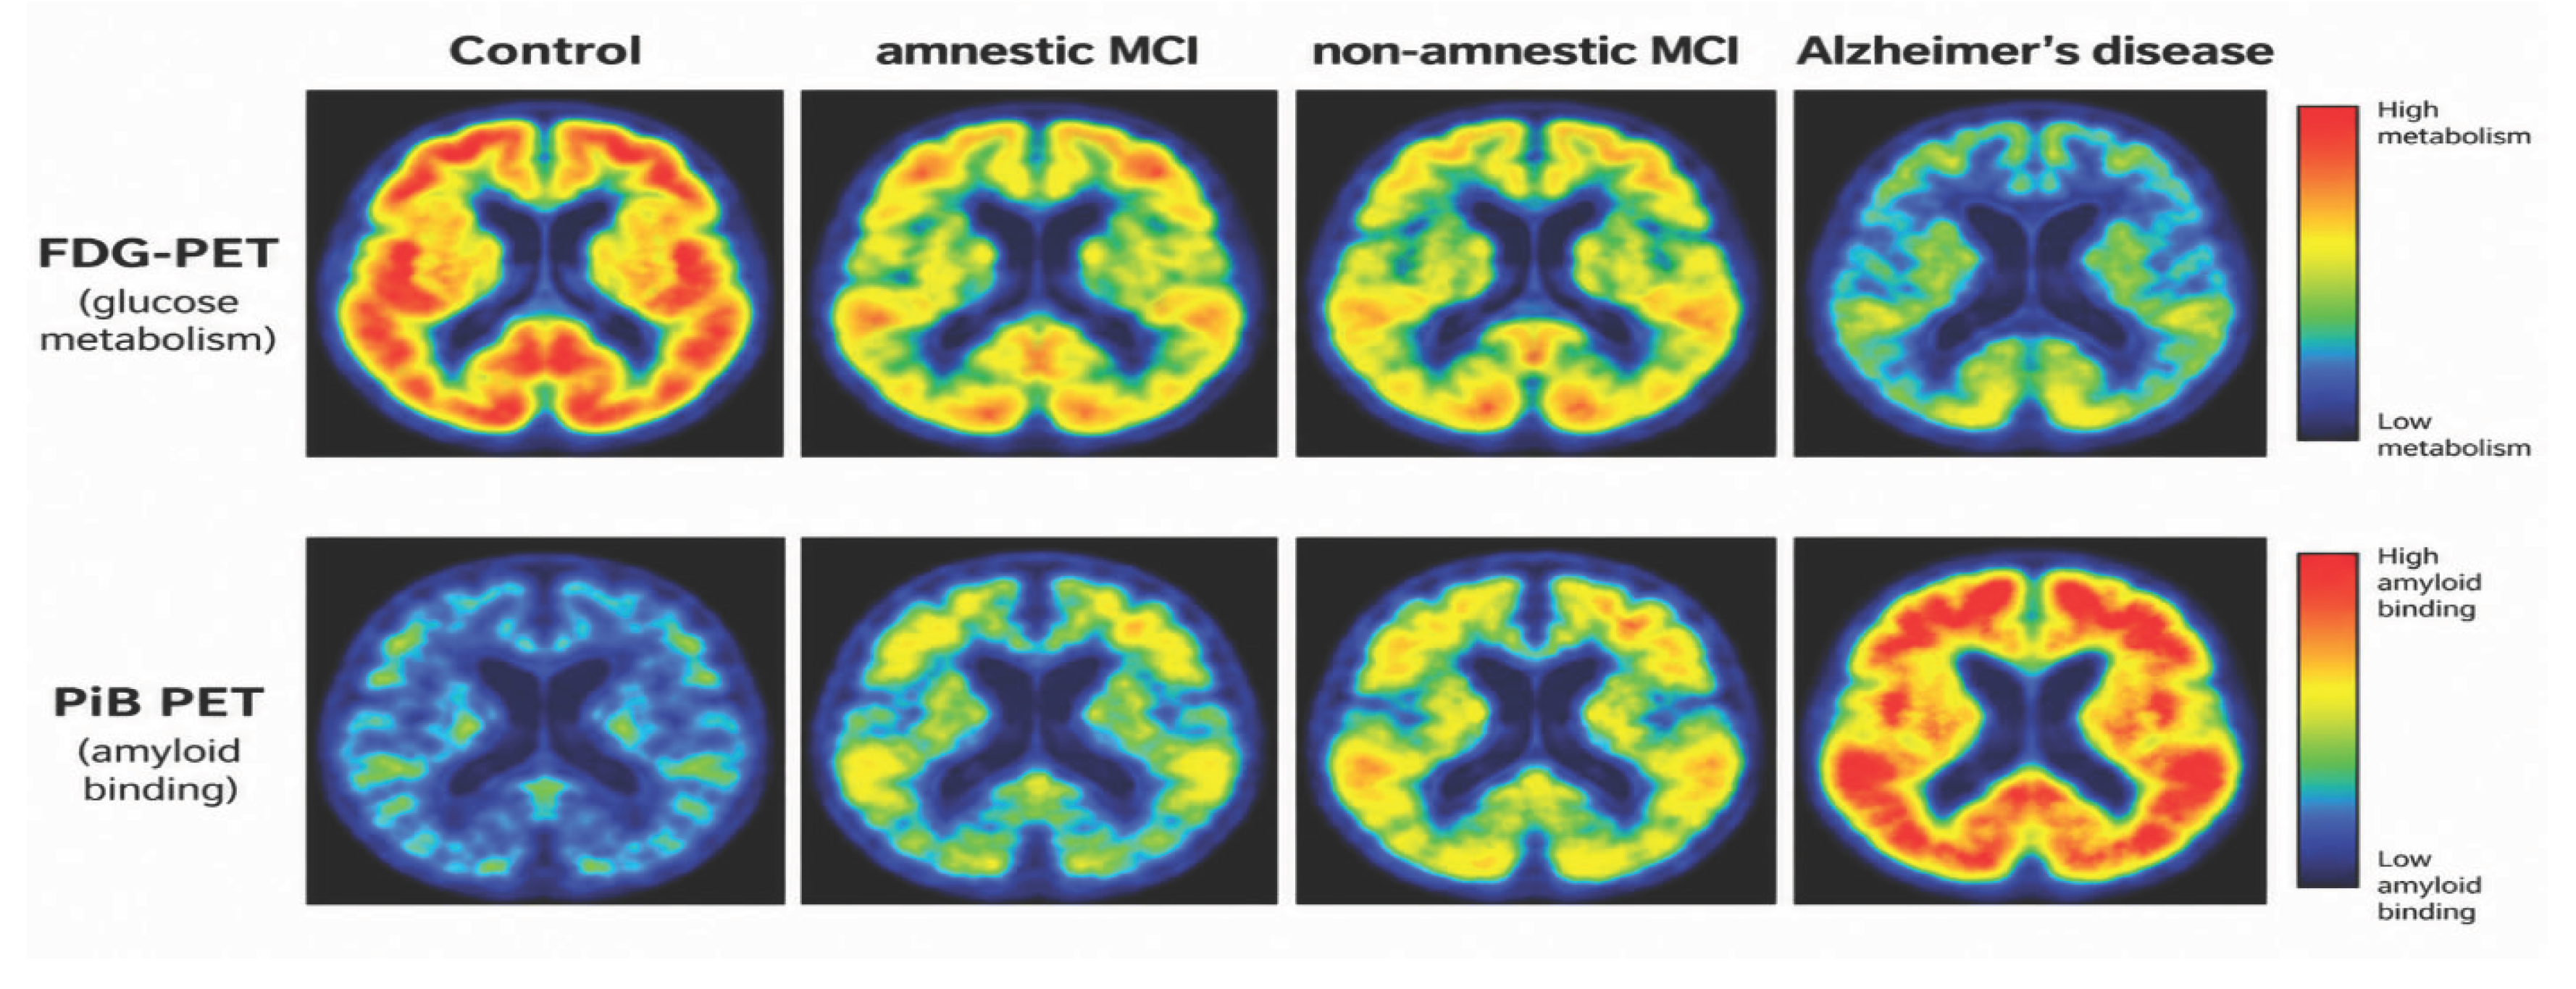
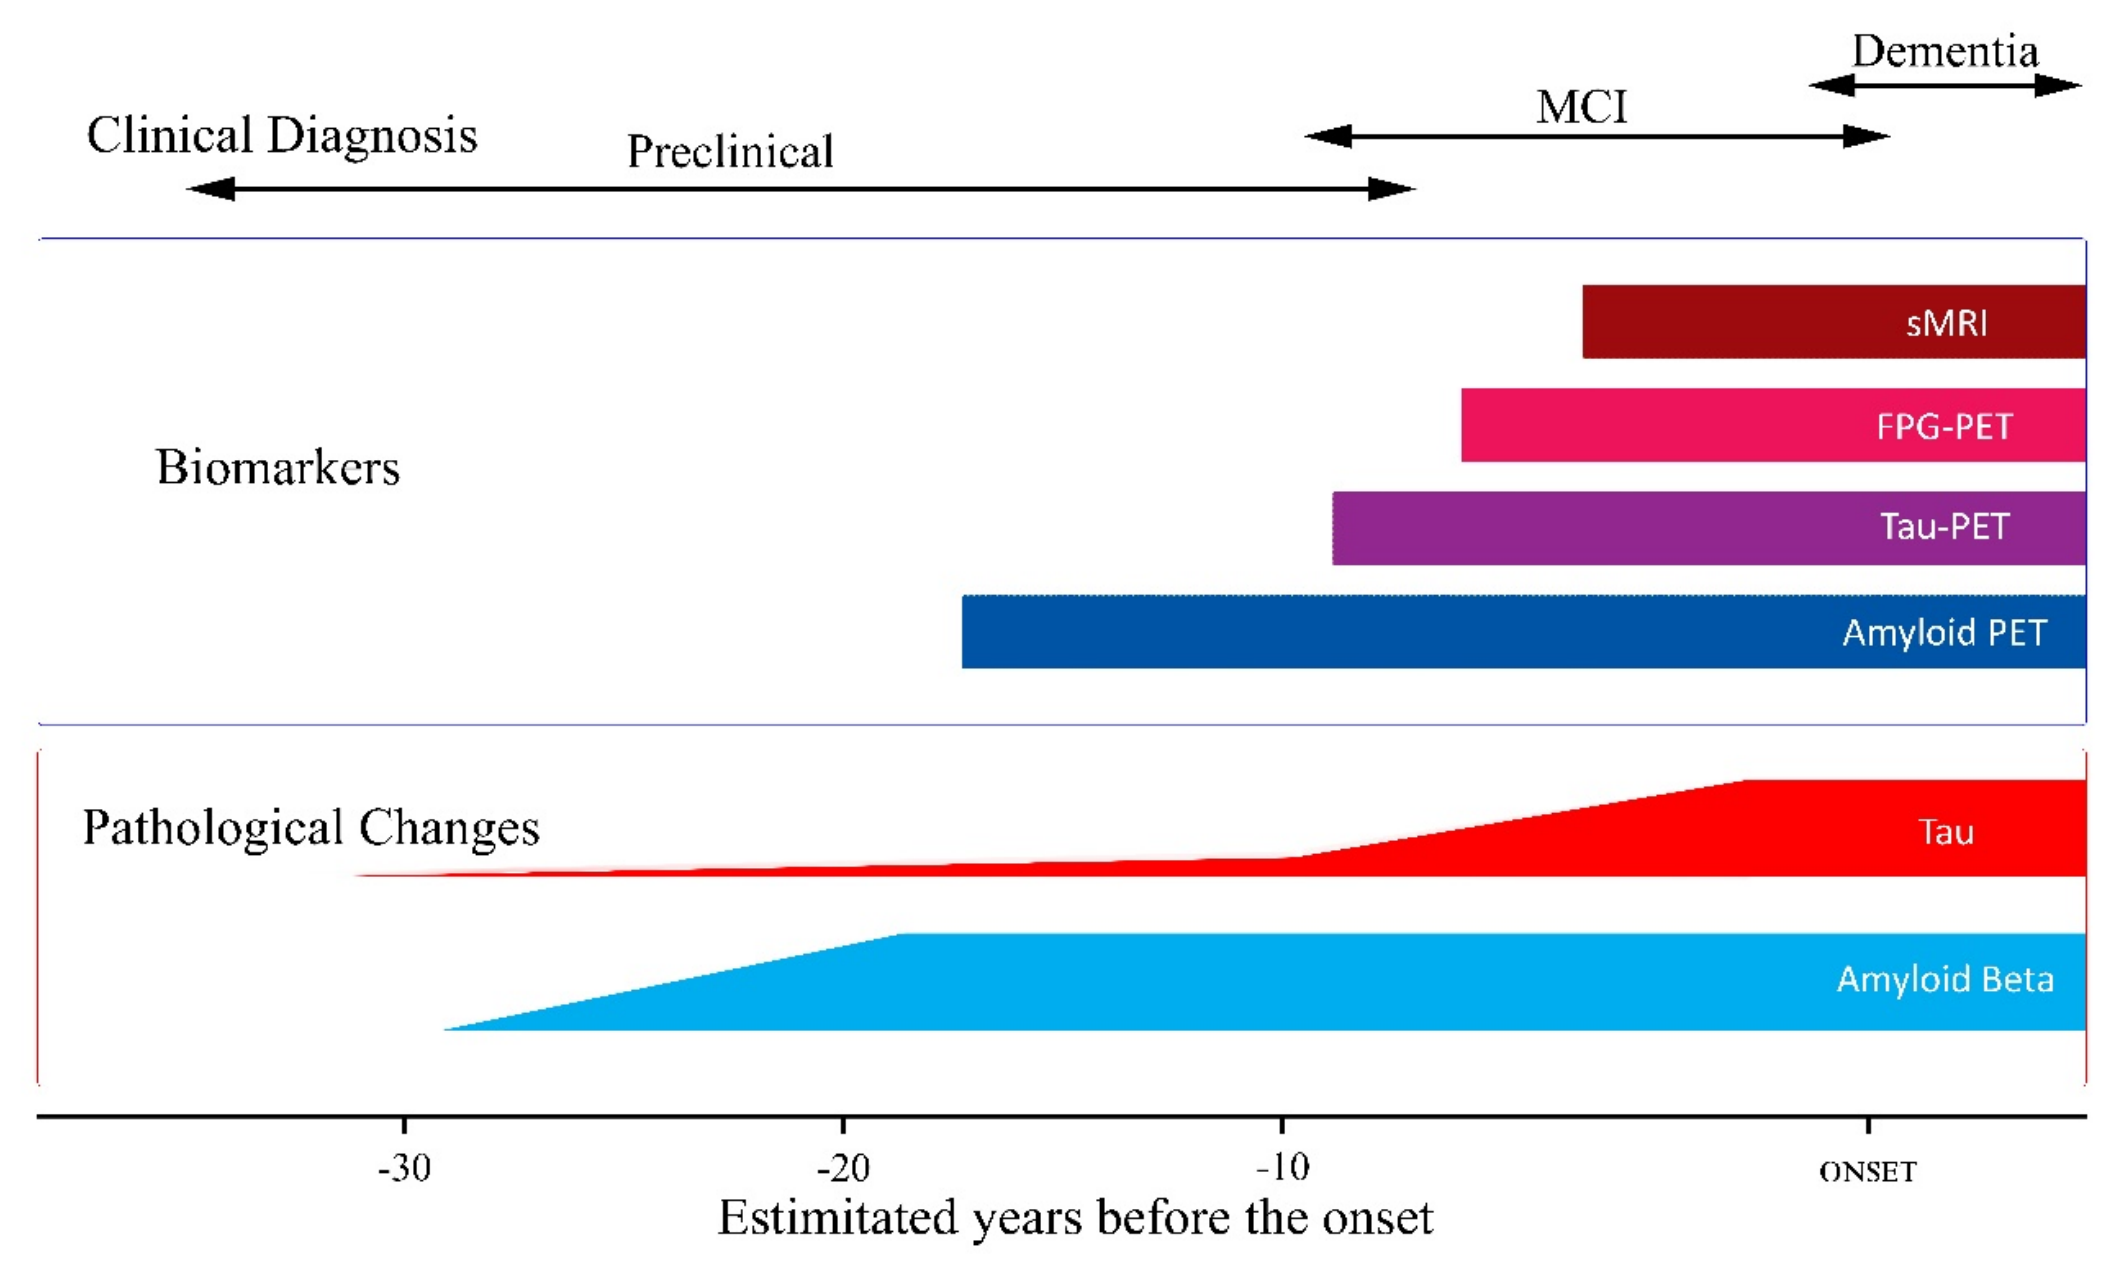
Some imaging techniques have also been developed that with the help of a tracer element, enable in vivo imaging of amyloid plaque [65]. These imaging methods have been demonstrated to more accurately distinguish between mild cognitive impairment in amnestic and non-amnestic individuals than the FFDG marker [64]. Figure 4 illustrates the differences between FDG-PET and PiB PET reported in previous studies [65]. Pittsburgh compound B(PIB) was among the first and the most studied radio ligands for amyloid imaging [66]. The first research to make use of this tracer found that 16 Alzheimer patients retained more C-PIB in cortical and subcortical areas than healthy controls [65]. In MCI [67] and AD [68] patients, a correlation between C-PIB retention and episodic memory quality has also been noted. However, autopsy investigations are necessary to validate the in vivo link between C-PIB retention and amyloid burden. Alterations in C-PIB retention and CSF amyloid beta can occur in the initial Alzheimer’s disease stages, Before changes in functional characteristics including cognition and cerebral glucose metabolism [69]. Despite the sensitivity of the C-PIB to detect AD in the initial stage, F-FDG is a better tracer to track disease progression. Activated microglia is also a histopathological feature in AD and it can be seen by using a PET tracer 1C-(R)-PK11195 which is a peripheral benzodiazepine receptor ligand. AD patients exhibited greater binding in the parietal, temporal, and hippocampus compared to healthy controls [70]. Using the same PET ligand, researchers discovered low microglial activation levels in mild Alzheimer’s disease and MCI patients [71]. To sum it all up, amyloid imaging using PET is more capable of detecting the disease in its initial stages while F-FDG is better suited to track disease progression while all the other tracers will help us understand the underlying pathophysiology of the disease. Figure below shows the Alzheimer progression in terms of pathological changes happening in the brain and also the level of biomarker years before the onset of the disease.
Figure 3.
The AD progression, including pathological changes, biomarkers, and clinical diagnosis. Figure adapted from [72].
Figure 3.
The AD progression, including pathological changes, biomarkers, and clinical diagnosis. Figure adapted from [72].
4.2. Cerebrospinal Fluid Analysis Utilization in AD
Cerebrospinal fluid analysis (CSF) is widely used to diagnose neurodegenerative diseases including various types of dementia [73]. Due to the CSF’s proximity to the brain, alterations in the brain’s biochemistry can be noticed in the CSF as well. Certain biomarkers in the fluid can be utilized to identify AD [74]. Two different types of biomarkers exist which can be used to diagnose the disease. The basic biomarkers give us valuable information about the overall brain health and can be used to identify certain disorders which can help narrow down the diagnostic process [74]. To rule out vascular dementia and conditions related to the cerebrovascular system, the ratio of CSF to serum albumin provides information on the blood-brain barrier. [75] The CSF to serum albumin ratio in AD patients is normal, except for vascular dementia cases. [76]. The inflammation status can also be used to exclude certain chronic inflammatory and infectious conditions [77].
The ideal biomarkers for a disease should reflect its underlying pathology [78]. For AD, some biomarkers have already been identified that have a direct connection to the disease and these neuropathological findings have been confirmed during an autopsy study [79]. One of the most noticeable variations is the decrease in amyloid beta in cerebrospinal fluid, which is caused by the deposition of amyloid beta into plaques, which are not soluble and hence remain in the brain. With the help of C-PIB PET amyloid imaging, visualization of the fibrillary amyloid-beta load is possible in vivo. This reduction is also supported by certain studies which correlated high C PIB retention in amyloid PET ligands with low amyloid beta levels in CSF [80]. Using several enzyme-linked immunosorbent tests (ELISA), the study found that the amyloid beta decrease in CSF was 50% lower than in age-matched healthy old adults [81]. Different pathological changes can be seen in the CSF of the Alzheimer patient brain which is showcased using the figure below.
Figure 6.
Major CSF biomarker changes associated with AD, created by the authors based on [82] and related literature..
Figure 6.
Major CSF biomarker changes associated with AD, created by the authors based on [82] and related literature..
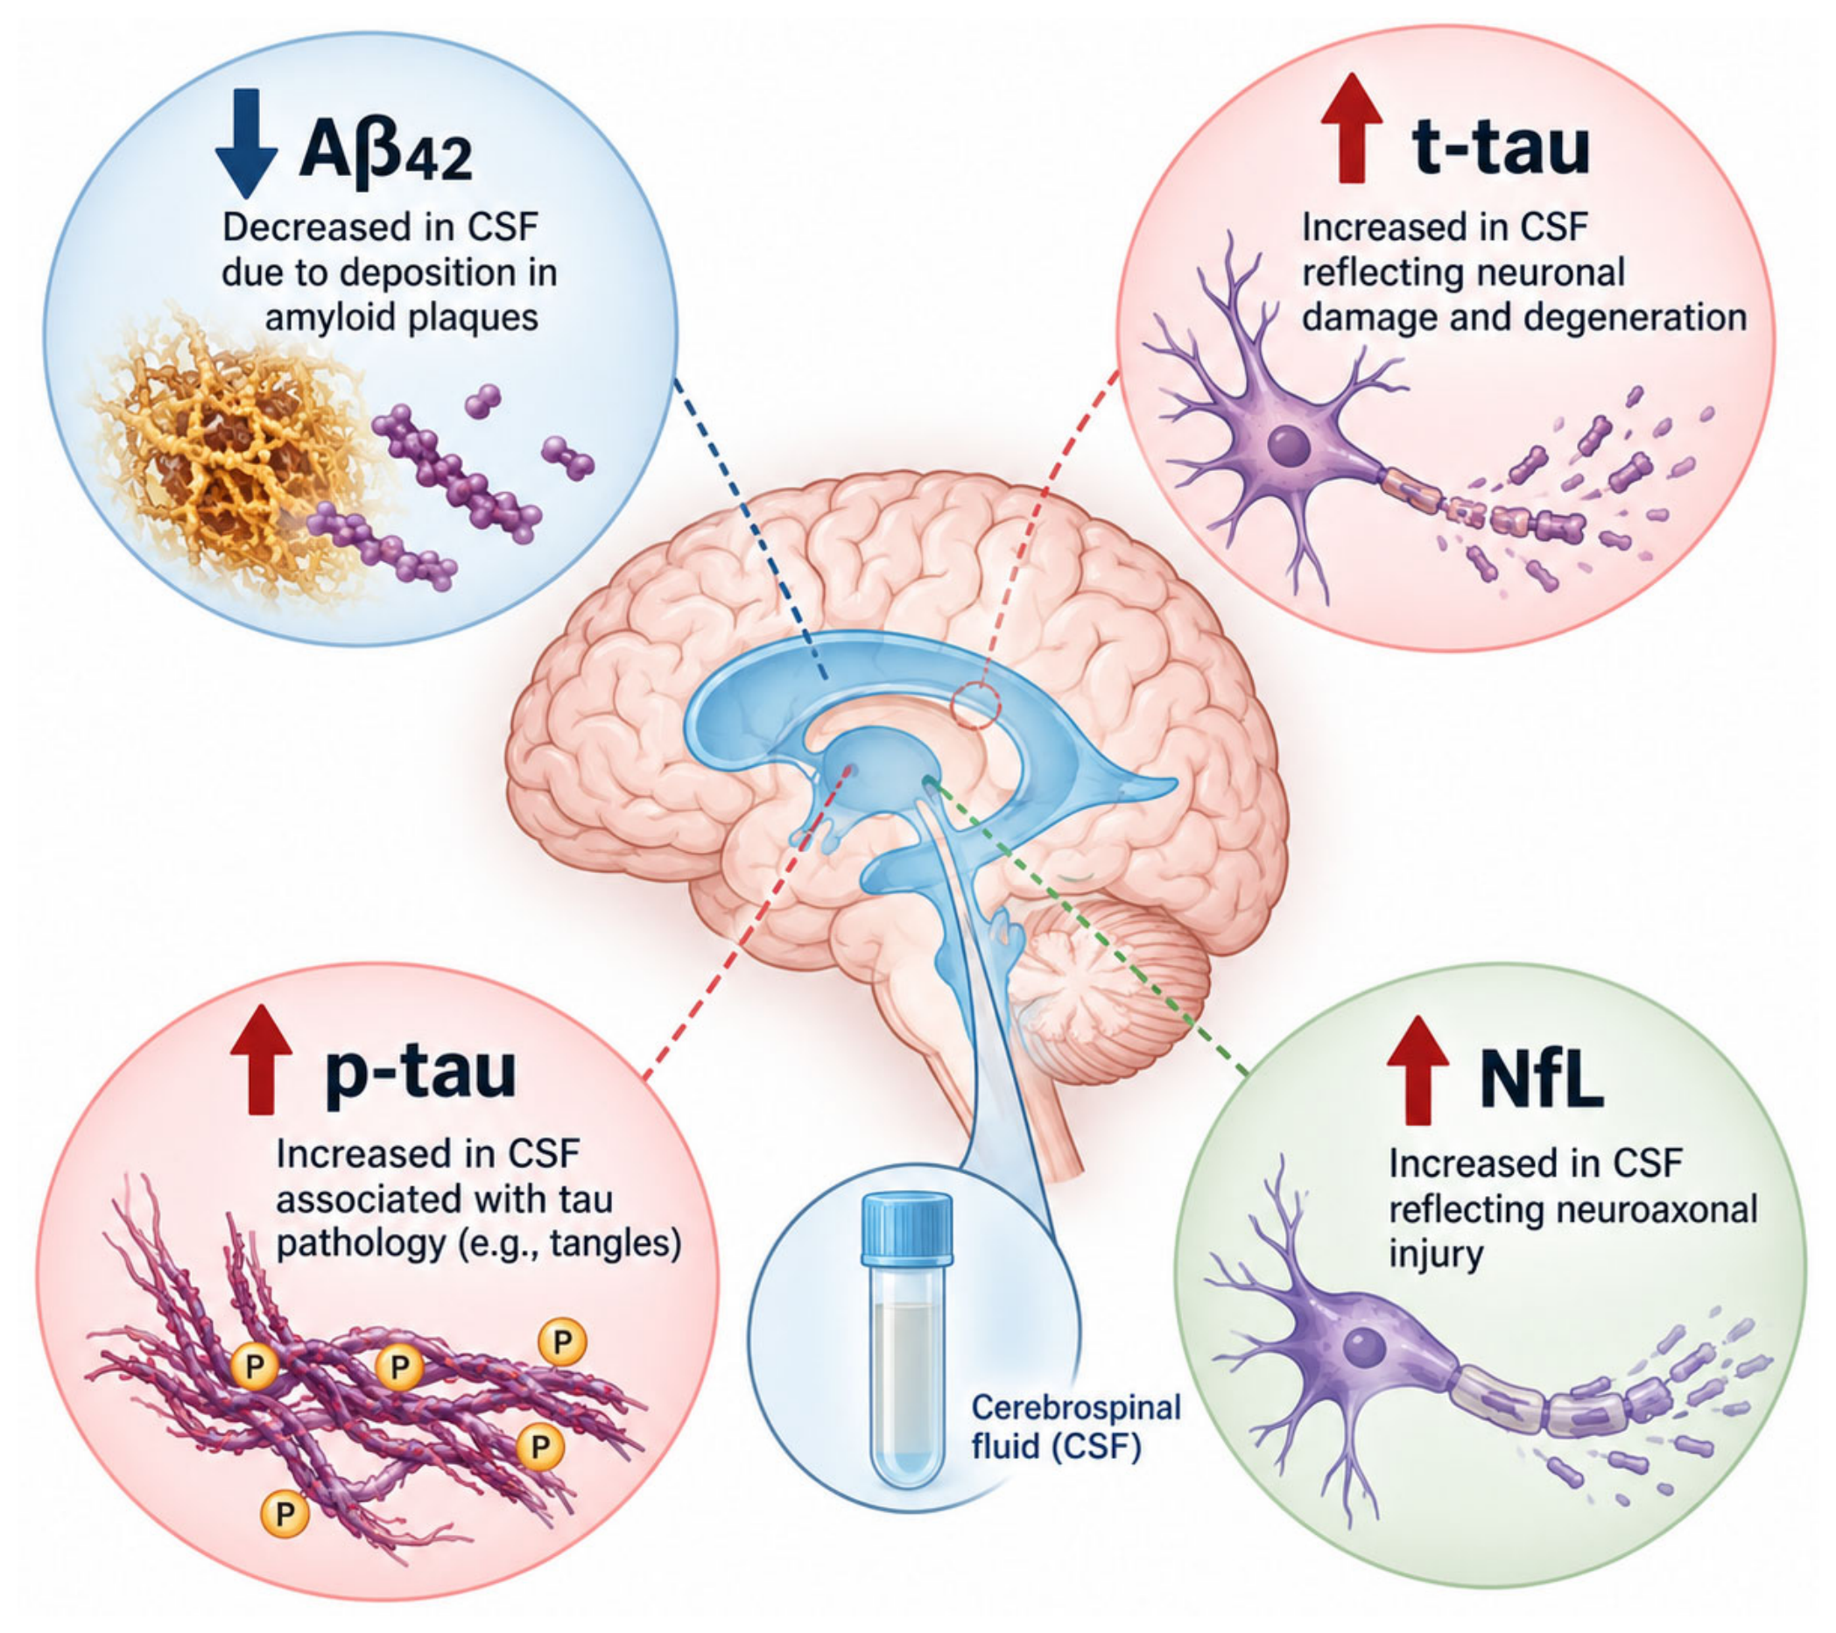
Total tau (t-tau) and phosphorylated tau (p-tau) levels in CSF can also be used to diagnose AD. High levels of t-tau and p-tau in the CSF are associated with severe axonal damage in the brain [83]. Additionally, it has been shown that increased CSF t-tau levels also signal a quick transition from mild cognitive impairment to fully developed AD [84]. Using ELISA, studies have shown a 300% rise in the CSF total tau levels compared to age-matched healthy individuals [81]. High neuronal degeneration, which is likewise positively linked with high t-tau levels in the CSF, is also found in Creutzfeldt-Jakob disease [85]. The ratio of p-tau to t-tau is a differentiating factor that is seen to be normal in Creutzfeldt–Jakob disease but high in AD [86]. Certain research implies that p-tau can be used to distinguish AD from dementia [87] and other neurological conditions linked with high neuronal degeneration.
All these biomarkers have been found to diagnose Alzheimer’s with good specificity and sensitivity ranging from 80-90% [88] but there is a substantial improvement in the diagnostic accuracy when two or more of these biomarkers are considered together [89]. For instance, one study discovered that combining amyloid beta 42 and t tau increased the sensitivity of AD diagnosis from 78-84% using either biomarker alone to 86% and the specificity when using a single biomarker from 84-90% to 97%. [90]. The CSF analysis can also be used to detect the disease in the prodromal stage but lacks accuracy considering p-tau and t-tau in detecting the disease at the preclinical phase of Alzheimer’s [89]. Although Amyloid beta was able to predict cognitive deterioration in a healthy elderly group [91], the drawback to CSF analysis for AD is its highly invasive nature which requires a spinal tap in the lumbar region. For the time being, it cannot be utilized as a screening procedure for AD, but novel biomarkers are being discovered which may change the perception about the procedure in the future. The CSF analysis though can be extremely helpful in drug development and evaluating drug performance.
4.3. Blood Tests as an Inexpensive and Convenient Option for Alzheimer’s Diagnosis
AD is a neurodegenerative disease (ND) that is clinically and pathophysiologically varied and complex. Making an accurate diagnosis of AD based solely on clinical evidence even for dementia specialists might get difficult. Biomarkers are currently incorporated into current research for AD as they provide an objective assessment of pertinent pathophysiology in vivo [92]. “Blood-based biomarkers” are the substances that can be detected in the blood and they are potentially helpful for diagnosis and initial screening of Alzheimer’s. These biomarkers can include proteins, enzymes, or other substances that are released by the brain or other tissues affected by the disease. Blood-based biomarkers have several advantages over cerebrospinal fluid (CSF) collection or neurological imaging i.e., they are cost- and time-effective and concurrently practical at the population level. Blood tests don’t require lumbar punctures like CSF tests do, making them less invasive. Researchers have identified several blood-based biomarkers that can detect the presence of disease or the risk of developing it [93]. Here are some of the blood-based biomarkers that have been examined for Alzheimer’s. A research study found a panel of six biomarkers —1 macroglobulin, 2 macroglobulin, alpha-1-antitrypsin, plasma apolipoprotein E, complement C3, and pancreatic polypeptide. Elevated levels of these proteins were the most effective in discriminating between AD patients and healthy subjects [94].
According to research findings, elevated plasma NFL concentrations serve as promising biomarkers for neuronal damage in AD. However, elevated plasma NFL concentrations are also observed in several other neuro-degenerative conditions, including Frontotemporal dementia, Progressive supranuclear palsy (PSP), and Human Immunodeficiency Virus with brain involvement, indicating that it lacks clinical specificity for AD. So, Plasma NFL may be a useful noninvasive method to evaluate neurodegeneration and to identify people who are susceptible to experiencing cognitive decline in the future and brain atrophy. Therefore, it may serve as a generic biomarker for neurodegeneration including AD [95]. DYRK1A (dual specificity tyrosine-phosphorylation-regulated kinase 1A) expression was noticeably decreased in the plasma of Alzheimer’s patients even at the initial stages of the disease. Human plasma can be used to detect plasma levels of DYRK1A and differences in DYRK1A expression levels between Alzheimer’s patients and healthy individuals may serve as biomarkers for initial screening of AD [96]. GSK-3β is a protein that is associated with the phosphorylation of tau protein. Plasma GSK-3 levels are significantly higher in AD and MCI patients as compared to controls of the same age, making protein a valuable biomarker in diagnosis. [97]. BACE1 is an enzyme responsible for Aβ production which is a major constituent of amyloid plaques in AD. Elevated levels of BACE1 have been found in the brains of Alzheimer’s patients. So, an efficient approach based on BACE inhibition thus reducing Aβ production would represent a promising therapeutic goal for AD [98]
Increased levels of tau protein have been diagnosed in the blood of Alzheimer’s patients and they may serve as biomarkers for AD detection. Plasma tau protein may serve as a nonspecific biomarker of neurodegeneration because its levels are also increased in other neurodegenerative diseases. Tau protein may serve as an initial screening biomarker for early detection of Alzheimer’s [99]. The Aβ protein, which is a hallmark of AD and neurodegeneration. A low plasma Aβ42/40 ratio is associated with cognitive decline and risk of AD progression among cognitively healthy individuals, people who are experiencing subjective cognitive decline, or those who have mild cognitive impairment (MCI). However, specificity is constrained by non-cerebral expression of Aβ, e.g., in blood platelets but still, it evaluates the clinical utility of plasma biomarkers in predicting brain Aβ burden at an individual level [100]. GFAP, also known as glial fibrillary acidic protein: Elevated plasma GFAP level may serve as an early blood biomarker to detect AD risk progression in individuals before the onset of clinical signs and symptoms [101].
Blood-based biomarkers for AD have advanced substantially in recent years, particularly plasma phosphorylated tau biomarkers such as p-tau217. In 2025, the FDA cleared the Lumipulse G pTau217/β-Amyloid 1-42 Plasma Ratio to aid in the diagnosis of AD in symptomatic adults aged 55 years and older; however, it is not intended as a stand-alone screening test [102]. The table summarizes all the biomarkers that is found in the blood and using these biomarkers, we can extract valuable information in regards to Alzheimer disease.

Table 1.
Association of different blood-based biomarkers with Alzheimer’s disease and its trend with the disease progression.
Table 1.
Association of different blood-based biomarkers with Alzheimer’s disease and its trend with the disease progression.
| Biomarker | Type | Pathogenic pathway | Disease trend |
|---|---|---|---|
| Neurofilament light chain (nfl) |
Protein | Neurodegeneration | Neurodegeneration in ad is associated with high levels of nfl in blood and csf. |
| Tau protein | Protein | Tauopathy | Elevated levels of blood tau protein are associated with ad. |
| Glial fibrillary acidic protein (gfap) | Protein | Neurodegeneration | Elevated levels of gfap in plasma are associated with ad. |
| Aβ–42/Aβ–40 | Ratio | Amyloidogenic | A low plasma aβ42/40 ratio is associated with cognitive decline and risk of ad progression. |
| Bace1 | Protein | Amyloidogenic processing / Aβ production | Ad patients’ brains have been found to have higher levels of bace1 activity. |
| Gsk-3β | Protein | Tauopathy | Plasma gsk-3 levels are considerably higher in ad patients. |
| Dyrk1a | Protein | Tauopathy amyloidogenic |
Decreased plasma dyrk1a levels are associated with ad. |
| Inflammatory markers: creactive protein(crp),interleukin-6 (il-6), and tumor necrosis factor-alpha (tnf-α). | Proteins | Inflammatory | Elevated levels of these biomarkers are associated with an increased risk of ad progression. |
4.4. Magnetic Resonance Imaging (MRI) as a Diagnostic Tool for AD
MRI is a noninvasive imaging technique extensively used for brain and spinal cord imaging. The images can provide vital information about the person’s cognitive health and detect many brain-related diseases. MRI is widely used in Alzheimer’s detection and can detect Alzheimer’s before the onset of dementia [103]. The most commonly used is structural MRI which can detect changes in brain volume and structure and for this reason, can detect many neurological conditions. Medial temporal region brain shrinkage is a common observation in AD patients. [104]. Medial temporal lobe atrophy is another early symptom of AD and can be utilized to diagnose the disease early [15]. The degree of brain atrophy in the medial temporal area, which includes the entorhinal cortex and the hippocampal tissue, can be assessed by structural MRI. Additionally, it has been shown that medial temporal lobe atrophy is a reliable predictor of both the progression of cognitive symptoms in healthy people and the development of MCI into Alzheimer’s [105]. Earlier techniques of sMRI were manual in the volumetric analysis of the brain regions atrophied due to Alzheimer’s and required a good knowledge of neuroanatomy and in also delineating parts of the brain. The more recent approaches use automatic methods for volumetry which are quick compared to manual-based volumetry and are easy compared to the previous manual methods [106]. Voxel-based morphometry is an automated method for volumetry that makes use of specialized analysis-oriented software. By utilizing the voxel-based morphometry method, these software are specialized in differentiating between healthy and sick based on brain volume and region of interest [107].
Diffusion tensor imaging (DTI), a technique for neuroimaging, uses the brain’s non-random water diffusivity to provide a non-invasive assessment of the white matter pathways. Anisotropic diffusion refers to diffusion that is largely unbroken in the parallel direction of the tract and occurs in fibrous tissue, particularly fibrous tracts in the brain [108]. DTI builds a detailed map of the brain’s white matter tracts utilizing the flow of water molecules, which can disclose a wealth of information about the tracts’ integrity. It can also identify early microstructural changes that are often missed by a structural MRI [109]. Studies have revealed a connection between changes in white matter microstructure and Alzheimer’s [110]. This decrease in FA (Fractional Anisotropy) has been observed in the fornix and cingulum, regions of the brain associated with memory and cognitive function. DTI has shown potential in the differential diagnosis of AD and vascular dementia [111], and it is anticipated to be crucial in studies in the future looking at how AD affects the structure of white matter. It can also be a good predictor in assessing the risk of conversion of MCI to Alzheimer’s [112].
Functional MRI (fMRI) is a neuroimaging technique that is used to assess brain function. The non-invasive method can track the progress of Alzheimer’s patients’ treatments and examine functional impairments in dementia patients [113]. It can also be used for early Alzheimer’s detection and recent advancement in deep learning algorithms have shown great promise [114]. During an fMRI scan, the oxygen levels in specific areas of the brain are measured as the person performs specific stimuli or cognitive tasks [115]. The method includes recording brain activity while doing a task and while at rest, then subtracting the resting state from the task activity to find regions of increased blood flow [116]. Lower coordination in the cingulate cortex, inferior parietal lobes, and hippocampus were seen in fMRI investigations of AD patients compared to healthy controls [113]. Advances in fMRI have made it possible to relate the neural underpinnings of cognitive and behavioral processes to neuroanatomical networks in the early stages of neurodegenerative illnesses [117].
4.5. Neuro-Psychometric Tests Comparison and Its Efficacy for AD
Neuro-psychometric tests are a simple and non-invasive way to detect cognitive impairment since they are typically brief, low-cost, and can be administered quickly, making them a useful tool in the therapeutic context.
Since 1975, Mini Mental State Exam (MMSE) developed by Folstein, has been a benchmark and extensively tested to asses cognitive impairment [118]. As advancements in research have shifted the emphasis to early identification of AD, numerous tests that are sensitive enough to detect AD in its early stages have been established. Nasreddine’s Montreal Cognitive Assessment (MoCA) is a concise cognitive screening test that is highly sensitive and specific in diagnosing MCI. In a study conducted on individuals with moderate AD, MMSE demonstrated 78% sensitivity, whereas MoCA achieved a perfect detection rate of 100%. [119]. Furthermore, research studies have shown that the Mini-Cog, which consists of a clock drawing activity and a three-item memory test, has a high level of accuracy in identifying people with probable dementia ranging from 76% to 99%, with specificity rates ranging from 89% to 96% [120].
The Alzheimer’s Disease Assessment Scale Cognitive subscale (ADAS-Cog), which was initially established to evaluate cognitive abilities in individuals with AD ranging from mild to moderate, has undergone modifications aimed at broadening its applicability in pre-dementia research. These modifications have led to various ADAS-Cog variants with increased sensitivity and improved accuracy in predicting cases of dementia [121]. The ‘Clinical Dementia Rating’ (CDR) scale, which is a diagnostic and staging test, is used to evaluate and categorize the extent of dementia in people with AD. Six distinct cognitive and functional domains are assessed by clinicians, and the sum of these domains’ scores, or CDR-SB (Sum of the Boxes) score, has proven to have a strong predictive ability for identifying dementia and tracking the progression of cognitive or functional decline [122].
AD also impacts episodic memory, hence to assess episodic memory the ‘Free and Cued Selective Reminding Test’ (FCSRT), the ‘California Verbal Learning Test II’ (CVLT-II), and the ‘Wechsler Logical Memory Subtest’ is utilized [123]. The Free and Cued Selective Reminding Test (FCSRT) is more predictive in identifying people with memory complaints who subsequently develop AD, but the California Verbal Learning Test (CVLT) displays increased sensitivity in detecting early-stage abnormalities in episodic memory. The FCSRT performs better than other tests in terms of sensitivity and specificity for identifying prodromal AD, according to studies. Furthermore, the FCSRT outperforms the Wechsler Logical Memory Delayed Recall in accurately forecasting the odds of cerebrospinal fluid (CSF) profile resembling AD in adults [124]. Therefore, incorporating a neuro-psychometric test capable of detecting subtle cognitive impairments in patients becomes advantageous when constructing a screening battery to identify preclinical and early symptomatic AD.
Table 2.
Cognitive tests and the cognitive domains it can assess.
| Sr. No. | Neuro-Psychometric Tests | Cognitive Domains |
|---|---|---|
| 1 | Mini-Mental State Exam (MMSE) | Orientation, attention, calculation, recall, language, and visual construction |
| 2 | Montreal Cognitive Assessment (MoCA) | Visuospatial and executive functions, naming, memory, attention, language, delayed recall, and orientation |
| 3 | Mini-Cog Test | Memory and executive function |
| 4 | AD Assessment Scale-Cognitive subscale (ADAS-Cog) | Memory, language, concentration, and attention |
| 5 | The sum of Boxes Clinical Dementia Score (CDR-SB) | Memory, judgment, orientation, community affairs, home hobbies, and personal care |
| 6 | Wechsler Logical Memory Subset | Immediate and delayed recall of verbal information |
| 7 | California Verbal Learning Test II (CVLTII) | Verbal learning and memory, attention, and visual recognition |
| 8 | Free & Cued Selective Reminding Test (FCSRT) | Verbal episodic memory |
4.6. Speech Testing Impairment and Its Use in Alzheimer’s Detection
One of the biggest factors that determine one’s intelligence, social interaction, and personality is spoken language. It enables us to interact and communicate with one another. The recordability of language (spoken or written) is one of the simplest and cheaper biological samples to collect. AD (AD) can lead to communication difficulties in spoken language such as aphasia and anomia and other specific problems depending on the stage of disease. Anomia is the inability to recognize and name objects while Aphasia refers to difficulty in speaking and understanding. The deterioration of spoken language is an early sign of AD (AD) and can be monitored using automatic speech analysis techniques [125]. Current research in spontaneous speech analysis has made important advances in detecting and diagnosing various neurological conditions, including AD (AD). “Automatic speech analysis techniques” can be used to diagnose and determine the severity of Alzheimer’s and these techniques can be performed by anybody in the patient’s habitual environment. “Automatic Speech Analysis and Recognition (ASR) technology” has transformed the way we diagnose and characterize cognitive disorders such as mild cognitive impairment (MCI) and AD (AD). ASR provides useful tools to analyze speech patterns, including fluency, semantic relations, and emotional responses, and it does not require complex infrastructure or expensive medical equipment. ASR is a quick, easy, and affordable speech testing tool to accurately analyze speech without causing any inconvenience to patients. Many language features, such as speech rate, vocabulary size, word choice, and syntactic complexity, can be measured by ASR, which makes it easy for researchers to identify patterns indicating cognitive decline. [126] One commonly used speech test is the “Boston Naming Test”, which examines an individual’s ability to name objects presented in images. This test can help identify difficulties with word retrieval, a common symptom of AD [127].
Clinicians and researchers have been manually administering speech examinations, including the Verbal Fluency Test. This test measures a person’s ability to utter words that begin with a given letter or fall into a specified category. Such tests can reveal information about a person’s capacity to think and order words from their memory. ASR-based tools also have an advantage in this regard since they quickly provide semantic measures or scores on language features that measure verbal fluency (VF) quality. ASR-based methods offer a promising path for early diagnosis and characterization of dementia or associated diseases, allowing for earlier interventions and better patient outcomes. [128]
4.7. Olfactory Testing Role in Screening AD
A reduced sense of smell, commonly known as olfactory impairment, is one of several indicators of AD, and early diagnosis of olfactory impairment is considered to be an effective approach for detecting Alzheimer’s [129]. Amyloid plaques and NFTs have been discovered in the olfactory brain and olfactory bulb of AD patients [130]. The NFT count per segment in the olfactory bulb has shown a 93% accuracy rate in those with AD. [131,132]. The University of Pennsylvania Smell Identification Test (UPSIT) and the Brief Smell Identification Test (B-SIT) are two of the most well-known diagnostic tests for olfactory impairment [133]. The most sensitive test is the UPSIT, which uses 40 standardized smell samples, while the B-SIT, a more condensed version using only 12 samples, is reliable as well [134]. Scratching a microcapsule strip carrying an odor and choosing an odor from a list of options takes place for both tests. Initial testing with the BSIT is fine, but the UPSIT should be employed if results are ambiguous to provide more specific information [135].
4.8. Gait Analysis as a Screening for AD
Gait refers to an individual’s manner of walking and can provide important insights into their health and overall well-being. It is the result of the intricate coordination between different bodily systems such as the skeletal, muscular, and nervous systems. If there is a malfunction in any of these systems, it can cause an abnormal gait [136]. This is why gait analysis has become increasingly popular as a diagnostic tool and a means of evaluating a patient’s rehabilitation progress [137]. Gait analysis can be easily carried out in clinical settings. It can also pose no risk to the patient and requires neither highly trained professionals nor costly equipment. The ease of data collection in Gait analysis is also helpful in longitudinal assessment of patients which can prove very beneficial in terms of disease progression and also in referral to other more thorough examinations like CSF and MRI.
Gait analysis can also be used to detect Alzheimer’s disease with good accuracy [138]. Certain Gait Features have been linked with the disease progression in previous studies including short stride length, slow speed, longer stance phase, and gait asymmetry [139]. Motor performance is dependent on the coordination of various cognitive functions, such as visual-spatial awareness, attention, and planning. Consequently, any deficiencies in these cognitive abilities can result in motor difficulties, and even minor alterations in motor functioning may be an early indication of cognitive decline. Several studies have found a connection between a slower walking rate and a higher risk of AD [140]. These investigations have demonstrated that a reduced walking speed may appear up to 9 years before the development of cognitive symptoms [141], as assessed by clinical dementia rating evaluations. Moreover, a slowing of gait speed has been connected to a positive result for amyloid deposits in follow-up testing, suggesting that alterations in walking speed may signify early stages in the development of dementia [54].
The development of AD (AD) can have a major impact on several functional domains, such as cognitive and motor abilities. This is why researchers utilize dual-task paradigms to distinguish Alzheimer patients from people with mild cognitive impairment since specific gait characteristics are drastically altered when the patient is under mental stress [138]. Compared to the single-task paradigm, the dual-task paradigm has good sensitivity and specificity [142].
4.9. Magnetic Encephalography Role in Alzheimer’s Diagnosis
Magnetoencephalography (MEG) was first invented in the 1960s. David Cohen is considered the founding father of MEG and he originally outlined the fundamentals of MEG in 1968 [143]. In 1972, he and Richard E. Busch created the first MEG recordings [144] and Since then, MEG technology has advanced significantly, particularly in the development of better sensors and data analysis techniques. MEG was primarily used in research settings in its early years due to the complexity of the equipment and the excessive cost associated with it. However, more recent developments have led to the development of more portable and user-friendly MEG systems that can be used in clinical settings.
MEG is particularly useful for studying the dynamics of neural networks, and it has shown promise as a tool for detecting early signs of AD and other forms of dementia [145]. The identification of AD using MEG has demonstrated high sensitivity and specificity, as research has shown that MEG accurately detects the predementia stage of AD better than other imaging modalities, like MRI and PET. [146]. MEG can give a direct assessment of brain function by measuring the magnetic fields produced by neuronal activity in the brain. As a result, MEG can pick up on minute variations in brain activity that might not be picked up by conventional imaging techniques. Additionally, it has been shown that MEG is useful for finding and pinpointing the times of abnormal brain activity in AD, which is useful for both early diagnosis and for following the progression of the disease.
Event-related fields (ERFs) gauge the brain’s magnetic field in reaction to certain sensory stimuli or mental processes. This approach may identify aberrant brain activity in Alzheimer’s patients relative to healthy controls [147]. Resting-state MEG is another technique that measures spontaneous brain activity when the person is at rest. This method can also be used to discover irregular brain connections, such as reduced connectivity between brain areas, which are seen in AD patients [148]. Using MEG to assess neural oscillations, which are rhythmic patterns of brain activity that may be identified at different frequencies, is a third technique. Many AD (AD) patients have aberrant brain oscillations, particularly in the beta and gamma frequency ranges, according to studies [149,150]. A fourth approach is source localization, which identifies the exact brain areas that produce the observed magnetic fields. Additionally, this method can be used to spot aberrant brain activity in areas of the brain linked to AD [151]. Although all these methods can differentiate between healthy controls and Alzheimer’s patients but they are unable to differentiate between Controls and MCI [152].
4.10. Electroencephalography (EEG) as a Tool for Alzheimer’s Detection
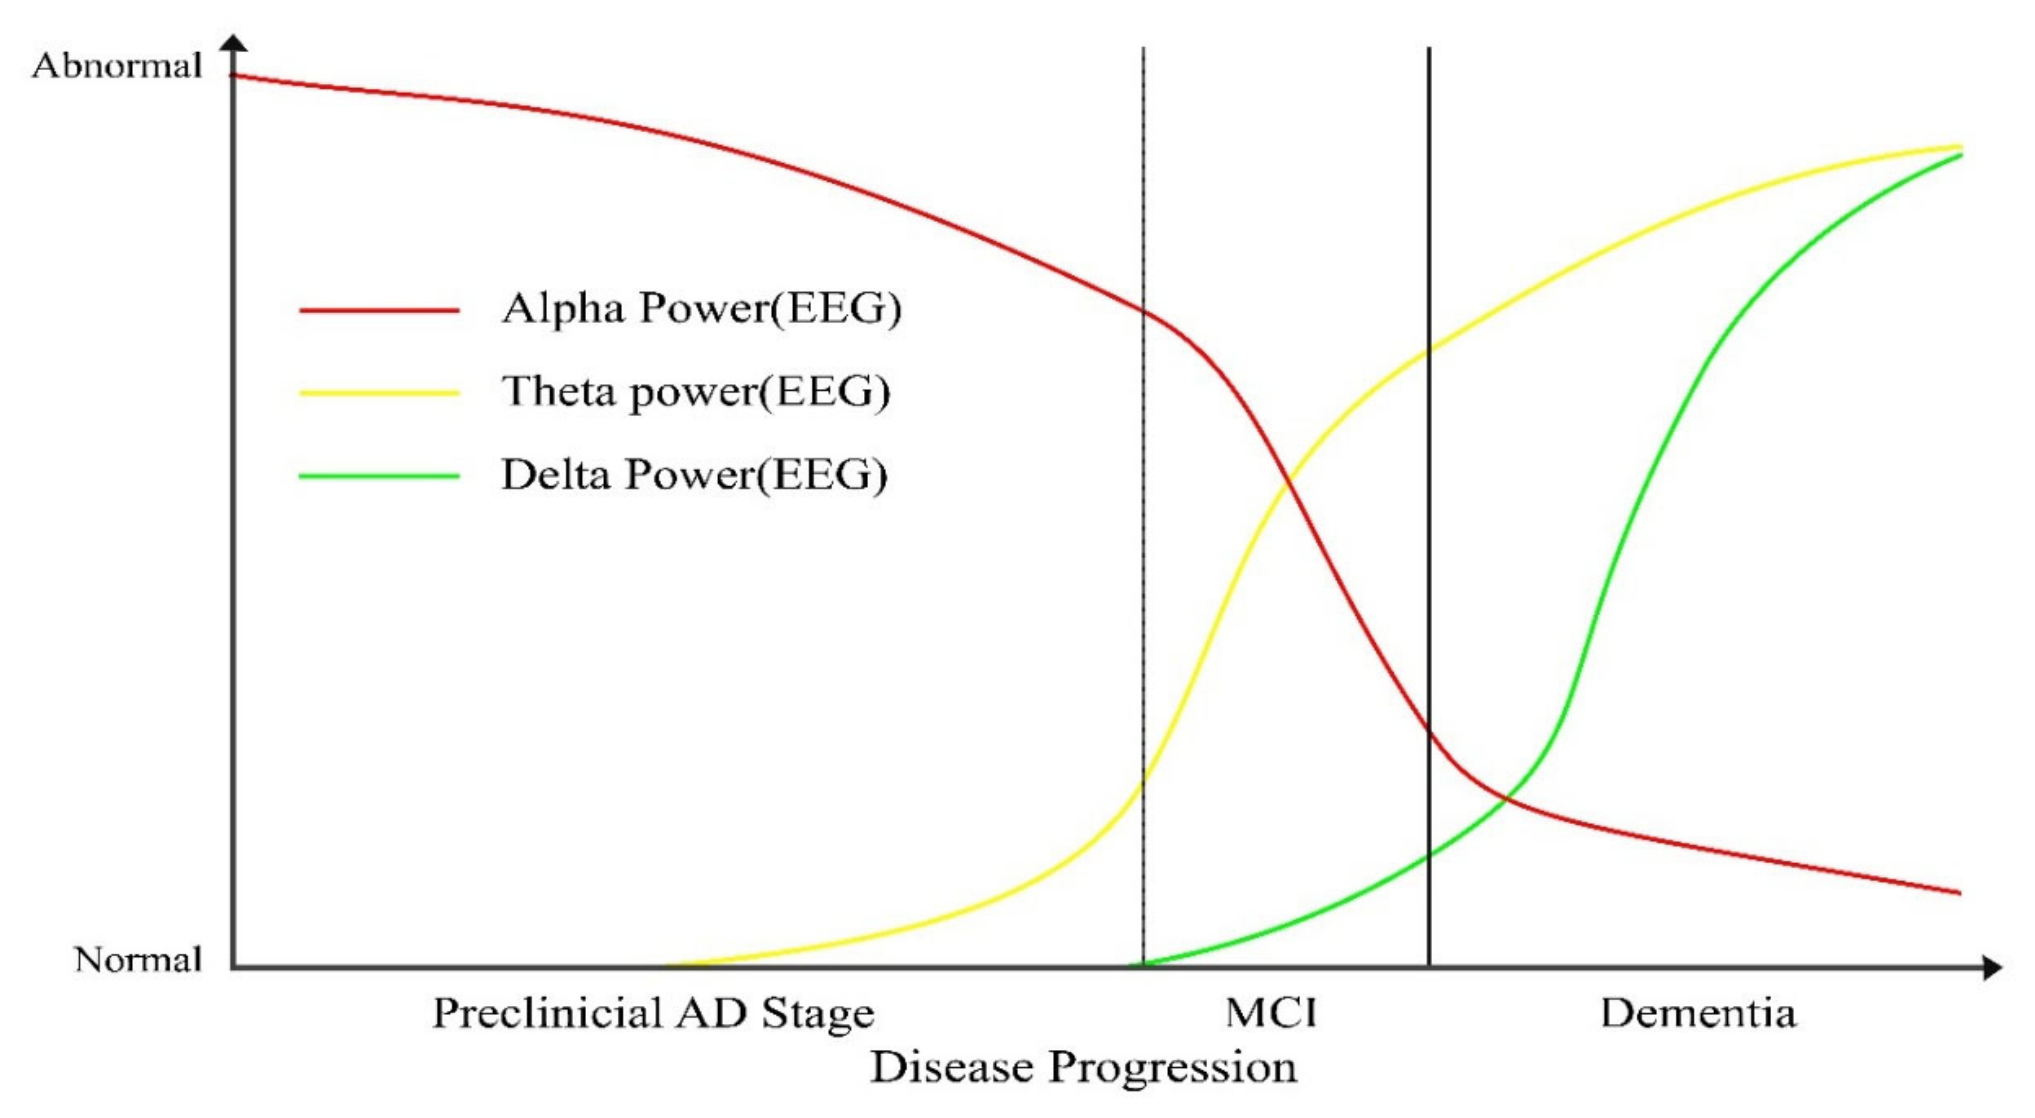
Electroencephalography, or EEG, is a non-invasive method for determining brain electrical activity. To recognize and capture the electrical impulses produced by the brain, electrodes are positioned on the scalp. Epilepsy, sleep disorders, and brain traumas are just a few of the neurological illnesses that are routinely studied and diagnosed using EEG in clinical and research settings. High temporal resolution in EEG enables real-time detection of changes in brain activity. Its spatial resolution is constrained, and it performs less well at picking up activity in the deeper parts of the brain. Electroencephalography (EEG) is often used in the clinical evaluation of individuals with mild cognitive impairment (MCI) and AD (AD). Whereas severe AD is characterized by an elevation in delta power [153], moderate AD is characterized by a rise in theta activity and a decline in beta and alpha activity [154]. MCI patients display EEG features that fall between those of AD patients and healthy [155]. The left temporo-occipital derivation’s alpha and theta relative powers can be used to accurately classify the 85% of MCI patients who would go on to develop AD [156]. Patients with MCI and healthy brains have markedly different theta band power and coherence. However, traditional EEG amplitude and power spectral analysis may not be sensitive enough to distinguish MCI patients from healthy controls [157]. EEG is a helpful tool for identifying AD and MCI overall, although more sensitive methods could be required to tell MCI from healthy subjects. Figure below explains abnormality in the level of EEG alpha, Theta and Delta with the progression of the disease
Figure 4.
Conceptual representation of EEG spectral changes reported in MCI and Alzheimer’s disease, created by the authors based on [153,154,155,156,157].
Alpha and Beta band coherence values are reduced in patients diagnosed with AD [158]. People with mild cognitive impairment (MCI) had stronger temporal interhemispheric coherence and less frontoparietal interhemispheric coherence compared to older controls [159]. Synchronization likelihood (SL) was shown to be decreased in the 14-18 and 18-22Hz bands in AD patients when used to examine brain activity in MCI [160]. However, MCI patients and healthy subjects had equal SL levels. Resting state EEG studies often reveal increased SL. In MCI, EEG studies show a pattern of increased low-frequency activity that is neither coherent nor synchronized. There was also a significant difference only in the alpha 2 band region between controls and MCI during a working memory test [161]. In MCI, SL increases during a working memory test, and the rise was linked to an increased chance of developing AD [162].
There are many different synchronisation estimates in use, however, some studies have shown that only certain estimates can discriminate between AD patients and controls as well as between AD and MCI individuals. Overall, the pattern of findings indicates that AD patients may experience a disconnection syndrome, which is characterized by decreased synchronization and an increase in asynchronous activity. Although these techniques can identify AD, they are insufficient to identify the condition in its preclinical stages [163].
4.11. Transcranial Magnetic Stimulation and Its Role in Diagnosis
A non-invasive stimulation technique that uses a magnetic field to stimulate nerve cells in the brain. It involves placing a magnetic coil on the scalp, which generates a brief magnetic pulse that passes through the skull and into the brain. When the magnetic pulse reaches the brain, it generates a small electric current that can stimulate the activity of neurons in the targeted area. By adjusting the intensity, frequency, and duration of the magnetic pulses, TMS can specifically alter the activity of neurons in different regions of the brain [164]. TMS is employed to study brain activity and treat neurological and psychiatric conditions like depression, anxiety, and chronic pain in both research and therapeutic settings. It is typically well-tolerated and has few side effects, although some people may experience mild discomfort or headaches during or after the procedure.
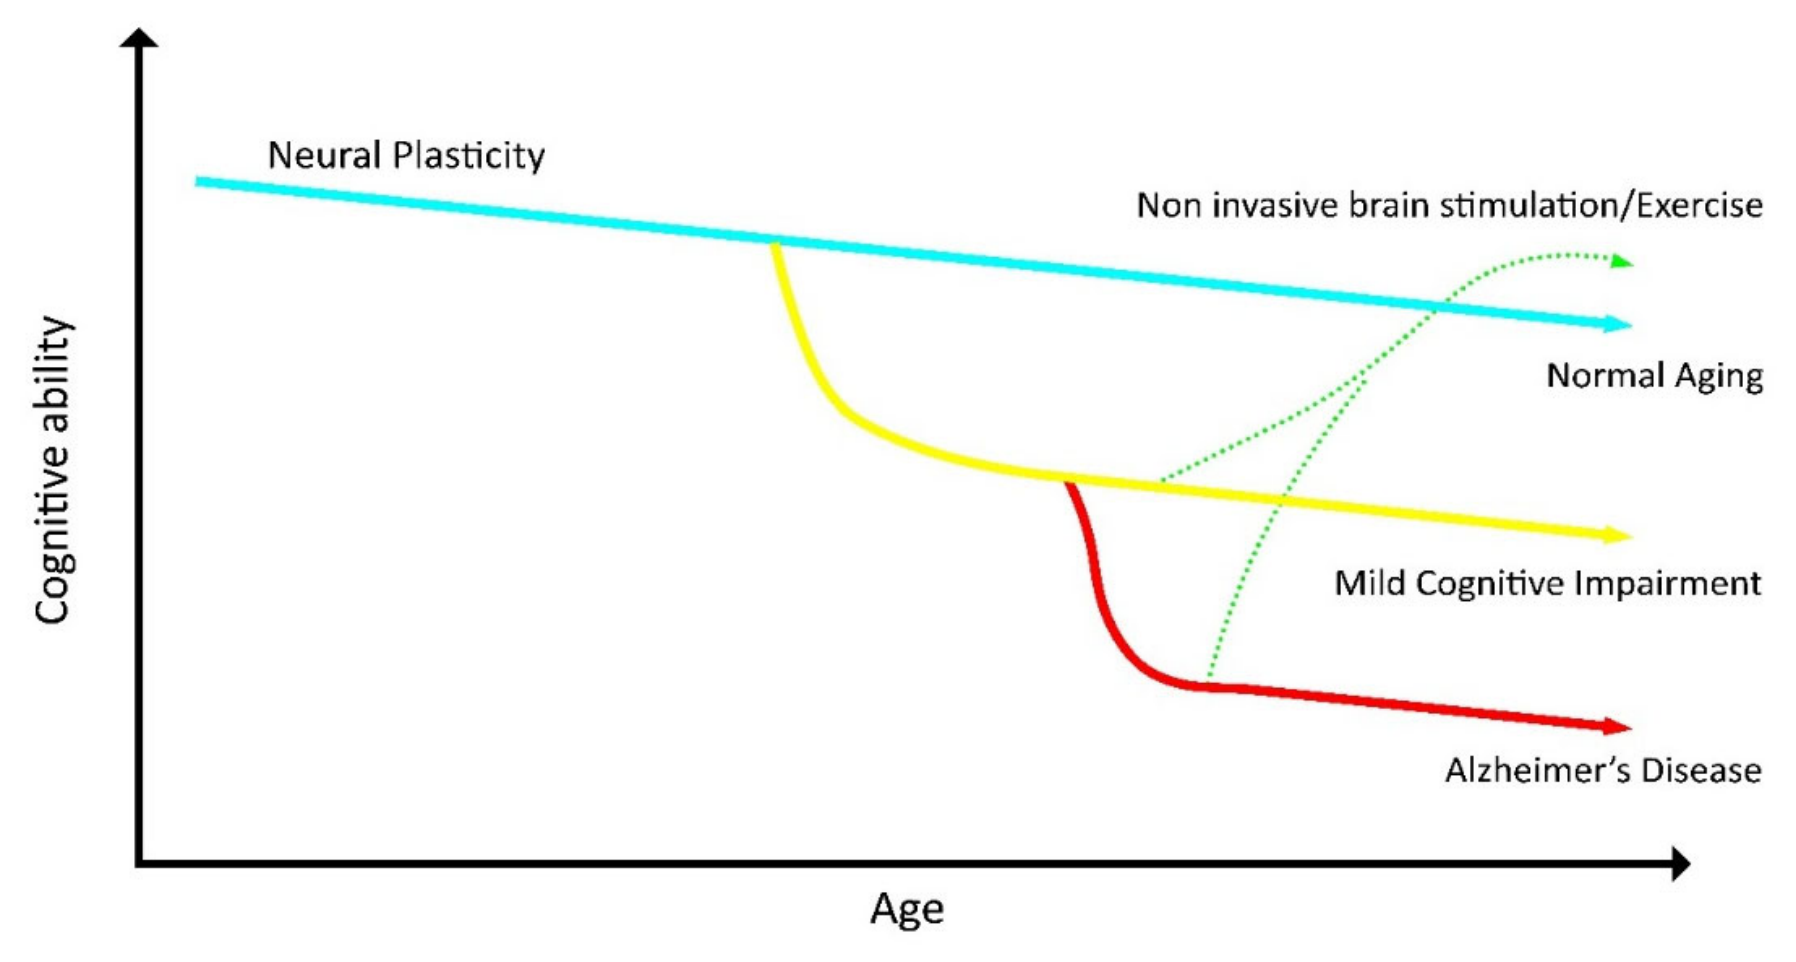
TMS can be used to assess the excitability of the cortex in response to a stimulus. Additionally, it can provide us with important details regarding the connectivity of various brain regions. Cortical excitability and neuron connectivity are seen to have been altered in individuals with Alzheimer’s [165]. TMS can be used to measure the decreased short-interval cortical excitability (SICI) and short-latency afferent inhibition (SAI) in Alzheimer’s patients [165]. The reduction in SAI and SICI points towards a defective cholinergic transmission system, also proven to be a biomarker in AD, along with the amyloid beta and tau deposits. Motor-evoked potentials (MEPs), which are produced in response to TMS pulses given across the motor cortex, are another TMS measure employed in AD research. MEP amplitude and latency have been found to fluctuate in subjects with Alzheimer’s, and this fluctuation in latency can provide information on the health of motor pathways in the brain [166]. Cortical silence periods (CSPs) is another TMS test used to assess cortical excitability in Alzheimer’s patients. CSPs are periods of muscular silence caused by a TMS pulse given across the motor cortex, and they represent the activity of inhibitory interneurons in the brain. A person with AD exhibit longer CSPs, which may be related to problems in the inhibitory control of motor output [167]. Deterioration in cognition in normal aging as compared to MCI and AD as well as the effects of rTMS on cognition is demonstrated in the figure below.
Figure 8.
The figure shows deterioration in normal aging, MCI, and AD. it also shows the proposed rTMS treatment effect on cognition. Source [168].
Figure 8.
The figure shows deterioration in normal aging, MCI, and AD. it also shows the proposed rTMS treatment effect on cognition. Source [168].
TMS has been investigated for its therapeutic value in Alzheimer, supported by extensive studies to have been improved after the treatment session [169]. Both low-frequency and high-frequency pulses have been shown to improve cognitive performance on multiple scales [170]. The effects of treatment on cognition lasted for around 12 weeks (about 3 months) in AD patients. TMS did not demonstrate an improvement in treating the pathophysiology of AD, even though the treatment’s effects on cognition were strong.
4.12. Genetic Testing for Detection of AD:
AD is a complicated disorder with a substantial genetic component. More than 70 genetic variants have been associated with AD by researchers [171]. The amyloid precursor protein (APP), presenilin 1 (PSEN1), and presenilin 2 (PSEN2) genes, among others, have mutations that have been linked to AD [172]. These genes generate the proteins that help AD develop. In various genetic studies, the APOE gene has repeatedly been connected to sporadic late-onset AD [173]. Even though several hundred families have these mutations, they only make up less than 1% of all cases [173]. The APP gene, which causes Alzheimer’s in this population, is located on Chromosome 21, which has an additional copy in people with Down syndrome [174]. Genetic testing is not frequently utilized to diagnose AD. However, asymptomatic individuals with a family history of dementia can consider getting tested to determine if they have a mutation linked to hereditary frontotemporal dementia or AD. [175]. A preimplantation genetic diagnosis is also an option for families with a disease-causing mutation. [172].
5. Multimodal Techniques for Detecting AD:
There is growing interest in combining multiple diagnostic approaches for the diagnosis of AD due to the shortcomings of individual techniques in terms of sensitivity and ability to distinguish between various neurodegenerative diseases. The detection process may also be challenging and time-consuming because some of these diagnostics are pricy or call for a specialist. Additionally, there are a limited number of MRI and PET machines available, and they are not always used to detect Alzheimer’s. This highlights the need for a screening method that can identify Alzheimer’s patients quickly, cheaply, and non-invasively.
The multi-modal approach has emerged as a promising solution to overcome these limitations. Biomarkers like structural changes in certain brain regions, phosphorylated tau, and beta-amyloid deposition have been shown to complement each other and can be used in combination to increase the overall accuracy of the diagnostic method [109]. By integrating the CSF profile with MRI, researchers were able to predict the change of MCI to AD with 91% accuracy [176]. [177] combined MRI with Cognitive testing to predict the progression of MCI to AD in a follow-up study. Similarly, [178] combined FDG pet with CSF and FDG pet with cognitive testing, and the results were better than any individual method. [179] used MRI, CSF, and FDG pet in combination and achieved an accuracy of 93.2% for the classification of AD and 91.5% for MCI converters. CSF, MRI, and pet scans are expensive and not available, and it requires a specialist to interpret the results. To counter this problem, biomarkers like speech, gait, cognitive tests, etc. are used in combination to better classify Alzheimer’s patients. [180] by using a machine learning algorithm combined GAIT, speech, and clock drawing tests to detect Alzheimer’s. The algorithm correctly identified patients into AD, MCI, and healthy with excellent accuracy. It was able to distinguish between healthy and AD patients with 100% sensitivity and specificity. [181] used an algorithm that fused unique features from language and speech and detected Alzheimer’s with excellent accuracy.[182] uses a biosensor that combines elements of GAIT with speech and eye movement to detect Alzheimer’s. The table summarizes a selection of studies that employed a multimodal method to accurately diagnose MCI and AD. Summary of different studies on the effectiveness of unimodal approach as compared to multimodal approach is given in the table below.
Table 3.
Table shows Studies on Multimodal techniques for Alzheimer’s detection and its improvement compared to unimodal techniques.
Table 3.
Table shows Studies on Multimodal techniques for Alzheimer’s detection and its improvement compared to unimodal techniques.
| Study | Metric | Unimodal Performance | Multimodal performance |
|---|---|---|---|
| [181] | Accuracy | Language -78 avg Speech—78 |
83% (avg.) |
| [180] | Accuracy | Gait—75.8 Drawing—80.8 Speech -81.9 |
93 |
| [183] | Accuracy | EEG—56.7 PET—70.3 MRI—67.22 |
85.60% |
| [184] | F1 score | Rhythmic—57 Acoustic—58 Lexical—46 Syntactic—60 |
0.745 |
| [179] | Accuracy | MRI—86.2%\ CSF—82.1 PET—86.5 |
93.2% |
| [185] | AUC | avg Language—.73 Speech—.52 avg Comprehension—.48 avg Eye tracking—.76 |
0.88 |
| [186] | Accuracy | MRI 63.9 PET 66.7 CSF 55.6 |
68.1% |
However, despite its potential advantages, the multi-modal approach also has its challenges. Considering that different modalities’ data may have varying formats and scales, integrating various types of data from these modalities is a significant challenge. Another difficulty is the requirement for large datasets and reliable machine-learning algorithms to interpret and analyze complex data. Nonetheless, the multimodal method is a viable route for enhancing Alzheimer’s detection accuracy and furthering our understanding of the illness.
6. Conclusion
This review summarized the hypothesis related to the pathophysiology of Alzheimer’s and also investigated all the diagnostic methods that are currently in use for Alzheimer’s detection. The paper also investigated the multimodal approach which takes two or more diagnostic methods and with the help of machine learning combines them for increased efficiency.
Various theories help explain the pathophysiology of the disease which includes amyloid buildup, neuroinflammation, tau pathology etc. They help explain the underlying mechanisms responsible for the neuropathology of AD. Utilizing these theories scientists have established numerous diagnostic techniques intending to detect AD early in the illness’s progression. Biomarker assays, cognitive assessments, neuroimaging approaches like MRI and PET, and gait analysis are some of the diagnostic tools that are now accessible. Nevertheless, each of these methods has limitations, such as low sensitivity or specificity, invasiveness, high costs, or a limited ability to detect AD at an early stage.
The goal of the multimodal strategy is to integrate two or more diagnostic modalities to achieve an increase in precision and also to increase the sensitivity of the method to diagnose Alzheimer’s early in its course. This method has already shown promise in increasing the overall efficacy of diagnostic methods as compared to single modalities. Furthermore, this approach can overcome the limitations of cost by incorporating low-cost screening methods that are both easy to administer as well as providing a good enough sensitivity which can be used to screen potential patients for a thorough examination. After the initial screening, the patient can then be referred to a specialty clinic for more comprehensive and specialized diagnostic methods, such as MRI and PET scans which will only be used for high-risk patients. This will reduce a tremendous burden on the expensive and time-consuming methods which if the current trend in the increase in the elderly population persists, won’t be able to run tests due to unavailability. The combination of different diagnostic techniques and multimodal approaches has the potential to increase the sensitivity and specificity of AD detection, and early screening techniques have the potential to identify the condition at an early stage, allowing for early intervention and treatment.
The diagnostic tools that are currently available have shown promise in detecting the condition early in its course, nevertheless, there is still a lot to learn about the disease itself. A multimodal strategy can also overcome the shortcomings of individual approaches and enhance the accuracy and early detection of AD, which is essential for the disease’s successful management and treatment.
Future Direction
The paper summarized the need for diagnostic methods that has the potential to detect the illness early in its course. Although major advances have been made in AD biomarkers, further work is needed to validate their performance across diverse populations and clinical settings and to improve their accessibility and standardization. Future papers can also explore the use of robust machine learning algorithms for fusion of different modalities and also the use of multimodal approach in monitoring the treatment.
Author Contributions
Conceptualization, H.K. and A.W.; Methodology, H.K. and A.S.; Validation, A.W.; Writing—Original Draft Preparation, H.K., A.S., and M.N.; Writing—Review & Editing, H.K., A.S., and M.N.; Supervision, A.W.; All authors have read and agreed to the published version of the manuscript.
Funding
This research received no external funding.
Acknowledgments
The authors would like to express their profound gratitude to the National University of Sciences and Technology for providing an academic environment and facilitating the preparation of this work.
Declaration of AI Use
Generative AI tools were used only for limited grammar correction and improving sentence clarity in selected parts of the manuscript. The authors reviewed and approved all changes and remain fully responsible for the content.
Conflicts of Interest
The authors declare no conflict of interest.
References
- Jorm, F.; Jolley, D. The incidence of dementia. Neurology 1998, vol. 51(no. 3), 728–728. [Google Scholar] [CrossRef]
- “Dementia,” World Health Organization. Available online: https://www.who.int/news-room/fact-sheets/detail/dementia (accessed on Sep. 23 2026).
- for D. E. and Research. FDA approves treatment for adults with Alzheimer’s disease. FDA. Jul 2024. Available online: https://www.fda.gov/drugs/news-events-human-drugs/fda-approves-treatment-adults-alzheimers-disease (accessed on Sep. 23 2026).
- O. of the Commissioner, “FDA Converts Novel Alzheimer’s Disease Treatment to Traditional Approval,” FDA. Available online: https://www.fda.gov/news-events/press-announcements/fda-converts-novel-alzheimers-disease-treatment-traditional-approval (accessed on Sep. 23 2026).
- Leifer, P. Early diagnosis of Alzheimer’s disease: Clinical and economic benefits. J. Am. Geriatr. Soc. 2003, vol. 51(no. 5) SUPPL. II. [Google Scholar] [CrossRef]
- Hardy, J. A.; Higgins, G. A. Alzheimer’s Disease: The Amyloid Cascade Hypothesis. Science 1992, vol. 256(no. 5054), 184–185. [Google Scholar] [CrossRef]
- Xu, W.; et al. Meta-analysis of modifiable risk factors for Alzheimer’s disease. J. Neurol. Neurosurg. Amp Psychiatry 2015, vol. 86(no. 12), 1299–1299. [Google Scholar] [CrossRef]
- Laske. Phase 3 Trials of Solanezumab and Bapineuzumab for Alzheimer’s Disease. Artic. N. Engl. J. Med. 2014. [Google Scholar] [CrossRef]
- Washington University School of Medicine. “A Phase II/III Multicenter Randomized, Double-Blind, Placebo-Controlled Platform Trial of Potential Disease Modifying Therapies Utilizing Biomarker, Cognitive, and Clinical Endpoints in Dominantly Inherited Alzheimer’s Disease,” clinicaltrials.gov, Clinical trial registration NCT01760005, May 2023. Available online: https://clinicaltrials.gov/ct2/show/NCT01760005 (accessed on Jun. 14 2023).
- Genentech, Inc. “A Double-Blind, Placebo-Controlled Parallel-Group Study in Preclinical PSEN1 E280A Mutation Carriers Randomized to Crenezumab or Placebo, and in Non-Randomized, Placebo-Treated Non-Carriers From the Same Kindred, to Evaluate the Efficacy and Safety of Crenezumab in the Treatment of Autosomal-Dominant Alzheimer’s Disease,” clinicaltrials.gov, Clinical trial registration NCT01998841, Nov. 2022. Available online: https://clinicaltrials.gov/ct2/show/NCT01998841 (accessed on Jun. 14 2023).
- Eli Lilly and Company. “Anti-Amyloid Treatment in Asymptomatic Alzheimer’s Disease (A4 Study),” clinicaltrials.gov, Clinical trial registration NCT02008357. Jan 2023. Available online: https://clinicaltrials.gov/ct2/show/NCT02008357 (accessed on Jun. 14 2023).
- Laske, C.; et al. Innovative diagnostic tools for early detection of Alzheimer’s disease. Alzheimers Dement. 2015, vol. 11(no. 5), 561–578. [Google Scholar] [CrossRef]
- Petersen, R. C. How early can we diagnose Alzheimer disease (and is it sufficient)? Neurology 2018, vol. 91(no. 9), 395–402. [Google Scholar] [CrossRef]
- Bouwman, H.; et al. CSF biomarkers and medial temporal lobe atrophy predict dementia in mild cognitive impairment. Neurobiol. Aging 2007, vol. 28(no. 7), 1070–1074. [Google Scholar] [CrossRef]
- Frisoni, B.; Fox, N. C.; Jack, C. R.; Scheltens, P.; Thompson, P. M. The clinical use of structural MRI in Alzheimer disease. Nat. Rev. Neurol. 2010, vol. 6(no. 2), 67–77. [Google Scholar] [CrossRef]
- Nordberg, A.; Rinne, J. O.; Kadir, A.; Lngström, B. The use of PET in Alzheimer disease. Nat. Rev. Neurol. 2010, vol. 6(no. 2), 78–87. [Google Scholar] [CrossRef]
- Jack, C. R.; et al. Revised criteria for diagnosis and staging of Alzheimer’s disease: Alzheimer’s Association Workgroup. Alzheimers Dement. 2024, vol. 20(no. 8), 5143–5169. [Google Scholar] [CrossRef]
- Wittenberg, R.; Knapp, M.; Karagiannidou, M.; Dickson, J.; Schott, J. Economic impacts of introducing diagnostics for mild cognitive impairment Alzheimer’s disease patients. Alzheimers Dement. Transl. Res. Clin. Interv. 2019, vol. 5, 382–387. [Google Scholar] [CrossRef]
- Hippius; Neundörfer, G. The discovery of Alzheimer’s disease. Dialogues Clin. Neurosci. 2003, vol. 5(no. 1), 101–108. [Google Scholar]
- Liu, P.-P.; Xie, Y.; Meng, X.-Y.; Kang, J.-S. History and progress of hypotheses and clinical trials for Alzheimer’s disease. Signal Transduct. Target. Ther. 2019, vol. 4(no. 1, Art. no. 1). [Google Scholar] [CrossRef]
- Goate, A.; et al. Segregation of a missense mutation in the amyloid precursor protein gene with familial Alzheimer’s disease. Nature 1991, vol. 349(no. 6311), 704–706. [Google Scholar] [CrossRef]
- Wang, D.; Chen, F.; Han, Z.; Yin, Z.; Ge, X.; Lei, P. Relationship Between Amyloid-β Deposition and Blood–Brain Barrier Dysfunction in Alzheimer’s Disease. Front. Cell. Neurosci. 2021, vol. 15. Available online: https://www.frontiersin.org/articles/10.3389/fncel.2021.695479 (accessed on Jul. 02 2023). [CrossRef]
- Chen, et al. Amyloid beta: structure, biology and structure-based therapeutic development. Acta Pharmacol. Sin. 2017, vol. 38(no. 9, Art. no. 9). [Google Scholar] [CrossRef]
- Saha, P.; Sen, N. Tauopathy: A common mechanism for neurodegeneration and brain aging. Mech. Ageing Dev. 2019, vol. 178, 72–79. [Google Scholar] [CrossRef]
- Šimić, G.; et al. Tau Protein Hyperphosphorylation and Aggregation in Alzheimer’s Disease and Other Tauopathies, and Possible Neuroprotective Strategies. Biomolecules 2016, vol. 6(no. 1), 6. [Google Scholar] [CrossRef]
- Sochocka, M.; Diniz, B. S.; Leszek, J. Inflammatory Response in the CNS: Friend or Foe? Mol. Neurobiol. 2017, vol. 54(no. 10), 8071–8089. [Google Scholar] [CrossRef]
- Chen, W.-W.; Zhang, X.; Huang, W.-J. Role of neuroinflammation in neurodegenerative diseases (Review). Mol. Med. Rep. 2016, vol. 13(no. 4), 3391–3396. [Google Scholar] [CrossRef]
- Subhramanyam, C. S.; Wang, C.; Hu, Q.; Dheen, S. T. Microglia-mediated neuroinflammation in neurodegenerative diseases. Semin. Cell Dev. Biol. 2019, vol. 94, 112–120. [Google Scholar] [CrossRef]
- Wang, W.; Zhao, F.; Ma, X.; Perry, G.; Zhu, X. Mitochondria dysfunction in the pathogenesis of Alzheimer’s disease: recent advances. Mol. Neurodegener. 2020, vol. 15(no. 1). [Google Scholar] [CrossRef]
- Cowan, K.; Anichtchik, O.; Luo, S. Mitochondrial integrity in neurodegeneration. CNS Neurosci. Ther. 2019, vol. 25(no. 7), 825–836. [Google Scholar] [CrossRef]
- Misrani, A.; Tabassum, S.; Yang, L. “Mitochondrial Dysfunction and Oxidative Stress in Alzheimer’s Disease,” Front. Aging Neurosci. 2021, vol. 13. Available online: https://www.frontiersin.org/articles/10.3389/fnagi.2021.617588 (accessed on Aug. 01 2023).
- Wang, X.; et al. Amyloid-β overproduction causes abnormal mitochondrial dynamics via differential modulation of mitochondrial fission/fusion proteins. Proc. Natl. Acad. Sci. 2008, vol. 105(no. 49), 19318–19323. [Google Scholar] [CrossRef]
- Harbauer, A. B.; Zahedi, R. P.; Sickmann, A.; Pfanner, N.; Meisinger, C. The Protein Import Machinery of Mitochondria—A Regulatory Hub in Metabolism, Stress, and Disease. Cell Metab. 2014, vol. 19(no. 3), 357–372. [Google Scholar] [CrossRef]
- Iijima-Ando, K.; Hearn, S. A.; Shenton, C.; Gatt, A.; Zhao, L.; Iijima, K. Mitochondrial mislocalization underlies Abeta42-induced neuronal dysfunction in a Drosophila model of Alzheimer’s disease. PLoS ONE 2009, vol. 4(no. 12), e8310. [Google Scholar] [CrossRef]
- Bhatti, G. K.; et al. Targeting mitochondrial bioenergetics as a promising therapeutic strategy in metabolic and neurodegenerative diseases. Biomed. J. 2022, vol. 45(no. 5), 733–748. [Google Scholar] [CrossRef]
- Ashleigh, T.; Swerdlow, R. H.; Beal, M. F. The role of mitochondrial dysfunction in Alzheimer’s disease pathogenesis. Alzheimers Dement. J. Alzheimers Assoc. 2023, vol. 19(no. 1), 333–342. [Google Scholar] [CrossRef]
- Korovesis, D.; Rubio-Tomás, T.; Tavernarakis, N. Oxidative Stress in Age-Related Neurodegenerative Diseases: An Overview of Recent Tools and Findings. Antioxidants 2023, vol. 12(no. 1, Art. no. 1). [Google Scholar] [CrossRef]
- Chen, Z.-R.; Huang, J.-B.; Yang, S.-L.; Hong, F.-F. Role of Cholinergic Signaling in Alzheimer’s Disease. Molecules 2022, vol. 27(no. 6, Art. no. 6). [Google Scholar] [CrossRef]
- Ferreira-Vieira, T. H.; Guimaraes, I. M.; Silva, F. R.; Ribeiro, F. M. Alzheimer’s disease: Targeting the Cholinergic System. Curr. Neuropharmacol. 2016, vol. 14(no. 1), 101–115. [Google Scholar] [CrossRef]
- Braak; Braak, E. Neuropathological stageing of Alzheimer-related changes. Acta Neuropathol. (Berl.) 1991, vol. 82(no. 4), 239–259. [Google Scholar] [CrossRef]
- Thompson, P. M.; et al. Tracking Alzheimer’s Disease. Ann. N. Y. Acad. Sci. 2007, vol. 1097(no. 1), 183–214. [Google Scholar] [CrossRef]
- Dias, M.; Ferreira, R.; Remondes, M. Medial Entorhinal Cortex Excitatory Neurons Are Necessary for Accurate Timing. J. Neurosci. 2021, vol. 41(no. 48), 9932–9943. [Google Scholar] [CrossRef]
- Therriault, et al. Biomarker modeling of Alzheimer’s disease using PET-based Braak staging. Nat. Aging 2022, vol. 2(no. 6, Art. no. 6). [Google Scholar] [CrossRef]
- Braak, H.; Braak, E. Evolution of the neuropathology of Alzheimer’s disease. Acta Neurol. Scand. 1996, vol. 94(no. S165), 3–12. [Google Scholar] [CrossRef]
- Breijyeh, Z.; Karaman, R. Comprehensive Review on Alzheimer’s Disease: Causes and Treatment. Molecules 2020, vol. 25(no. 24). [Google Scholar] [CrossRef]
- Cai, S.; et al. Altered functional brain networks in amnestic mild cognitive impairment: a resting-state fMRI study. Brain Imaging Behav. 2017, vol. 11(no. 3), 619–631. [Google Scholar] [CrossRef]
- Braak, E.; Griffing, K.; Arai, K.; Bohl, J.; Bratzke, H.; Braak, H. Neuropathology of Alzheimer’s disease: what is new since A. Alzheimer? Eur. Arch. Psychiatry Clin. Neurosci. 1999, vol. 249(no. 3), S14–S22. [Google Scholar] [CrossRef]
- Bao, W.; Xie, F.; Zuo, C.; Guan, Y.; Huang, Y. H. PET Neuroimaging of Alzheimer’s Disease: Radiotracers and Their Utility in Clinical Research. Front. Aging Neurosci. 2021, vol. 13. Available online: https://www.frontiersin.org/articles/10.3389/fnagi.2021.624330 (accessed on Mar. 07 2023). [CrossRef]
- Mosconi; Berti, V.; Glodzik, L.; Pupi, A.; De Santi, S.; de Leon, M. J. Pre-Clinical Detection of Alzheimer’s Disease Using FDG-PET, with or without Amyloid Imaging. J. Alzheimers Dis. 2010, vol. 20(no. 3), 843–854. [Google Scholar] [CrossRef]
- Engler, H.; et al. Two-year follow-up of amyloid deposition in patients with Alzheimer’s disease. Brain J. Neurol. 2006, vol. 129 no. Pt 11, 2856–2866. [Google Scholar] [CrossRef]
- Mosconi, et al. FDG-PET changes in brain glucose metabolism from normal cognition to pathologically verified Alzheimer’s disease. Eur. J. Nucl. Med. Mol. Imaging 2009, vol. 36(no. 5), 811–822. [Google Scholar] [CrossRef]
- Mosconi. Brain glucose metabolism in the early and specific diagnosis of Alzheimer’s disease. FDG-PET studies in MCI and AD. Eur. J. Nucl. Med. Mol. Imaging 2005, vol. 32(no. 4), 486–510. [Google Scholar] [CrossRef]
- Jagust, W.; Reed, B.; Mungas, D.; Ellis, W.; Decarli, C. What does fluorodeoxyglucose PET imaging add to a clinical diagnosis of dementia? Neurology 2007, vol. 69(no. 9), 871–877. [Google Scholar] [CrossRef]
- Jack, C. R.; et al. Tracking pathophysiological processes in Alzheimer’s disease: an updated hypothetical model of dynamic biomarkers. Lancet Neurol. 2013, vol. 12(no. 2), 207–216. [Google Scholar] [CrossRef]
- Braak, H.; de Vos, R. A.; Jansen, E. N.; Bratzke, H.; Braak, E. Neuropathological hallmarks of Alzheimer’s and Parkinson’s diseases. Prog. Brain Res. 1998, vol. 117, 267–285. [Google Scholar] [CrossRef]
- Perry, E. K.; Perry, R. H.; Blessed, G.; Tomlinson, B. E. Changes in brain cholinesterases in senile dementia of Alzheimer type. Neuropathol. Appl. Neurobiol. 1978, vol. 4(no. 4), 273–277. [Google Scholar] [CrossRef]
- Shukla, A. K.; Kumar, U. Positron emission tomography: An overview. J. Med. Phys. Assoc. Med. Phys. India 2006, vol. 31(no. 1), 13–21. [Google Scholar] [CrossRef]
- Rinne, J. O.; et al. Brain acetylcholinesterase activity in mild cognitive impairment and early Alzheimer’s disease. J. Neurol. Neurosurg. Psychiatry 2003, vol. 74(no. 1), 113–115. [Google Scholar] [CrossRef]
- Herholz, K.; Weisenbach, S.; Kalbe, E.; Diederich, N. J.; Heiss, W.-D. Cerebral acetylcholine esterase activity in mild cognitive impairment. Neuroreport 2005, vol. 16(no. 13), 1431–1434. [Google Scholar] [CrossRef]
- Reinikainen, K. J.; Soininen, H.; Riekkinen, P. J. Neurotransmitter changes in Alzheimer’s disease: implications to diagnostics and therapy. J. Neurosci. Res. 1990, vol. 27(no. 4), 576–586. [Google Scholar] [CrossRef]
- Walker, Z.; et al. Differentiation of dementia with Lewy bodies from Alzheimer’s disease using a dopaminergic presynaptic ligand. J. Neurol. Neurosurg. Psychiatry 2002, vol. 73(no. 2), 134–140. [Google Scholar] [CrossRef]
- McKeith, et al. Sensitivity and specificity of dopamine transporter imaging with 123I-FP-CIT SPECT in dementia with Lewy bodies: a phase III, multicentre study. Lancet Neurol. 2007, vol. 6(no. 4), 305–313. [Google Scholar] [CrossRef]
- Kepe, V.; et al. Serotonin 1A receptors in the living brain of Alzheimer’s disease patients. Proc. Natl. Acad. Sci. U. S. A. 2006, vol. 103(no. 3), 702–707. [Google Scholar] [CrossRef]
- Lowe, V. J.; et al. Comparison of 18F-FDG and PiB PET in cognitive impairment. J. Nucl. Med. Off. Publ. Soc. Nucl. Med. 2009, vol. 50(no. 6), 878–886. [Google Scholar] [CrossRef]
- Klunk, W. E.; et al. Imaging Brain Amyloid in Alzheimer’s Disease with Pittsburgh Compound-B. Ann. Neurol. 2004, vol. 55(no. 3), 306–319. [Google Scholar] [CrossRef]
- Jagust, W. Mapping Brain β-Amyloid. Curr. Opin. Neurol. 2009, vol. 22(no. 4), 356–361. [Google Scholar] [CrossRef]
- Forsberg, A.; et al. PET imaging of amyloid deposition in patients with mild cognitive impairment. Neurobiol. Aging 2008, vol. 29(no. 10), 1456–1465. [Google Scholar] [CrossRef]
- Edison, P.; et al. Amyloid, hypometabolism, and cognition in Alzheimer disease: an [11C]PIB and [18F]FDG PET study. Neurology 2007, vol. 68(no. 7), 501–508. [Google Scholar] [CrossRef]
- Forsberg, A.; Almkvist, O.; Engler, H.; Wall, A.; Långström, B.; Nordberg, A. High PIB retention in Alzheimer’s disease is an early event with complex relationship with CSF biomarkers and functional parameters. Curr. Alzheimer Res. 2010, vol. 7(no. 1), 56–66. [Google Scholar] [CrossRef]
- Cagnin, et al. In-vivo measurement of activated microglia in dementia. Lancet Lond. Engl. 2001, vol. 358(no. 9280), 461–467. [Google Scholar] [CrossRef]
- Okello, et al. Microglial activation and amyloid deposition in mild cognitive impairment. Neurology 2009, vol. 72(no. 1), 56–62. [Google Scholar] [CrossRef]
- Yoshiyama, Y.; Lee, V. M. Y.; Trojanowski, J. Q. Therapeutic strategies for tau mediated neurodegeneration. J. Neurol. Neurosurg. Psychiatry 2013, vol. 84(no. 7), 784–795. [Google Scholar] [CrossRef]
- Paterson, R. W.; et al. Cerebrospinal fluid in the differential diagnosis of Alzheimer’s disease: clinical utility of an extended panel of biomarkers in a specialist cognitive clinic. Alzheimers Res. Ther. 2018, vol. 10(no. 1), 32. [Google Scholar] [CrossRef]
- Blennow; Hampel, H.; Weiner, M.; Zetterberg, H. Cerebrospinal fluid and plasma biomarkers in Alzheimer disease. Nat. Rev. Neurol. 2010, vol. 6(no. 3), 131–144. [Google Scholar] [CrossRef]
- Tibbling, G.; Link, H.; Ohman, S. Principles of albumin and IgG analyses in neurological disorders. I. Establishment of reference values. Scand. J. Clin. Lab. Invest. 1977, vol. 37(no. 5), 385–390. [Google Scholar] [CrossRef]
- Blood-brain barrier disturbance in patients with Alzheimer’s disease is related to vascular factors—PubMed. Available online: https://pubmed.ncbi.nlm.nih.gov/2360400/ (accessed on Mar. 16 2023).
- Cerebrospinal fluid in the diagnosis of multiple sclerosis: a consensus report.—PMC. Available online: https://www.ncbi.nlm.nih.gov/pmc/articles/PMC1073070/ (accessed on Mar. 16 2023).
- Consensus report of the Working Group on: ‘Molecular and Biochemical Markers of Alzheimer’s Disease’. In The Ronald and Nancy Reagan Research Institute of the Alzheimer’s Association and the National Institute on Aging Working Group, Neurobiol. Aging; 1998; vol. 19, no. 2, pp. 109–116.
- Cerebrospinal fluid {beta}-amyloid 42 and tau proteins as biomarkers of Alzheimer-type pathologic changes in the brain—PubMed. Available online: https://pubmed.ncbi.nlm.nih.gov/19273758/ (accessed on Mar. 16 2023).
- Fagan, A. M.; et al. Inverse relation between in vivo amyloid imaging load and cerebrospinal fluid Abeta42 in humans. Ann. Neurol. 2006, vol. 59(no. 3), 512–519. [Google Scholar] [CrossRef]
- Blennow. Cerebrospinal Fluid Protein Biomarkers for Alzheimer’s Disease. NeuroRx 2004, vol. 1(no. 2), 213–225. Available online: https://www.ncbi.nlm.nih.gov/pmc/articles/PMC534929/ (accessed on Mar. 16 2023). [CrossRef]
- Barichello, T.; Giridharan, V. V.; Dal-Pizzol, F. A cerebrospinal fluid biosignature for the diagnosis of Alzheimer’s disease. Braz. J. Psychiatry 2019, vol. 41, 467–468. [Google Scholar] [CrossRef]
- Ost, et al. Initial CSF total tau correlates with 1-year outcome in patients with traumatic brain injury. Neurology 2006, vol. 67(no. 9), 1600–1604. [Google Scholar] [CrossRef]
- Blom, E. S.; et al. Rapid progression from mild cognitive impairment to Alzheimer’s disease in subjects with elevated levels of tau in cerebrospinal fluid and the APOE epsilon4/epsilon4 genotype. Dement. Geriatr. Cogn. Disord. 2009, vol. 27(no. 5), 458–464. [Google Scholar] [CrossRef]
- Wang, G.-R.; et al. Elevated levels of tau protein in cerebrospinal fluid of patients with probable Creutzfeldt-Jakob disease. Am. J. Med. Sci. 2010, vol. 340(no. 4), 291–295. [Google Scholar] [CrossRef]
- Riemenschneider, et al. Phospho-tau/total tau ratio in cerebrospinal fluid discriminates Creutzfeldt-Jakob disease from other dementias. Mol. Psychiatry 2003, vol. 8(no. 3), 343–347. [Google Scholar] [CrossRef]
- Measurement of phosphorylated tau epitopes in the differential diagnosis of Alzheimer disease: a comparative cerebrospinal fluid study—PubMed. Available online: https://pubmed.ncbi.nlm.nih.gov/14706948/ (accessed on Mar. 16 2023).
- Blennow, K.; Hampel, H. CSF markers for incipient Alzheimer’s disease. Lancet Neurol. 2003, vol. 2(no. 10), 605–613. [Google Scholar] [CrossRef]
- Hansson, O.; Zetterberg, H.; Buchhave, P.; Londos, E.; Blennow, K.; Minthon, L. Association between CSF biomarkers and incipient Alzheimer’s disease in patients with mild cognitive impairment: a follow-up study. Lancet Neurol. 2006, vol. 5(no. 3), 228–234. [Google Scholar] [CrossRef]
- Maddalena, A.; et al. Biochemical diagnosis of Alzheimer disease by measuring the cerebrospinal fluid ratio of phosphorylated tau protein to beta-amyloid peptide42. Arch. Neurol. 2003, vol. 60(no. 9), 1202–1206. [Google Scholar] [CrossRef]
- Stomrud, E.; Hansson, O.; Blennow, K.; Minthon, L.; Londos, E. Cerebrospinal fluid biomarkers predict decline in subjective cognitive function over 3 years in healthy elderly. Dement. Geriatr. Cogn. Disord. 2007, vol. 24(no. 2), 118–124. [Google Scholar] [CrossRef]
- Laske, et al. Innovative diagnostic tools for early detection of Alzheimer’s disease. Alzheimers Dement. 2015, vol. 11(no. 5), 561–578. [Google Scholar] [CrossRef]
- Hampel, H.; et al. Blood-based biomarkers for Alzheimer’s disease: mapping the road to the clinic. Nat. Rev. Neurol. 2018, vol. 14(no. 11), 639–652. [Google Scholar] [CrossRef]
- Blood-Based Proteomic Biomarkers of Alzheimer’s Disease Pathology—PMC. Available online: https://www.ncbi.nlm.nih.gov/pmc/articles/PMC4644785/ (accessed on Jul. 18 2023).
- O’Bryant, S. E.; et al. Blood-based biomarkers in Alzheimer disease: Current state of the science and a novel collaborative paradigm for advancing from discovery to clinic. Alzheimers Dement. 2017, vol. 13(no. 1), 45–58. [Google Scholar] [CrossRef]
- Janel, et al. Plasma DYRK1A as a novel risk factor for Alzheimer’s disease. Transl. Psychiatry 2014, vol. 4(no. 8), e425–e425. [Google Scholar] [CrossRef]
- Blood-based biomarkers for Alzheimer’s disease | EMBO Molecular Medicine. Available online: https://www.embopress.org/doi/full/10.15252/emmm.202114408 (accessed on Mar. 16 2023).
- “The Alzheimer’s disease β-secretase enzyme, BACE1 | Molecular Neurodegeneration | Full Text.”. Available online: https://molecularneurodegeneration.biomedcentral.com/articles/10.1186/1750-1326-2-22 (accessed on Jul. 18 2023).
- Sun, Q.; et al. Plasma β-amyloid, tau, neurodegeneration biomarkers and inflammatory factors of probable Alzheimer’s disease dementia in Chinese individuals. Front. Aging Neurosci. 2022, vol. 14. Available online: https://www.frontiersin.org/articles/10.3389/fnagi.2022.963845 (accessed on Mar. 18 2023). [CrossRef]
- Fandos, et al. Plasma amyloid β 42/40 ratios as biomarkers for amyloid β cerebral deposition in cognitively normal individuals. Alzheimers Dement. Diagn. Assess. Dis. Monit. 2017, vol. 8, 179–187. [Google Scholar] [CrossRef]
- GFAP as a Potential Biomarker for Alzheimer’s Disease: A Systematic Review and Meta-Analysis—PMC. Available online: https://www.ncbi.nlm.nih.gov/pmc/articles/PMC10177296/ (accessed on Jul. 18 2023).
- O. of the Commissioner, “FDA Clears First Blood Test Used in Diagnosing Alzheimer’s Disease,” FDA. Available online: https://www.fda.gov/news-events/press-announcements/fda-clears-first-blood-test-used-diagnosing-alzheimers-disease (accessed on Sep. 23 2026).
- Dickerson, C.; et al. MRI-derived entorhinal and hippocampal atrophy in incipient and very mild Alzheimer’s disease☆☆This research was supported by grants P01 AG09466 and P30 AG10161 from the National Institute on Aging, National Institutes of Health. Neurobiol. Aging 2001, vol. 22(no. 5), 747–754. [Google Scholar] [CrossRef]
- Colliot, O.; et al. Discrimination between Alzheimer disease, mild cognitive impairment, and normal aging by using automated segmentation of the hippocampus. Radiology 2008, vol. 248(no. 1), 194–201. [Google Scholar] [CrossRef]
- Dickerson, C.; et al. Alzheimer-signature MRI biomarker predicts AD dementia in cognitively normal adults. Neurology 2011, vol. 76(no. 16), 1395–1402. [Google Scholar] [CrossRef]
- Fleisher, A. S.; et al. Volumetric MRI vs clinical predictors of Alzheimer disease in mild cognitive impairment. Neurology 2008, vol. 70(no. 3), 191–199. [Google Scholar] [CrossRef]
- Ashburner, J.; Friston, K. J. Voxel-based morphometry--the methods. NeuroImage 2000, vol. 11 no. 6 Pt 1, 805–821. [Google Scholar] [CrossRef]
- Alexander, A. L.; Lee, J. E.; Lazar, M.; Field, A. S. Diffusion tensor imaging of the brain. Neurotherapeutics 2007, vol. 4(no. 3), 316–329. [Google Scholar] [CrossRef]
- Varghese, T.; Sheelakumari, R.; James, J. S.; Mathuranath, P. A review of neuroimaging biomarkers of Alzheimer’s disease. Available online: http://www.fmrib.ox.ac.uk.
- Vasconcelos, L. de G.; Brucki, S. M. D.; Jackowiski, A. P.; Bueno, O. F. A. Diffusion tensor imaging for Alzheimer’s disease: A review of concepts and potential clinical applicability. Dement. Neuropsychol. 2009, vol. 3(no. 4), 268–274. [Google Scholar] [CrossRef]
- Alves, G. S.; et al. Diffusion tensor imaging studies in vascular disease: A review of the literature. Dement. Neuropsychol. 2012, vol. 6(no. 3), 158. [Google Scholar] [CrossRef]
- C. L, V. Pj, V. F, and A. P, “New MRI markers for Alzheimer’s disease: a meta-analysis of diffusion tensor imaging and a comparison with medial temporal lobe measurements,”. J. Alzheimers Dis. JAD 2012, vol. 29(no. 2). [CrossRef]
- Wang, K.; et al. Altered functional connectivity in early Alzheimer’s disease: a resting-state fMRI study. Hum. Brain Mapp. 2007, vol. 28(no. 10), 967–978. [Google Scholar] [CrossRef]
- Guo, H.; Zhang, Y. Resting State fMRI and Improved Deep Learning Algorithm for Earlier Detection of Alzheimer’s Disease. IEEE Access 2020, vol. 8, 115383–115392. [Google Scholar] [CrossRef]
- Tripoliti, E.; Fotiadis, D. I.; Argyropoulou, M.; Manis, G. A six stage approach for the diagnosis of the Alzheimer’s disease based on fMRI data. J. Biomed. Inform. 2010, vol. 43(no. 2), 307–320. [Google Scholar] [CrossRef]
- Sperling, R. Functional MRI studies of associative encoding in normal aging, mild cognitive impairment, and Alzheimer’s disease. Ann. N. Y. Acad. Sci. 2007, vol. 1097, 146–155. [Google Scholar] [CrossRef]
- He, Y.; et al. Regional coherence changes in the early stages of Alzheimer’s disease: A combined structural and resting-state functional MRI study. NeuroImage 2007, vol. 35(no. 2, p. 488). Available online: https://www.academia.edu/24597899/Regional_coherence_changes_in_the_early_stages_of_Alzheimer_s_disease_A_combined_structural_and_resting_state_functional_MRI_study (accessed on Apr. 11 2023). [CrossRef]
- Folstein, F.; Folstein, S. E.; McHugh, P. R. ‘Mini-mental state’. A practical method for grading the cognitive state of patients for the clinician. J. Psychiatr. Res. 1975, vol. 12(no. 3), 189–198. [Google Scholar] [CrossRef]
- Nasreddine, Z. S.; et al. The Montreal Cognitive Assessment, MoCA: A Brief Screening Tool For Mild Cognitive Impairment. J. Am. Geriatr. Soc. 2005, vol. 53(no. 4), 695–699. [Google Scholar] [CrossRef]
- Borson, S.; Scanlan, J. M.; Chen, P.; Ganguli, M. The Mini-Cog as a screen for dementia: validation in a population-based sample. J. Am. Geriatr. Soc. 2003, vol. 51(no. 10), 1451–1454. [Google Scholar] [CrossRef]
- J. Skinner et al., “The Alzheimer’s Disease Assessment Scale-Cognitive-Plus (ADAS-Cog-Plus): an expansion of the ADAS-Cog to improve responsiveness in MCI,” Brain Imaging Behav., vol. 6, no. 4, p. 10.1007/s11682-012-9166–3, Dec. 2012. [CrossRef]
- Morris, J. C. The Clinical Dementia Rating (CDR): current version and scoring rules. Neurology 1993, vol. 43(no. 11), 2412–2414. [Google Scholar] [CrossRef]
- Abikoff, H.; et al. Logical memory subtest of the Wechsler Memory Scale: age and education norms and alternate-form reliability of two scoring systems. J. Clin. Exp. Neuropsychol. 1987, vol. 9(no. 4), 435–448. [Google Scholar] [CrossRef]
- Wagner, M.; et al. Biomarker validation of a cued recall memory deficit in prodromal Alzheimer disease. Neurology 2012, vol. 78(no. 6), 379–386. [Google Scholar] [CrossRef]
- López-de-Ipiña, K.; et al. On the Selection of Non-Invasive Methods Based on Speech Analysis Oriented to Automatic Alzheimer Disease Diagnosis. Sensors 2013, vol. 13(no. 5), Art. no. 5. [Google Scholar] [CrossRef]
- Sadeghian, R.; Schaffer, J. D.; Zahorian, S. A. Towards an Automatic Speech-Based Diagnostic Test for Alzheimer’s Disease. Front. Comput. Sci. 2021, vol. 3. Available online: https://www.frontiersin.org/articles/10.3389/fcomp.2021.624594 (accessed on Mar. 25 2023). [CrossRef]
- Williams, B. W.; Mack, W.; Henderson, V. W. Boston naming test in Alzheimer’s disease. Neuropsychologia 1989, vol. 27(no. 8), 1073–1079. [Google Scholar] [CrossRef]
- On Automatic Diagnosis of Alzheimer’s Disease Based on Spontaneous Speech Analysis and Emotional Temperature | SpringerLink. Available online: https://link.springer.com/article/10.1007/s12559-013-9229-9 (accessed on Mar. 25 2023).
- “Alzheimer’s Disease and Smell Loss,” News-Medical.net. Available online: https://www.news-medical.net/health/Alzheimere28099s-Disease-and-Smell-Loss.aspx (accessed on Jul. 03 2023).
- Arnold, S. E.; et al. Olfactory epithelium amyloid-β and paired helical filament-tau pathology in Alzheimer disease. Ann. Neurol. 2010, vol. 67(no. 4), 462–469. [Google Scholar] [CrossRef]
- Kovács, T.; Cairns, N. J.; Lantos, P. L. beta-amyloid deposition and neurofibrillary tangle formation in the olfactory bulb in ageing and Alzheimer’s disease. Neuropathol. Appl. Neurobiol. 1999, vol. 25(no. 6), 481–491. [Google Scholar] [CrossRef]
- DeTure, M. A.; Dickson, D. W. The neuropathological diagnosis of Alzheimer’s disease. Mol. Neurodegener. 2019, vol. 14(no. 1), 32. [Google Scholar] [CrossRef]
- El Rassi, et al. Sensitivity analysis and diagnostic accuracy of the Brief Smell Identification Test in patients with chronic rhinosinusitis. Int. Forum Allergy Rhinol. 2016, vol. 6(no. 3), 287–292. [Google Scholar] [CrossRef]
- Equating scores of the University of Pennsylvania Smell Identification Test and Sniffin’ Sticks test in patients with Parkinson’s disease—ScienceDirect. Available online: https://www.sciencedirect.com/science/article/pii/S1353802016303819 (accessed on Jul. 03 2023).
- https://fyra.io, “Olfactory Testing in the Diagnosis of Alzheimer’s Disease and Other Neuro-Degenerative Disorders,” Practical Neurology. Available online: https://practicalneurology.com/articles/2009-july-aug/PN0809_02-php (accessed on Jul. 03 2023).
- Srivastava, S.; Kao, P.-C.; Reisman, D. S.; Higginson, J. S.; Scholz, J. P. Coordination of muscles to control the footpath during over-ground walking in neurologically intact individuals and stroke survivors. Exp. Brain Res. 2016, vol. 234(no. 7), 1903–1914. [Google Scholar] [CrossRef]
- Selves; Stoquart, G.; Lejeune, T. Gait rehabilitation after stroke: review of the evidence of predictors, clinical outcomes and timing for interventions. Acta Neurol. Belg. 2020, vol. 120(no. 4), 783–790. [Google Scholar] [CrossRef]
- Ghoraani, B.; Boettcher, L. N.; Hssayeni, M. D.; Rosenfeld, A.; Tolea, M. I.; Galvin, J. E. Detection of mild cognitive impairment and Alzheimer’s disease using dual-task gait assessments and machine learning. Biomed. Signal Process. Control 2021, vol. 64. [Google Scholar] [CrossRef]
- Cedervall, Y.; Halvorsen, K.; Åberg, A. C. A longitudinal study of gait function and characteristics of gait disturbance in individuals with Alzheimer’s disease. Gait Posture 2014, vol. 39(no. 4), 1022–1027. [Google Scholar] [CrossRef]
- Taylor, M. E.; et al. Slow gait speed is associated with executive function decline in older people with mild to moderate dementia: A one year longitudinal study. Arch. Gerontol. Geriatr. 2017, vol. 73, 148–153. [Google Scholar] [CrossRef]
- Skillbäck, T.; et al. Slowing gait speed precedes cognitive decline by several years. Alzheimers Dement. 2022, vol. 18(no. 9), 1667–1676. [Google Scholar] [CrossRef]
- O’KEEFFE, S. T.; KAZEEM, H.; PHILPOTT, R. M.; PLAYFER, J. R.; GOSNEY, M.; LYE, M. Gait Disturbance in Alzheimer’s Disease: A Clinical Study. Age Ageing 1996, vol. 25(no. 4), 313–316. [Google Scholar] [CrossRef]
- Cohen. Magnetoencephalography: Evidence of Magnetic Fields Produced by Alpha-Rhythm Currents. Science 1968, vol. 161(no. 3843), 784–786. [Google Scholar] [CrossRef]
- Cohen, D. Magnetoencephalography: Detection of the Brain’s Electrical Activity with a Superconducting Magnetometer. Science 1972, vol. 175(no. 4022), 664–666. [Google Scholar] [CrossRef]
- Generalized synchronization of MEG recordings in Alzheimer’s Disease: evidence for involvement of the gamma band—PubMed. Available online: https://pubmed.ncbi.nlm.nih.gov/12488788/ (accessed on 22 May 2023).
- Nakamura, A.; et al. Electromagnetic signatures of the preclinical and prodromal stages of Alzheimer’s disease. Brain 2018, vol. 141(no. 5), 1470–1485. [Google Scholar] [CrossRef]
- Kurimoto, R.; et al. Event-related synchronization of alpha activity in early Alzheimer’s disease and mild cognitive impairment: An MEG study combining beamformer and group comparison. Neurosci. Lett. 2008, vol. 443(no. 2), 86–89. [Google Scholar] [CrossRef]
- Susi; Méndez, I. S.; Verdejo, J.; García, M. E. L.; Cuesta, P.; Maestú, F. Modeling resting state MEG functional connectivity of the prodromal phase of AD using The Virtual Brain. Alzheimers Dement. 2021, vol. 17(no. S4), e052316. [Google Scholar] [CrossRef]
- Alexander, D. M.; et al. Eeg markers for cognitive decline in elderly subjects with subjective memory complaints. J. Integr. Neurosci. 2006, vol. 05(no. 01), 49–74. [Google Scholar] [CrossRef]
- Bennys, K.; Rondouin, G.; Vergnes, C.; Touchon, J. Diagnostic value of quantitative EEG in Alzheimer’s disease. Neurophysiol. Clin. Neurophysiol. 2001, vol. 31(no. 3), 153–160. [Google Scholar] [CrossRef]
- “Frontiers | A Comprehensive Review of Magnetoencephalography (MEG) Studies for Brain Functionality in Healthy Aging and Alzheimer’s Disease (AD).”. Available online: https://www.frontiersin.org/articles/10.3389/fncom.2018.00060/full (accessed on 23 May 2023).
- Fernández, A.; Hornero, R.; Mayo, A.; Poza, J.; Gil-Gregorio, P.; Ortiz, T. MEG spectral profile in Alzheimer’s disease and mild cognitive impairment. Clin. Neurophysiol. 2006, vol. 117(no. 2), 306–314. [Google Scholar] [CrossRef]
- Dierks, T.; Ihl, R.; Frölich, L.; Maurer, K. Dementia of the Alzheimer type: effects on the spontaneous EEG described by dipole sources. Psychiatry Res. 1993, vol. 50(no. 3), 151–162. [Google Scholar] [CrossRef]
- Babiloni, C.; et al. Mapping distributed sources of cortical rhythms in mild Alzheimer’s disease. A multicentric EEG study. NeuroImage 2004, vol. 22(no. 1), 57–67. [Google Scholar] [CrossRef]
- Grunwald, M.; et al. Theta-power differences in patients with mild cognitive impairment under rest condition and during haptic tasks. Alzheimer Dis. Assoc. Disord. 2002, vol. 16(no. 1), 40–48. [Google Scholar] [CrossRef]
- Jelic, V.; et al. Quantitative electroencephalography in mild cognitive impairment: longitudinal changes and possible prediction of Alzheimer’s disease. Neurobiol. Aging 2000, vol. 21(no. 4), 533–540. [Google Scholar] [CrossRef]
- Jelic, V.; Shigeta, M.; Julin, P.; Almkvist, O.; Winblad, B.; Wahlund, L. O. Quantitative electroencephalography power and coherence in Alzheimer’s disease and mild cognitive impairment. Dement. Basel Switz. 1996, vol. 7(no. 6), 314–323. [Google Scholar] [CrossRef]
- EEG abnormalities are associated with different cognitive profiles in Alzheimer’s disease—PubMed. Available online: https://pubmed.ncbi.nlm.nih.gov/21109738/ (accessed on 22 May 2023).
- Moretti, D. V.; et al. Cerebrovascular disease and hippocampal atrophy are differently linked to functional coupling of brain areas: an EEG coherence study in MCI subjects. J. Alzheimers Dis. JAD 2008, vol. 14(no. 3), 285–299. [Google Scholar] [CrossRef]
- Stam, C. J.; van der Made, Y.; Pijnenburg, Y. a. L.; Scheltens, P. EEG synchronization in mild cognitive impairment and Alzheimer’s disease. Acta Neurol. Scand. 2003, vol. 108(no. 2), 90–96. [Google Scholar] [CrossRef]
- Pijnenburg, Y. A. L.; Made, Y. vd; van Cappellen van Walsum, A. M.; Knol, D. L.; Scheltens, Ph.; Stam, C. J. EEG synchronization likelihood in mild cognitive impairment and Alzheimer’s disease during a working memory task. Clin. Neurophysiol. 2004, vol. 115(no. 6), 1332–1339. [Google Scholar] [CrossRef]
- Rossini, M.; et al. Conversion from mild cognitive impairment to Alzheimer’s disease is predicted by sources and coherence of brain electroencephalography rhythms. Neuroscience 2006, vol. 143(no. 3), 793–803. [Google Scholar] [CrossRef]
- Zamrini, et al. Magnetoencephalography as a putative biomarker for Alzheimer’s disease. Int. J. Alzheimers Dis. 2011. [Google Scholar] [CrossRef]
- Siebner, R.; Hartwigsen, G.; Kassuba, T.; Rothwell, J. How does transcranial magnetic stimulation modify neuronal activity in the brain?—Implications for studies of cognition. Cortex J. Devoted Study Nerv. Syst. Behav. 2009, vol. 45(no. 9), 1035–1042. [Google Scholar] [CrossRef]
- Nardone, R.; Tezzon, F.; Höller, Y.; Golaszewski, S.; Trinka, E.; Brigo, F. Transcranial magnetic stimulation (TMS)/repetitive TMS in mild cognitive impairment and Alzheimer’s disease. Acta Neurol. Scand. 2014, vol. 129(no. 6), 351–366. [Google Scholar] [CrossRef]
- Ferreri; Pauri, F.; Pasqualetti, P.; Fini, R.; Dal Forno, G.; Rossini, P. M. Motor cortex excitability in Alzheimer’s disease: A transcranial magnetic stimulation study. Ann. Neurol. 2003, vol. 53(no. 1), 102–108. [Google Scholar] [CrossRef]
- Wang; Zhang, H.; Han, L.; Zhou, Y. Cortical function in Alzheimer’s disease and frontotemporal dementia. Transl. Neurosci. 2016, vol. 7(no. 1), 116–125. [Google Scholar] [CrossRef]
- Bashir, S.; et al. Effects of transcranial magnetic stimulation on neurobiological changes in Alzheimer’s disease (Review). Mol. Med. Rep. 2022, vol. 25(no. 4), 1–17. [Google Scholar] [CrossRef]
- Turriziani; Smirni, D.; Zappalà, G.; Mangano, G. R.; Oliveri, M.; Cipolotti, L. Enhancing memory performance with rTMS in healthy subjects and individuals with Mild Cognitive Impairment: the role of the right dorsolateral prefrontal cortex. Front. Hum. Neurosci. 2012, vol. 6, 62. [Google Scholar] [CrossRef]
- Ahmed, M. A.; Darwish, E. S.; Khedr, E. M.; El Serogy, Y. M.; Ali, A. M. Effects of low versus high frequencies of repetitive transcranial magnetic stimulation on cognitive function and cortical excitability in Alzheimer’s dementia. J. Neurol. 2012, vol. 259(no. 1), 83–92. [Google Scholar] [CrossRef]
- National Institute on Aging, “Alzheimer’s Disease Genetics Fact Sheet,” National Institute on Aging. Available online: https://www.nia.nih.gov/health/alzheimers-disease-genetics-fact-sheet (accessed on 25 May 2023).
- Williamson, J.; Goldman, J.; Marder, K. S. Genetic aspects of Alzheimer disease. The Neurologist 2009, vol. 15(no. 2), 80–86. [Google Scholar] [CrossRef]
- Bekris, L. M.; Yu, C.-E.; Bird, T. D.; Tsuang, D. W. Genetics of Alzheimer disease. J. Geriatr. Psychiatry Neurol. 2010, vol. 23(no. 4), 213–227. [Google Scholar] [CrossRef]
- Fortea, J.; Zaman, S. H.; Hartley, S.; Rafii, M. S.; Head, E.; Carmona-Iragui, M. Alzheimer’s disease associated with Down syndrome: a genetic form of dementia. Lancet Neurol. 2021, vol. 20(no. 11), 930–942. [Google Scholar] [CrossRef]
- Alzheimer’s Society’s view on genetic testing | Alzheimer’s Society. Available online: https://www.alzheimers.org.uk/about-us/policy-and-influencing/what-we-think/genetic-testing (accessed on Jul. 03 2023).
- Douaud, et al. Brain Microstructure Reveals Early Abnormalities more than Two Years prior to Clinical Progression from Mild Cognitive Impairment to Alzheimer’s Disease. J. Neurosci. 2013, vol. 33(no. 5), 2147–2155. [Google Scholar] [CrossRef]
- Zandifar, A.; Fonov, V. S.; Ducharme, S.; Belleville, S.; Collins, D. L. Alzheimer’s Disease Neuroimaging Initiative, MRI and cognitive scores complement each other to accurately predict Alzheimer’s dementia 2 to 7 years before clinical onset. NeuroImage Clin. 2020, vol. 25, 102121. [Google Scholar] [CrossRef]
- Choo, H.; Ni, R.; Schöll, M.; Wall, A.; Almkvist, O.; Nordberg, A. Combination of 18F-FDG PET and Cerebrospinal Fluid Biomarkers as a Better Predictor of the Progression to Alzheimer’s Disease in Mild Cognitive Impairment Patients. J. Alzheimers Dis. 2013, vol. 33(no. 4), 929–939. [Google Scholar] [CrossRef]
- Zhang, D.; Wang, Y.; Zhou, L.; Yuan, H.; Shen, D. Multimodal classification of Alzheimer’s disease and mild cognitive impairment. NeuroImage 2011, vol. 55(no. 3), 856–867. [Google Scholar] [CrossRef]
- Yamada, Y.; et al. Combining Multimodal Behavioral Data of Gait, Speech, and Drawing for Classification of Alzheimer’s Disease and Mild Cognitive Impairment. J. Alzheimers Dis. 2021, vol. 84(no. 1), 315–327. [Google Scholar] [CrossRef]
- Roark, B.; Mitchell, M.; Hosom, J.-P.; Hollingshead, K.; Kaye, J. Spoken Language Derived Measures for Detecting Mild Cognitive Impairment. IEEE Trans. Audio Speech Lang. Process. 2011, vol. 19(no. 7), 2081–2090. [Google Scholar] [CrossRef]
- Sun, X.; et al. Biosensors toward behavior detection in diagnosis of alzheimer’s disease. Front. Bioeng. Biotechnol. 2022, vol. 10. Available online: https://www.frontiersin.org/articles/10.3389/fbioe.2022.1031833 (accessed on 24 May 2023). [CrossRef]
- Polikar; Tilley, C.; Hillis, B.; Clark, C. M. Multimodal EEG, MRI and PET data fusion for Alzheimer’s disease diagnosis. 2010 Annu. Int. Conf. IEEE Eng. Med. Biol., Aug. 2010; pp. 6058–6061. [Google Scholar] [CrossRef]
- Calzà, L.; Gagliardi, G.; Rossini Favretti, R.; Tamburini, F. Linguistic features and automatic classifiers for identifying mild cognitive impairment and dementia. Comput. Speech Lang. 2021, vol. 65, 101113. [Google Scholar] [CrossRef]
- Fraser, C.; Lundholm Fors, K.; Eckerström, M.; Öhman, F.; Kokkinakis, D. “Predicting MCI Status From Multimodal Language Data Using Cascaded Classifiers,” Front. Aging Neurosci. 2019, vol. 11. Available online: https://www.frontiersin.org/articles/10.3389/fnagi.2019.00205 (accessed on 24 May 2023).
- Young; Modat, M.; Cardoso, M. J.; Mendelson, A.; Cash, D.; Ourselin, S. Accurate multimodal probabilistic prediction of conversion to Alzheimer’s disease in patients with mild cognitive impairment. NeuroImage Clin. 2013, vol. 2(no. 1), 735–745. [Google Scholar] [CrossRef]
Disclaimer/Publisher’s Note: The statements, opinions and data contained in all publications are solely those of the individual author(s) and contributor(s) and not of MDPI and/or the editor(s). MDPI and/or the editor(s) disclaim responsibility for any injury to people or property resulting from any ideas, methods, instructions or products referred to in the content. |
© 2026 by the authors. Licensee MDPI, Basel, Switzerland. This article is an open access article distributed under the terms and conditions of the Creative Commons Attribution (CC BY) license.
Copyright: This open access article is published under a Creative Commons CC BY 4.0 license, which permit the free download, distribution, and reuse, provided that the author and preprint are cited in any reuse.