
Submitted:
23 September 2026
Posted:
24 September 2026
You are already at the latest version
Abstract
Background: The vitamin D (VD)-hyperuricemia (HUA) association in postmenopausal women (PMW) remains unclear. Our study examined the serum 25(OH)D-HUA association in this high-risk population. Methods: Our study included 7,203 PMW from six NHANES cycles (2007-2018). HUA was defined as serum uric acid (SUA) ≥360 µmol/L, and missing covariates were multiply imputed. Survey-weighted logistic regression (LR), restricted cubic spline (RCS) regression, and stratified analyses were carried out. Results: The weighted HUA prevalence was 22.5%. RCS analysis demonstrated a marked nonlinear, U-shaped association (P for overall=0.005; P for nonlinear=0.002), with the lowest odds at approximately 71 nmol/L and elevated odds at both extremes. In comparison to Q1 (< 56.5 nmol/L), fully adjusted odds ratios (ORs) were 0.79 (95% CI: 0.65-0.97) for Q2 (56.5-78.0 nmol/L) and 0.75 (0.59-0.95) for Q3 (78.0-99.1 nmol/L). The inverse association was confined to women with body mass index (BMI) ≥25 kg/m² and absent in the population with BMI < 25 kg/m² (P for interaction=0.70). Conclusions: In PMW, serum 25(OH)D displayed a U-shaped association with HUA, with the lowest odds at approximately 71 nmol/L; the inverse association was confined to overweight or obese women. Maintaining mid-range rather than high 25(OH)D concentrations may aid HUA prevention. Randomized trials are warranted.
Keywords:
vitamin D
; 25-hydroxyvitamin D
; hyperuricemia
; uric acid
; postmenopausal women
; NHANES
1. Introduction
Hyperuricemia (HUA) is a major public health issue, affecting roughly 21% of adults globally [1]. High serum uric acid (SUA) levels are closely linked to the onset of cardiovascular disease (CVD), chronic kidney disease, gout, and metabolic syndrome [2,3,4]. Postmenopausal women (PMW) face a heightened risk of HUA due to reduced estrogen-mediated uric acid (UA) excretion [5,6], hormonal changes, and age-related declines in renal function [7,8,9].
Vitamin D (VD) is essential in bone metabolism and calcium homeostasis. Nevertheless, its possible extra-skeletal effects have drawn growing attention [10]. Observational studies have reported an inverse relation of serum 25(OH)D to various metabolic disorders: type 2 diabetes [11], hypertension [12], and CVD [13]. Nonetheless, the link between VD and HUA remains debated. Suggested mechanisms connecting VD to UA metabolism include modulation of inflammatory pathways via the vitamin D receptor (VDR) [14], improvement of endothelial function and renal perfusion with enhanced UA excretion [15], and suppression of the renin-angiotensin-aldosterone system [16]. Epidemiological findings, however, are conflicting: some revealed marked inverse associations [17,18], but others detected no meaningful correlation [19].
PMW exhibit distinct metabolic characteristics, and both VD deficiency [7] and elevated UA [20] are more common in this population. Yet few studies have relied on nationally representative data to assess the VD-HUA association specifically in this high-risk group, and even fewer have described its dose-response pattern. We therefore examined the serum 25(OH)D-HUA association among PMW using NHANES 2007-2018, focusing particularly on nonlinear and threshold effects.
2. Materials and Methods
2.1. Study Design and Population
NHANES, a cross-sectional, stratified, multistage probability survey, was carried out by the National Center for Health Statistics (NCHS) under the Centers for Disease Control and Prevention (CDC) [21], offering nationally representative data on the health and nutrition of the U.S. civilian noninstitutionalized population. All protocols gained approval from the NCHS Research Ethics Review Board, with every participant giving informed consent in writing. Six consecutive two-year cycles (2007-2008, 2009-2010, 2011-2012, 2013-2014, 2015-2016, and 2017-2018) were pooled. Eligible participants were women aged ≥20 identified as postmenopausal based on the reproductive health questionnaire; among the 59,842 participants screened across these cycles, 7,888 were classified as postmenopausal; men, pre-/peri-menopausal women, and those with missing menopausal status (n=51,954) were excluded. Participants lacking data on body mass index (BMI), serum 25(OH)D, or SUA (n=685) were excluded thereafter. The final analytic sample consisted of 7,203 PMW. The participant selection flow chart followed the format of a previous NHANES study [22] (Figure 1).
2.2. Exposure Assessment
Serum 25(OH)D (nmol/L) was quantified utilizing the DiaSorin Liaison 25-OH VD total assay at the CDC-NHANES Lipid Satellite Laboratory [21]. 25(OH)D was divided into quartiles according to the weighted distribution of the analytic sample (Q1 <56.5; Q2 56.5-78.0; Q3 78.0-99.1; Q4 ≥99.1 nmol/L).
2.3. Outcome Assessment
HUA was defined as SUA ≥360 µmol/L (≥6.0 mg/dL), the threshold recommended by the American College of Rheumatology for female gout risk [23].
2.4. Covariates
Demographic information (age, education, family poverty-to-income ratio [PIR], marital status, and race/ethnicity), lifestyle factors (drinking, physical activity (PA), and smoking), and medical history (hypertension and diabetes) were collected through standardized questionnaires. BMI was weight (kg) divided by height (m²). Estimated glomerular filtration rate (eGFR) was derived from serum creatinine via the CKD-EPI equation [24].
2.5. Statistical Analysis
The intricate survey design was accounted for in all analyses by using the provided sample weights along with the stratification and clustering information of NHANES [25]. Since a small proportion of participants had missing covariates, multiple imputation by chained equations with random-forest imputation models was employed [26,27]. Odds ratios (ORs) and 95% confidence intervals (CIs) were estimated via survey-weighted multivariable logistic regression (LR), with serum 25(OH)D split into weighted quartiles (Q1 as reference): Model 1 was crude; Model 2 controlled for age, education, marital status, PIR, and race/ethnicity; and Model 3 was additionally adjusted for diabetes, drinking, eGFR, high-density lipoprotein (HDL) cholesterol, hypertension, PA, smoking, and total cholesterol (TC). Because BMI is a strong determinant of both VD status and HUA and may lie on the causal pathway, BMI was not included in the main models. Instead, analyses were stratified by BMI at the cutoff of 25 kg/m², with effect modification assessed through cross-product terms, and a sensitivity model that additionally included BMI was carried out (Supplementary Table S1). Restricted cubic spline (RCS) regression with four knots [28], fitted by weighted maximum likelihood with normalized survey weights, characterized the dose-response relation and tested departure from linearity. A piecewise two-slope model with a grid search was used to further identify a threshold (Supplementary Table S2). Subgroup analyses were conducted within strata of age (<60 vs. ≥60), BMI (<25 vs. ≥25 kg/m²), diabetes, and hypertension, with serum 25(OH)D modeled in weighted quartiles within each stratum (Supplementary Table S3), and interactions were tested using cross-product terms. All analyses were performed with R 4.4.3 (R Foundation for Statistical Computing, Vienna, Austria) [29]. Our tests were two-sided, and P < 0.05 was regarded as statistically significant.
3. Results
3.1. Demographic and Clinical Characteristics
Of the 7,203 included PMW, 1,783 (24.8%) had HUA, which yielded a weighted prevalence of 22.5%. Table 1 presents the baseline characteristics according to HUA status. Women with HUA tended to be older than those with normal SUA (65.4 ± 10.6 vs. 61.8 ± 10.9, P < 0.001), exhibited a greater BMI (32.9 ± 7.8 vs. 28.6 ± 6.6 kg/m², P < 0.001), and showed a higher burden of hypertension (78.2% vs. 51.9%, P < 0.001) and diabetes (33.1% vs. 16.6%, P < 0.001). They also presented with reduced eGFR (68.4 ± 22.4 vs. 83.7 ± 17.7 mL/min/1.73 m², P < 0.001) and lower HDL cholesterol concentrations (1.4 ± 0.4 vs. 1.6 ± 0.5 mmol/L, P < 0.001). No significant difference in serum 25(OH)D was noted across groups (79.0 ± 35.5 vs. 80.4 ± 32.9 nmol/L; P=0.32).
3.2. Nonlinear Dose-Response Analysis
RCS regression showed a notable nonlinear, U-shaped serum 25(OH)D-HUA association (P for overall association=0.005; P for nonlinear=0.002). As presented in Figure 2, the OR was highest at low 25(OH)D concentrations, declined steadily to a nadir at 71.0 nmol/L, and rose again at higher concentrations, exceeding the null above roughly 100 nmol/L, with wide confidence intervals reflecting the small number of participants at high values. A piecewise two-slope analysis yielded consistent findings, placing the turning point at approximately 60 nmol/L; below this level, the odds of HUA decreased as 25(OH)D increased, while above it no association was detected (Supplementary Table S2).
3.3. Association of Serum 25(OH)D with HUA Across Quartiles
Given the nonlinear dose-response relation, serum 25(OH)D was examined categorically in weighted quartiles (Table 2). Compared with Q1 (<56.5 nmol/L), ORs in Model 3 were 0.79 (95% CI: 0.65-0.97) for Q2 (56.5-78.0 nmol/L) and 0.75 (0.59-0.95) for Q3 (78.0-99.1 nmol/L), while the odds in Q4 (≥99.1 nmol/L) were not significantly different (OR=0.83, 95% CI: 0.64-1.08). The lower odds seen in the middle quartiles but not in the highest quartile reflect the U-shaped dose-response curve. Table 2 presents the findings from both the unadjusted model and the model adjusted for demographic characteristics.
3.4. Modification by BMI
To examine modification by adiposity, analyses were stratified by BMI at the cutoff of 25 kg/m² (Table 3). The inverse 25(OH)D-HUA association was evident among women with BMI ≥25 kg/m² (Q2: OR: 0.76, 95% CI: 0.62-0.93; Q3: OR: 0.76, 0.59-0.98 vs. Q1) but was absent among women with BMI <25 kg/m², although the formal interaction was statistically non-significant (P=0.70) and the stratum-specific estimates in normal-weight women were imprecise. In the sensitivity model that additionally adjusted for BMI, the inverse associations for Q2 and Q3 were attenuated toward the null (Supplementary Table S1), supporting the decision to reserve BMI for stratification rather than covariate adjustment. The remaining subgroup analyses, with 25(OH)D modeled in quartiles, are provided in Supplementary Table S3.
4. Discussion
In this nationally representative, cross-sectional study on 7,203 American PMW, serum 25(OH)D exhibited a significant nonlinear, U-shaped association with HUA, with the lowest odds of HUA at approximately 71 nmol/L and elevated odds at both lower and higher concentrations. This pattern remained robust across quartile and spline models and was most evident among overweight or obese women, in whom the inverse association reached statistical significance. To our knowledge, this study is the first to characterize the dose-response relation of the VD-HUA association specifically in PMW using a nationally representative sample, and it suggests that the relevant question may not be whether VD is linearly protective, but where along the range of VD status the balance of benefit and harm lies.
Our findings differ from and extend those of earlier studies importantly. Previous cross-sectional studies in general populations, including Chinese [30,31] and Korean [32,33] adults, generally modeled a linear association between VD and UA and reported inverse relationships, whereas meta-analyses have highlighted substantial heterogeneity across studies [34]. Our study focused on PMW, a high-risk group in whom the estrogen-related enhancement of UA excretion is lost, and both VD deficiency and HUA are common [7,20,35]. It also benefits from the nationally representative, survey-weighted NHANES design and a large analytic sample. More importantly, when the dose-response relationship was examined rather than assumed to be linear, the overall linear association was null, whereas the inverse association was confined to the mid-range of 25(OH)D concentrations and attenuated at both extremes. This nonlinear pattern may help reconcile some of the inconsistent linear estimates reported previously.
Why might both low and high 25(OH)D correlate with higher HUA risk? Serum 25(OH)D is the most widely accepted biomarker of vitamin D status. With a half-life of around 2-3 weeks, it is more stable than the active hormone and reflects VD obtained from both cutaneous synthesis and dietary intake; accordingly, it is a principal VD indicator in nutritional epidemiology [36]. Several interrelated mechanisms may plausibly underlie a urate-lowering role of VD within the insufficient-to-adequate range. First, the active VD hormone acts via VDR expressed in vascular endothelium, renal tubular epithelial cells, and immune cells. VDR signaling suppresses NF-κB-driven transcription of pro-inflammatory cytokines and may attenuate the chronic low-grade inflammatory state associated with HUA and impaired renal urate handling [14,37,38]. Second, 1,25-dihydroxyvitamin D inhibits renin expression and may thereby attenuate renin-angiotensin-aldosterone system activity. Reduced angiotensin II signaling may improve renal perfusion and decrease sodium-dependent urate reabsorption in the proximal tubule, consistent with the mild uricosuric effects observed with pharmacological blockade of this system [15,37]. Third, experimental studies suggest that VDR activation may regulate the expression of renal urate transporters: ABCG2, GLUT9, and URAT1, which contribute to the reabsorption and secretion of urate. The modulation of these transporters could therefore affect urinary urate excretion [14,38]. These mechanisms suggest that renal urate handling may be particularly responsive as VD status improves from insufficient toward adequate levels, whereas the incremental benefit of further increases may diminish once adequate status is reached. The upturn observed at higher concentrations is considered below.
The location of the nadir at approximately 71 nmol/L also has a plausible biological and clinical basis. The Endocrine Society clinical practice guideline classifies 50-75 nmol/L as VD insufficiency and generally considers 75 nmol/L the lower limit of sufficiency [7]. The nadir observed in our study therefore lies just below the conventional sufficiency threshold. Below this level, VD-dependent physiological processes may remain relatively under-supplied, whereas as concentrations approach and enter the sufficient range, VDR-mediated anti-inflammatory and uricosuric pathways may become progressively less responsive to further increases. This pattern of diminishing marginal benefit is consistent with the nonlinear relationship observed in our data and may help explain two apparently paradoxical findings: quartile-specific estimates showed lower odds of HUA in the middle quartiles but not in the highest quartile, whereas conventional linear models fitted across the entire exposure range yielded null results. The upturn of the spline curve at higher concentrations, which is consistent with the J-shaped VD-UA association reported in previous studies [13], should nevertheless be interpreted cautiously because relatively few participants had 25(OH)D concentrations in this range. Residual confounding by lifestyle factors associated with VD supplement use also cannot be excluded.
The apparent modification by adiposity deserves comment, although the formal interaction was statistically non-significant (P=0.70). These analyses should be considered exploratory. The inverse relation was noted only within females with BMI ≥25 kg/m² and absent among normal-weight women, among whom only 226 HUA events occurred, limiting statistical power. After menopause, loss of estrogen may promote visceral fat accumulation. Therefore, obesity is both a driver of HUA and a determinant of low VD availability, making adiposity a plausible modifier of the VD-HUA association in this population [37,38]. Mechanistically, first, VD is lipophilic and may be sequestered in adipose tissue, reducing the bioavailability of circulating 25(OH)D [39]. Second, obesity-related chronic low-grade inflammation may attenuate the anti-inflammatory effects of VD [40]. Third, obesity-related insulin resistance may impair renal UA excretion and potentially offset any urate-lowering effect associated with VD status [18,41]. Because further adjustment for BMI in Model 3 attenuated the quartile associations toward the null (Supplementary Table S1), BMI may capture part of the shared metabolic pathway underlying these associations. The stratified analyses therefore provide additional context for interpreting the observed pattern while avoiding reliance on BMI adjustment alone. We also observed a nominally significant interaction with diabetes (P=0.047, Supplementary Table S3), with the inverse association observed only among women without diabetes. Given the number of interaction tests performed, this finding should nevertheless be deemed exploratory and requires replication before any firm inference can be drawn.
There are several limitations. First, because of the cross-sectional design, causality cannot be established. Second, 25(OH)D and UA were measured at a single time point, and dietary purine intake and other unmeasured confounders could not be fully accounted for. Third, subgroup and interaction analyses were exploratory, and although covariate imputation is a standard approach, it may not fully address missingness that is not at random. Fourth, the standardized 25(OH)D assay changed across survey cycles, which may have introduced measurement heterogeneity. Future studies should include longitudinal cohorts of PMW with repeated measurements and randomized controlled trials of VD supplementation among women with confirmed insufficiency [42], with UA and incident HUA as outcomes.
5. Conclusions
In U.S. PMW, serum 25(OH)D showed a U-shaped association with HUA, with the lowest odds of HUA observed at approximately 71 nmol/L and higher odds at both lower and higher concentrations. The inverse association was observed only among overweight or obese women. These findings suggest that maintaining 25(OH)D within a mid-range of approximately 50-75 nmol/L, rather than maximizing concentrations, may be relevant to HUA prevention in this population. However, the cross-sectional nature of the study does not permit identification of an optimal 25(OH)D target range, which requires confirmation in prospective studies. Randomized controlled trials are needed to establish causality.
Supplementary Materials
The following supporting information can be downloaded at the website of this paper posted on Preprints.org, Supplementary Table S1. Sensitivity Analyses: Fully Adjusted Model With and Without BMI. Supplementary Table S2. Piecewise Two-Slope Threshold Analysis of Serum 25(OH)D and Hyperuricemia. Supplementary Table S3. Subgroup Analyses of the Association Between Serum 25(OH)D and Hyperuricemia.
Author Contributions
Conceptualization, L.W.; methodology, L.W.; software, L.W.; formal analysis, L.W.; data curation, L.W.; visualization, L.W.; writing—original draft preparation, Y.Q. and L.W.; writing—review and editing, Y.Q. and L.W.; supervision, L.W.; project administration, L.W. All authors have read and agreed to the published version of the manuscript.
Funding
This research received no external funding.
Institutional Review Board Statement
The study followed the Declaration of Helsinki and was approved by the NCHS Institutional Review Board (protocol codes 2005-06, 2009-09, 2011-17, 2013-30, 2015-16, and 2017-28 for the 2007-2008 through 2017-2018 cycles, respectively).
Informed Consent Statement
Informed consent was obtained from all subjects.
Data Availability Statement
The utilized NHANES datasets are available at https://www.cdc.gov/nchs/nhanes/. The corresponding author can provide the analytical code upon reasonable request.
Acknowledgments
The authors appreciate NCHS and all NHANES participants for their contributions. This study used publicly available NHANES data. No external funding was received.
Conflicts of Interest
The authors declare no conflict of interest.
Abbreviations
25(OH)D, 25-hydroxyvitamin D; BMI, body mass index; CI, confidence interval; eGFR, estimated glomerular filtration rate; HDL, high-density lipoprotein; HUA, hyperuricemia; NHANES, National Health and Nutrition Examination Survey; OR, odds ratio; PIR, poverty-to-income ratio; RCS, restricted cubic spline; SUA, serum uric acid; VDR, vitamin D receptor.
References
- Chen-Xu, M.; Yokose, C.; Rai, S.K.; Pillinger, M.H.; Choi, H.K. Contemporary Prevalence of Gout and Hyperuricemia in the United States and Decadal Trends: The National Health and Nutrition Examination Survey, 2007-2016. Arthritis Rheumatol. 2019, 71(6), 991–999. [Google Scholar] [CrossRef] [PubMed]
- Feig, D.I.; Kang, D.H.; Johnson, R.J. Uric acid and cardiovascular risk. N Engl. J. Med. 2008, 359(17), 1811–1821. [Google Scholar] [CrossRef] [PubMed]
- Kuo, C.F.; Grainge, M.J.; Zhang, W.; Doherty, M. Global epidemiology of gout: prevalence, incidence and risk factors. Nat. Rev. Rheumatol. 2015, 11(11), 649–662. [Google Scholar] [CrossRef] [PubMed]
- Li, X.; Meng, X.; Timofeeva, M.; Tzoulaki, I.; Tsilidis, K.K.; Ioannidis, J.P.; Campbell, H.; Theodoratou, E. Serum uric acid levels and multiple health outcomes: umbrella review of evidence from observational studies, randomised controlled trials, and Mendelian randomisation studies. BMJ 2017, 357, j2376. [Google Scholar] [CrossRef] [PubMed]
- Jung, J.H.; Song, G.G.; Lee, Y.H.; Kim, J.H.; Hyun, M.H.; Choi, S.J. Serum uric acid levels and hormone therapy type: a retrospective cohort study of postmenopausal women. Menopause 2018, 25(1), 77–81. [Google Scholar] [CrossRef] [PubMed]
- Sumino, H.; Ichikawa, S.; Kanda, T.; Nakamura, T.; Sakamaki, T. Reduction of serum uric acid by hormone replacement therapy in postmenopausal women with hyperuricaemia. Lancet 1999, 354(9179), 650. [Google Scholar] [CrossRef] [PubMed]
- Holick, M.F. Vitamin D deficiency. N Engl. J. Med. 2007, 357(3), 266–281. [Google Scholar] [CrossRef] [PubMed]
- Pittas, A.G.; Lau, J.; Hu, F.B.; Dawson-Hughes, B. The role of vitamin D and calcium in type 2 diabetes. A systematic review and meta-analysis. J. Clin. Endocrinol. Metab. 2007, 92(6), 2017–2029. [Google Scholar] [CrossRef] [PubMed]
- Bhole, V.; de Vera, M.; Rahman, M.M.; Krishnan, E.; Choi, H. Epidemiology of gout in women: Fifty-two-year followup of a prospective cohort. Arthritis Rheum. 2010, 62(4), 1069–1076. [Google Scholar] [CrossRef] [PubMed]
- Forman, J.P.; Giovannucci, E.; Holmes, M.D.; Bischoff-Ferrari, H.A.; Tworoger, S.S.; Willett, W.C.; Curhan, G.C. Plasma 25-hydroxyvitamin D levels and risk of incident hypertension. Hypertension 2007, 49(5), 1063–1069. [Google Scholar] [CrossRef] [PubMed]
- Liu, E.; Meigs, J.B.; Pittas, A.G.; Economos, C.D.; McKeown, N.M.; Booth, S.L.; Jacques, P.F. Predicted 25-hydroxyvitamin D score and incident type 2 diabetes in the Framingham Offspring Study. Am. J. Clin. Nutr. 2010, 91(6), 1627–1633. [Google Scholar] [CrossRef] [PubMed]
- Valer-Martinez, A.; Bes-Rastrollo, M.; Martinez, J.A.; Martinez-Gonzalez, M.A. Sayon-Orea C: Vitamin D and the Risk of Developing Hypertension in the SUN Project: A Prospective Cohort Study. Nutrients 2024, 16(14). [Google Scholar] [CrossRef] [PubMed]
- Dudenkov, D.V.; Mara, K.C.; Maxson, J.A.; Thacher, T.D. Serum 25-hydroxyvitamin D values and risk of incident cardiovascular disease: A population-based retrospective cohort study. J. Steroid Biochem Mol. Biol. 2021, 213, 105953. [Google Scholar] [CrossRef] [PubMed]
- Ao, T.; Kikuta, J.; Ishii, M. The Effects of Vitamin D on Immune System and Inflammatory Diseases. Biomolecules 2021, 11(11). [Google Scholar] [CrossRef] [PubMed]
- Kim, D.H.; Meza, C.A.; Clarke, H.; Kim, J.S.; Hickner, R.C. Vitamin D and Endothelial Function. Nutrients 2020, 12(2). [Google Scholar] [CrossRef] [PubMed]
- Li, Y.C.; Kong, J.; Wei, M.; Chen, Z.F.; Liu, S.Q.; Cao, L.P. 1,25-Dihydroxyvitamin D(3) is a negative endocrine regulator of the renin-angiotensin system. J. Clin. Invest 2002, 110(2), 229–238. [Google Scholar] [CrossRef]
- Zhang, Y.Y.; Qiu, H.B.; Tian, J.W. Association Between Vitamin D and Hyperuricemia Among Adults in the United States. Front Nutr. 2020, 7, 592777. [Google Scholar] [CrossRef] [PubMed]
- Han, Y.; Han, K.; Zhang, Y.; Zeng, X. Serum 25-hydroxyvitamin D might be negatively associated with hyperuricemia in U.S. adults: an analysis of the National Health and Nutrition Examination Survey 2007-2014. J. Endocrinol. Invest 2022, 45(4), 719–729. [Google Scholar] [CrossRef] [PubMed]
- Thakkinstian, A.; Anothaisintawee, T.; Chailurkit, L.; Ratanachaiwong, W.; Yamwong, S.; Sritara, P. Ongphiphadhanakul B: Potential causal associations between vitamin D and uric acid: Bidirectional mediation analysis. Sci. Rep. 2015, 5, 14528. [Google Scholar] [CrossRef] [PubMed]
- Hak, A.E.; Curhan, G.C.; Grodstein, F.; Choi, H.K. Menopause, postmenopausal hormone use and risk of incident gout. Ann. Rheum. Dis. 2010, 69(7), 1305–1309. [Google Scholar] [CrossRef] [PubMed]
- National Center for Health Statistics. National Health and Nutrition Examination Survey (NHANES): Laboratory Procedures Manual; National Center for Health Statistics, 2017. [Google Scholar]
- Zou, H.; Zhao, F.; Lv, X.; Ma, X.; Xie, Y. Development and validation of a new nomogram to screen for MAFLD. Lipids Health Dis. 2022, 21(1), 133. [Google Scholar] [CrossRef] [PubMed]
- Neogi, T.; Jansen, T.L.; Dalbeth, N.; Fransen, J.; Schumacher, H.R.; Berendsen, D.; Brown, M.; Choi, H.; Edwards, N.L.; Janssens, H.J.; et al. 2015 Gout Classification Criteria: an American College of Rheumatology/European League Against Rheumatism collaborative initiative. Arthritis Rheumatol. 2015, 67(10), 2557–2568. [Google Scholar] [CrossRef] [PubMed]
- Levey, A.S.; Stevens, L.A.; Schmid, C.H.; Zhang, Y.L.; Castro, A.F., 3rd; Feldman, H.I.; Kusek, J.W.; Eggers, P.; Van Lente, F.; Greene, T.; et al. A new equation to estimate glomerular filtration rate. Ann. Intern Med. 2009, 150(9), 604–612. [Google Scholar] [CrossRef] [PubMed]
- Lumley T: Analysis of Complex Survey Samples. 2004, 9(8), 1–19. [PubMed]
- van Buuren, S.; Groothuis-Oudshoorn, K. mice: Multivariate Imputation by Chained Equations in R. 2011, 45(3), 1–67. [Google Scholar] [CrossRef]
- Rubin, D.B. Multiple Imputation for Nonresponse in Surveys; John Wiley & Sons, 1987. [Google Scholar]
- Harrell, F.E., Jr. Regression Modeling Strategies: With Applications to Linear Models, Logistic Regression, and Survival Analysis; Springer, 2015. [Google Scholar]
- Team RC: R: A Language and Environment for Statistical Computing; R Foundation for Statistical Computing, 2024.
- Chen, Y.; Cheng, J.; Chen, Y.; Wang, N.; Xia, F.; Chen, C.; Han, B.; Lu, Y. Association between serum vitamin D and uric acid in the eastern Chinese population: a population-based cross-sectional study. BMC Endocr. Disord. 2020, 20(1), 79. [Google Scholar] [CrossRef] [PubMed]
- Li, S.T.; Wang, Y.L.; Ni, F.H.; Sun, T. Association between 25 hydroxyvitamin D and serum uric acid level in the Chinese general population: a cross-sectional study. BMC Endocr. Disord. 2024, 24(1), 187. [Google Scholar] [CrossRef] [PubMed]
- Lee, H.R.; Joo, N.S. Non-Linear Associations Between Serum Vitamin D and Uric Acid in Korean Adults: 2022-2023 KNHANES Data. Nutrients 2025, 17(15). [Google Scholar] [CrossRef] [PubMed]
- Cao, R.; Xu, B.; Wang, Y.; Lu, X.; Qin, X.; Cheng, X.; Sun, G.; Yang, J.; Sun, N.; Sun, G.; et al. Association between vitamin D and serum uric acid in a large Chinese cohort of middle-aged and elderly Chinese men and women. Front Nutr. 2026, 13, 1726451. [Google Scholar] [CrossRef] [PubMed]
- Isnuwardana, R.; Bijukchhe, S.; Thadanipon, K.; Ingsathit, A.; Thakkinstian, A. Association Between Vitamin D and Uric Acid in Adults: A Systematic Review and Meta-Analysis. Horm. Metab. Res. 2020, 52(10), 732–741. [Google Scholar] [CrossRef] [PubMed]
- Cho, S.K.; Winkler, C.A.; Lee, S.J.; Chang, Y.; Ryu, S. The Prevalence of Hyperuricemia Sharply Increases from the Late Menopausal Transition Stage in Middle-Aged Women. J. Clin. Med. 2019, 8(3). [Google Scholar] [CrossRef] [PubMed]
- Zhu, Y.; Pandya, B.J.; Choi, H.K. Prevalence of gout and hyperuricemia in the US general population: the National Health and Nutrition Examination Survey 2007-2008. Arthritis Rheum. 2011, 63(10), 3136–3141. [Google Scholar] [CrossRef] [PubMed]
- Romi, M.M.; Arefian, N.; Wahyu Setyaningsih, W.A.; Perdana Putri, R.G.; Juffrie, M.; Ratna Sari, D.C. Calcitriol Treatment Attenuates Uric Acid-Induced Kidney Injury via Super Oxide Dismutase-1 (SOD-1) Upregulation and Fibrosis Reduction. Iran. BioMed J. 2021, 25(6), 417–425. [Google Scholar] [CrossRef] [PubMed]
- Ruan, R.; Rao, S.; Shao, J.; Wu, D. Vitamin D Ameliorates Hyperuricemia-Induced Kidney Injury by Attenuating Inflammation via the NF-kappaB/NLRP3 Signaling Pathway. Tohoku J. Exp. Med. 2026. [Google Scholar] [CrossRef] [PubMed]
- Wortsman, J.; Matsuoka, L.Y.; Chen, T.C.; Lu, Z.; Holick, M.F. Decreased bioavailability of vitamin D in obesity. Am. J. Clin. Nutr. 2000, 72(3), 690–693. [Google Scholar] [CrossRef] [PubMed]
- Palaniswamy, S.; Gill, D.; De Silva, N.M.; Lowry, E.; Jokelainen, J.; Karhu, T.; Mutt, S.J.; Dehghan, A.; Sliz, E.; Chasman, D.I.; et al. Could vitamin D reduce obesity-associated inflammation? Observational and Mendelian randomization study. Am. J. Clin. Nutr. 2020, 111(5), 1036–1047. [Google Scholar] [CrossRef] [PubMed]
- Xu, Y.; Wang, L.; He, J.; Bi, Y.; Li, M.; Wang, T.; Wang, L.; Jiang, Y.; Dai, M.; Lu, J.; et al. Prevalence and control of diabetes in Chinese adults. Jama 2013, 310(9), 948–959. [Google Scholar] [CrossRef] [PubMed]
- Nimitphong, H.; Saetung, S.; Chailurkit, L.O.; Chanprasertyothin, S. Ongphiphadhanakul B: Vitamin D supplementation is associated with serum uric acid concentration in patients with prediabetes and hyperuricemia. J. Clin. Transl. Endocrinol. 2021, 24, 100255. [Google Scholar] [CrossRef] [PubMed]
Figure 1.
Participant selection flowchart. From 59,842 participants screened across six NHANES cycles (2007-2018), 7,888 PMW were identified based on the reproductive health questionnaire. A total of 51,954 participants were excluded, including men, premenopausal or perimenopausal women, and those with missing menopausal status. An additional 685 women without data regarding BMI, 25(OH)D, or SUA were excluded, leaving 7,203 women for the final analysis. Missing covariate data were handled via multiple imputation (m=5; random forest).
Figure 1.
Participant selection flowchart. From 59,842 participants screened across six NHANES cycles (2007-2018), 7,888 PMW were identified based on the reproductive health questionnaire. A total of 51,954 participants were excluded, including men, premenopausal or perimenopausal women, and those with missing menopausal status. An additional 685 women without data regarding BMI, 25(OH)D, or SUA were excluded, leaving 7,203 women for the final analysis. Missing covariate data were handled via multiple imputation (m=5; random forest).
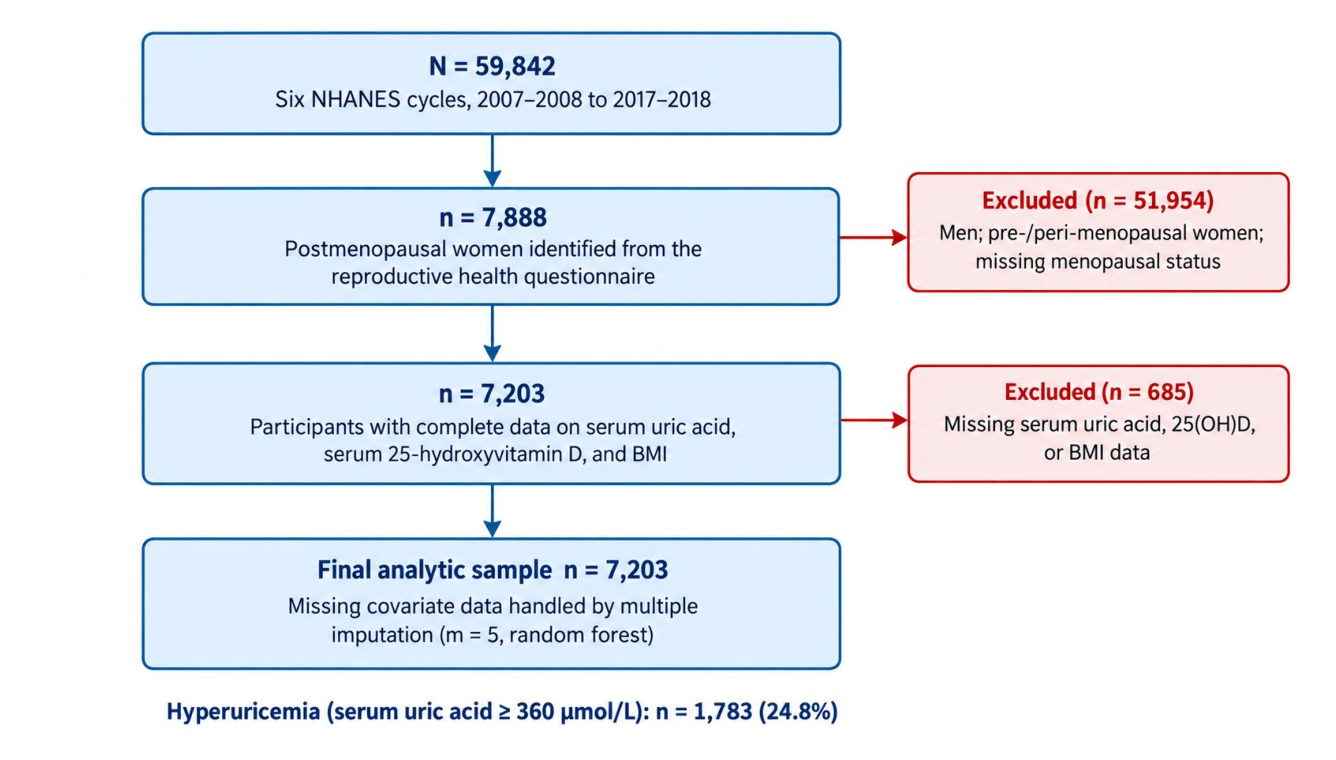
Figure 2.
RCS analysis. The solid line represents ORs and the shaded area represents 95% confidence intervals from a weighted RCS model with four knots; the reference value was set at the sample median (approximately 70 nmol/L), and the histogram shows the distribution of 25(OH)D. The dashed vertical line marks the nadir at 71.0 nmol/L. The model controlled for age, diabetes, drinking, education, eGFR, HDL cholesterol, hypertension, marital status, PA, PIR, race/ethnicity, and smoking. P for overall association=0.005; P for nonlinear=0.002.
Figure 2.
RCS analysis. The solid line represents ORs and the shaded area represents 95% confidence intervals from a weighted RCS model with four knots; the reference value was set at the sample median (approximately 70 nmol/L), and the histogram shows the distribution of 25(OH)D. The dashed vertical line marks the nadir at 71.0 nmol/L. The model controlled for age, diabetes, drinking, education, eGFR, HDL cholesterol, hypertension, marital status, PA, PIR, race/ethnicity, and smoking. P for overall association=0.005; P for nonlinear=0.002.
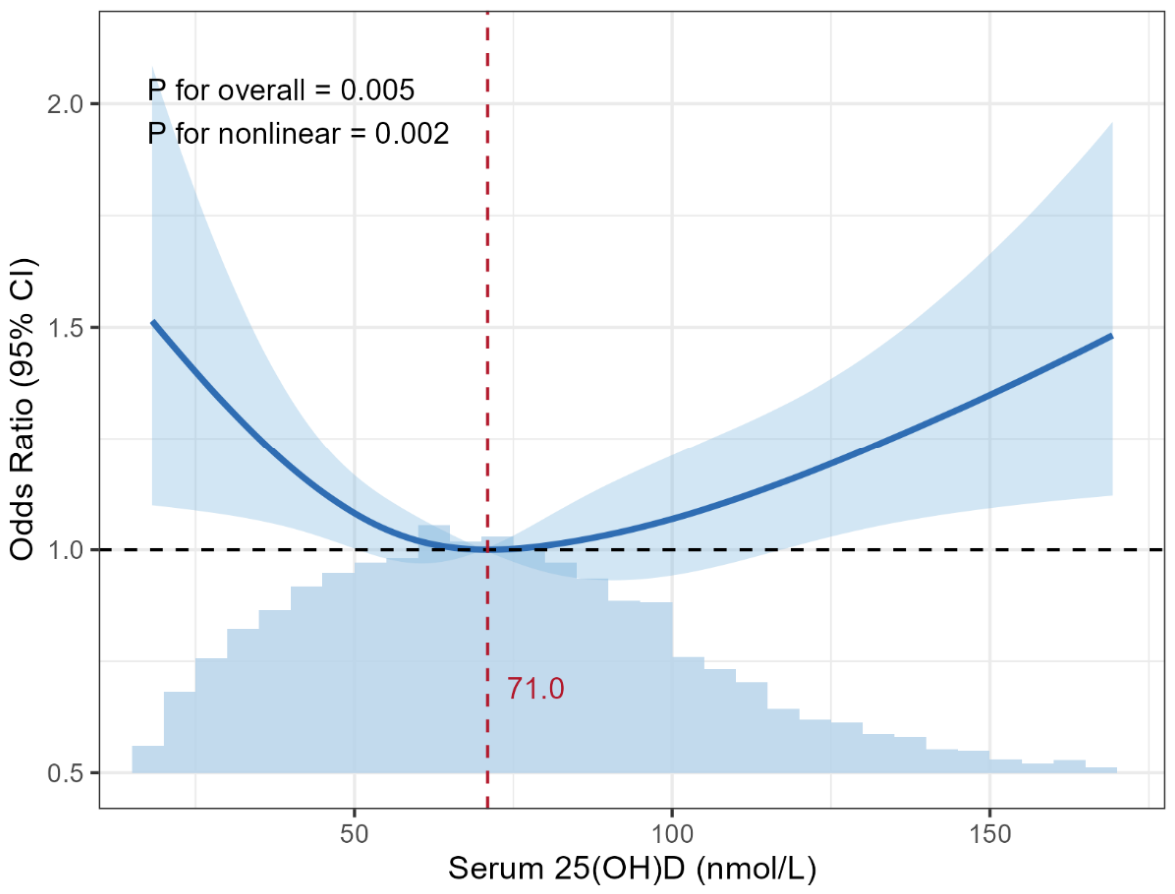

Table 1.
Baseline Characteristics of PMW by HUA Status (NHANES 2007-2018, n=7,203).
| Characteristic | Total (n=7,203) | Non-HUA (n=5,420) | HUA (n=1,783) | P |
|---|---|---|---|---|
| Age, years | 62.6 (10.9) | 61.8 (10.9) | 65.4 (10.6) | <0.001 |
| Race/Ethnicity, % | <0.001 | |||
| Mexican American | 5.0 | 5.3 | 3.7 | |
| Other Hispanic | 4.4 | 4.8 | 3.0 | |
| Non-Hispanic White | 74.9 | 75.7 | 72.4 | |
| Non-Hispanic Black | 9.8 | 8.3 | 15.2 | |
| Other | 5.9 | 5.9 | 5.6 | |
| Education, % | 0.014 | |||
| Less than high school | 16.4 | 16.1 | 17.6 | |
| High school | 25.8 | 25.0 | 28.2 | |
| Above high school | 57.8 | 58.9 | 54.1 | |
| PIR, % | <0.001 | |||
| <1.3 | 20.0 | 18.9 | 23.5 | |
| 1.3-3.5 | 37.5 | 36.7 | 40.6 | |
| ≥3.5 | 42.5 | 44.4 | 35.9 | |
| BMI, kg/m² | 29.6 (7.1) | 28.6 (6.6) | 32.9 (7.8) | <0.001 |
| Current smoking, % | 15.0 | 15.7 | 12.8 | 0.004 |
| Drinking, % | 63.6 | 65.2 | 58.2 | <0.001 |
| Hypertension, % | 57.8 | 51.9 | 78.2 | <0.001 |
| Diabetes, % | 20.3 | 16.6 | 33.1 | <0.001 |
| PA, % | <0.001 | |||
| Inactive | 32.9 | 31.1 | 39.0 | |
| Low | 18.0 | 17.9 | 18.3 | |
| Moderate | 16.0 | 16.4 | 14.4 | |
| High | 33.1 | 34.5 | 28.4 | |
| 25(OH)D, nmol/L | 80.1 (33.5) | 80.4 (32.9) | 79.0 (35.5) | 0.32 |
| eGFR, mL/min/1.73 m² | 80.2 (19.9) | 83.7 (17.7) | 68.4 (22.4) | <0.001 |
| TC, mmol/L | 5.4 (1.1) | 5.4 (1.1) | 5.3 (1.1) | 0.016 |
| HDL cholesterol, mmol/L | 1.6 (0.5) | 1.6 (0.5) | 1.4 (0.4) | <0.001 |
Values are presented as weighted means ± SDs or weighted percentages; group sizes are reported as unweighted counts. Between-group comparisons were made via weighted t-tests for continuous variables, and Rao-Scott χ² tests for categorical ones. eGFR, estimated glomerular filtration rate; HDL, high-density lipoprotein; HUA, hyperuricemia; PIR, poverty-to-income ratio.
Table 2.
ORs for HUA According to VD Quartiles.
| Variable | Model 1 OR (95% CI) | Model 2 OR (95% CI) | Model 3 OR (95% CI) |
|---|---|---|---|
| 25(OH)D quartiles | |||
| Q1 (<56.5 nmol/L) | REF | REF | REF |
| Q2 (56.5-78.0 nmol/L) | 0.727 (0.606-0.872) | 0.760 (0.637-0.908) | 0.792 (0.646-0.970) |
| Q3 (78.0-99.1 nmol/L) | 0.762 (0.624-0.931) | 0.760 (0.610-0.948) | 0.750 (0.592-0.949) |
| Q4 (≥99.1 nmol/L) | 0.856 (0.692-1.060) | 0.818 (0.651-1.028) | 0.834 (0.644-1.080) |
| P for trend | 0.224 | 0.127 | 0.194 |
Model 1, crude; Model 2, adjusted for age, education, marital status, PIR, and race/ethnicity; Model 3, additionally adjusted for diabetes, drinking, eGFR, HDL cholesterol, hypertension, PA, smoking, and TC. BMI was not included in Model 3 because it is a strong determinant of both VD status and HUA and may lie on the causal pathway; a sensitivity model additionally adjusted for BMI is provided in Supplementary Table S1. The weighted 25(OH)D distribution served as the basis for determining the quartile cutoffs. CI, confidence interval; OR, odds ratio; Q, quartile.
Table 3.
Serum 25(OH)D-HUA Association Stratified by BMI (Cutoff 25 kg/m²).
| Variable | BMI <25 kg/m² (n=1,773) OR (95% CI) | BMI ≥25 kg/m² (n=5,430) OR (95% CI) | P for interaction |
|---|---|---|---|
| 25(OH)D quartiles | 0.70 | ||
| Q1 (<56.5 nmol/L) | REF | REF | |
| Q2 (56.5-78.0 nmol/L) | 0.993 (0.566-1.742) | 0.757 (0.616-0.929) | |
| Q3 (78.0-99.1 nmol/L) | 0.785 (0.439-1.404) | 0.762 (0.592-0.981) | |
| Q4 (≥99.1 nmol/L) | 0.769 (0.472-1.254) | 0.892 (0.644-1.236) |
ORs (95% CIs) relative to Q1 from survey-weighted logistic regression within each BMI stratum, controlled for age, diabetes, drinking, education, eGFR, HDL cholesterol, hypertension, marital status, PA, PIR, race/ethnicity, smoking, and TC (BMI omitted within strata). P for interaction was derived from cross-product terms in the full-sample model. Overall, 226 HUA cases occurred in the BMI <25 kg/m² stratum and 1,557 in the BMI ≥25 kg/m² stratum. CI, confidence interval; OR, odds ratio; Q, quartile.
Disclaimer/Publisher’s Note: The statements, opinions and data contained in all publications are solely those of the individual author(s) and contributor(s) and not of MDPI and/or the editor(s). MDPI and/or the editor(s) disclaim responsibility for any injury to people or property resulting from any ideas, methods, instructions or products referred to in the content. |
© 2026 by the authors. Licensee MDPI, Basel, Switzerland. This article is an open access article distributed under the terms and conditions of the Creative Commons Attribution (CC BY) license (http://creativecommons.org/licenses/by/4.0/).
Copyright: This open access article is published under a Creative Commons CC BY 4.0 license, which permit the free download, distribution, and reuse, provided that the author and preprint are cited in any reuse.