
Submitted:
23 September 2026
Posted:
23 September 2026
You are already at the latest version
Abstract
This study examined which technical-tactical indicators are associated with match outcomes in the Bulgarian First Professional Football League. Match-level Wyscout data were analysed for 829 fixtures across three seasons (2022/23–2024/25), with each fixture contributing a single record and indicators expressed as home-minus-away differences per 90 minutes. An ordinal proportional-odds logistic regression predicted the ordered match outcome (loss < draw < win), controlling for opponent strength, corroborated by a Random Forest classifier with permutation importance and SHAP attribution and by a structural equation model with a latent progression construct. A process-only regression was significant (McFadden pseudo-R² = 0.264): penalty-area entries via runs (OR = 1.75), counterattacks (OR = 1.63), interceptions (OR = 1.35), and deep completed passes (OR = 1.30) were positively associated with favourable outcomes, whereas penalty-area entries via crosses (OR = 0.50) and, after adjustment, ball possession (OR = 0.70) were negatively associated; all three corroborating methods converged on this pattern. Adding outcome-proximal indicators (expected goals, shots on target) improved fit (pseudo-R² = 0.354) but reflected outcome proximity rather than antecedent prediction. Match outcomes here are associated with how teams enter the penalty area—carried entries and transitions rather than crosses—rather than with possession dominance, extending the possession paradox in a less-resourced national competition and offering a transferable analytical template for under-studied leagues.
Keywords:
performance analysis
; match outcome
; expected goals
; pressing
; possession paradox
; football
; soccer
; machine learning
; structural equation modelling
1. Introduction
The identification of performance indicators that distinguish successful from unsuccessful teams is a central concern of football performance analysis [1,2,3]. The proliferation of event- and tracking-data providers has enabled increasingly granular quantification of technical and tactical behaviours [4], yet the relative contribution of these indicators to match outcomes remains contested and context-dependent [5,6]. A recurring theme in the literature is the so-called possession paradox: the observation that greater ball possession does not reliably translate into superior results, despite its central place in prevailing tactical philosophies [7].
Much of the existing evidence derives from the wealthiest and most-studied competitions—the English Premier League, La Liga, the Bundesliga, and major international tournaments [6,8,9]. In these contexts, research has converged on the importance of penetrative and transitional actions over undifferentiated possession [10,11]. Multilevel analyses of Premier League matches have shown that counterattacks generate scoring opportunities far more efficiently than elaborate direct attacks [12], while machine-learning analyses increasingly identify the most outcome-relevant indicators across leagues [13,14]. Studies of expected goals (xG) further demonstrate that xG accumulated during a match offers strong post-hoc description of outcomes precisely because it encodes information generated concurrently with the result [15,16].
By contrast, smaller national leagues remain markedly under-represented in the performance-analysis literature, despite their distinct competitive ecologies—lower technical homogeneity, wider quality dispersion between top and bottom clubs, and different stylistic norms [9,17]. This under-representation is not merely an academic gap: clubs, analysts, and league administrators in such competitions must allocate scarce analytical and coaching resources on the basis of evidence generated in structurally different environments, with no guarantee that elite-league findings transfer. Evidence from comparably structured south-eastern European competitions, such as the Greek Super League, suggests that shots on target, counterattacks, and set pieces are key correlates of winning [18], hinting that transition- and penetration-oriented accounts may extend beyond the elite tier [19,20].
A persistent methodological challenge complicates this literature. Many studies analyse team-match records in which both competing teams contribute observations, treating them as independent despite their structural dependence within a fixture—particularly when indicators are expressed as opponent-relative differences, in which case the two records are exact mirror images. This inflates effective sample size and biases inferential statistics. A match-level design, in which each fixture contributes a single observation, resolves this dependence directly.
Against this background, the originality of the present study is threefold rather than residing solely in the novelty of the competitive context. First, it contributes a transferable methodological template for outcome-indicator research: a match-level design that structurally resolves the mirrored-observation problem, combined with an explicit separation of process (tactical) indicators from outcome-proximal indicators (xG, shots on target) that accumulate concurrently with the result. Second, it moves beyond asking whether penetration matters to asking how: by distinguishing the mode of penalty-area entry (carried entries via runs versus deliveries via crosses), it tests whether qualitatively different routes to the same territorial destination carry different outcome value. Third, by triangulating an ordinal regression, a machine-learning ensemble with two attribution methods, and a structural equation model with a latent progression construct, it provides an unusually stringent robustness architecture for a single-league study, yielding evidence that practitioners and decision-makers in resource-constrained leagues can act upon with greater confidence.
The aims were: (i) to identify which process indicators are associated with match outcome after controlling for opponent strength; (ii) to test whether ball possession and pressing intensity (PPDA) function as independent correlates of success; (iii) to examine whether the mode of penalty-area entry (runs versus crosses) differentiates outcome value; and (iv) to corroborate the parametric findings using model-agnostic machine-learning attribution and latent-variable structural modelling. We hypothesised that direct, penetrative progression and transitional efficiency, rather than possession dominance, would be the principal correlates of favourable outcomes in this under-studied competitive context.
2. Materials and Methods
2.1 Data Source and Sample
Match-level event data were obtained from Wyscout (Hudl, Chicago, IL, USA) for all fixtures of the Bulgarian First Professional Football League across three complete competitive seasons (2022/23, 2023/24, and 2024/25). Wyscout is a widely used provider of professional football event data and has featured extensively in peer-reviewed performance analysis research [4], supporting both descriptive indicators and advanced spatial metrics [21]. Data were exported as team-level match statistics comprising technical and tactical performance indicators for both competing teams in each fixture.
The initial export contained team-match records for both clubs in every fixture. Because each fixture generates two mirrored team-level records, retaining both would violate the assumption of independence: the two records originating from a single match are not independent but are structurally linked through the shared match context. To address this, the data were restructured to the match level, such that each fixture contributed a single observation. Records were deduplicated on the combination of fixture identifier, date, and team, and the incomplete ongoing season was excluded. The final analytical sample comprised 829 matches (2022/23, n = 272; 2023/24, n = 268; 2024/25, n = 289), involving 18 distinct clubs across the three seasons.
2.2 Performance Indicators and Normalisation
Each fixture was characterised by a set of technical-tactical performance indicators. Because matches varied in effective playing duration, all volume-based count indicators (shots, shots on target, expected goals, positional attacks, counterattacks, set pieces, crosses, deep completed passes, penalty-area entries, touches in the box, interceptions, passes to the final third, and progressive passes) were normalised to a per-90-minute basis prior to analysis. Rate- and ratio-based indicators (ball possession percentage, passes per defensive action [PPDA], match tempo, and average shot distance) were retained in their native units, being inherently independent of match duration.
Performance indicators were conceptually grouped into two categories. Process (tactical) indicators describe controllable aspects of team play and comprise possession, PPDA, passes to the final third, deep completed passes, penalty-area entries disaggregated by mode (via runs and via crosses), progressive passes, crosses, interceptions, counterattacks, and match tempo. Outcome-proximal indicators comprise expected goals and shots on target. The latter were treated separately and explicitly, because they accumulate concurrently with the match outcome and are therefore descriptors associated with the result rather than antecedent predictors of it.
2.3 Outcome Variable and Predictor Construction
The dependent variable was the match outcome expressed from the home team’s perspective as an ordered three-level categorical variable: loss (L), draw (D), or win (W). This ordinal specification preserves the full information contained in the result, including the substantial proportion of drawn matches that a dichotomous win/non-win formulation would discard.
For each fixture, every performance indicator was expressed as the difference between the home and away team values (home minus away). This opponent-relative differencing captures the relative balance of play within each match while ensuring that each indicator contributes exactly once per fixture, thereby preserving independence of observations at the match level. To control for differences in team quality, an opponent-strength differential was constructed as the difference between the home and away teams’ final league points totals for the corresponding season. Match location was inherently controlled through the home-referenced outcome specification.
2.4 Statistical Analysis
Prior to modelling, multicollinearity among the candidate process predictors was assessed using the variance inflation factor (VIF), applying a conservative iterative procedure: at each step the indicator with the highest VIF exceeding 5 was removed and VIFs were recomputed, with the focal indicators (possession, PPDA) and the opponent-strength control retained a priori. This procedure excluded total crosses (VIF = 11.7) and passes to the final third (VIF = 6.6); all retained predictors exhibited acceptable values (VIF ≤ 4.4). All retained predictors were standardised (z-scores) prior to regression, so that odds ratios are expressed per one standard-deviation increase and are directly comparable in magnitude.
The primary inferential model was an ordinal (proportional-odds) logistic regression predicting the ordered match outcome. Two nested models were estimated: Model 1 included only process indicators with the opponent-strength control; Model 2 additionally incorporated the outcome-proximal indicators. The incremental contribution of the outcome-proximal indicators was evaluated using a likelihood-ratio test, and model fit summarised using McFadden’s pseudo-R2. Odds ratios and 95% confidence intervals were reported for all predictors. The proportional-odds (parallel-lines) assumption was verified using a Brant-type test comparing coefficient estimates across the two cumulative cut points; no predictor violated the assumption (all p > 0.45).
To complement the parametric model and rank predictors without distributional assumptions, a Random Forest classifier [22,23] (500 trees, balanced class weights) was trained on the process indicators. Predictive performance was evaluated through 10-fold stratified cross-validation (classification accuracy and macro-averaged F1). Predictor importance was quantified using both permutation importance (mean decrease in macro-F1 over 50 permutations on a held-out test set) and SHapley Additive exPlanations (SHAP [24,25]), an approach increasingly applied to team-level performance attribution in football [26] and to feature-selection tasks more broadly [27].
2.5 Structural Equation Modelling
As an additional robustness analysis, a structural equation model (SEM) was specified to examine whether the regression findings persisted when vertical progression was represented as a latent construct rather than as separate observed indicators. A latent Progression factor was measured by deep completed passes, penalty-area entries via runs, and progressive passes; counterattacks, interceptions, possession, PPDA, penalty-area entries via crosses, and the opponent-strength control entered the structural equation as observed predictors, with all exogenous covariances freely estimated. The match outcome was declared ordinal and the model was estimated with diagonally weighted least squares (DWLS) on the polychoric/polyserial correlation matrix, the recommended estimator for ordered-categorical endogenous variables. Analyses used the semopy library [28]. Because SEM assumes linear structural relations and its fit indices are sensitive to the sparse measurement structure available at the match level, the SEM was designated a priori as corroborative, with the ordinal regression retained as the primary inferential model. VIF thresholds followed established multivariate guidance [29], and effect-size interpretation followed Cohen [30]. All analyses were conducted in Python 3.11 (statsmodels, scikit-learn, SHAP, and semopy libraries); statistical significance was set at α = 0.05.
Generative AI use in the preparation of this manuscript is disclosed in the Acknowledgments section, in accordance with journal policy.
3. Results
3.1 Descriptive Overview
Across the 829 analysed matches, the home team won 379 (45.7%), drew 186 (22.4%), and lost 264 (31.8%), confirming a pronounced home advantage. Examination of mean home-minus-away differences across outcome categories revealed a consistent gradient for the outcome-proximal indicators: home wins were associated with positive expected-goals and shots-on-target differentials (xG diff = +0.80 per 90; SOT diff = +2.63 per 90), whereas home losses corresponded to negative differentials (xG diff = −0.62; SOT diff = −1.87). Ball-possession differentials were positive across all outcome categories, including drawn and lost matches, providing an initial indication that possession superiority alone did not distinguish winning from non-winning performances. A clear gradient was also visible in the mode of penalty-area entry: entries via runs strongly favoured winning teams (+1.84 vs. −1.13 per 90), whereas entries via crosses did not (Table 1).
3.2 Multicollinearity Assessment
The iterative VIF screening excluded total crosses (VIF = 11.7), which was near-collinear with penalty-area entries via crosses, and passes to the final third (VIF = 6.6), which overlapped substantially with the remaining progression indicators. All retained predictors exhibited acceptable multicollinearity (VIF ≤ 4.4), with counterattacks showing the lowest value (VIF = 1.11).
3.3 Ordinal Logistic Regression
Model 1 (process indicators only) was statistically significant (McFadden pseudo-R2 = 0.264; likelihood-ratio p < 0.001). The strongest positive associations with a more favourable outcome were penalty-area entries via runs (OR = 1.75, 95% CI 1.34–2.29), counterattacks (OR = 1.63, 95% CI 1.38–1.94), interceptions (OR = 1.35, 95% CI 1.09–1.67), and deep completed passes (OR = 1.30, 95% CI 1.04–1.63), alongside the opponent-strength control (OR = 4.48, 95% CI 3.54–5.68). In sharp contrast, penalty-area entries via crosses were negatively associated with favourable outcomes (OR = 0.50, 95% CI 0.40–0.63, p < 0.001): holding the remaining indicators constant, a cross-dominant entry profile characterised inferior results. After adjustment, ball possession was likewise negatively associated with outcome (OR = 0.70, 95% CI 0.51–0.98, p = 0.037), indicating that possession superiority beyond what is expressed through penetrative actions carried no benefit and, if anything, characterised less successful performances. The PPDA differential showed a negative coefficient (OR = 0.65, 95% CI 0.48–0.89, p = 0.006), consistent with more intense pressing (lower PPDA) accompanying better outcomes, although—as reported below—this association was not corroborated by the machine-learning attribution or the SEM and is therefore interpreted with caution. Progressive passes and match tempo showed no independent association (Table 2).
Model 2 (process plus outcome-proximal indicators) substantially improved fit (McFadden pseudo-R2 = 0.354), and the likelihood-ratio test confirmed the incremental contribution of the outcome-proximal indicators (2²(2) = 157.2, p < 0.001). Shots on target (OR = 2.70, 95% CI 2.03–3.60) and expected goals (OR = 2.35, 95% CI 1.75–3.17) were the dominant correlates. This dominance reflects the outcome-proximal nature of these indicators—they accumulate concurrently with the result—rather than antecedent predictive capacity; they are therefore reported as descriptive correlates rather than tactical determinants. The direction of all process-indicator associations remained stable across both models, with penalty-area entries via runs attenuating towards the null once shot-based indicators absorbed the variance they generate (Table 2).
3.4 Random Forest Classification and Predictor Importance
Trained on the process indicators alone, the Random Forest classifier achieved a 10-fold cross-validated accuracy of 0.621 ± 0.028—substantially exceeding the majority-class baseline of 0.457—and a macro-averaged F1 of 0.504 ± 0.032, indicating meaningful discriminative capacity for a three-class outcome derived solely from tactical process variables.
Permutation importance and SHAP attribution produced convergent rankings (Figure 1). Beyond the opponent-strength control, which dominated both attributions, the most influential process indicators were counterattacks, interceptions, and the two penalty-area entry modes, with deep completed passes contributing additionally in the SHAP attribution. In direct agreement with the machine-learning perspective on the regression findings, possession, PPDA, and match tempo exhibited negligible—in the case of possession, marginally negative—permutation importance, indicating no reliable discriminative information regarding match outcome. Because SHAP magnitudes are direction-agnostic, the sign of each association is taken from the regression model; notably, penalty-area entries via crosses ranked among the more influential indicators in both attribution methods while carrying a negative association in the regression, reinforcing that crossing-based entry is informative precisely as a marker of less successful performance profiles. The forest plot of adjusted odds ratios is presented in Figure 2.
3.5 Structural Equation Modelling
The SEM converged with acceptable comparative fit (χ2(20) = 259.2, p < 0.001; CFI = 0.959; GFI = 0.956; TLI = 0.896), although the RMSEA (0.120) exceeded conventional thresholds, as expected given the sparse match-level measurement structure and the DWLS estimator’s sensitivity to model parsimony. The latent Progression factor was well identified (standardised loadings: deep completed passes = 0.76, progressive passes = 0.77, penalty-area entries via runs = 0.39). The structural paths corroborated the regression pattern in both direction and relative magnitude: Progression (β = 1.03, p < 0.001), interceptions (β = 0.27, p < 0.001), counterattacks (β = 0.14, p < 0.001), and opponent strength (β = 0.35, p < 0.001) were positively associated with the ordinal outcome, whereas possession (β = −0.55, p < 0.001) and penalty-area entries via crosses (β = −0.34, p < 0.001) were negatively associated. The PPDA path was non-significant (β = −0.004, p = 0.944), reinforcing the cautious interpretation of the pressing coefficient from the regression. The standardised Progression coefficient marginally exceeding unity reflects a statistical suppression effect arising from the strong negative covariance between latent progression and residualised possession; together with the elevated RMSEA, this supports the a priori designation of the ordinal regression—which screens collinearity explicitly—as the primary inferential model, with the SEM serving as directional corroboration.
4. Discussion
The present study examined which technical-tactical performance indicators are associated with match outcomes in the Bulgarian First Professional Football League, using a match-level design across three complete seasons. The central finding is that outcomes in this league are associated not merely with whether teams progress towards goal, but with how: penalty-area entries achieved by carrying the ball (runs), counterattacks, interceptions, and deep completed passes were positively associated with favourable outcomes, whereas entries generated by crosses—and, after adjustment, ball possession itself—were negatively associated. This pattern was directionally consistent across a parametric ordinal model, a non-parametric ensemble with two attribution methods, and a latent-variable structural model.
4.1 Beyond the Possession Paradox
The results extend the possession paradox documented in elite European football [6,7] in a notable direction. Whereas the paradox is usually expressed as the absence of a reliable possession–success association, the adjusted estimates here indicate a significantly negative one: once penetrative and transitional actions were accounted for, each additional standard deviation of possession differential was associated with lower odds of a favourable outcome (OR = 0.70), a pattern replicated in the SEM (β = −0.55) and mirrored by the negligible-to-negative permutation importance of possession in the Random Forest. The result does not imply that having the ball is harmful; rather, possession superiority beyond what is converted into penetration characterises teams that circulate without progressing [31]—a profile that, in this league, belongs disproportionately to teams that fail to win. Game-state dynamics plausibly contribute, as teams protecting a deficit concede possession while defending a favourable result; the observational design cannot separate these mechanisms, and the finding should be read as descriptive of match profiles rather than as tactical advice against possession.
The evidence on pressing intensity was mixed and is presented as such. The PPDA differential carried a significant coefficient in the expected direction in the ordinal regression (more intense relative pressing accompanying better outcomes), but the association was not corroborated by the machine-learning attribution and was absent in the SEM. A parsimonious reading is that aggregate match-level PPDA is at best a weak and unstable marker, and that the outcome-relevant defensive behaviour is the concrete product of defensive activity—ball recoveries through interceptions, which were significant and stable across all three analytical approaches.
4.2 The Mode of Penetration: Runs versus Crosses
The sharpest substantive finding concerns the mode of penalty-area entry. Entries achieved via runs—carrying the ball into the box—were the strongest positive process correlate (OR = 1.75), whereas entries via crosses were strongly negative (OR = 0.50). Both routes deliver the ball to the same territorial destination, yet they carried opposite outcome value. This asymmetry is consistent with possession-value frameworks in which carries into central penalty-area zones generate higher-quality opportunities than aerial deliveries contested under defensive numerical superiority, and with evidence that crossing volume is often a marker of attacking sterility rather than effectiveness. It also aligns with the transition-oriented account: counterattacks (OR = 1.63) and interceptions (OR = 1.35) reward teams that attack disorganised defences, conditions under which carried entries are most available. The convergence with multilevel Premier League evidence on the efficiency of counterattacks [12] and with Norwegian evidence linking penetrative tactics to goal scoring [10,11] suggests that the primacy of direct, carried penetration generalises to leagues of differing technical level, echoing findings from the structurally comparable Greek Super League [8,18,19,20].
4.3 Outcome-Proximal Indicators
When expected goals and shots on target were added (Model 2), model fit improved substantially and these indicators dominated. We interpret this with caution. Because xG and shots on target accumulate concurrently with the result, their strong association reflects outcome proximity rather than antecedent predictive capacity; they describe the result more than they explain how it was produced. This is consistent with recent Bundesliga work showing that post-match xG yields the strongest match-outcome classification precisely because it encodes information generated during the match itself [16]. The attenuation of penalty-area entries via runs in Model 2 is instructive: carried entries are outcome-relevant primarily through the shots they generate, so their independent coefficient shrinks once shot-based indicators absorb that variance. By separating process from outcome-proximal indicators, the present design clarifies that the practically actionable signal lies in the process indicators.
4.4 Limitations
Several limitations should be acknowledged. First, although the match-level design ensures independence at the fixture level, individual clubs contribute multiple matches across seasons; residual clustering at the club level was not explicitly modelled, and future work could employ mixed-effects specifications with club-level random effects. Second, the analysis is observational, and the reported associations should not be interpreted causally; performance indicators interact dynamically with match status and game state, which were not modelled. Third, the opponent-strength control was derived from final league standings, which necessarily incorporate the outcomes of the analysed fixtures themselves; this end-of-season referent may modestly inflate the opponent-strength association, although it does not affect the process-indicator contrasts of primary interest. Fourth, the SEM was constrained by the sparse measurement structure available at the match level, reflected in an elevated RMSEA and a suppression-inflated latent coefficient; its role is accordingly corroborative. Fifth, certain contextual factors—scoreline effects, in-match red cards, and within-season form trajectories—were not incorporated and represent avenues for refinement. Finally, the findings pertain to a single national league over three seasons and should be generalised only with appropriate caution.
4.5 Practical Implications
For practitioners and decision-makers in the Bulgarian First League and comparable competitions, the results carry a differentiated message. Attacking priorities should favour mechanisms that deliver the ball into the penalty area on the ground and in motion—carried entries, deep completions, and rapid transitions following recoveries—over crossing volume, which characterised inferior outcome profiles even at identical territorial penetration. Defensively, ball recovery through interceptions, rather than aggregate pressing intensity, appears to be the outcome-relevant behaviour. For performance departments operating under resource constraints, the process/outcome-proximal distinction offers a practical monitoring principle: xG and shots on target describe results after the fact, whereas entry mode, transition frequency, and recovery activity constitute controllable levers that can be trained, scouted, and tracked prospectively. These insights may inform training emphasis, recruitment profiling, and match-strategy design, while recognising that the optimal balance of tactical priorities remains context-dependent.
5. Conclusions
Using a match-level design across three complete seasons, this study found that match outcomes in the Bulgarian First Professional Football League are associated principally with the mode and directness of progression—penalty-area entries via runs, counterattacks, deep completions, and defensive ball recovery through interceptions—whereas entries via crosses and adjusted ball possession were negatively associated with success, and pressing intensity showed no robust independent association. The convergence of parametric regression, model-agnostic machine-learning attribution, and latent-variable structural modelling strengthens confidence in this pattern, which extends and sharpens the possession paradox in a less-resourced national league. For practitioners, the findings highlight the outcome relevance of carried penetration and transition over possession share and crossing volume, while the methodological framework—the match-level resolution of observational dependence, the explicit separation of process from outcome-proximal indicators, and the multi-method robustness architecture—offers a template for rigorous performance analysis in under-studied competitive contexts.
Supplementary Materials
The supporting information can be downloaded at the website of this paper posted on Preprints.org. Table S1: Full variance inflation factor (VIF) values for all candidate process predictors, before and after iterative exclusion (Section 2.4/3.2); Table S2: Complete structural equation model paths, unstandardised and standardised estimates, and p-values (Section 3.5); Table S3: Complete structural equation model fit indices (Section 3.5); analysis code (Python) reproducing the data preparation, ordinal regression, Random Forest/SHAP, and structural equation model reported in the manuscript, together with a README file describing reproduction steps.
Author Contributions
Conceptualization, D.I. and G.G.; methodology, D.I.; software, D.I.; validation, D.I. and G.G.; formal analysis, D.I.; investigation, D.I. and G.G.; resources, D.I.; data curation, D.I.; writing—original draft preparation, D.I.; writing—review and editing, D.I. and G.G.; visualization, D.I.; supervision, D.I.; project administration, D.I. All authors have read and agreed to the published version of the manuscript.
Funding
This research received no external funding.
Institutional Review Board Statement
Not applicable. This study used only publicly reported, non-personal team-level match performance data and did not involve human participants, biological samples, or identifiable personal data.
Informed Consent Statement
Not applicable.
Data Availability Statement
The data that support the findings of this study are available from Wyscout (Hudl). Restrictions apply to the availability of these data, which were used under licence for the present study. Data are available from the authors upon reasonable request and with the permission of Wyscout.
Acknowledgments
During the preparation of this manuscript/study, the authors used Claude (Anthropic) for the purposes of statistical analysis code development, data processing, and language editing. The authors have reviewed and edited the output and take full responsibility for the content of this publication.
Conflicts of Interest
The authors declare no conflict of interest.
References
- Hughes, M.; Bartlett, R. The use of performance indicators in performance analysis. J. Sports Sci. 2002, 20, 739–754. [Google Scholar] [CrossRef] [PubMed]
- Mackenzie, R.; Cushion, C. Performance analysis in football: A critical review and implications for future research. J. Sports Sci. 2013, 31, 639–676. [Google Scholar] [CrossRef] [PubMed]
- Sarmento, H.; Marcelino, R.; Anguera, M.T.; Campaniço, J.; Matos, N.; Leitão, J.C. Match analysis in football: A systematic review. J. Sports Sci. 2014, 32, 1831–1843. [Google Scholar] [CrossRef] [PubMed]
- Pappalardo, L.; Cintia, P.; Rossi, A.; Massucco, E.; Ferragina, P.; Pedreschi, D.; Giannotti, F. A public data set of spatio-temporal match events in soccer competitions. Sci. Data 2019, 6, 236. [Google Scholar] [CrossRef] [PubMed]
- Lago-Peñas, C.; Lago-Ballesteros, J.; Dellal, A.; Gómez, M. Game-related statistics that discriminated winning, drawing and losing teams from the Spanish soccer league. J. Sports Sci. Med. 2010, 9, 288–293. [Google Scholar] [PubMed]
- Liu, H.; Gómez, M.A.; Lago-Peñas, C.; Sampaio, J. Match statistics related to winning in the group stage of 2014 Brazil FIFA World Cup. J. Sports Sci. 2015, 33, 1205–1213. [Google Scholar] [CrossRef] [PubMed]
- Collet, C. The possession game? A comparative analysis of ball retention and team success in European and international football, 2007–J. Sports Sci. 2013, 31, 123–136. [Google Scholar] [CrossRef] [PubMed]
- Gómez, M.A.; Mitrotasios, M.; Armatas, V.; Lago-Peñas, C. Analysis of playing styles according to team quality and match location in Greek professional soccer. Int. J. Perform. Anal. Sport 2018, 18, 986–1001. [Google Scholar] [CrossRef]
- Castellano, J.; Casamichana, D.; Lago, C. The use of match statistics that discriminate between successful and unsuccessful soccer teams. J. Hum. Kinet. 2012, 31, 139–147. [Google Scholar] [CrossRef] [PubMed]
- Tenga, A.; Holme, I.; Ronglan, L.T.; Bahr, R. Effect of playing tactics on goal scoring in Norwegian professional soccer. J. Sports Sci. 2010, 28, 237–244. [Google Scholar] [CrossRef] [PubMed]
- Tenga, A.; Holme, I.; Ronglan, L.T.; Bahr, R. Effect of playing tactics on achieving score-box possessions in a random series of team possessions from Norwegian professional soccer matches. J. Sports Sci. 2010, 28, 245–255. [Google Scholar] [CrossRef] [PubMed]
- González-Ródenas, J.; Aranda-Malavés, R.; Tudela-Desantes, A.; Calabuig Moreno, F.; Casal, C.A.; Aranda, R. Effect of match location, team ranking, match status and tactical dimensions on the offensive performance in Spanish ‘La Liga’ soccer matches. Front. Psychol. 2020, 10, 2089. [Google Scholar] [CrossRef] [PubMed]
- Bunker, R.; Susnjak, T. The application of machine learning techniques for predicting match results in team sport: A review. J. Artif. Intell. Res. 2022, 73, 1285–1322. [Google Scholar] [CrossRef]
- Hassard, S.; Kerr, W. Machine learning approaches to performance indicator identification in professional football; Ulster University, 2024. [Google Scholar]
- Bergius, N. Match Event Factors That Influence Goalscoring in Football: An Empirical Analysis on Traditional Match Event Statistics and Advanced Metrics within the English Premier League. Master’s Thesis, Aalto University School of Business, 2025. [Google Scholar]
- Forcher, L.; Forcher, L.; Altmann, S.; Jekauc, D.; Kempe, M. Is a machine learning model the future of soccer match outcome prediction? Comparing pre-match and post-match expected goals metrics. Front. Sports Act. Living 2025, 7, 1713852. [Google Scholar] [PubMed]
- Plakias, S.; Moustakidis, S.; Mitrotasios, M.; Kokkotis, C.; Tsatalas, T.; Papalexi, M.; Giakas, G.; Tsaopoulos, D. Analysis of playing styles in European football: Insights from a visual mapping approach. J. Phys. Educ. Sport 2023, 23, 1385–1393. [Google Scholar]
- Stafylidis, A.; Mandroukas, A.; Michailidis, Y.; Vardakis, L.; Metaxas, I.; Kyranoudis, A.E.; Metaxas, T.I. Key performance indicators predictive of success in soccer: A comprehensive analysis of the Greek soccer league. J. Funct. Morphol. Kinesiol. 2024, 9, 107. [Google Scholar] [CrossRef] [PubMed]
- Plakias, S.; Tsatalas, T.; Armatas, V.; Tsaopoulos, D.; Giakas, G. Tactical situations and playing styles as key performance indicators in soccer. J. Funct. Morphol. Kinesiol. 2024, 9, 88. [Google Scholar] [CrossRef] [PubMed]
- Plakias, S.; Armatas, V.; Mitrotasios, M. Influence of tactics and situational variables on goal scoring in European football. Proc. Inst. Mech. Eng. Part P J. Sports Eng. Technol., 2025, in press. [Google Scholar]
- Fernández, J.; Bornn, L. Wide Open Spaces: A statistical technique for measuring space creation in professional soccer. In Proceedings of the MIT Sloan Sports Analytics Conference, Boston, MA, USA, 2018. [Google Scholar]
- Breiman, L. Random forests. Mach. Learn. 2001, 45, 5–32. [Google Scholar] [CrossRef]
- Pedregosa, F.; Varoquaux, G.; Gramfort, A.; Michel, V.; Thirion, B.; Grisel, O.; Blondel, M.; Prettenhofer, P.; Weiss, R.; Dubourg, V.; et al. Scikit-learn: Machine learning in Python. J. Mach. Learn. Res. 2011, 12, 2825–2830. [Google Scholar]
- Lundberg, S.M.; Lee, S.I. A unified approach to interpreting model predictions. Adv. Neural Inf. Process. Syst. 2017, 30, 4765–4774. [Google Scholar]
- Lundberg, S.M.; Erion, G.; Chen, H.; DeGrave, A.; Prutkin, J.M.; Nair, B.; Katz, R.; Himmelfarb, J.; Bansal, N.; Lee, S.I. From local explanations to global understanding with explainable AI for trees. Nat. Mach. Intell. 2020, 2, 56–67. [Google Scholar] [CrossRef] [PubMed]
- Moustakidis, S.; Plakias, S.; Kokkotis, C.; Tsatalas, T.; Tsaopoulos, D. Predicting football team performance with explainable AI: Leveraging SHAP to identify key team-level performance metrics. Future Internet 2023, 15, 174. [Google Scholar] [CrossRef]
- Marcílio, W.E.; Eler, D.M. From explanations to feature selection: Assessing SHAP values as feature selection mechanism. In Proceedings of the 33rd Conference on Graphics, Patterns and Images (SIBGRAPI), Porto de Galinhas, Brazil, 2020; pp. 340–347. [Google Scholar]
- Igolkina, A.A.; Meshcheryakov, G. semopy: A Python package for structural equation modeling. Struct. Equ. Model. 2020, 27, 952–963. [Google Scholar] [CrossRef]
- Hair, J.F.; Black, W.C.; Babin, B.J.; Anderson, R.E. Multivariate Data Analysis, 8th ed.; Cengage: Boston, MA, USA, 2019. [Google Scholar]
- Cohen, J. Statistical Power Analysis for the Behavioral Sciences, 2nd ed.; Lawrence Erlbaum Associates: Hillsdale, NJ, USA, 1988. [Google Scholar]
- Lago-Ballesteros, J.; Lago-Peñas, C.; Rey, E. The effect of playing tactics and situational variables on achieving score-box possessions in a professional soccer team. J. Sports Sci. 2012, 30, 1455–1461. [Google Scholar] [CrossRef] [PubMed]
Figure 1.
Predictor importance from the Random Forest classifier: (a) permutation importance (mean decrease in macro-F1 over 50 permutations on a held-out test set; error bars denote SD); (b) mean absolute SHAP value for the home-win class.
Figure 1.
Predictor importance from the Random Forest classifier: (a) permutation importance (mean decrease in macro-F1 over 50 permutations on a held-out test set; error bars denote SD); (b) mean absolute SHAP value for the home-win class.
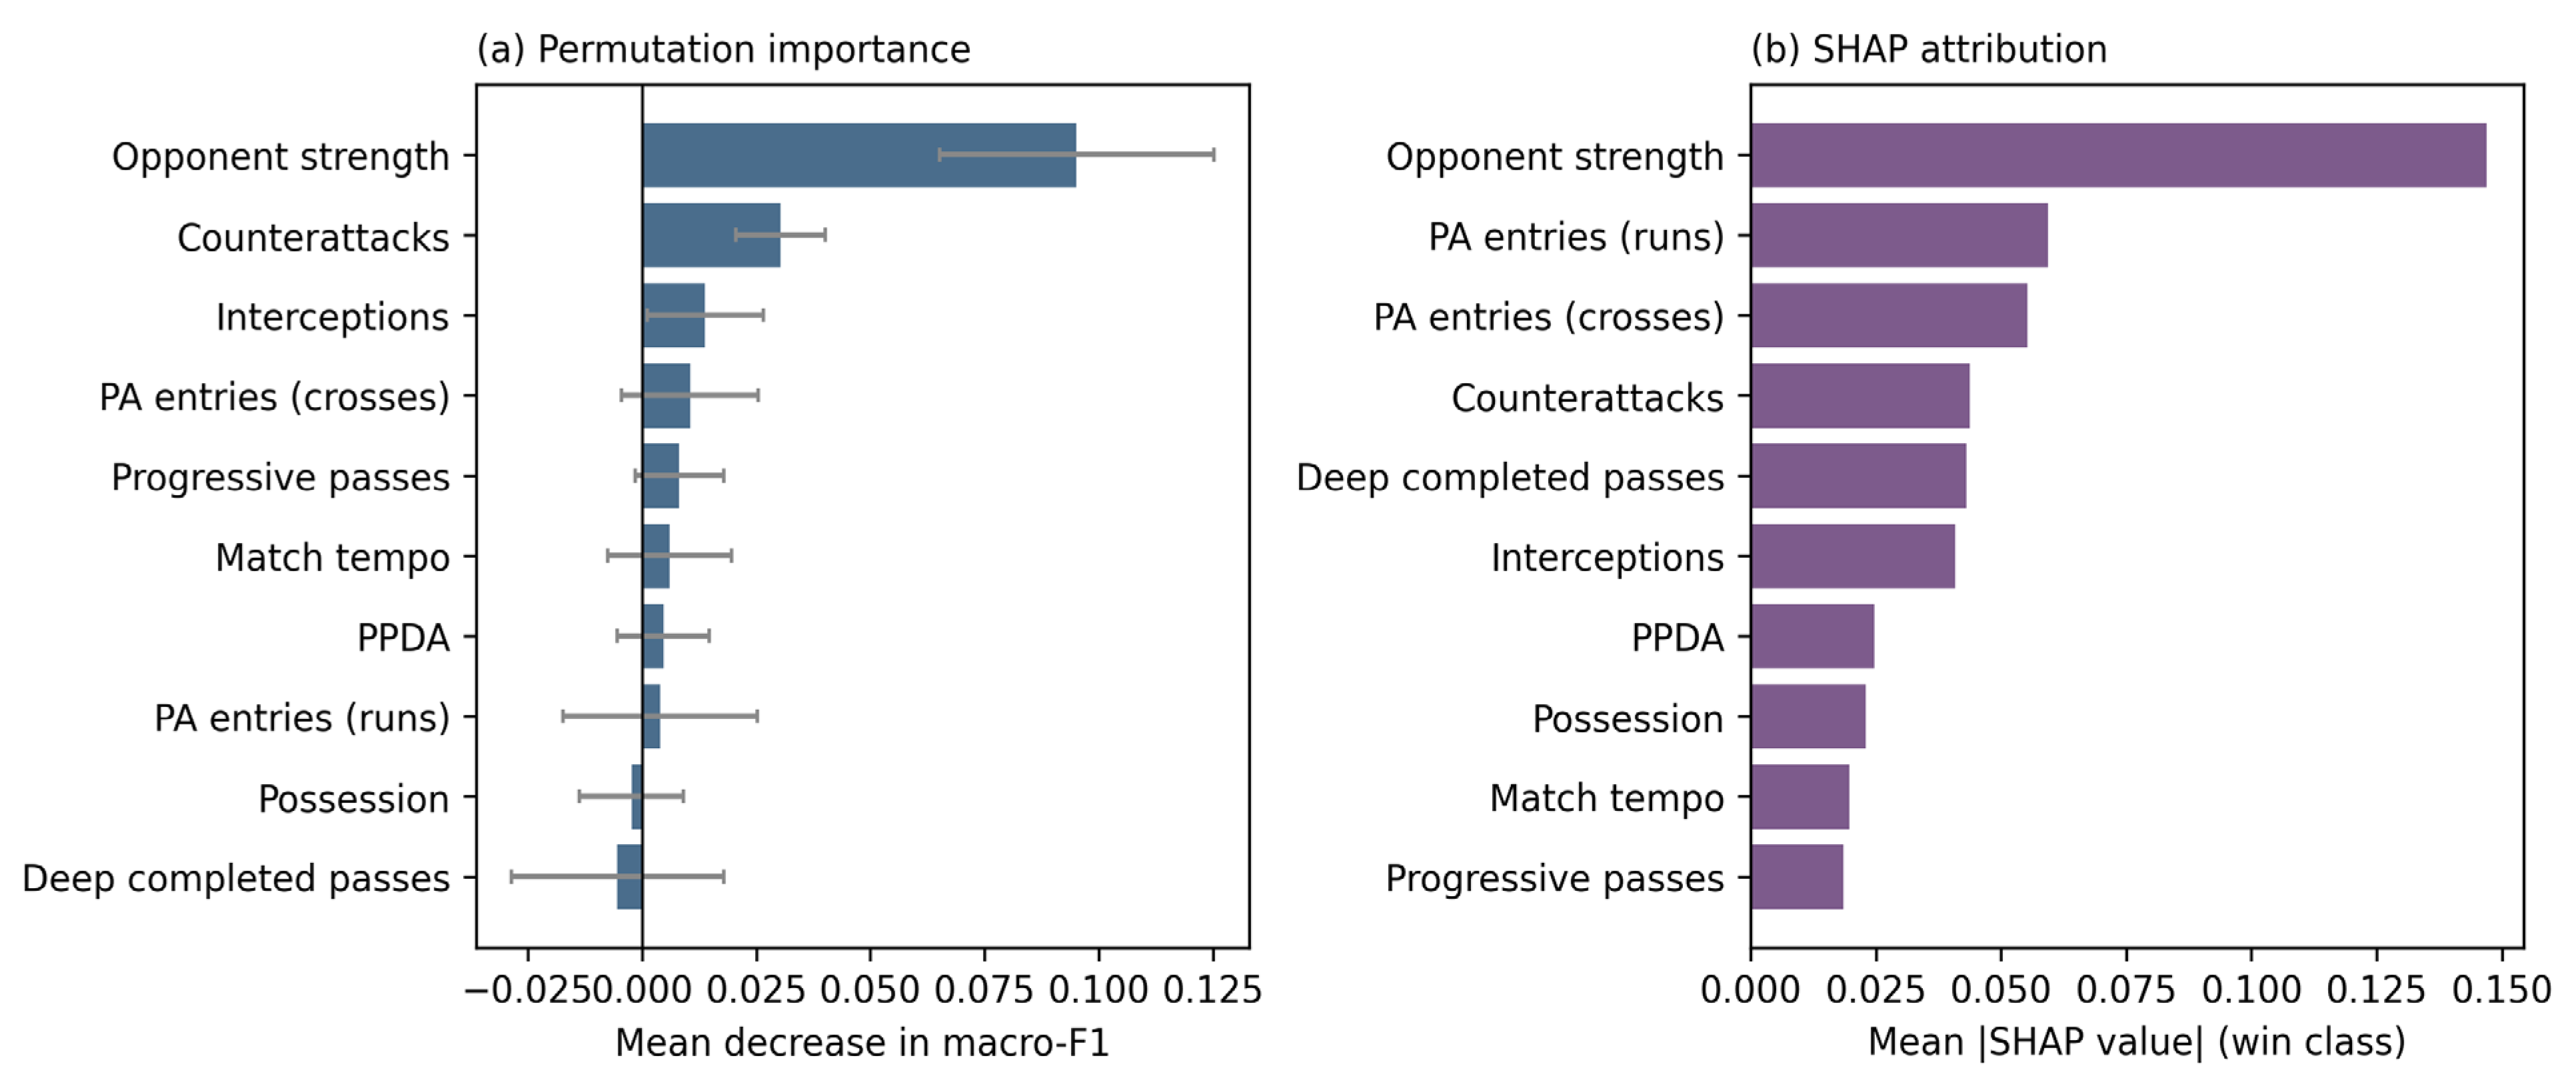
Figure 2.
Forest plot of adjusted odds ratios (95% CI) from the process-only ordinal regression (Model 1). Odds ratios are per one SD increase in the home-minus-away differential; filled markers denote p < 0.05; the dashed line marks OR = 1.
Figure 2.
Forest plot of adjusted odds ratios (95% CI) from the process-only ordinal regression (Model 1). Odds ratios are per one SD increase in the home-minus-away differential; filled markers denote p < 0.05; the dashed line marks OR = 1.
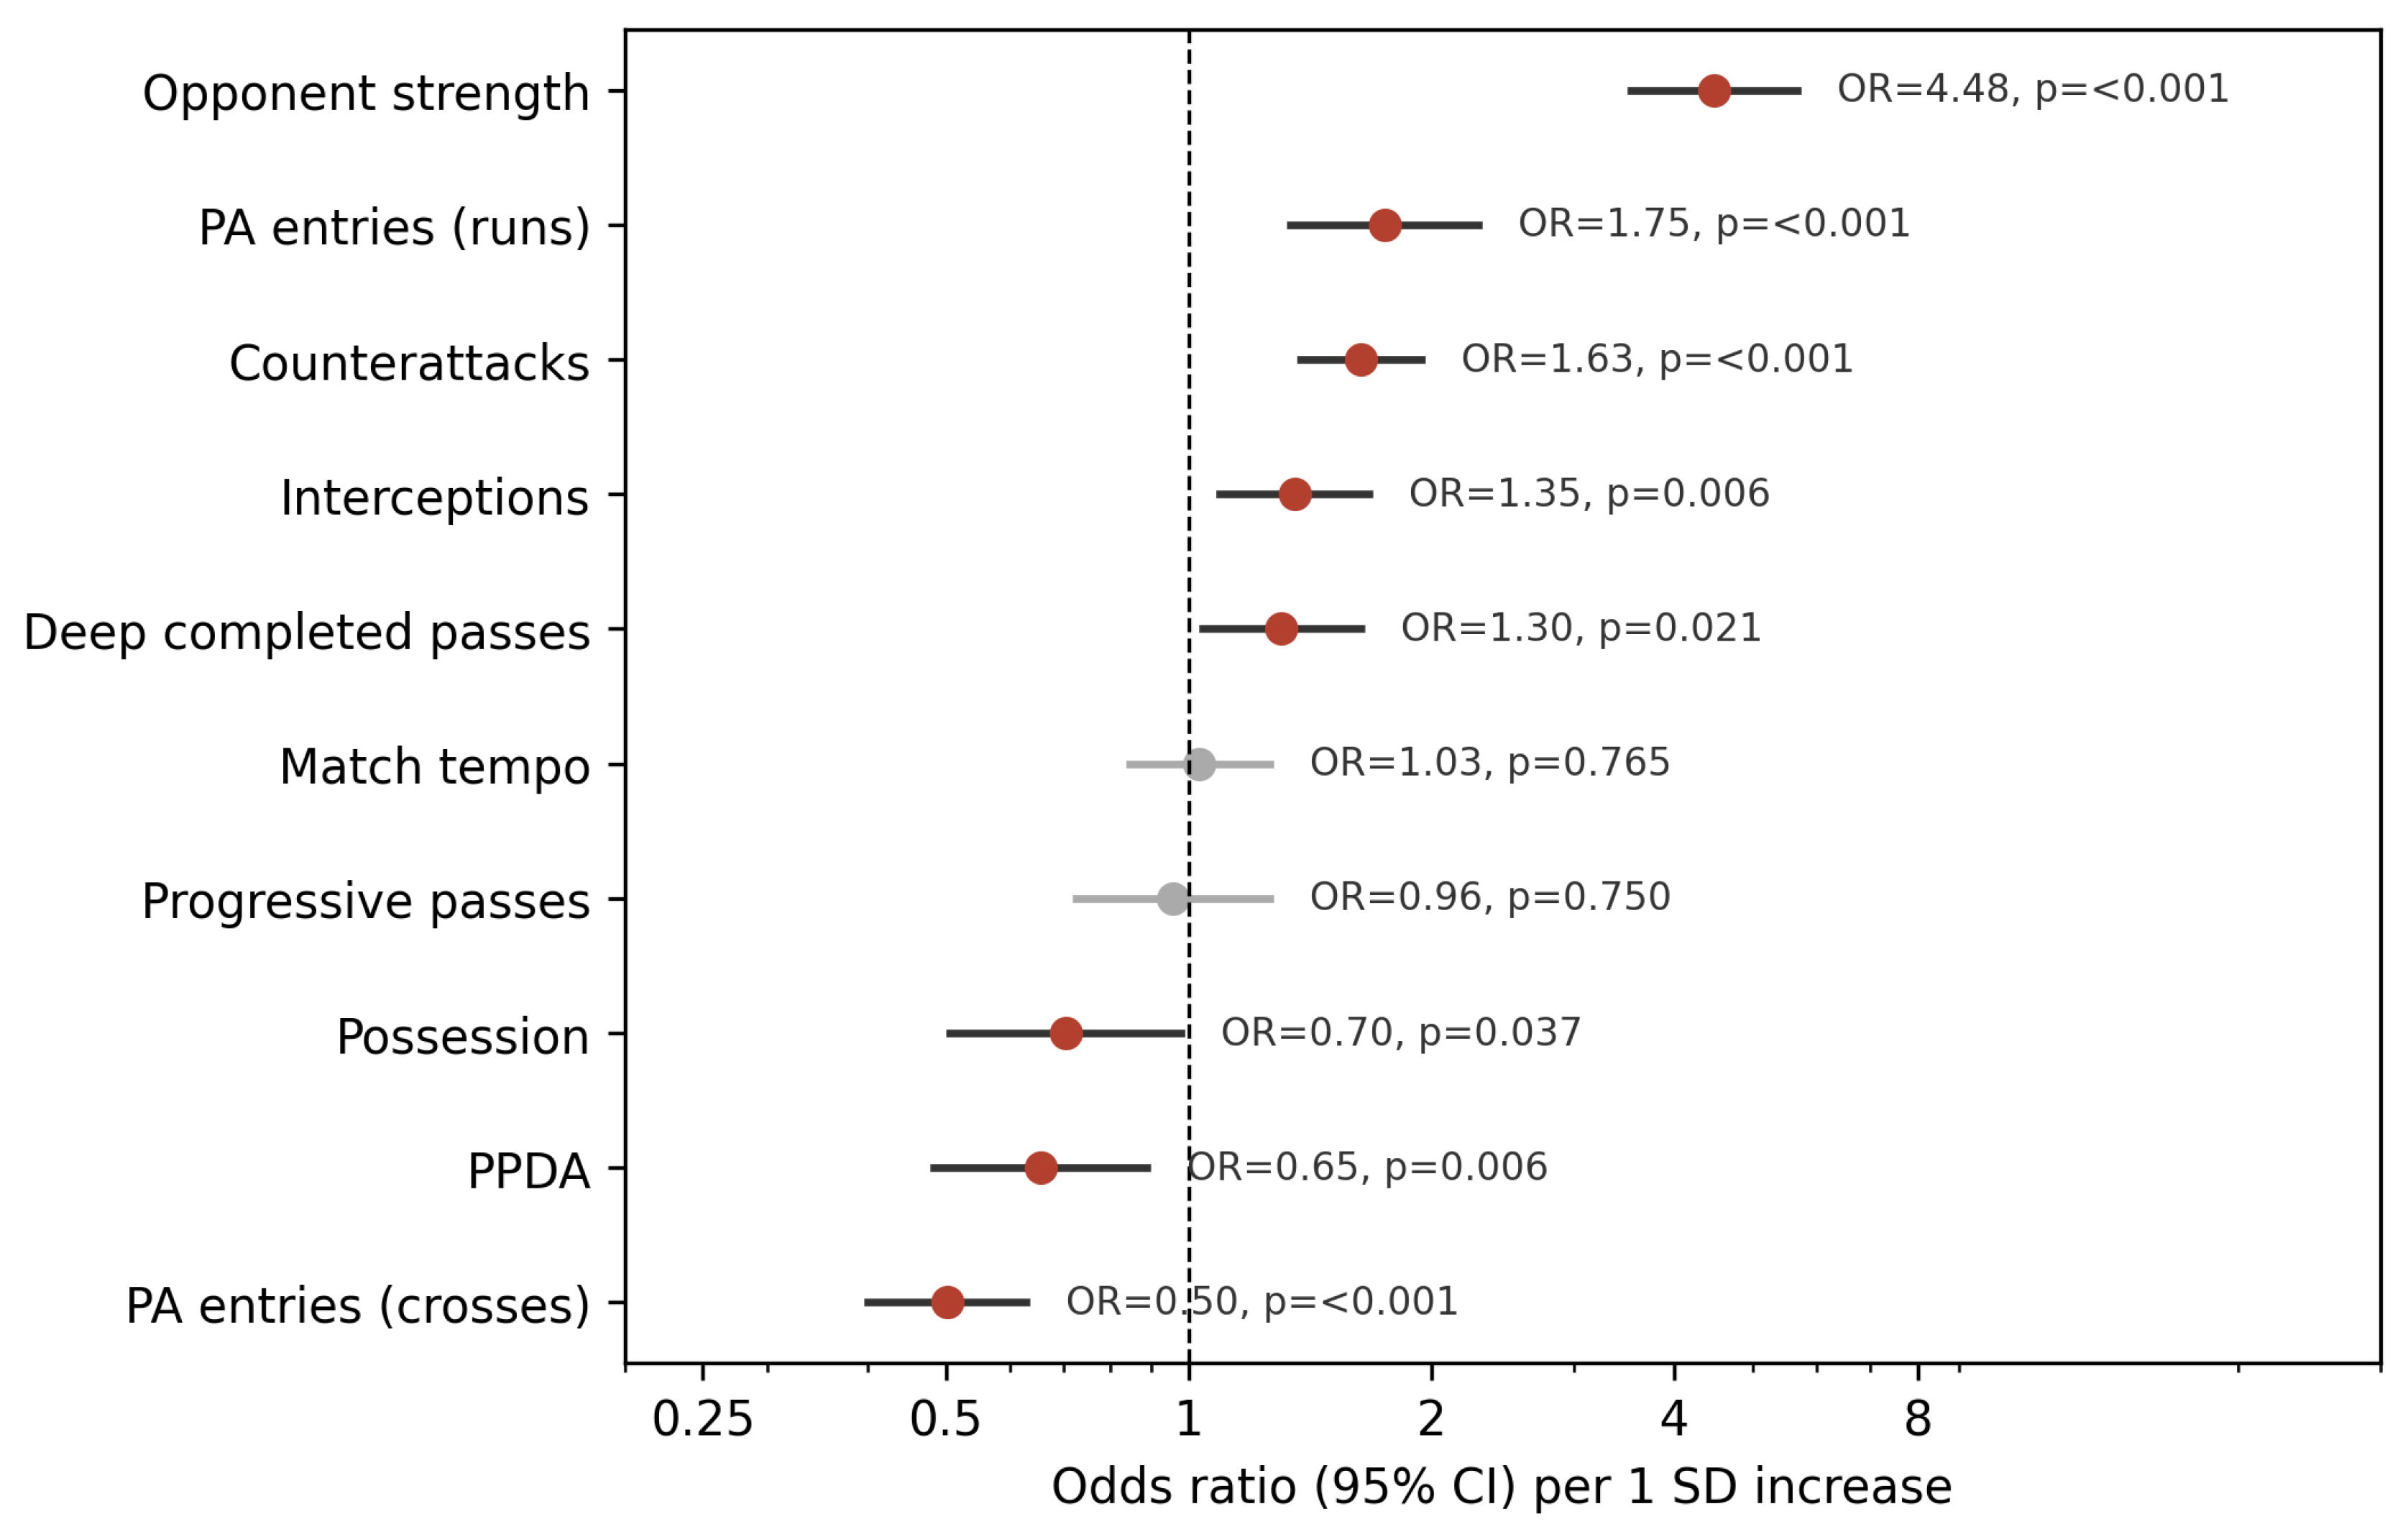

Table 1.
Descriptive statistics of performance indicators by match outcome (home-minus-away differences; mean (SD)). Volume indicators normalised per 90 minutes.
Table 1.
Descriptive statistics of performance indicators by match outcome (home-minus-away differences; mean (SD)). Volume indicators normalised per 90 minutes.
| Indicator (home − away diff) | Win (n=379) | Draw (n=186) | Loss (n=264) |
|---|---|---|---|
| Possession (%) | 5.91 (21.01) | 3.31 (19.81) | 0.26 (20.98) |
| PPDA | −3.03 (8.46) | −1.44 (6.58) | 0.68 (7.38) |
| Deep completed passes | 2.39 (5.56) | 0.57 (4.93) | −1.31 (5.41) |
| PA entries (runs) | 1.84 (5.87) | 0.15 (2.73) | −1.13 (2.85) |
| PA entries (crosses) | 0.94 (7.27) | 2.04 (8.45) | 1.87 (7.15) |
| Progressive passes | 5.67 (21.12) | 2.23 (20.48) | 0.34 (21.10) |
| Interceptions | −1.98 (16.17) | −3.15 (16.99) | −3.40 (15.04) |
| Counterattacks | 0.75 (2.05) | 0.01 (1.83) | −0.65 (2.07) |
| Match tempo | 0.22 (1.99) | −0.15 (2.04) | −0.29 (2.10) |
| Opponent strength (pts) | 13.54 (22.13) | −1.77 (21.12) | −17.30 (22.26) |
| Expected goals (xG) | 0.80 (1.03) | 0.23 (0.86) | −0.62 (1.03) |
| Shots on target | 2.63 (3.24) | 0.47 (2.60) | −1.87 (2.83) |
Table 2.
Ordinal proportional-odds logistic regression predicting match outcome (loss < draw < win). Odds ratios per one SD increase, 95% CI. Model 1: process only (pseudo-R2 = 0.264); Model 2: process + outcome-proximal (pseudo-2² = 0.354).
Table 2.
Ordinal proportional-odds logistic regression predicting match outcome (loss < draw < win). Odds ratios per one SD increase, 95% CI. Model 1: process only (pseudo-R2 = 0.264); Model 2: process + outcome-proximal (pseudo-2² = 0.354).
| Predictor (per 1 SD) | Model 1: OR (95% CI), p | Model 2: OR (95% CI), p |
|---|---|---|
| Opponent strength | 4.48 (3.54–5.68), p<0.001 | 3.38 (2.63–4.34), p<0.001 |
| PA entries (runs) | 1.75 (1.34–2.29), p<0.001 | 1.19 (0.92–1.53), p=0.190 |
| Counterattacks | 1.63 (1.38–1.94), p<0.001 | 1.42 (1.18–1.71), p<0.001 |
| Interceptions | 1.35 (1.09–1.67), p=0.006 | 1.35 (1.08–1.69), p=0.009 |
| Deep completed passes | 1.30 (1.04–1.63), p=0.021 | 0.76 (0.59–0.97), p=0.030 |
| Match tempo | 1.03 (0.84–1.26), p=0.765 | 1.05 (0.85–1.29), p=0.677 |
| Progressive passes | 0.96 (0.73–1.26), p=0.750 | 0.91 (0.67–1.22), p=0.517 |
| Possession | 0.70 (0.51–0.98), p=0.037 | 0.69 (0.49–0.99), p=0.041 |
| PPDA | 0.65 (0.48–0.89), p=0.006 | 0.60 (0.43–0.84), p=0.003 |
| PA entries (crosses) | 0.50 (0.40–0.63), p<0.001 | 0.39 (0.30–0.50), p<0.001 |
| Expected goals (xG) | — (not in M1) | 2.35 (1.75–3.17), p<0.001 |
| Shots on target | — (not in M1) | 2.70 (2.03–3.60), p<0.001 |
Disclaimer/Publisher’s Note: The statements, opinions and data contained in all publications are solely those of the individual author(s) and contributor(s) and not of MDPI and/or the editor(s). MDPI and/or the editor(s) disclaim responsibility for any injury to people or property resulting from any ideas, methods, instructions or products referred to in the content. |
© 2026 by the authors. Licensee MDPI, Basel, Switzerland. This article is an open access article distributed under the terms and conditions of the Creative Commons Attribution (CC BY) license (http://creativecommons.org/licenses/by/4.0/).
Copyright: This open access article is published under a Creative Commons CC BY 4.0 license, which permit the free download, distribution, and reuse, provided that the author and preprint are cited in any reuse.