
Submitted:
23 September 2026
Posted:
23 September 2026
You are already at the latest version
Abstract
The national water network is a component of China’s infrastructure, and coordinating ecological security with economic development is important for its construction. Taking the Chao’er River to West Liao River Water Diversion Project, part of the three-horizontal and three-vertical Inner Mongolia water network, as a case study, this paper analyzes the main receiving areas, Tongliao and Xing’an League. Using panel data from 2019–2025, a matching degree model incorporating water resource, ecological, and economic dimensions was constructed. The Gini coefficient and coupling coordination degree were combined to assess spatial matching and its evolution before and after project operation, and optimization scenarios for current water allocation are proposed. After operation, water–economy and economy–ecology bivariate matching was generally good, while water–ecology matching remained low, a common weakness in both jurisdictions. Trivariate matching shifted from severe disorder through near disorder toward marginal coordination, with spatial differences: Tongliao showed low-level, strongly fluctuating matching, whereas Xing’an was stable but structurally imbalanced, constrained by a low comprehensive evaluation index. Differentiated pathways are proposed, including strengthened emergency ecological water replenishment in Tongliao and rebalancing the three subsystems, especially improving water use efficiency in Xing’an. These findings support project optimization and water network construction in comparable pastoral areas.
Keywords:
Chao’er River to West Liao River Water Diversion Project
; water–ecology–economy nexus
; biva-riate matching
; Gini coefficient
; Lorenz asymmetry coefficient
; coupling coordination
; water security
; spatiotemporal variation
1. Introduction
Pastoral areas represent one of China’s major regional economic types and play a strategic role in safeguarding ecological security, ensuring the supply of livestock products, and promoting ethnic unity and development. Located in the far north of the country, the Inner Mongolia Autonomous Region is China’s largest pastoral region and bears the important responsibility of consolidating the northern ecological security barrier. However, constrained by physical geography and climate, the ecological environment of pastoral areas is highly fragile. Overgrazing and inefficient water use have resulted in freshwater shortages for domestic consumption and agricultural irrigation, severely constraining sustainable socioeconomic development in these areas [1].
The National Water Network Construction Plan established by the CPC Central Committee and the State Council calls for accelerating the construction of the national water network at three levels: the trunk lines, distribution networks, and nodal hubs, to strengthen overall water security capacity. As a provincial component of this system, the Inner Mongolia water network plays an important role in consolidating the northern ecological security barrier. Water network construction in typical pastoral areas therefore warrants early investigation, particularly with regard to the multi-element matching relationships among water resource allocation, the ecological environment, and socioeconomic development.
Existing research has paid limited attention to how water network construction in pastoral areas jointly promotes systematic matching among water resources, ecology, and the economy, highlighting the need for empirical analyses of representative projects. Most studies examine the interactions between two resources at a time or focus on how the spatiotemporal distribution of water resources affects socioeconomic and ecological conditions [2,3,4,5,6]. Some scholars have proposed theoretical or modeling frameworks to guide the spatial planning and optimal allocation of regional water resources [7,8,9,10,11].
This study therefore considers the receiving area of the Chao’er River to West Liao River Water Diversion Project (hereafter the Chao-Liao Project), a major diversion project within the Inner Mongolia water network, as its study area. Drawing on measured water resource, ecological, and economic data from 2019 to 2025, the study constructs a comprehensive evaluation indicator system, extends bivariate spatial matching analysis by introducing the concept of trivariate matching degree, and analyzes changes in water-ecology-economy matching pattern before and after the project became operational, thereby supporting regional ecological protection and high-quality development.
2. Study Area and Data Sources
The Chao-Liao Project consists of the Wendegen Water Control Project and a water conveyance system and is the largest water conservancy project by investment in Inner Mongolia to date. The project diverts water from the Chao’er River to the West Liao River, supplying water to cities and industrial parks along its route while also supporting irrigation and power generation. Construction of the project began in September 2018. In December 2023, the water conveyance tunnel section was fully holed through. In January 2024, the nine branch lines of Phase II commenced construction simultaneously. On June 30, 2025, trial water conveyance across the entire project was successfully completed. The receiving area encompasses Horqin District, the seat of the Tongliao municipal government; Ulanhot, the seat of the Xing’an League administration; seven banner and county seats; and ten industrial parks under the jurisdiction of the two administrative divisions. Figure 1 illustrates the administrative divisions of Tongliao and Xing’an and the extent of the receiving area.
2.1. Overview of the Study Area
Tongliao is located in the West Liao River region and is a typical area experiencing resource-based water scarcity. Situated at mid-latitudes, Tongliao has a mid-temperate, arid to semi-arid continental monsoon climate. In 2025, its gross domestic product (GDP) reached 173.771 billion yuan, while its year-end permanent resident population was 2.7520 million. The banners, counties, and districts within the Chao-Liao Project cover approximately 4.62 × 10⁴ km², accounting for 77.58% of the total municipal area, and include Horqin District, Horqin Left Wing Middle Banner, Horqin Left Wing Rear Banner, Kailu County, and Jarud Banner.
Xing’an League is located in the transition zone between the Greater Khingan Range and the Songnen Plain and has a temperate continental monsoon climate. In 2025, its GDP reached 85.009 billion yuan, and its year-end permanent resident population was 1.3550 million. The banners, counties, and districts served by the Chao-Liao Project cover approximately 3.98 × 10⁴ km², accounting for 66.56% of the total area of the league, and include Ulanhot City, Horqin Right Wing Front Banner, Horqin Right Wing Middle Banner, and Tuquan County.
For ease of analysis and calculation, this study selects the banners, counties, and districts of Tongliao City and Xing'an League in the receiving area of the Yinchuojiliao Water Diversion Project as the basic study area.
2.2. Data Sources
The banner, county, or district serves as the basic spatial unit, and three types of data are used: socioeconomic, hydrological, and ecological data. Data for 2019-2025 were obtained from the Tongliao Statistical Yearbook, the Xing’an League Statistical Yearbook, the Tongliao Water Resources Bulletin, the Xing’an League Water Resources Bulletin, and government work reports from the respective banners, counties, and districts. NDVI data were obtained from the MOD13Q1 vegetation index product on the Google Earth Engine platform, clipped to the administrative boundaries of the receiving units and subsequently aggregated.
3. Methods
3.1. Bivariate Matching Analysis
The Lorenz curve was originally developed to measure inequality in income distribution. Its horizontal axis represents the cumulative share of the population with income below a given level, corresponding in this study to the cumulative share of water resources or ecological resources, while its vertical axis represents the cumulative share of total income, corresponding here to the cumulative share of the economy or water resources. The degree of curvature reflects the extent of distributional inequality. This study employs two statistical measures, the Gini coefficient G and the Lorenz asymmetry coefficient S [12], to analyze the pairwise bivariate matching degrees among water resources, ecology, and the economy.
The Italian economist Gini proposed the Gini coefficient as a quantitative measure of the inequality represented by the Lorenz curve [13], which is calculated as . The coefficient ranges from 0 to 1, with the internationally accepted classification presented in Table 1 [14].
In the recent literature, the Gini coefficient has been widely applied beyond economics, including in studies of ecology [15], climate [16], environment [17], and water resources [18,19,20]. Following its underlying rationale, if a region’s share of gross output is consistent with its share of water resources or ecological green space, the spatial allocation of water resources and ecological resources can be considered reasonable. Accordingly, the banners, counties, and districts of Tongliao City and Xing’an League are used as the basic spatial units, total annual water use as the base variable, and GDP and NDVI as the comparison variables. Lorenz curves are constructed for each matching relationship, and the corresponding Gini coefficients are calculated.
It is worth noting here that the Gini coefficient alone cannot fully characterize the shape of a Lorenz curve. As shown in Figure 2b, three curves may have the same Gini coefficient of 0.5 while exhibiting different shapes. The Lorenz asymmetry coefficient S is therefore introduced to further characterize curve asymmetry [12]. For a Lorenz curve constructed from an ordered data series x1 ≤ x2≤…≤xi≤…≤xn, S is calculated as follows:
where μ is the mean of the data series, n is the length of the series, and m is the number of values in the series that are smaller than μ. A value of S < 1 indicates that low values contribute more to inequality, S > 1 indicates that high values contribute more, and S = 1 indicates equal contributions from high and low values.
3.2. Trivariate Matching Analysis
The water–ecology–economy coupled system is a multidimensional complex system that integrates the interactions and interdependencies among water resource management, socioeconomic development, and ecological protection [21]. The three subsystems influence one another through intricate and interconnected relationships. As defined in this study, the trivariate matching degree refers to the joint reading of the comprehensive development level of the three subsystems, expressed as T, and the degree of coordination among them, expressed as D, within a single spatial unit (i.e., a banner, county, or district).
3.2.1. Indicator System
Building on existing research and guided by the principles of data availability, scientific validity, representativeness, and completeness, a comprehensive evaluation indicator system was developed to assess the water-ecology-economy relationship in the receiving area of the Chao-Liao Project (Table 2). The indicator system comprises seven indicators: two for water resources, two for ecology, and three for the economy.
The two water resource indicators encompass water supply and water use, jointly reflecting regional water supply capacity and water use efficiency; both are negative indicators, meaning that lower standardized values correspond to higher scores. The two ecological indicators represent ecological protection and environmental pollution, respectively, and together characterize the health and sustainability of the regional ecosystem. Additionally, the economic indicators characterize the socioeconomic foundation and level of regional development.
3.2.2. Indicator Weighting
The entropy weight method is an objective weighting approach based on information theory. Its underlying principle is that the more dispersed an indicator is, the more pronounced its variation across evaluation units and the more information it contains, and thus the greater its assigned weight; conversely, an indicator with highly similar values across evaluation units receives a lower weight. Because the method relies entirely on the intrinsic characteristics of the data, it effectively avoids subjective bias. The calculation procedure is as follows.
(1) Construct the original data matrix: For n evaluation units (regions) and m indicators, the original data matrix is denoted as , where xij represents the observed value of indicator j in region i.
(2) Standardize the data: Dimensionless values are obtained using the extremum method:
After this transformation, all indicator values fall within the range [0, 1]. To avoid the undefined term ln(0) in the subsequent logarithmic calculation, a small positive constant, typically 1 × 10⁻⁶, is added to all standardized values, yielding xij′′ = xij′ + 10−6.
(3) Compute the proportion matrix: For indicator j, the characteristic proportion of region i is calculated as:
(4) Compute the information entropy: The entropy of indicator j is calculated as:
(5) Compute the redundancy coefficient or degree of divergence: The coefficient is calculated as follows:
dj = 1 − Hj
A larger coefficient of variation indicates greater discriminatory power and a larger contribution of the indicator to the overall evaluation.
(6) Determine the indicator weights: Normalizing the coefficients of variation yields the final weight wj for indicator j:
These weights objectively reflect the relative importance of each indicator in the overall evaluation.
3.2.3. Coupling Coordination Model
Using the entropy-derived weights, a coupling coordination model is applied to analyze the interactions and coordinated development of the water-resource, ecological, and economic subsystems. The model is widely employed in integrated studies of water resource management, socioeconomic development, and ecological protection [22,23] and can reveal both the interdependencies among subsystems and their overall level of coordination, thereby providing a scientific basis for sustainable development. The relevant equations are as follows.
Subsystem evaluation indices:
where f(x), g(y), and h(z) denote the composite scores of the water resource, ecological, and economic subsystems, respectively; wi, si, and ei are the indicator weights within the corresponding subsystem; xi, yi, and zi are the dimensionless indicator values; and r, u, and k denote the numbers of indicators in the respective subsystems.
The coupling degree C measures the strength of interactions among the three subsystems and ranges from 0 to 1, with higher values indicating stronger interconnections. For three subsystems (n = 3), the coupling degree is calculated as follows:
The comprehensive evaluation index T reflects the overall development level of the coupled system. Because the three subsystems are assumed to have equal importance in this study, T is calculated as follows:
The coupling coordination degree D integrates the coupling degree C and the comprehensive evaluation index T:
The value of D also ranges from 0 to 1 (Table 3). A higher value indicates that the subsystems not only interact strongly but also develop in a coordinated manner, whereas a lower value indicates that interactions may exist without substantial coordinated development, potentially because some subsystems lag or develop out of step with the others.
4. Results
4.1. Bivariate Matching Pattern
4.1.1. Gini Coefficient (G)
Gini coefficients were calculated for 2019-2025 in the receiving areas of Tongliao and Xing’an for three bivariate relationships: water resources–economy, with total annual water use as the base variable and GDP as the comparison variable; water resources–ecology, with total annual water use as the base variable and NDVI as the comparison variable; and economy–ecology, with GDP as the base variable and NDVI as the comparison variable. The results are shown in Figure 3.
Figure 3a shows that, in Tongliao, the water resources–economy Gini coefficient ranged from 0.1520 to 0.2756 and remained below 0.3 throughout the study period, indicating a relatively balanced spatial allocation of water resources and economic output and a good bivariate matching. The water resources–ecology Gini coefficient ranged from 0.2625 to 0.3479 and remained below 0.4, indicating a relatively reasonable spatial allocation and a moderate bivariate matching. The economy–ecology Gini coefficient ranged from 0.1961 to 0.2569 and remained below 0.3, indicating a relatively balanced allocation and a good degree of bivariate matching. Overall, the water resources–ecology mismatch is the most pronounced in Tongliao, with the lowest matching degree among the three pairs and a slight deterioration in recent years, whereas the water resources–economy and economy–ecology pairs are more balanced and their matching degrees have improved since 2023.
Figure 3b shows that, in Xing’an, the water resources–economy Gini coefficient ranged from 0.0156 to 0.0746, indicating a highly balanced spatial allocation and an excellent bivariate matching. The water resources–ecology Gini coefficient ranged from 0.3781 to 0.4390, indicating a relatively unbalanced allocation and a poor degree of bivariate matching. Additionally, the economy–ecology Gini coefficient ranged from 0.2696 to 0.3768 and generally declined after 2022, indicating a progressively more balanced allocation and an improving degree of bivariate matching. Overall, Xing’an exhibits a very high degree of matching between water resources and the economy, whereas the matching degrees between water resources and ecology and between the economy and ecology are lower, with the water resources–ecology relationship remaining persistently unbalanced.
Comparing the two jurisdictions, the water resources–economy Gini coefficient is substantially lower in Xing’an than in Tongliao, indicating a better water resources–economy matching degree in Xing’an. The economy–ecology Gini coefficient is generally lower in Tongliao, indicating that its economy–ecology matching is both better and more stable. The water resources–ecology Gini coefficient is relatively high in both jurisdictions, indicating a poor matching degree in both cases, particularly in Xing’an.
4.1.2. Lorenz Asymmetry Coefficient (S)
Lorenz asymmetry coefficients for the same three pairs were subsequently calculated for 2019–2025, as shown in Figure 4.
Figure 4a,b show that, in both jurisdictions, S exceeded 1 for the water resources–economy and economy–ecology pairs, whereas S was below 1 for the water resources–ecology pair. Inequality in the first two pairs is therefore driven primarily by units with high values, whereas inequality in the water resources–ecology pair is driven mainly by units with low values. Economically developed units thus hold an advantage in both water resources and ecology: the water resources–economy matching degree is influenced primarily by units that are both water-rich and economically developed, whereas the economy-ecology matching degree is influenced primarily by units that are both economically developed and ecologically sound. By contrast, the water resources–ecology matching degree is constrained primarily by units that are both water-scarce and ecologically fragile, with a more pronounced mismatch occurring as the severity of these two conditions increases.
Comparing the two jurisdictions, S for the water resources–economy pair is generally higher in Xing’an, indicating that economically developed units account for a more concentrated share of water use and exert a stronger influence on the overall matching pattern. Additionally, S for the economy–ecology pair is higher in Tongliao, indicating that its economically developed units are in better ecological condition and exert a greater influence on the matching degree. S for the water resources–ecology pair is generally lower in Tongliao, indicating that its water-scarce and ecologically fragile units exert a stronger constraining effect on the overall matching pattern.
4.2. Trivariate Matching Pattern
4.2.1. Spatiotemporal Differences in Subsystem Indices
The subsystem evaluation indices reflect the development level and potential of each subsystem. The three subsystem indices for the banners, counties, and districts of Tongliao are presented in Figure 5. The water resource index ranges from 0.01 to 0.30 and exhibits substantial variation, with an initial decline followed by an increase. It decreased steadily from 2019 to 2022 and then increased gradually from 2023 to 2025. The economic index ranges from 0.02 to 0.55 and shows an overall increasing trend; it exhibits the greatest variation and is the highest among the three subsystem indices, although substantial differences exist among the individual units. The ecological index ranges from 0.01 to 0.19 and fluctuates dramatically from year to year, approaching zero in some units during certain years, suggesting that ecological variability is the main source of interannual changes in the coupling coordination degree.
Figure 6 presents the corresponding subsystem indices for Xing’an. The water resource index ranges from 0.01 to 0.22 and exhibits the least variation across both units and years. The economic index ranges from 0.05 to 0.56 and shows the greatest variation; although it decreased slightly in some units, it remained the highest of the three subsystem indices. The ecological index ranges from 0.04 to 0.33 and fluctuates considerably across years while showing an overall upward trend, with league mean value accumulating a growth of 26.8% from 2019 to 2025.
Comparing the two jurisdictions, the mean water resource index in Tongliao reached 0.108 in 2025, close to the 0.112 observed in Xing’an; however, after excluding the extreme low value in each jurisdiction, Tongliao remained below Xing’an at 0.123 versus 0.134. For the economic subsystem, the annual mean in Xing’an remained relatively stable, ranging from 0.165 to 0.181, whereas that in Tongliao ranged from only 0.109 to 0.125, about 25%–40% lower. The ecological index was substantially lower than the water resource and economic indices in both jurisdictions, while the gap between Xing’an and Tongliao widened from 0.012 in 2019 to 0.042 in 2025, indicating that the improvement in the ecological index in Xing’an has further increased its advantage over Tongliao.
4.2.2. Spatiotemporal Variation in the Comprehensive Evaluation Index (T)
Figure 7 illustrates the spatiotemporal evolution of T from 2019 to 2025. As shown in Figure 7(a), Holingol remains substantially higher than the other units in Tongliao. T declined markedly in Horqin Left Wing Middle Banner from 2023 to 2025, while most other units exhibited an upward trend. Figure 7(b) shows that T generally declined year by year in Ulanhot, increased distinctly in Horqin Right Wing Middle Banner, Horqin Right Wing Front Banner, Arxan, and Tuquan County, and first increased and then declined in Jalaid Banner.
Between 2019 and 2025, the annual mean T across the Tongliao units ranged from 0.088 to 0.105, with the mean remaining below 0.090 for three consecutive years (2022–2024) before rising sharply to 0.1045 in 2025. This fluctuation appears to be associated with changes in the water resource and ecological subsystems. The annual decline in the water resource index from 2019 to 2022 was the main factor driving the drop in T, while the continued decline in the ecological index in 2023 and 2024 further suppressed T. In 2025, both the water resource and ecological indices increased simultaneously and, together with the higher economic index, contributed to the sharp increase in T.
The average T in Xing’an varied only slightly, ranging from 0.128 to 0.133, with the highest value of 0.1330 recorded in 2025. Although the economic index decreased slightly, the steady increase in the ecological index compensated for this decline, while the water resource index remained stable. This complementary pattern of a declining economic index, improving ecological index, and stable water resource index maintained T at a relatively stable and higher level.
4.2.3. Variation in the Coupling Coordination Degree (D)
The coupling coordination degree D in Tongliao exhibits a pronounced W-shaped sawtooth pattern over time (Figure 8 and Figure 9), suggesting strong sensitivity of system coordination to climatic changes and an unstable growth mode with limited engineered resilience. Between 2019 and 2025, D across the Tongliao units ranged from 0.00 to 0.52, creating a polarized distribution with one high-performing unit and several low-performing units. Holingol represents the benchmark for trivariate matching, with D remaining relatively stable between 0.47 and 0.52 but never exceeding 0.52, placing it in the transition from near disorder to marginal coordination. Horqin District and Jarud Banner are in a transitional state, with D ranging from 0.30 to 0.40 and from 0.32 to 0.35, respectively, indicating slight disorder but relatively stable coordination. The other five units have poor trivariate matching. In Horqin Left Wing Rear Banner, D declined to 0.035 in 2024 before increasing sharply to 0.321 in 2025, suggesting a high vulnerability of the coupled system and low resistance to disturbance. In Naiman Banner, D dropped to 0.0004 in 2023 before recovering to 0.234 in 2025, indicating substantial interannual variability. In Kailu County, D varied between 0.18 and 0.26, while in Hure Banner, it remained below 0.28. In Horqin Left Wing Middle Banner, the water resource index has remained close to zero for several years, and the coupling degree is only 0.03, resulting in D values between 0.02 and 0.03, the lowest among the Tongliao units.
Overall, D in Tongliao was highly volatile from 2019 to 2025, with a significant decrease in 2024 under extreme drought conditions followed by a strong recovery in 2025. This pattern highlights the vulnerability of the water–ecology–economy system, whose coordination is largely reliant on natural rainfall and lacks sufficient engineered protection. The rapid rebound shows that some units possess a capacity for self-recovery, but the intensity of the swings points to a lack of sustainability.
Furthermore, across the Xing’an units, D ranged between 0.03 and 0.54, creating a stable middle tier accompanied by a weak lower tail. Arxan exhibits a high degree of trivariate matching, with D remaining stable between 0.47 and 0.54 and reaching a peak of 0.54 in 2025, making it the only unit that consistently remained within the marginal coordination category. Ulanhot, Tuquan County, Horqin Right Wing Front Banner, and Horqin Right Wing Middle Banner form a moderately balanced tier, with D ranges of 0.36–0.45, 0.28–0.36, 0.28–0.35, and 0.27–0.34, respectively. In Jalaid Banner, the water resource index is nearly always zero, and D remains only 0.03–0.05, making it the weakest unit in terms of trivariate matching.
Figure 10.
Spatiotemporal variation in the coupling coordination degree (D) for the banners, counties, and districts of Xing’an League.
Figure 10.
Spatiotemporal variation in the coupling coordination degree (D) for the banners, counties, and districts of Xing’an League.
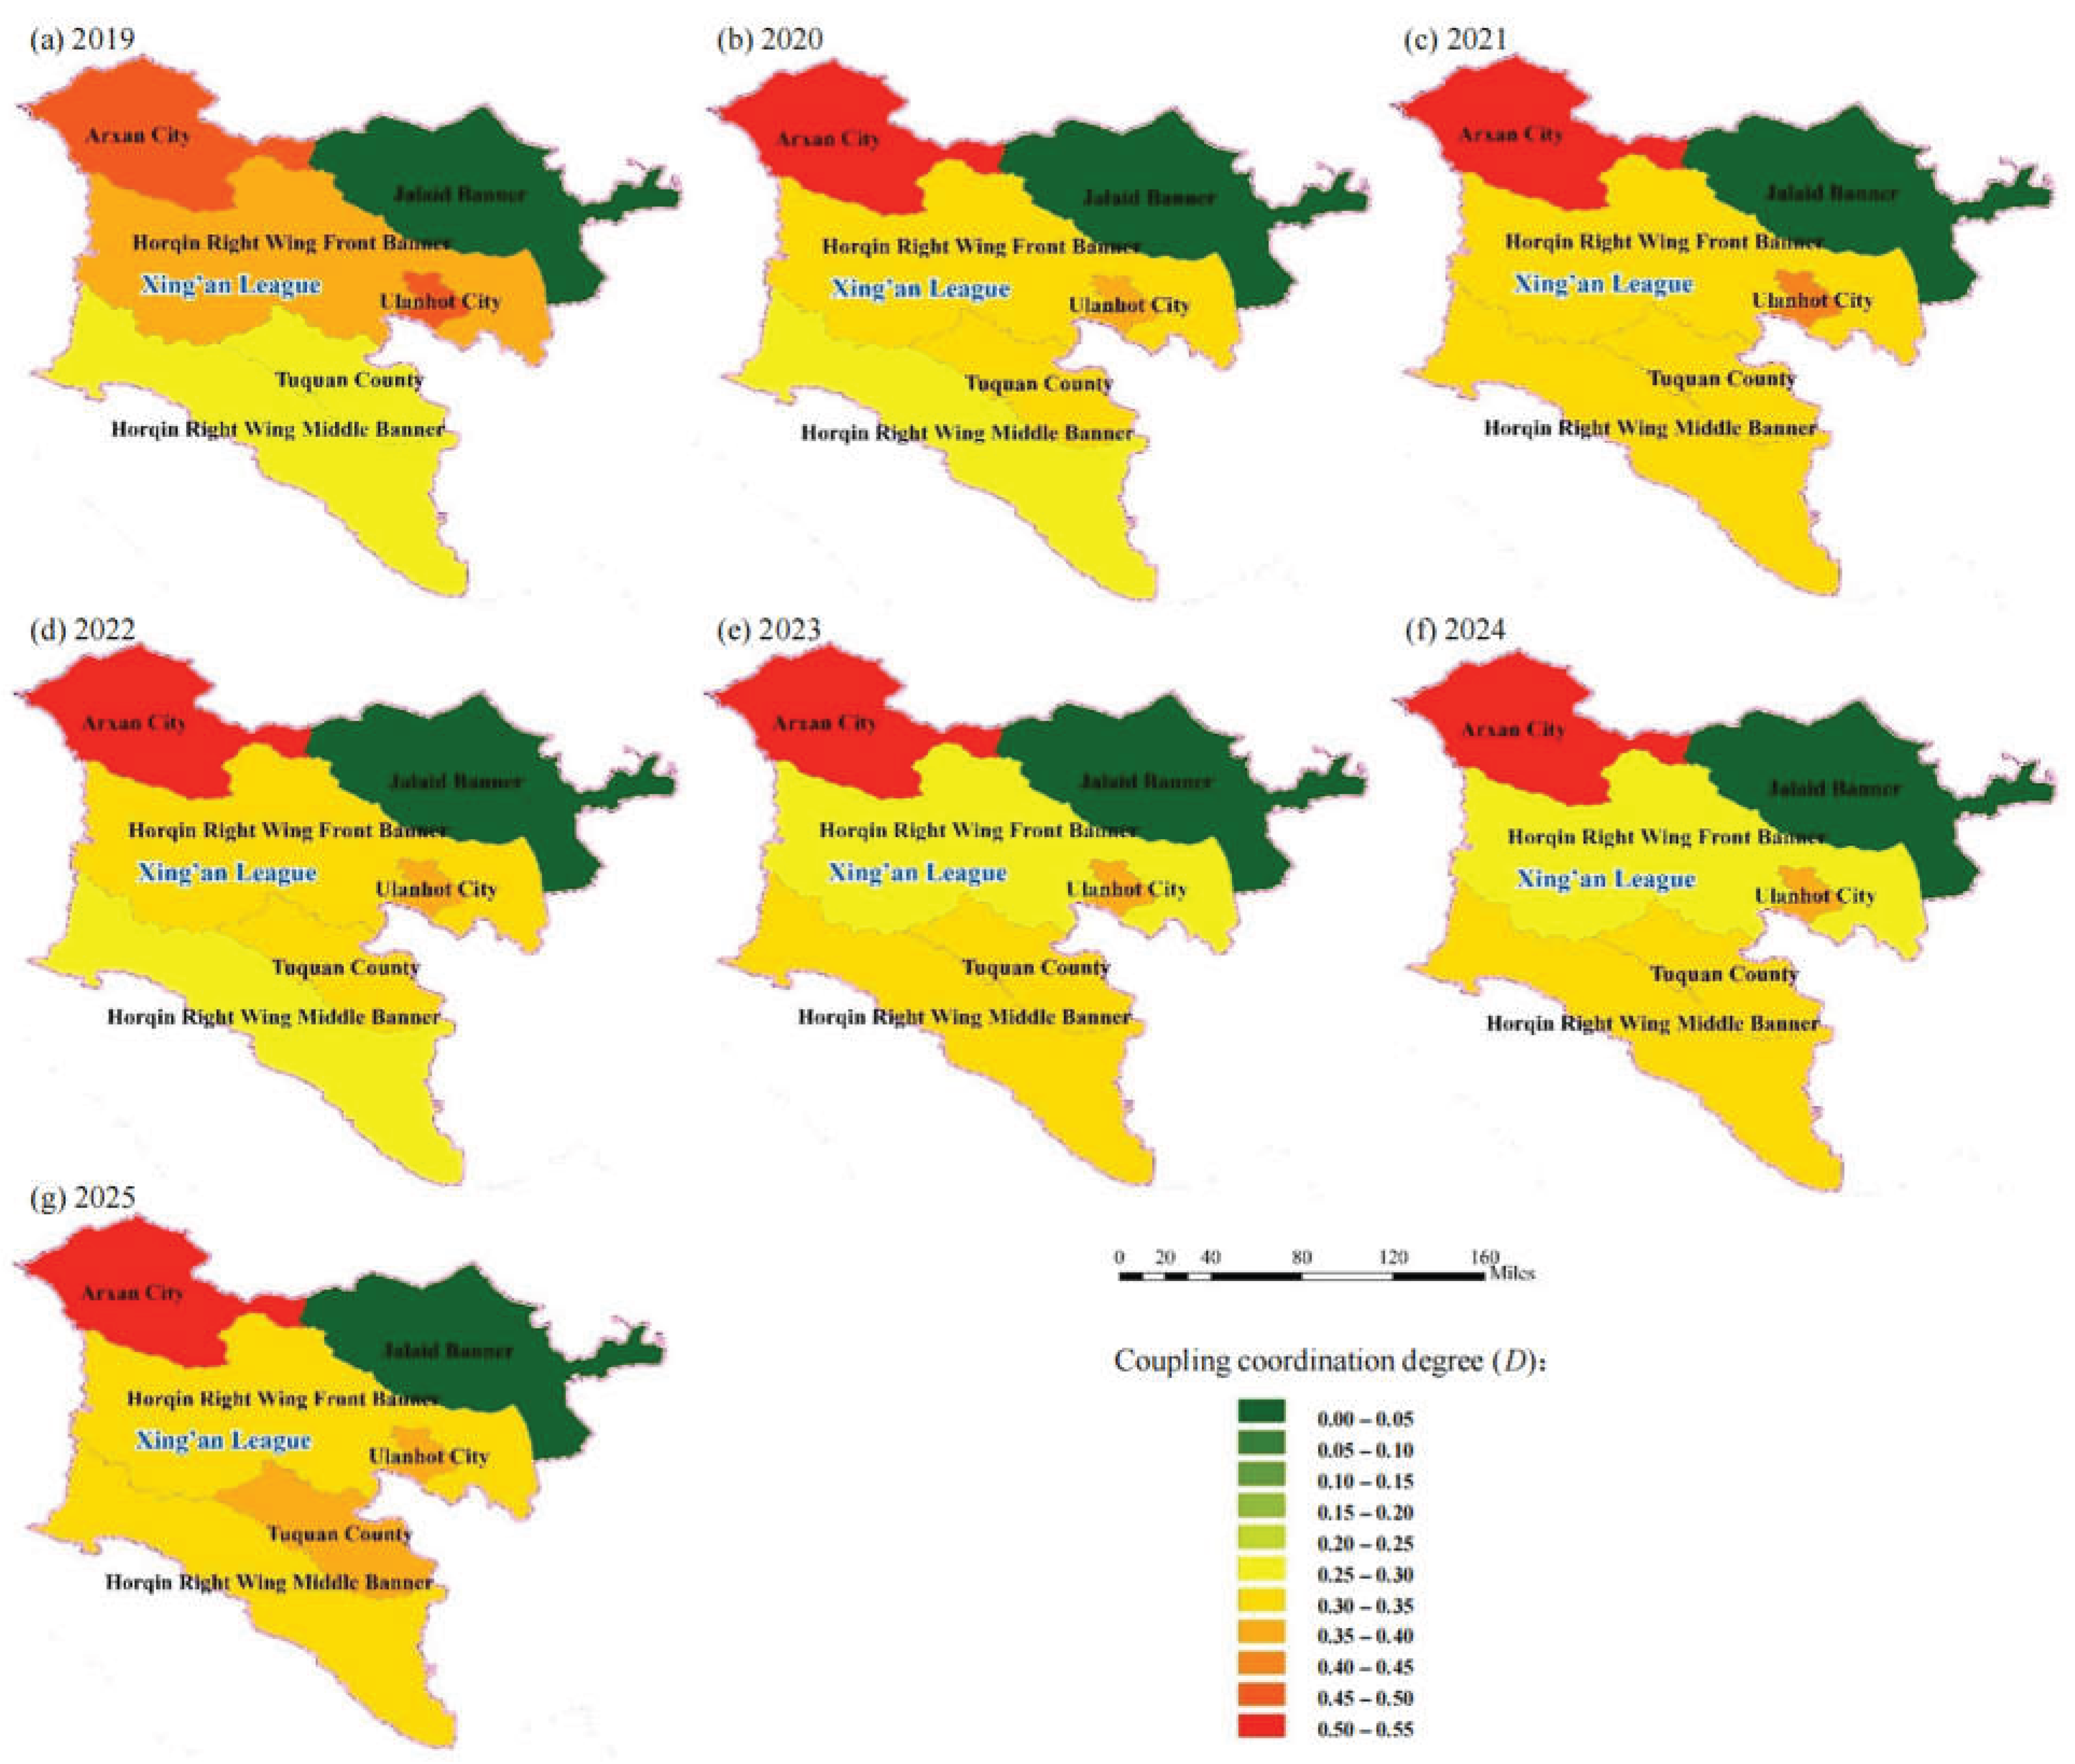
On average, D in Xing’an ranged from 0.31 to 0.33 during 2019–2025, and the year-on-year change remained within 2.7% in all years except 2025, when D increased significantly. This indicates that the system has high resistance to disturbance and strong resilience following disturbance.
From 2019 to 2025, D in both jurisdictions ranged between 0.00 and 0.55 and generally increased over time, progressing from severe disorder through near disorder toward marginal coordination. At this stage, the three subsystems have achieved a certain degree of balance, but remain far from optimal coordination. Rapid economic growth may place increasing pressure on water resources and ecological conditions, while imbalanced resource allocation and insufficient environmental protection measures constrain further improvements in coordination.
4.2.4. Constraints and Improvement Paths
Based on the spatiotemporal patterns of D, the major constraints on trivariate matching are discussed below, and differentiated improvement pathways are proposed.
(1) Mismatch between coupling and overall strength: In the majority of units across both jurisdictions, the coupling degree exceeds 0.9, indicating strong interrelationships among the water resource, ecological, and economic subsystems. However, the absolute level of T remains very low, with mean values of 0.09 in Tongliao and 0.13 in Xing’an; this approximately 30% difference is the fundamental reason why the mean D in Tongliao, approximately 0.284, is substantially lower than that in Xing’an, approximately 0.331. The receiving area is therefore trapped in a low-level equilibrium, in which the three subsystems are strongly coupled but all exhibit relatively low development levels. An increase in the overall strength of the three subsystems, as reflected by T, is therefore a prerequisite to high-level coordination.
(2) Two modes of interannual dynamics: D in Tongliao follows a sharp sawtooth trajectory, declining by 7.5% in 2024 during an extreme drought before recovering by 22% in 2025, which shows that coordinated development is highly dependent on natural precipitation and lacks engineered resilience. In contrast, D in Xing’an remained within a narrow range of 0.31–0.33, with an interannual standard deviation only 40% that of Tongliao. The offsetting effects among its subsystems, characterized by a declining economy, improving ecology, and stable water resources, provide the system with strong resilience.
(3) Diagnosis of the extreme units: The water resource index in Horqin Left Wing Middle Banner in Tongliao and Jalaid Banner in Xing’an has remained effectively close to zero over the years, at around 10⁻⁷, while the coupling degree declines to 0.02–0.03, reducing the annual mean of the corresponding jurisdiction by approximately 0.02–0.03. The underlying causes, however, differ between the two units. Horqin Left Wing Middle Banner is weak across all three dimensions and therefore requires systemic reconstruction to improve its trivariate matching, whereas Jalaid Banner retains a viable economic and ecological base, with T of about 0.083, and therefore requires targeted improvements in water resources. In Jalaid Banner, activating water resources through small-scale water conservancy works could improve its trivariate matching substantially.
(4) Regional differences in the limiting dimension: The primary bottleneck in Tongliao is the ecological subsystem, whose annual mean index is only 0.065–0.089 and falls to zero in several years, with its sharp fluctuations serving as the principal cause of changes in D. In Xing’an, the main bottleneck is the structural mismatch in water resources, with relatively high ecological and economic scores but a low water resource score. Tongliao should therefore give priority to strengthening its ecosystem, and establish an emergency ecological water replenishment mechanism for ecologically fragile areas during drought years, whereas Xing’an should focus on improving water resource utilization efficiency.
5. Conclusions
(1) The bivariate matching patterns are clearly differentiated, with water resources–ecology imbalance representing a shared weakness in both jurisdictions. Analysis based on the Gini coefficient and Lorenz asymmetry coefficient shows that, after the implementation of the Chao-Liao Project, the water resources–economy and economy–ecology matching degrees in the receiving area were generally good, whereas the water resources–ecology matching degree was markedly lower. The water resources–economy matching degree in Xing’an was substantially higher than that in Tongliao, whereas its economy–ecology matching degree was poorer. In Tongliao, the water resources–ecology Lorenz asymmetry coefficient remained below 1 throughout the study period, indicating that water-scarce and ecologically fragile units exerted a stronger downward influence on the overall matching pattern.
(2) The overall trivariate matching remains at a low level and exhibits two distinct spatial patterns. The coupling coordination degree in the receiving area is progressing from severe disorder through near disorder toward marginal coordination, with the low level of the comprehensive evaluation index T serving as the primary constraint. Tongliao demonstrates low-level and highly volatile matching, with a strong reliance on natural conditions and limited resistance to disturbances. Xing’an exhibits a “stable but structurally mismatched” pattern. Although it demonstrates stronger systemic resilience, the spatial mismatch among water resources, the economy, and ecology has prevented overall coordination effectiveness from improving in tandem with economic growth.
(3) Systemic vulnerability is exacerbated by severely constrained units and climatic disturbances. The water resource subsystem index has remained close to zero over the years in Horqin Left Wing Middle Banner and Jalaid Banner, while the coupling degree has fallen below 0.05, reducing the annual mean D of each jurisdiction by approximately 0.02–0.03. The underlying causes differ between the two units: Horqin Left Wing Middle Banner is weak across all three dimensions (economic, ecological, and water resources) and therefore requires systemic reconstruction, whereas Jalaid Banner still has an economic and ecological foundation, with water resources representing its primary constraint. Therefore, improving water availability through small-scale water conservancy projects could substantially enhance the trivariate matching degree in Jalaid Banner. The sharp decline in coordination observed in Tongliao in 2024 during the extreme drought indicates that the lack of engineered ecological protection has evolved into a system-wide risk.
(4) Differentiated measures targeting specific shortcomings are key to breaking the cycle of disorder. To reduce interannual fluctuations among the three subsystems, Tongliao should prioritize strengthening its ecosystem, and establish an emergency water replenishment mechanism for ecologically fragile regions during drought years. Xing’an should focus on improving water resource utilization efficiency.
Funding
This research was funded by IWHR Research & Development Support Program (MKZL2024JK013).
Data Availability Statement
The data presented in this study are available on request from the corresponding author. The data are not publicly available due to privacy.
Acknowledgments
The authors also gratefully acknowledge the comments and suggestions of the anonymous reviewers.
Conflicts of Interest
The authors declare no conflicts of interest.
References
- HAN Z H, Z.Y.F., WANG H Q, JIAO R, LIANG W T, JI G, Isotopic distribution characteristics of precipitation, surface water and groundwater in an arid and semi-arid desertified steppe region: a case study of Darhan Muminggan United Banner. Sci. Technol. Eng. 2020, 20(28), 11463–11471.
- XIA J, Z.Y.Z. The measurement of water resources security: research and challenges on water resources carrying capacity. J. Nat. Resour. 2002, 3, 262–269. [Google Scholar]
- LIU C M, W.H.R., Analysis of the relationship between water resources and population, the economy and the social environment. J. Nat. Resour. 2003, 5, 635–644.
- SUN Z, J.S.F.; YAN, J. B.; ZHU, W. B.; LIANG, Y. Matching of the underlying endowments of water and land resources in China. J. Nat. Resour. 2018, 33(12), 2057–2066. [Google Scholar]
- WANG R M, M.H.L., WANG J, Spatiotemporal differentiation of agricultural carbon emissions and its influencing factors from the perspective of water and land resource matching: the case of the Yangtze River Economic Belt. Resour. Sci. 2019, 41(8), 1450–1461.
- WANG J H, H.G.H., HE F, ZHAO Y, WANG H Y, LI H H, ZHU Y N, LIU H Q, Characteristics and matching analysis of water and land resources development and utilization in China. South-To-North Water Transf. Water Sci. Technol. 2019, 17(4), 1–8.
- WANG H, L.J.H. Coordinated allocation of national water resources and the socioeconomic system. China Water Resour. 2016, 17, 7–9. [Google Scholar]
- ZUO Q T, H.C.H., MA J X, WANG X, Theory, methods and research framework for spatial equilibrium of water resources. Yellow River 2019, 41(10), 113–118.
- JIN J L, L.J.Q., WU C G, HE J, GUO X N, ZHANG H Y, CHEN M L, CHEN L, Research progress on spatial equilibrium of water resources. J. North China Univ. Water Resour. Electr. Power (Natural Science Edition) 2019, 40(6), 47–60.
- D, W.Y. Balanced development of regional water resources and the socioeconomic system and the associated market mechanisms; Zhengzhou University, 2017. [Google Scholar]
- KANG X L, Y.P.B., Spatial equilibrium analysis of water resources in Zhengzhou and Luoyang based on the imbalance index. Henan Water Resour. South-To-North Water Divers. 2019, 48(4), 33–35+56.
- DAMGAARD C, W.J. Describing inequality in plant size or fecundity. Ecology 2000, 81(4), 4. [Google Scholar] [CrossRef]
- BARRETT C R, S.M. On a generalization of the Gini coefficient. Math. Soc. Sci. 1995, 31(1), 1. [Google Scholar] [CrossRef]
- HE J, H.X.F. Evaluation of the non-equilibrium of regional water resources. J. Hohai Univ. (Natural Sciences) 2013, 41(2), 130–135. [Google Scholar]
- HE Z X, Q.P., RUAN C J, XIE M, The Lorenz curve and its application in plant ecology research. J. Nanjing For. Univ. (Natural Sciences Edition) 2004, 28(1), 37–41.
- LIU X Y, S.Z.T., TANG J Y, HUANG J, Application of the Gini coefficient to climate evaluation of human settlements. Trop. Geogr. 2008, 28(1), 7–10+20.
- QIN D L, W.A.L., LU S Y, LUO Y P, LIAO Y H, YI M, SONG B B, Allocation of total water pollutant load in the Dongting Lake area based on the environmental Gini coefficient. Res. Environ. Sci. 2013, 26(1), 8–15.
- WANG K, Z.X.Y.; LI, Y. W. Spatial matching analysis of water resources in Gansu Province. China Rural Water Hydropower 2008, 10, 21–23. [Google Scholar]
- X, X.Y. Analysis of the Gini coefficient of water resources ecological security in the 12 districts and counties of Baoji. Agric. Res. Arid Areas 2012, 30(5), 175–179. [Google Scholar]
- JIANG N, F.Q. Spatial matching analysis of water resources in Heilongjiang Province based on the Gini coefficient. J. Northeast Agric. Univ. 2010, 41(5), 56–60. [Google Scholar]
- MENG Q S, G.Y., LIU X Y, TONG X, WANG D M, XIE G Y, LIU T X, Coupling coordination among water resources, the socioeconomy and the ecological environment and its prediction: a case study of the Inner Mongolia reach of the Yellow River Basin. Arid Zone Res. 2025, 42(4), 682–694.
- ZHANG Z Q, Z.D.J., CHEN L, GONG Z W, ZHNAG Q S, Coupling coordination between urbanization and the ecological efficiency of cultivated land use in the Yellow River Basin: evaluation, spatiotemporal characteristics and driving factors. Trans. Chin. Soc. Agric. Eng. 2024, 40(16), 240–250.
- ZHANG Y, K.S.U., SWALLLOW B, LIU W X, ZHAO M J Coupling coordination analysis of China’s water resources utilization efficiency and economic development level. J. Clean. Prod. 2022, 373, 133874. [CrossRef]
Figure 1.
Location and extent of the study area.
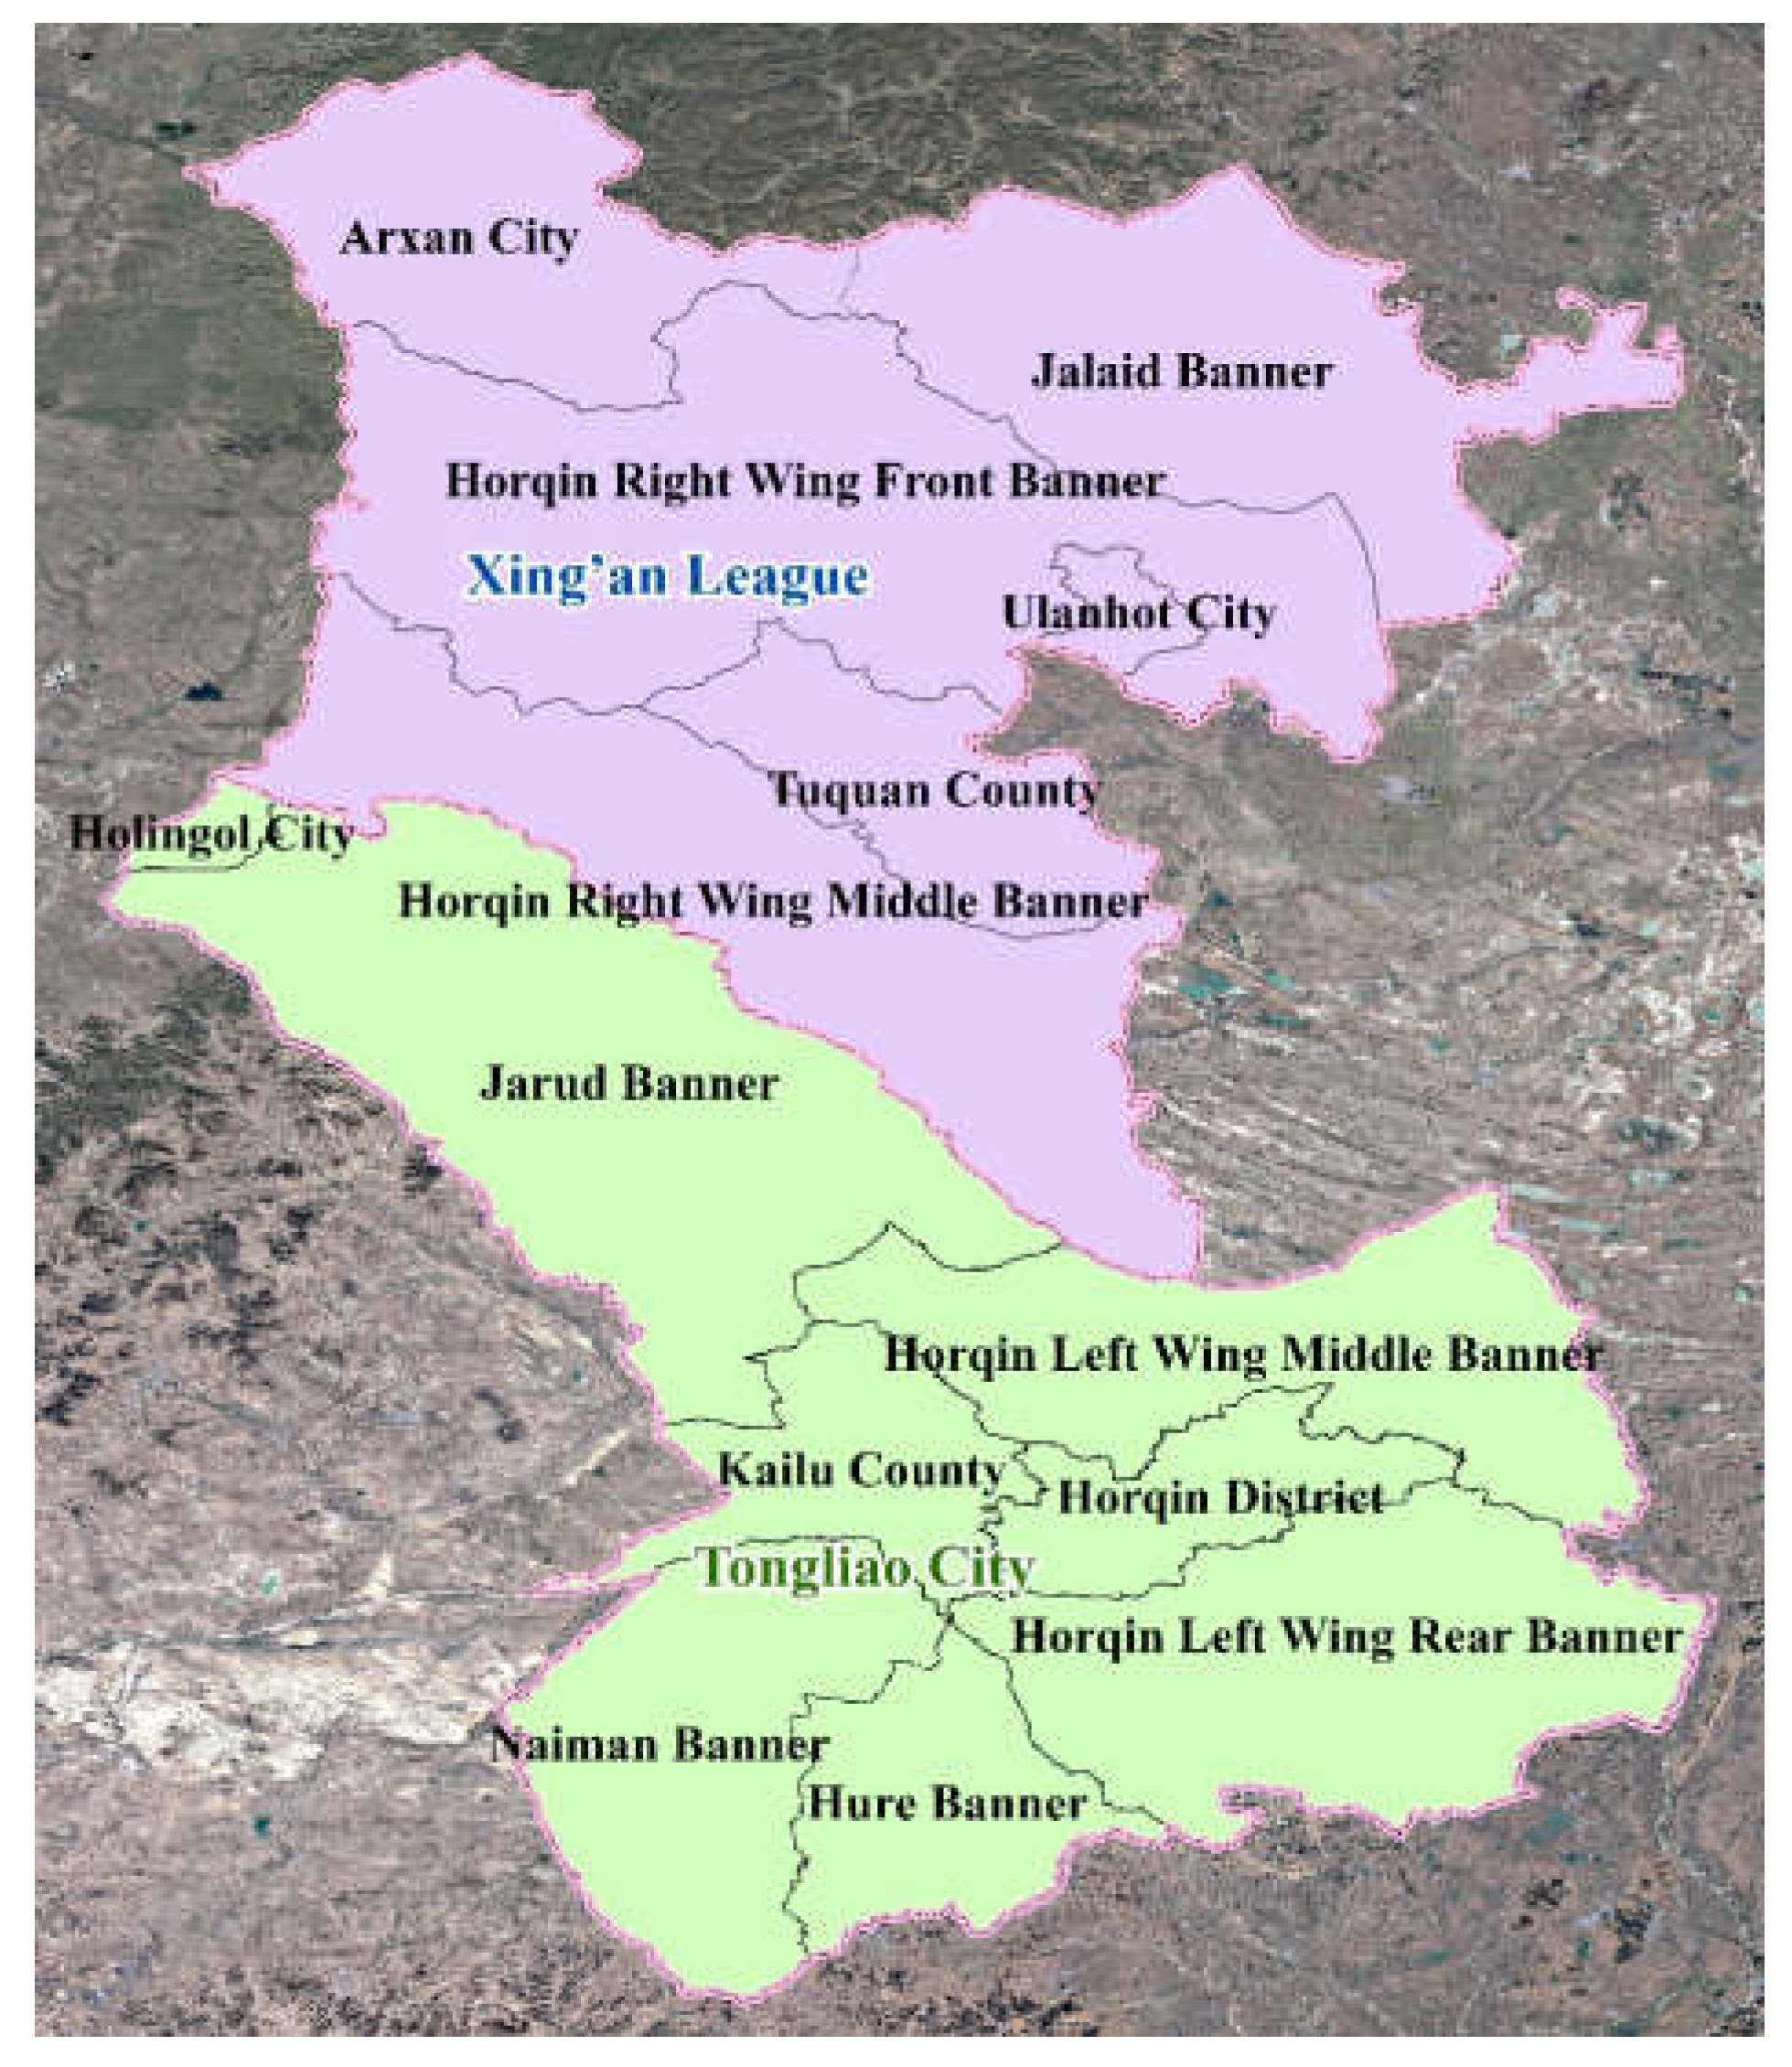
Figure 2.
Schematic of the Lorenz curve.
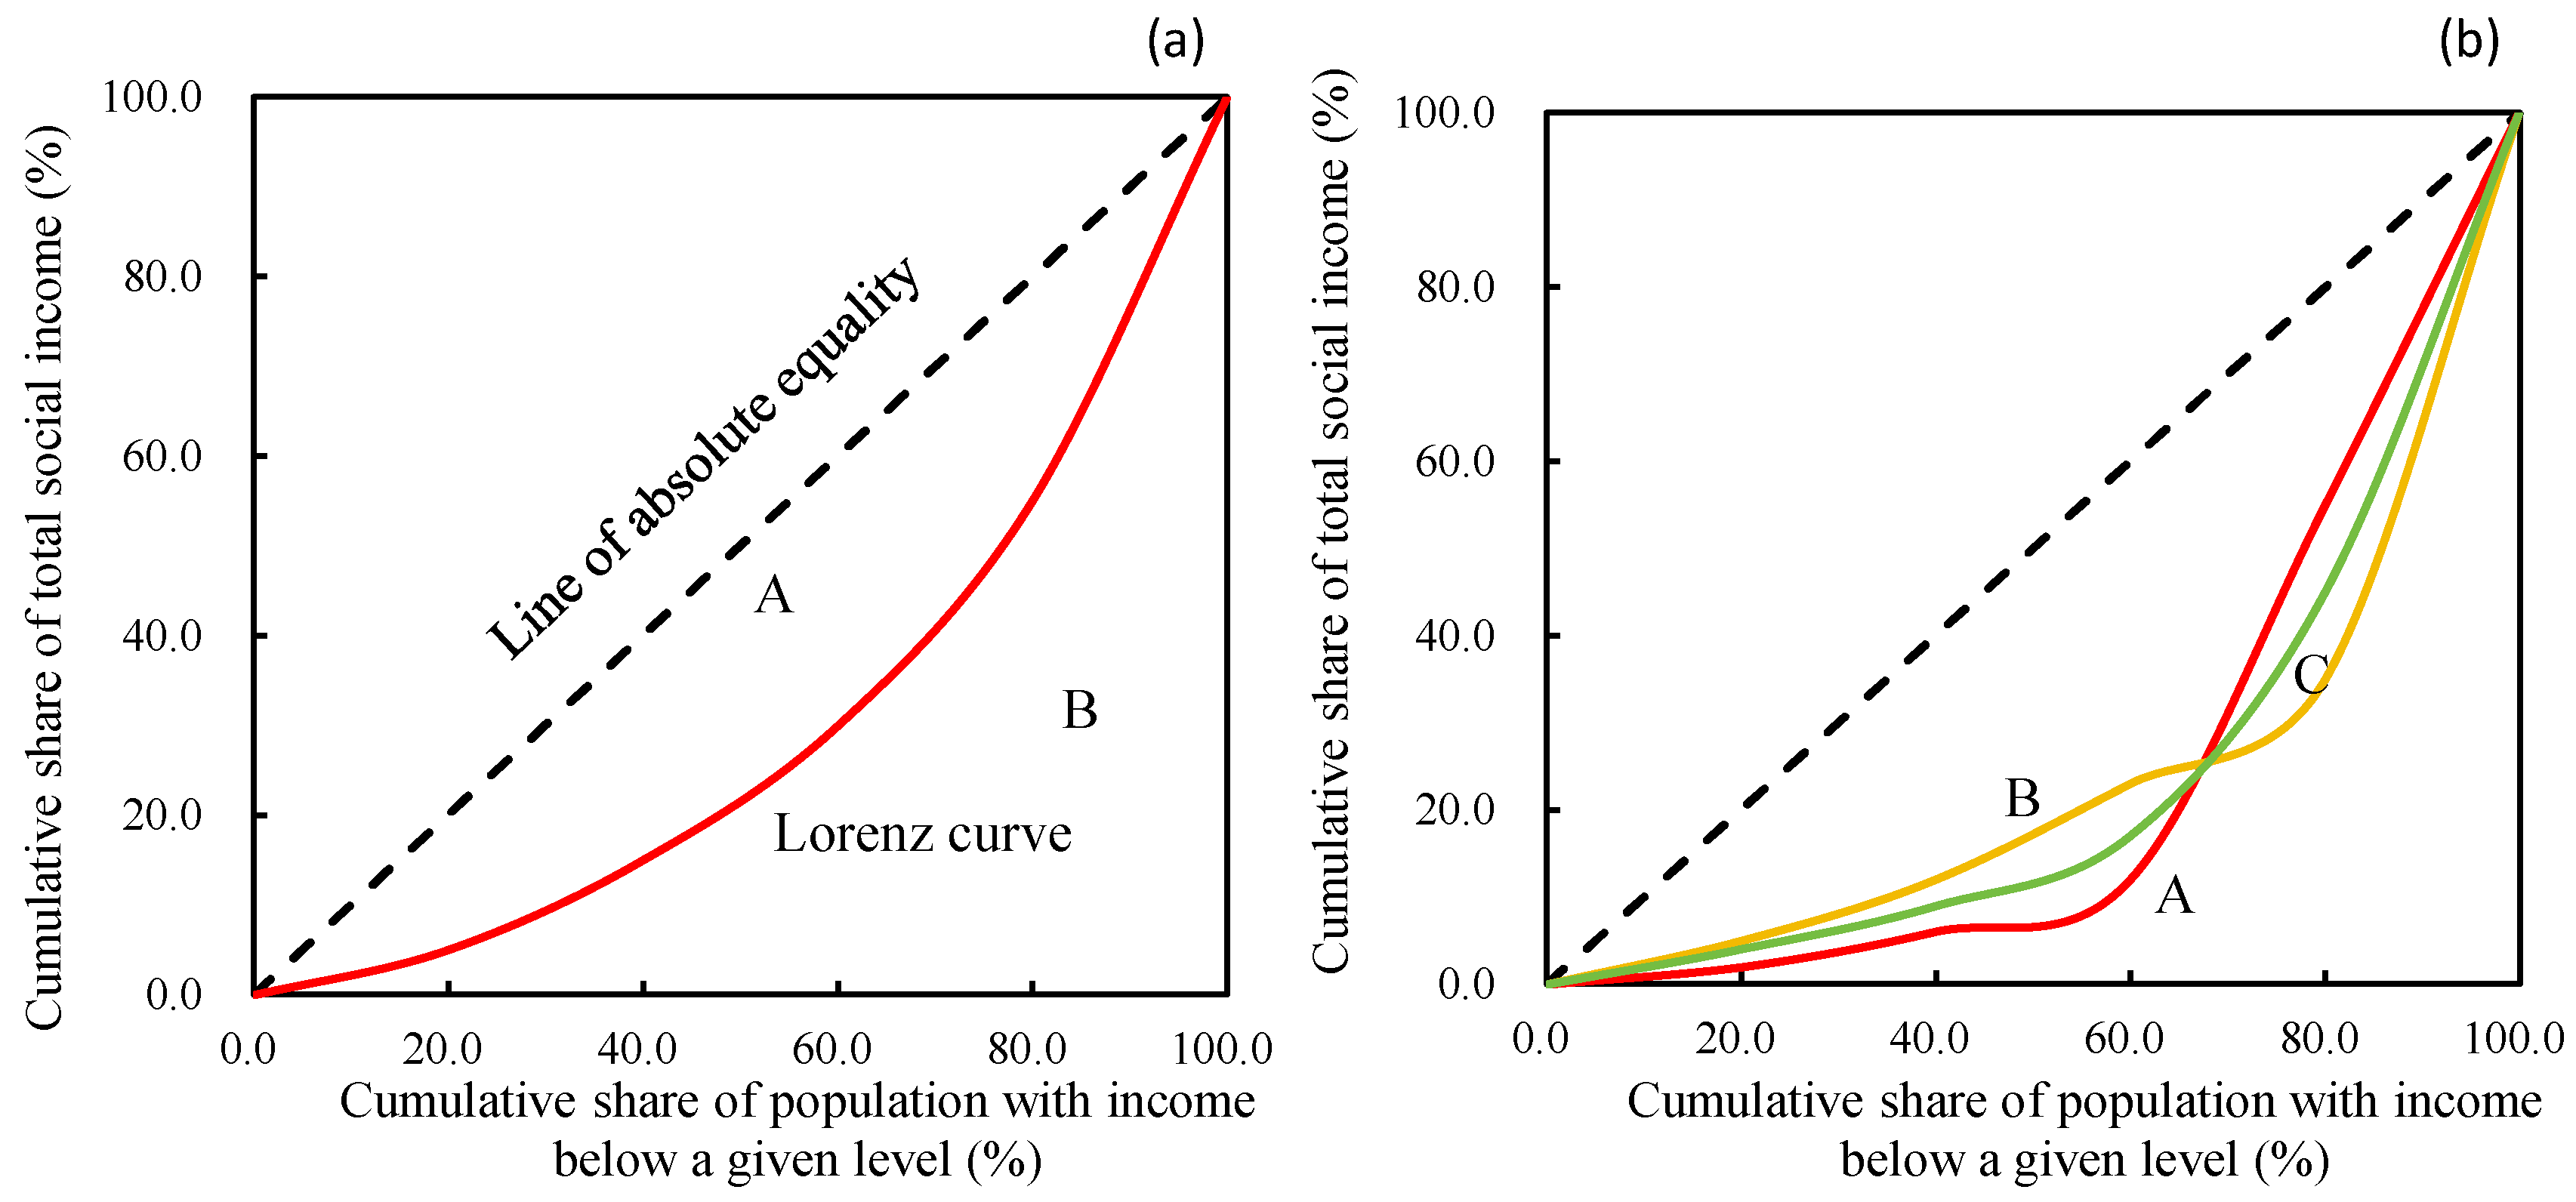
Figure 3.
Interannual variation in the Gini coefficient (G) for Tongliao and Xing’an.
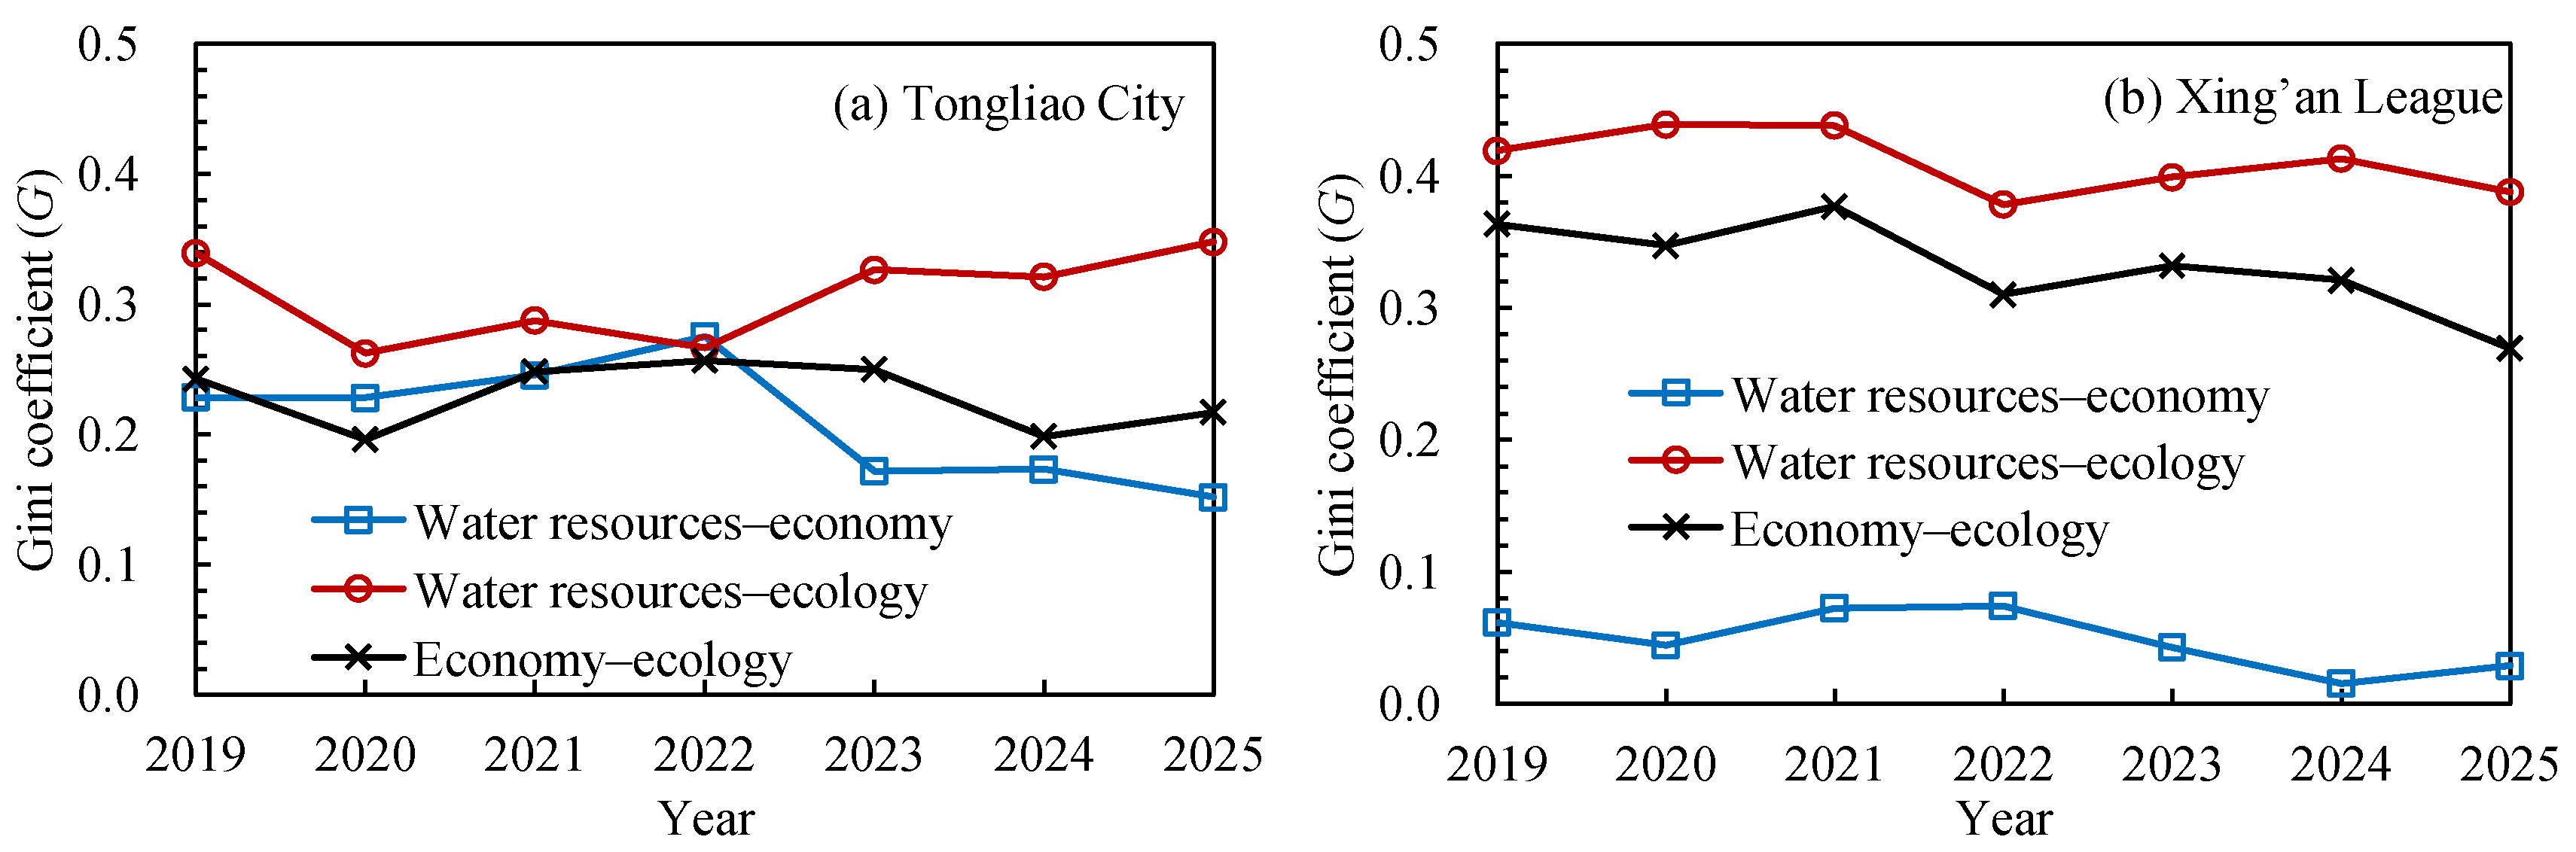
Figure 4.
Interannual variation in the Lorenz asymmetry coefficient (S) for Tongliao and Xing’an.
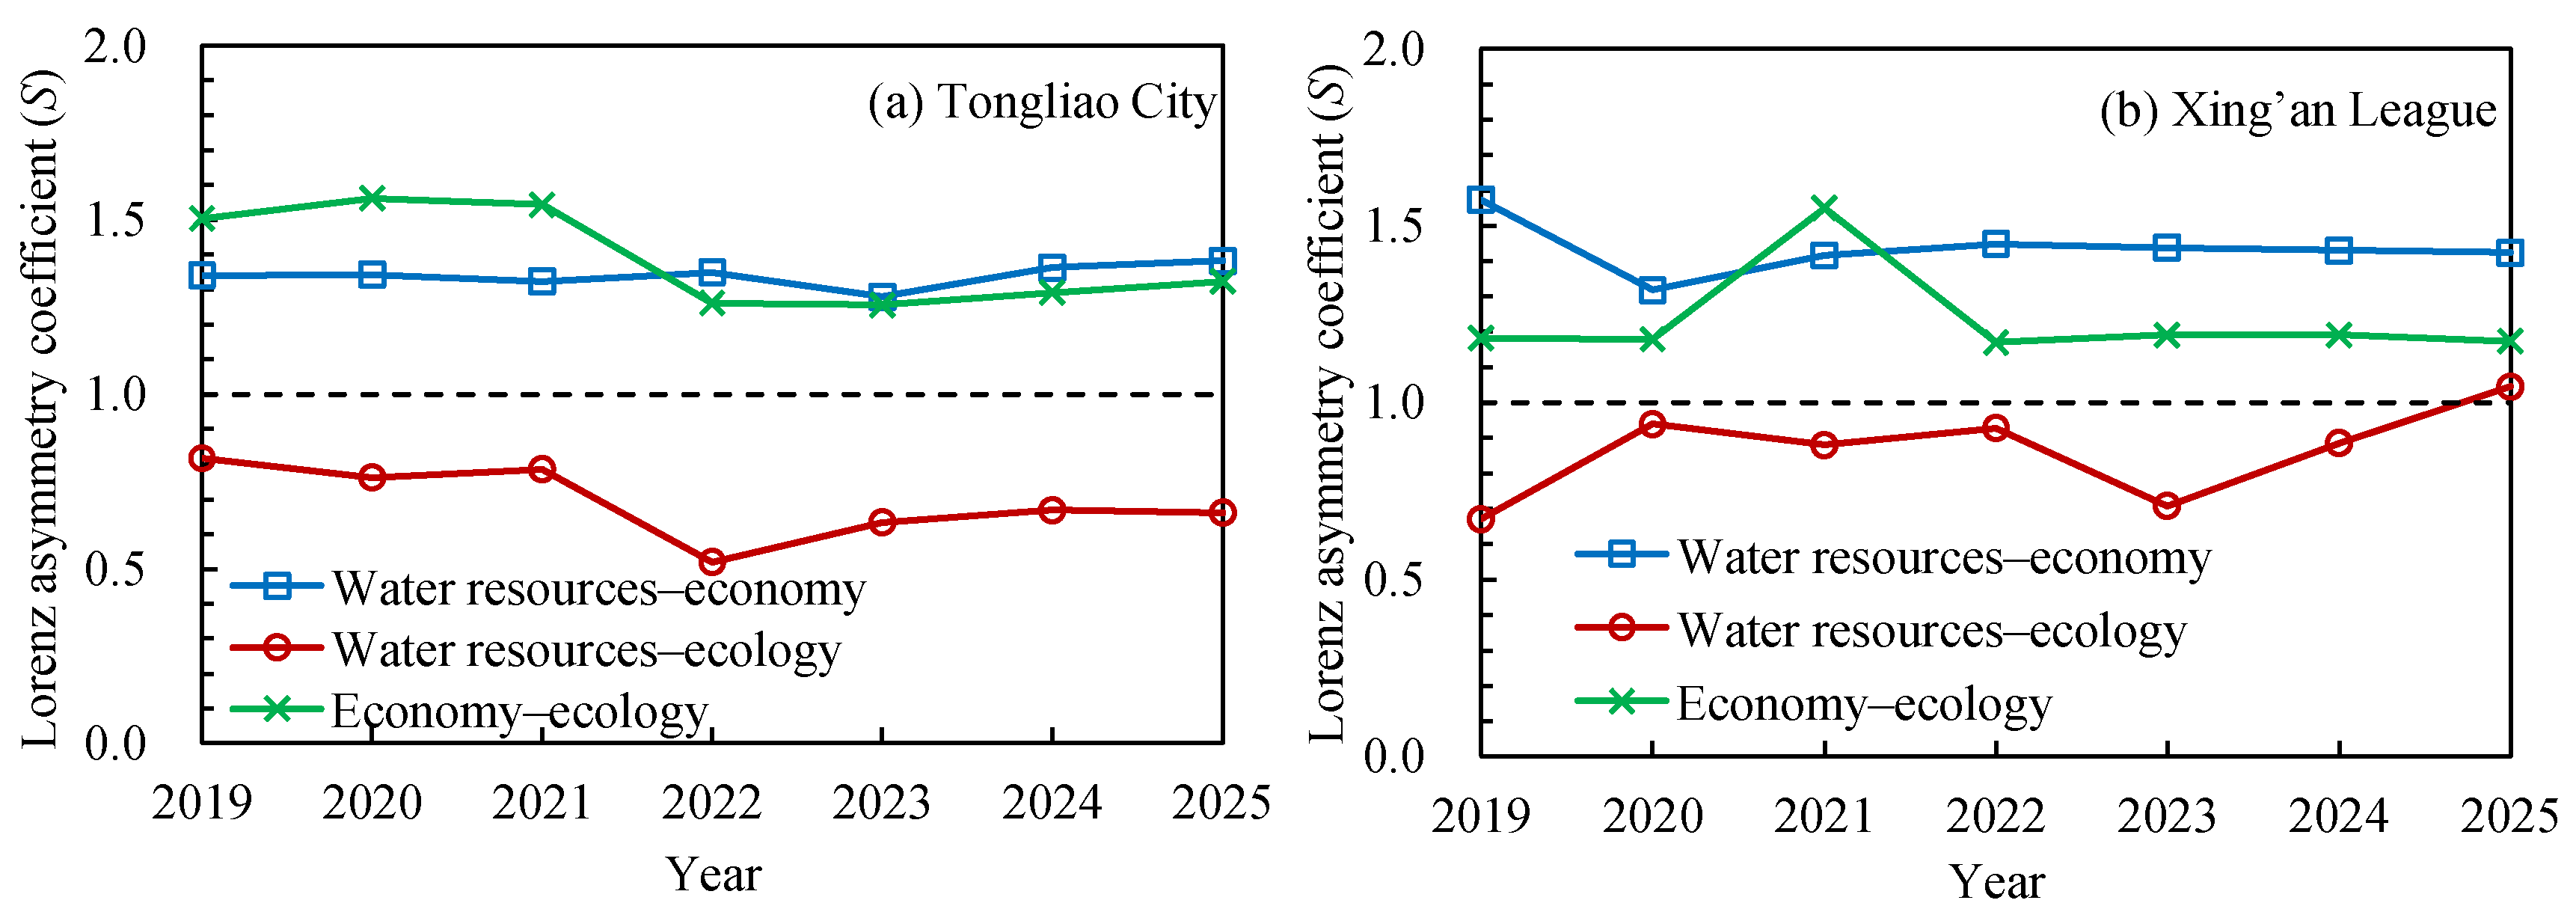
Figure 5.
Spatiotemporal variation in the economic, water resource, and ecological subsystem indices for the banners, counties, and districts of Tongliao City.
Figure 5.
Spatiotemporal variation in the economic, water resource, and ecological subsystem indices for the banners, counties, and districts of Tongliao City.
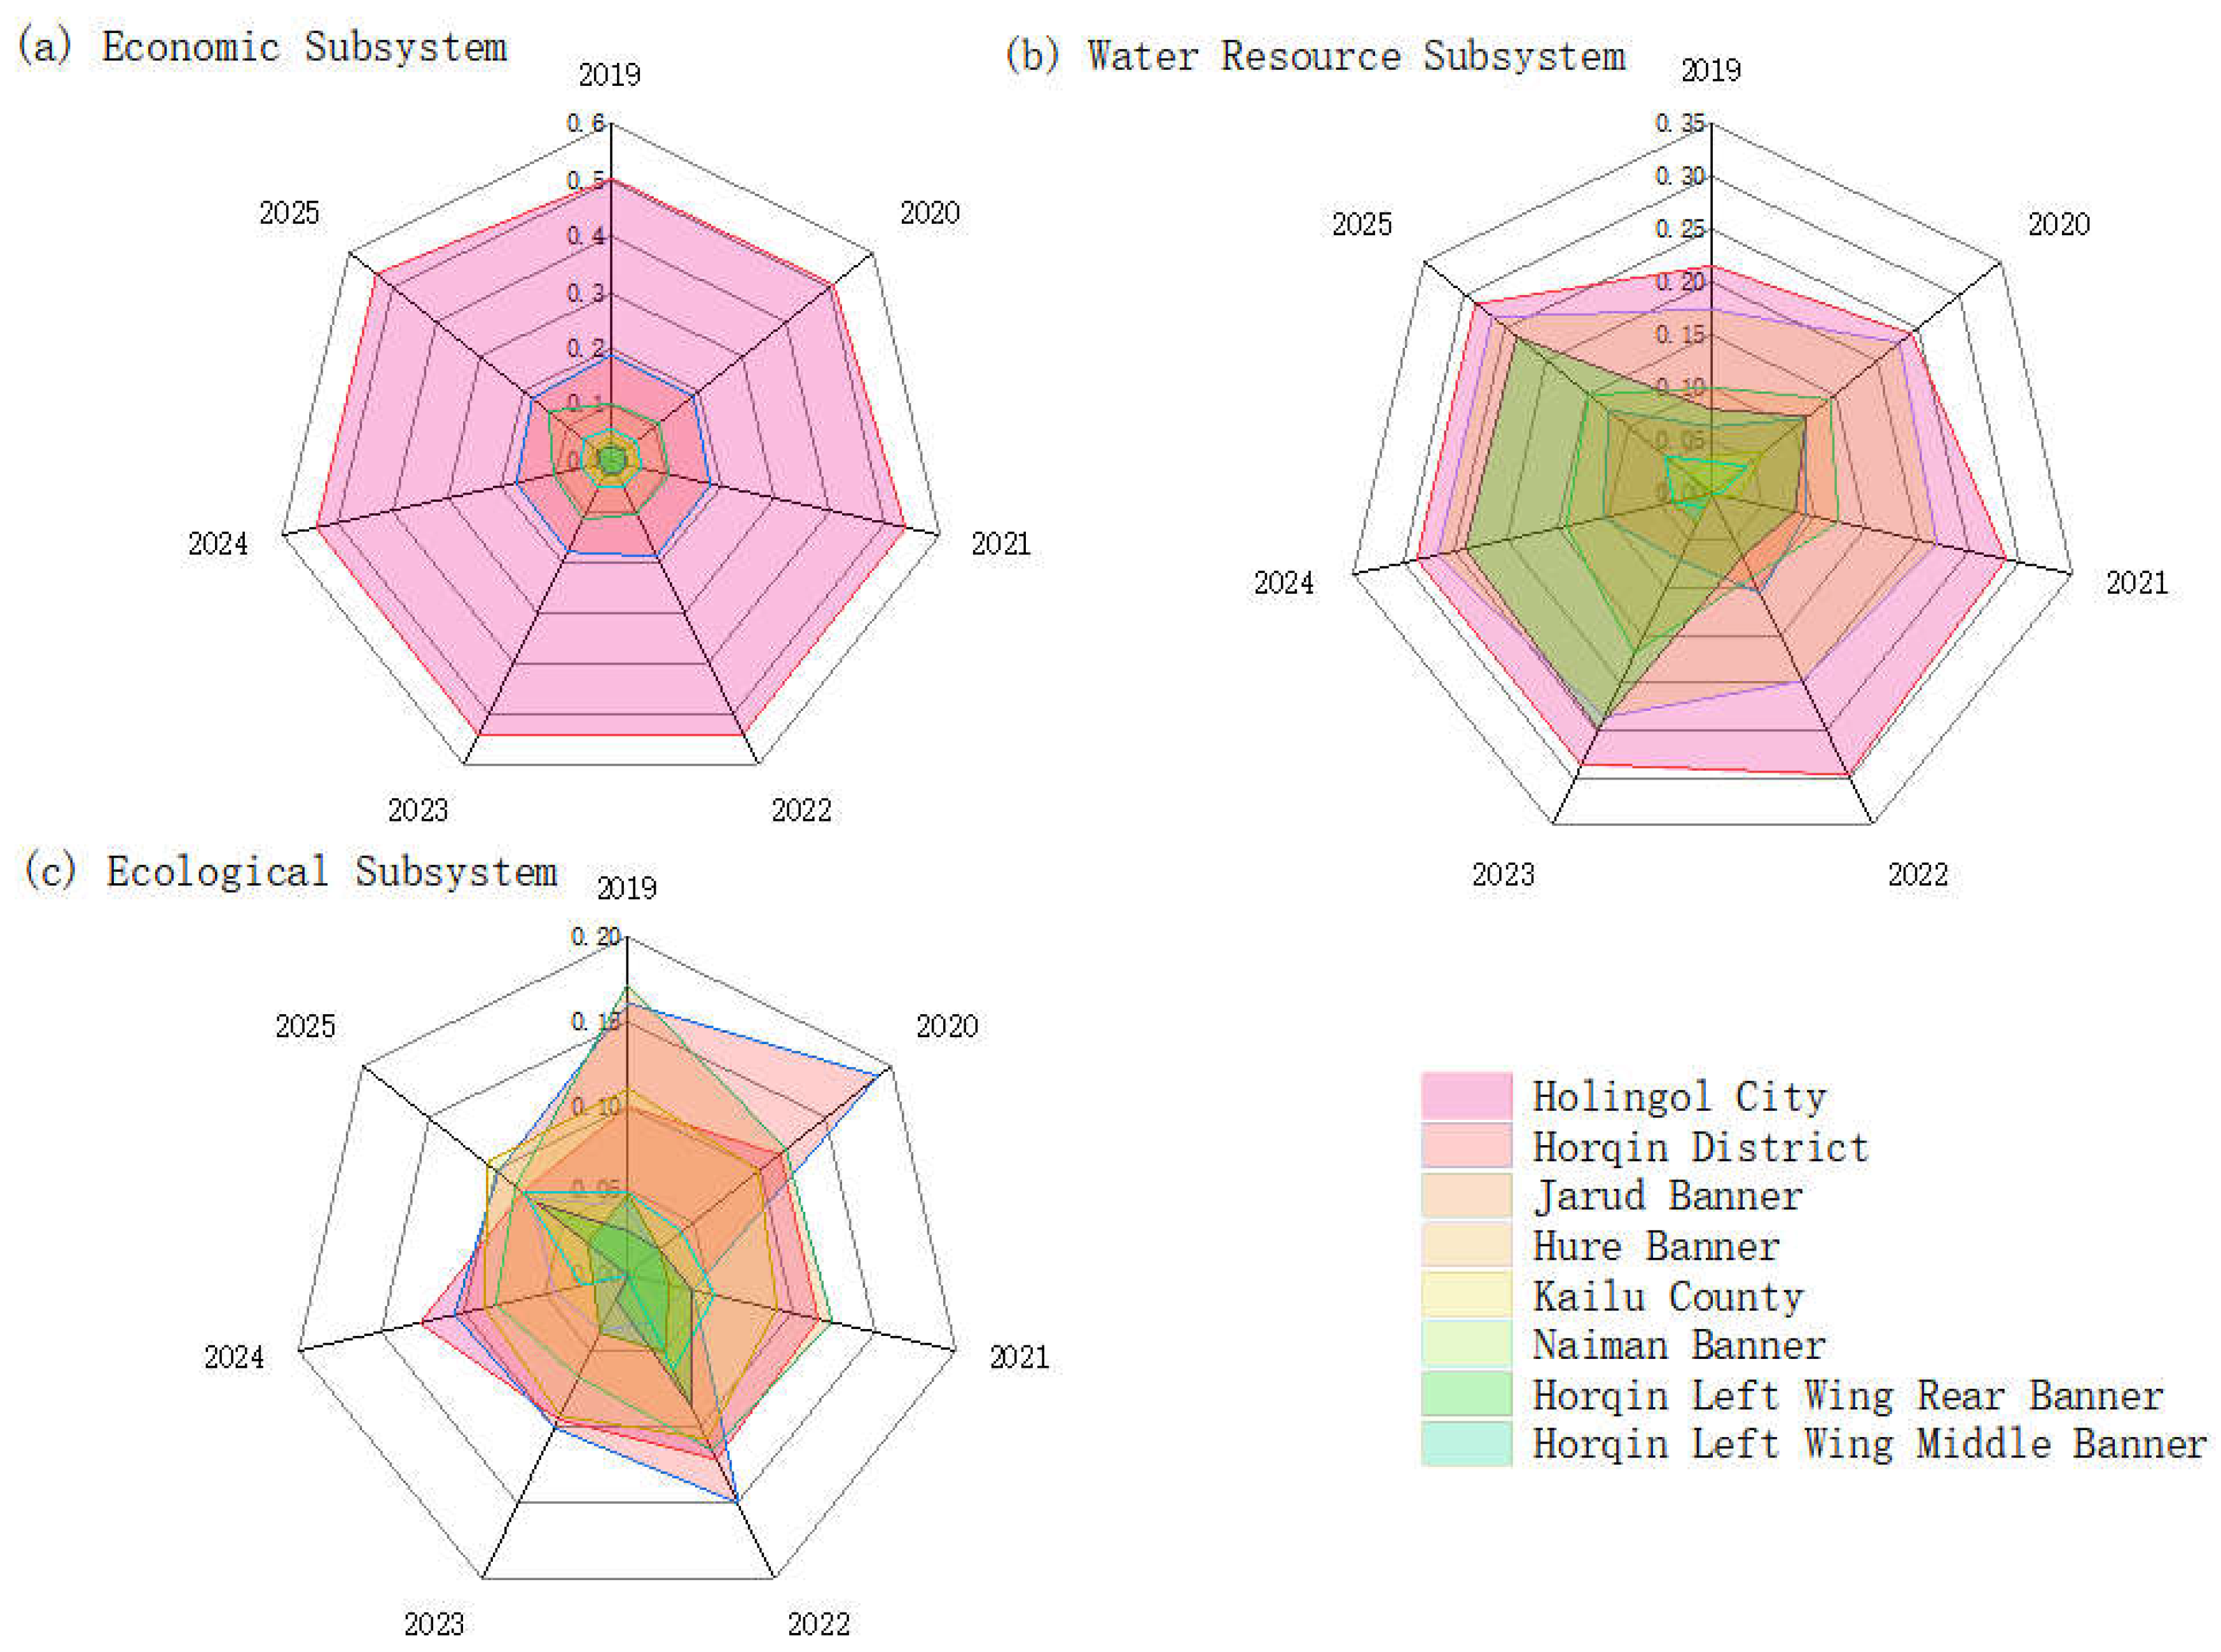
Figure 6.
Spatiotemporal variation in the economic, water resource, and ecological subsystem indices for the banners, counties, and districts of Xing’an League.
Figure 6.
Spatiotemporal variation in the economic, water resource, and ecological subsystem indices for the banners, counties, and districts of Xing’an League.
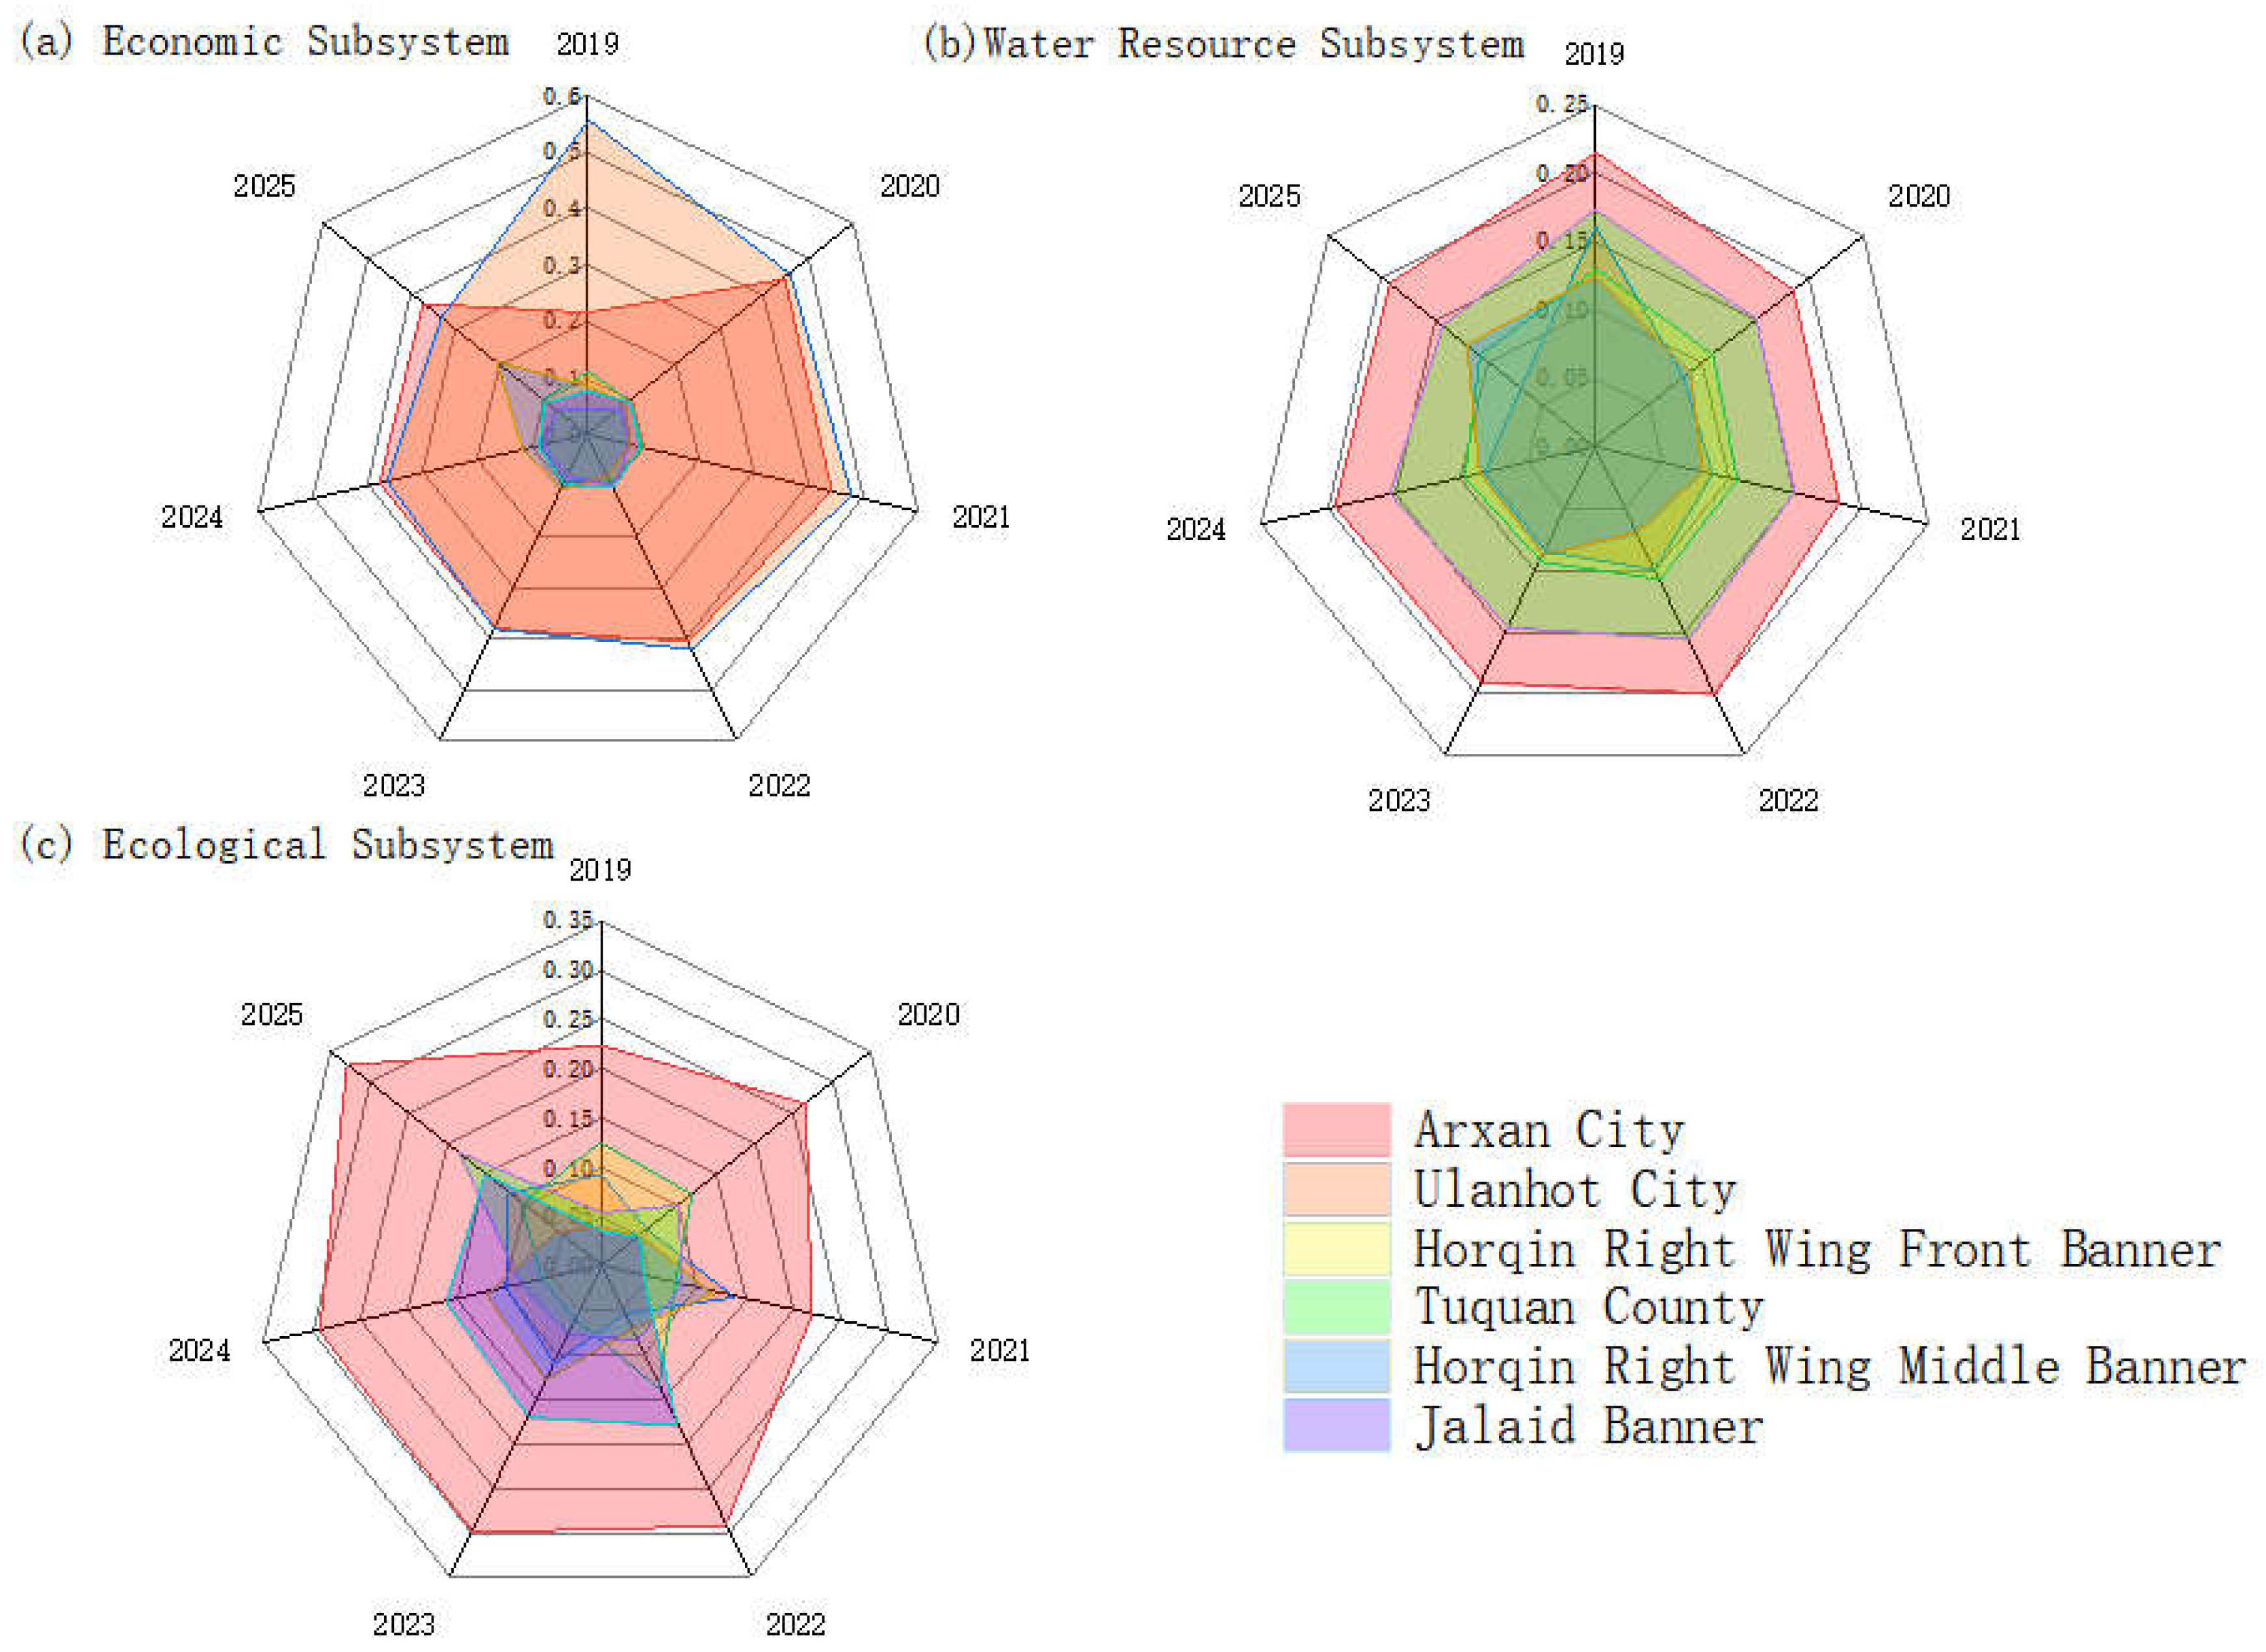
Figure 7.
Spatiotemporal variation in T for the banners, counties, and districts of Tongliao and Xing’an League.
Figure 7.
Spatiotemporal variation in T for the banners, counties, and districts of Tongliao and Xing’an League.
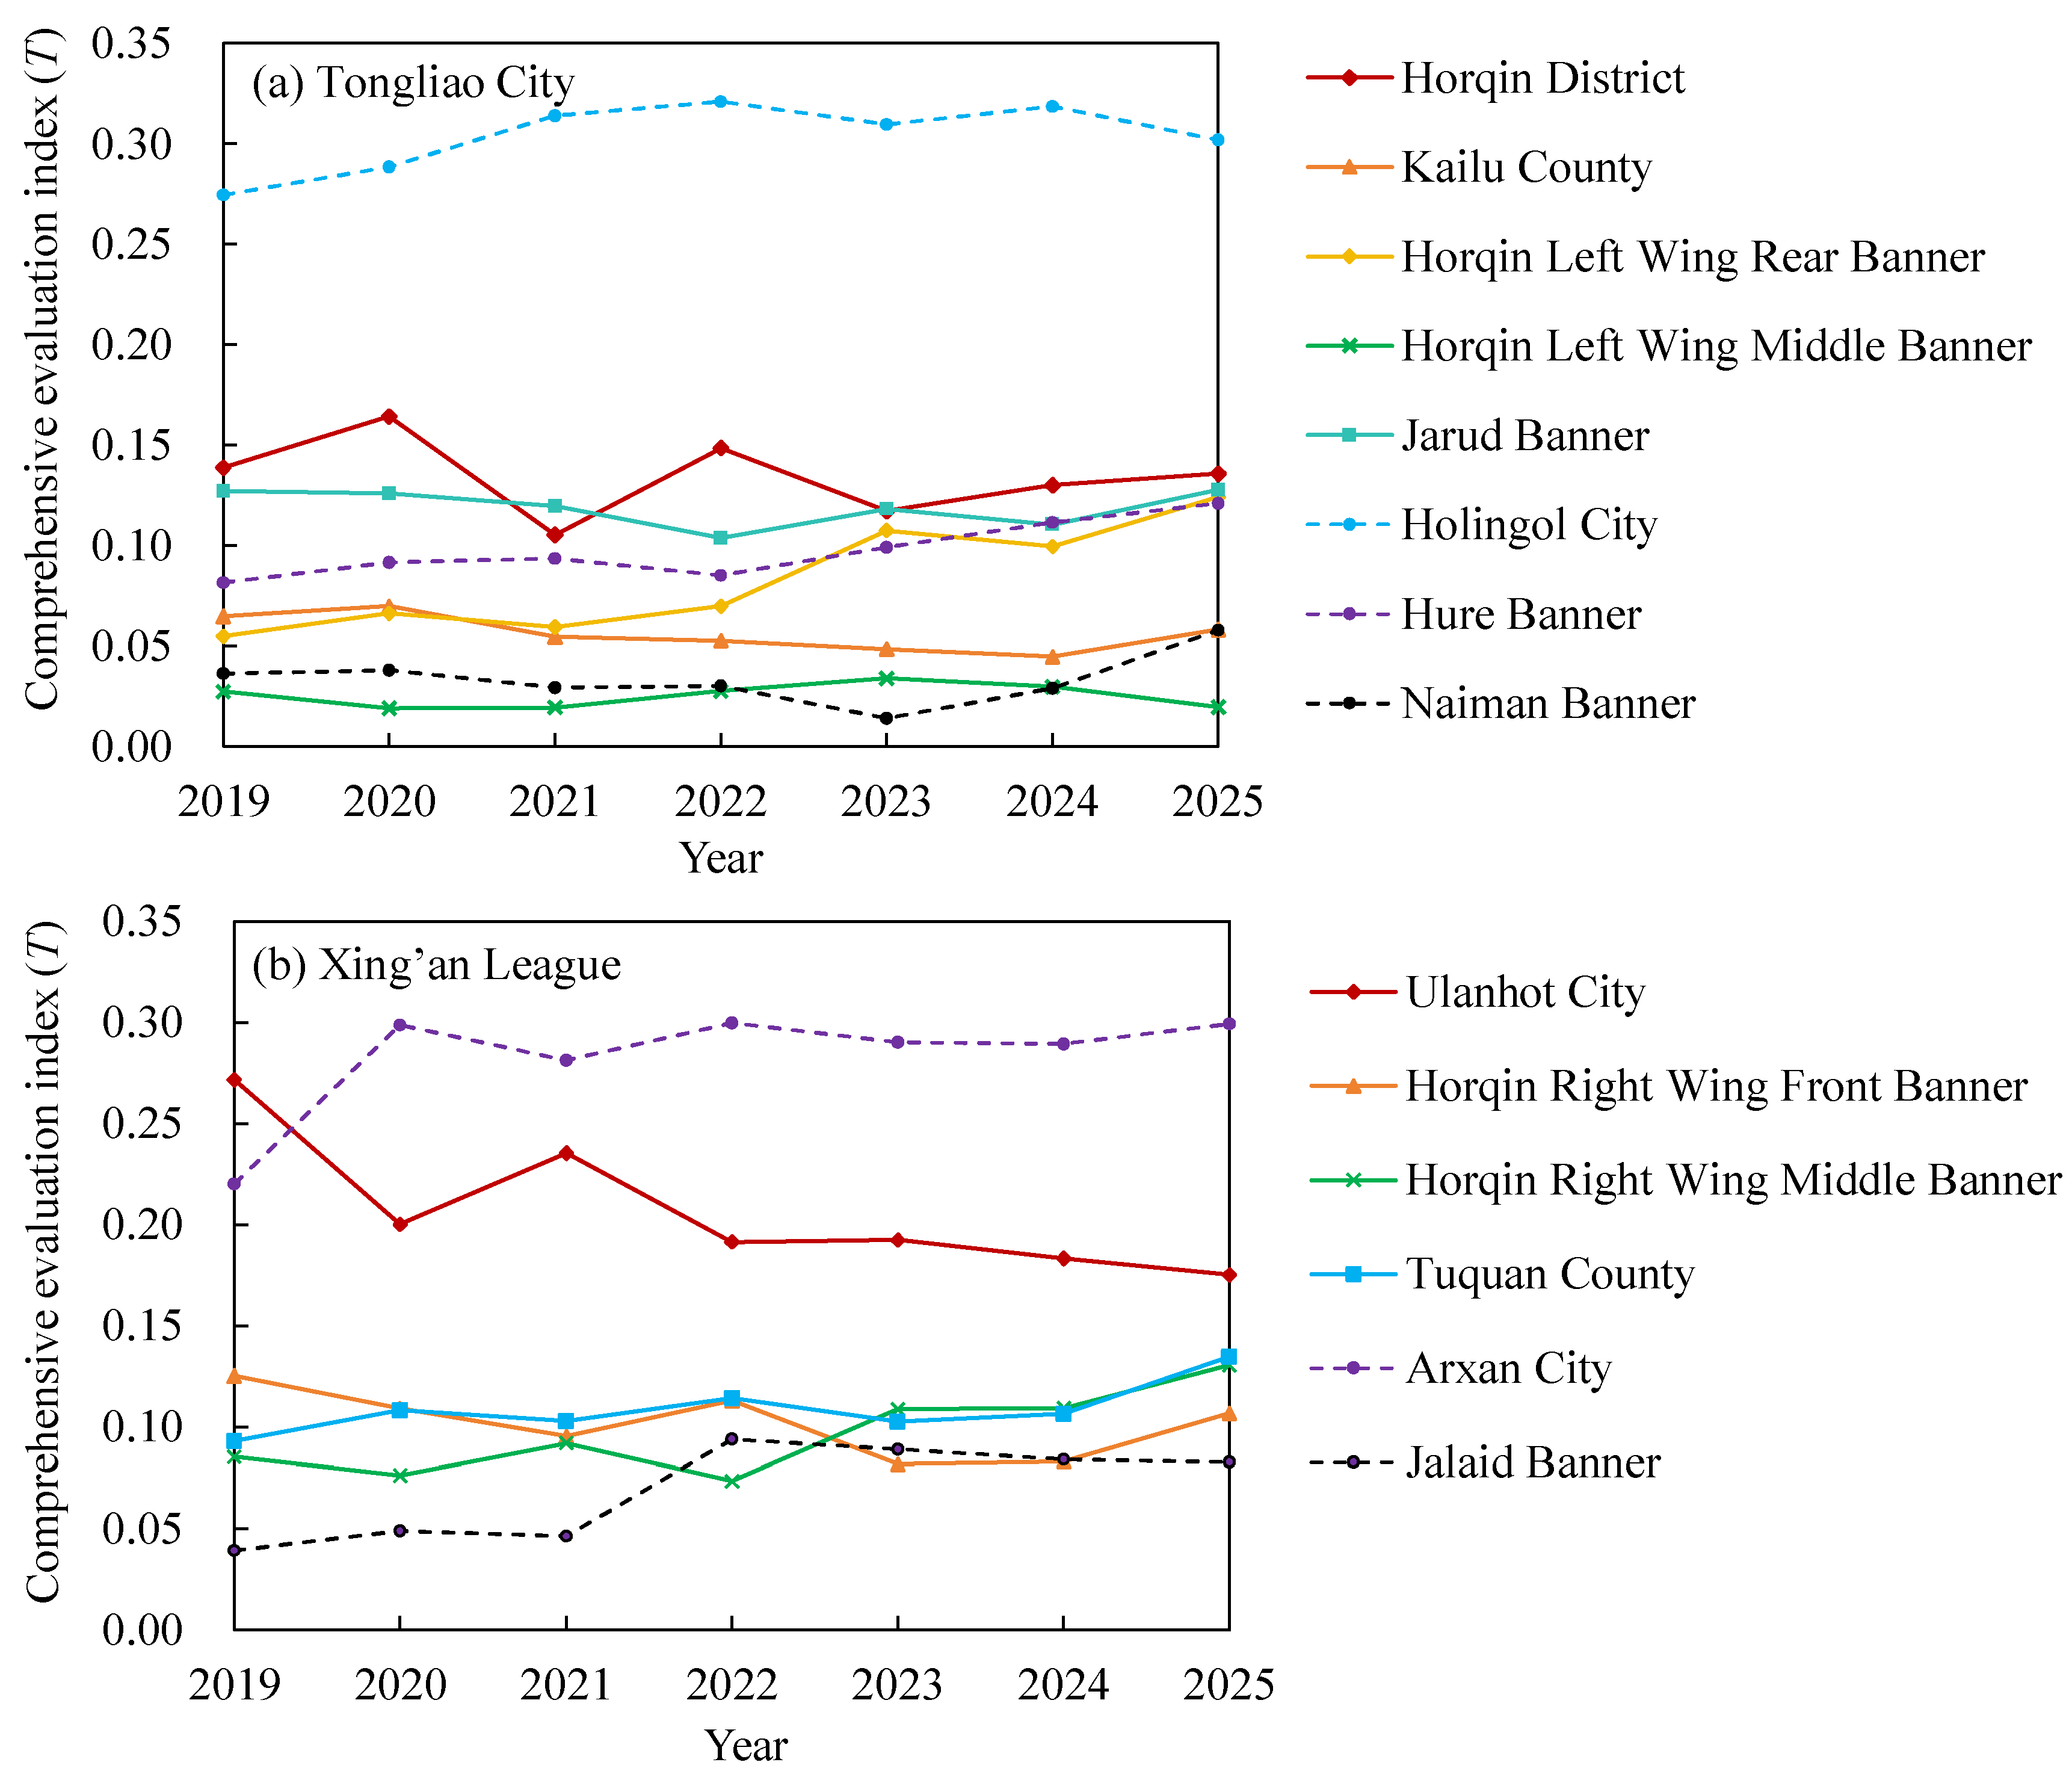
Figure 8.
Interannual variation of the league-averaged of the coupling coordination degree D.
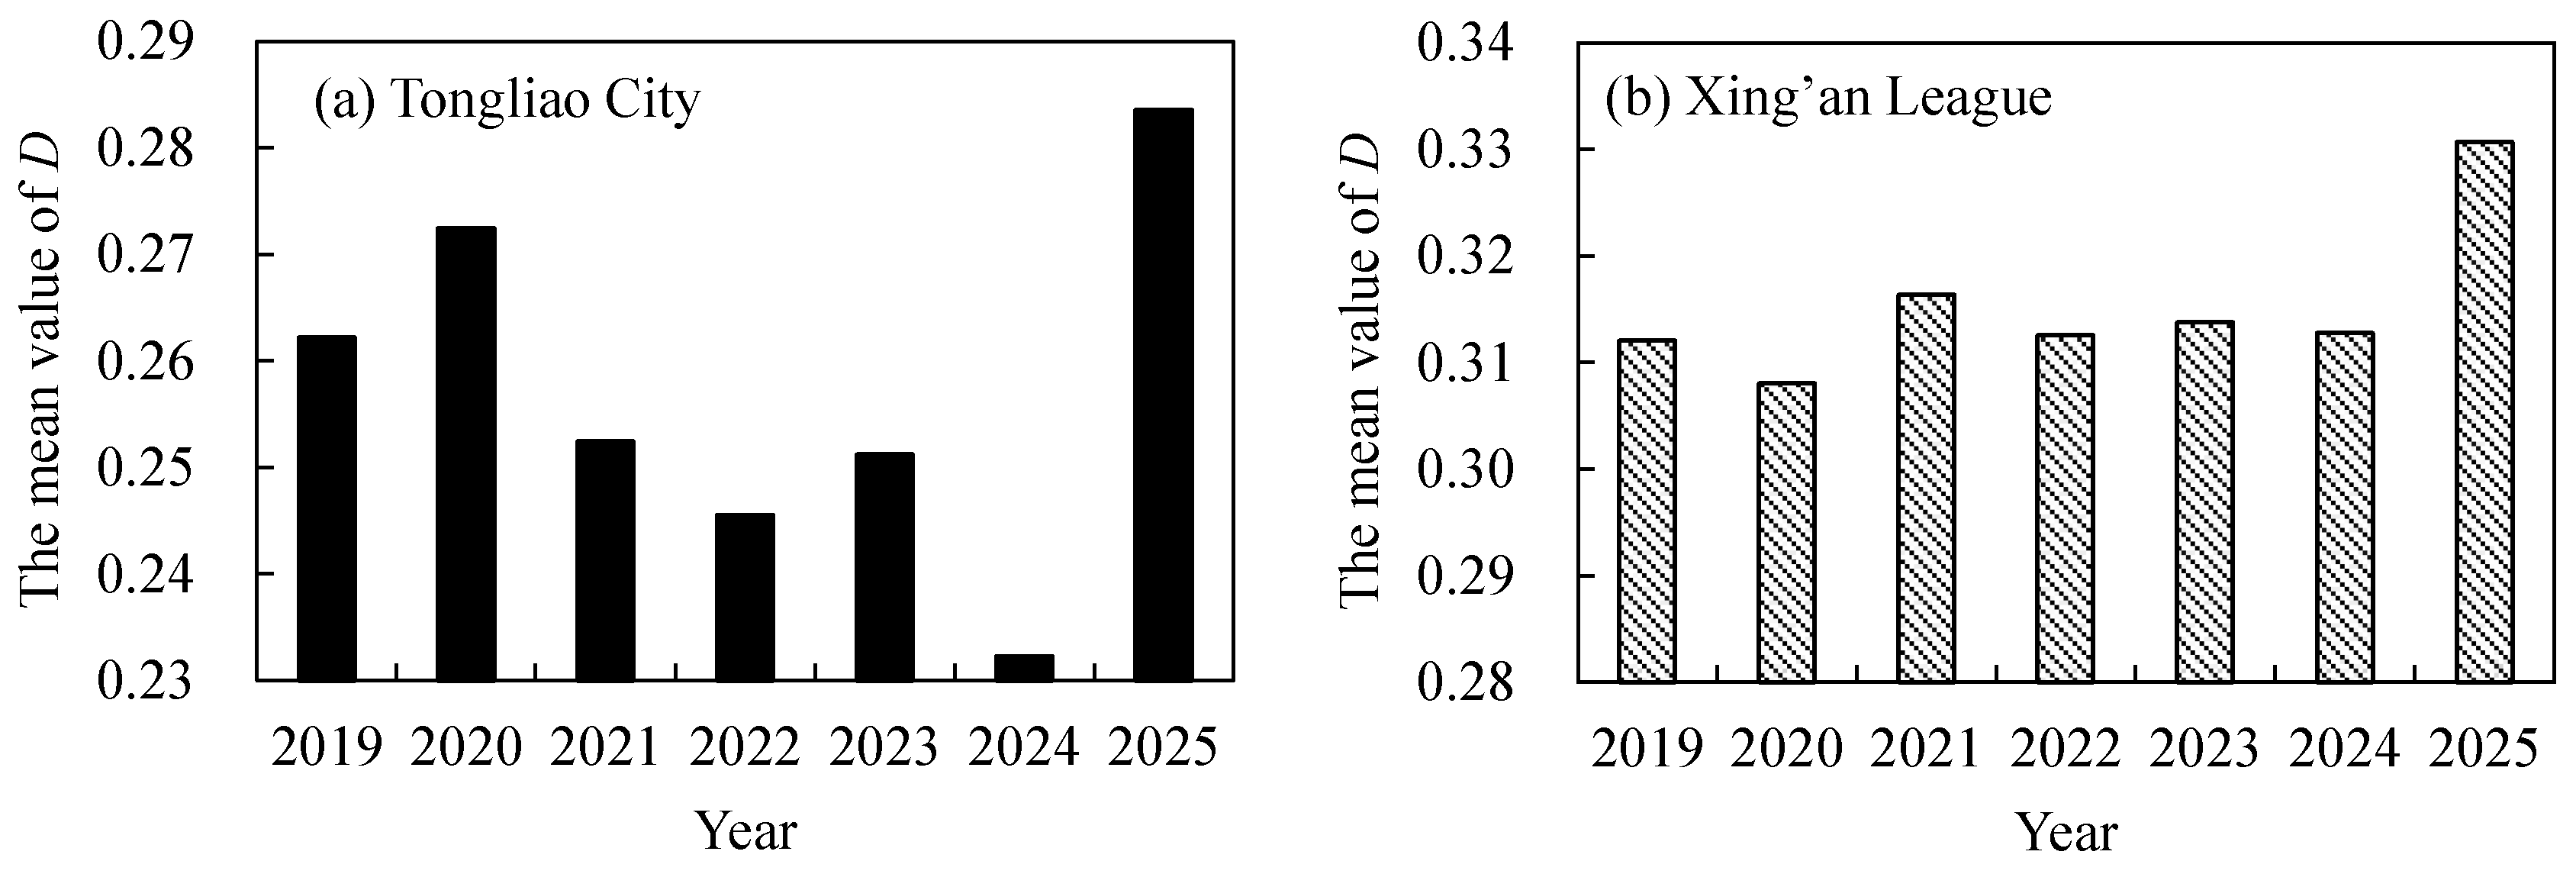
Figure 9.
Spatiotemporal variation in the coupling coordination degree (D) for the banners, counties, and districts of Tongliao City.
Figure 9.
Spatiotemporal variation in the coupling coordination degree (D) for the banners, counties, and districts of Tongliao City.
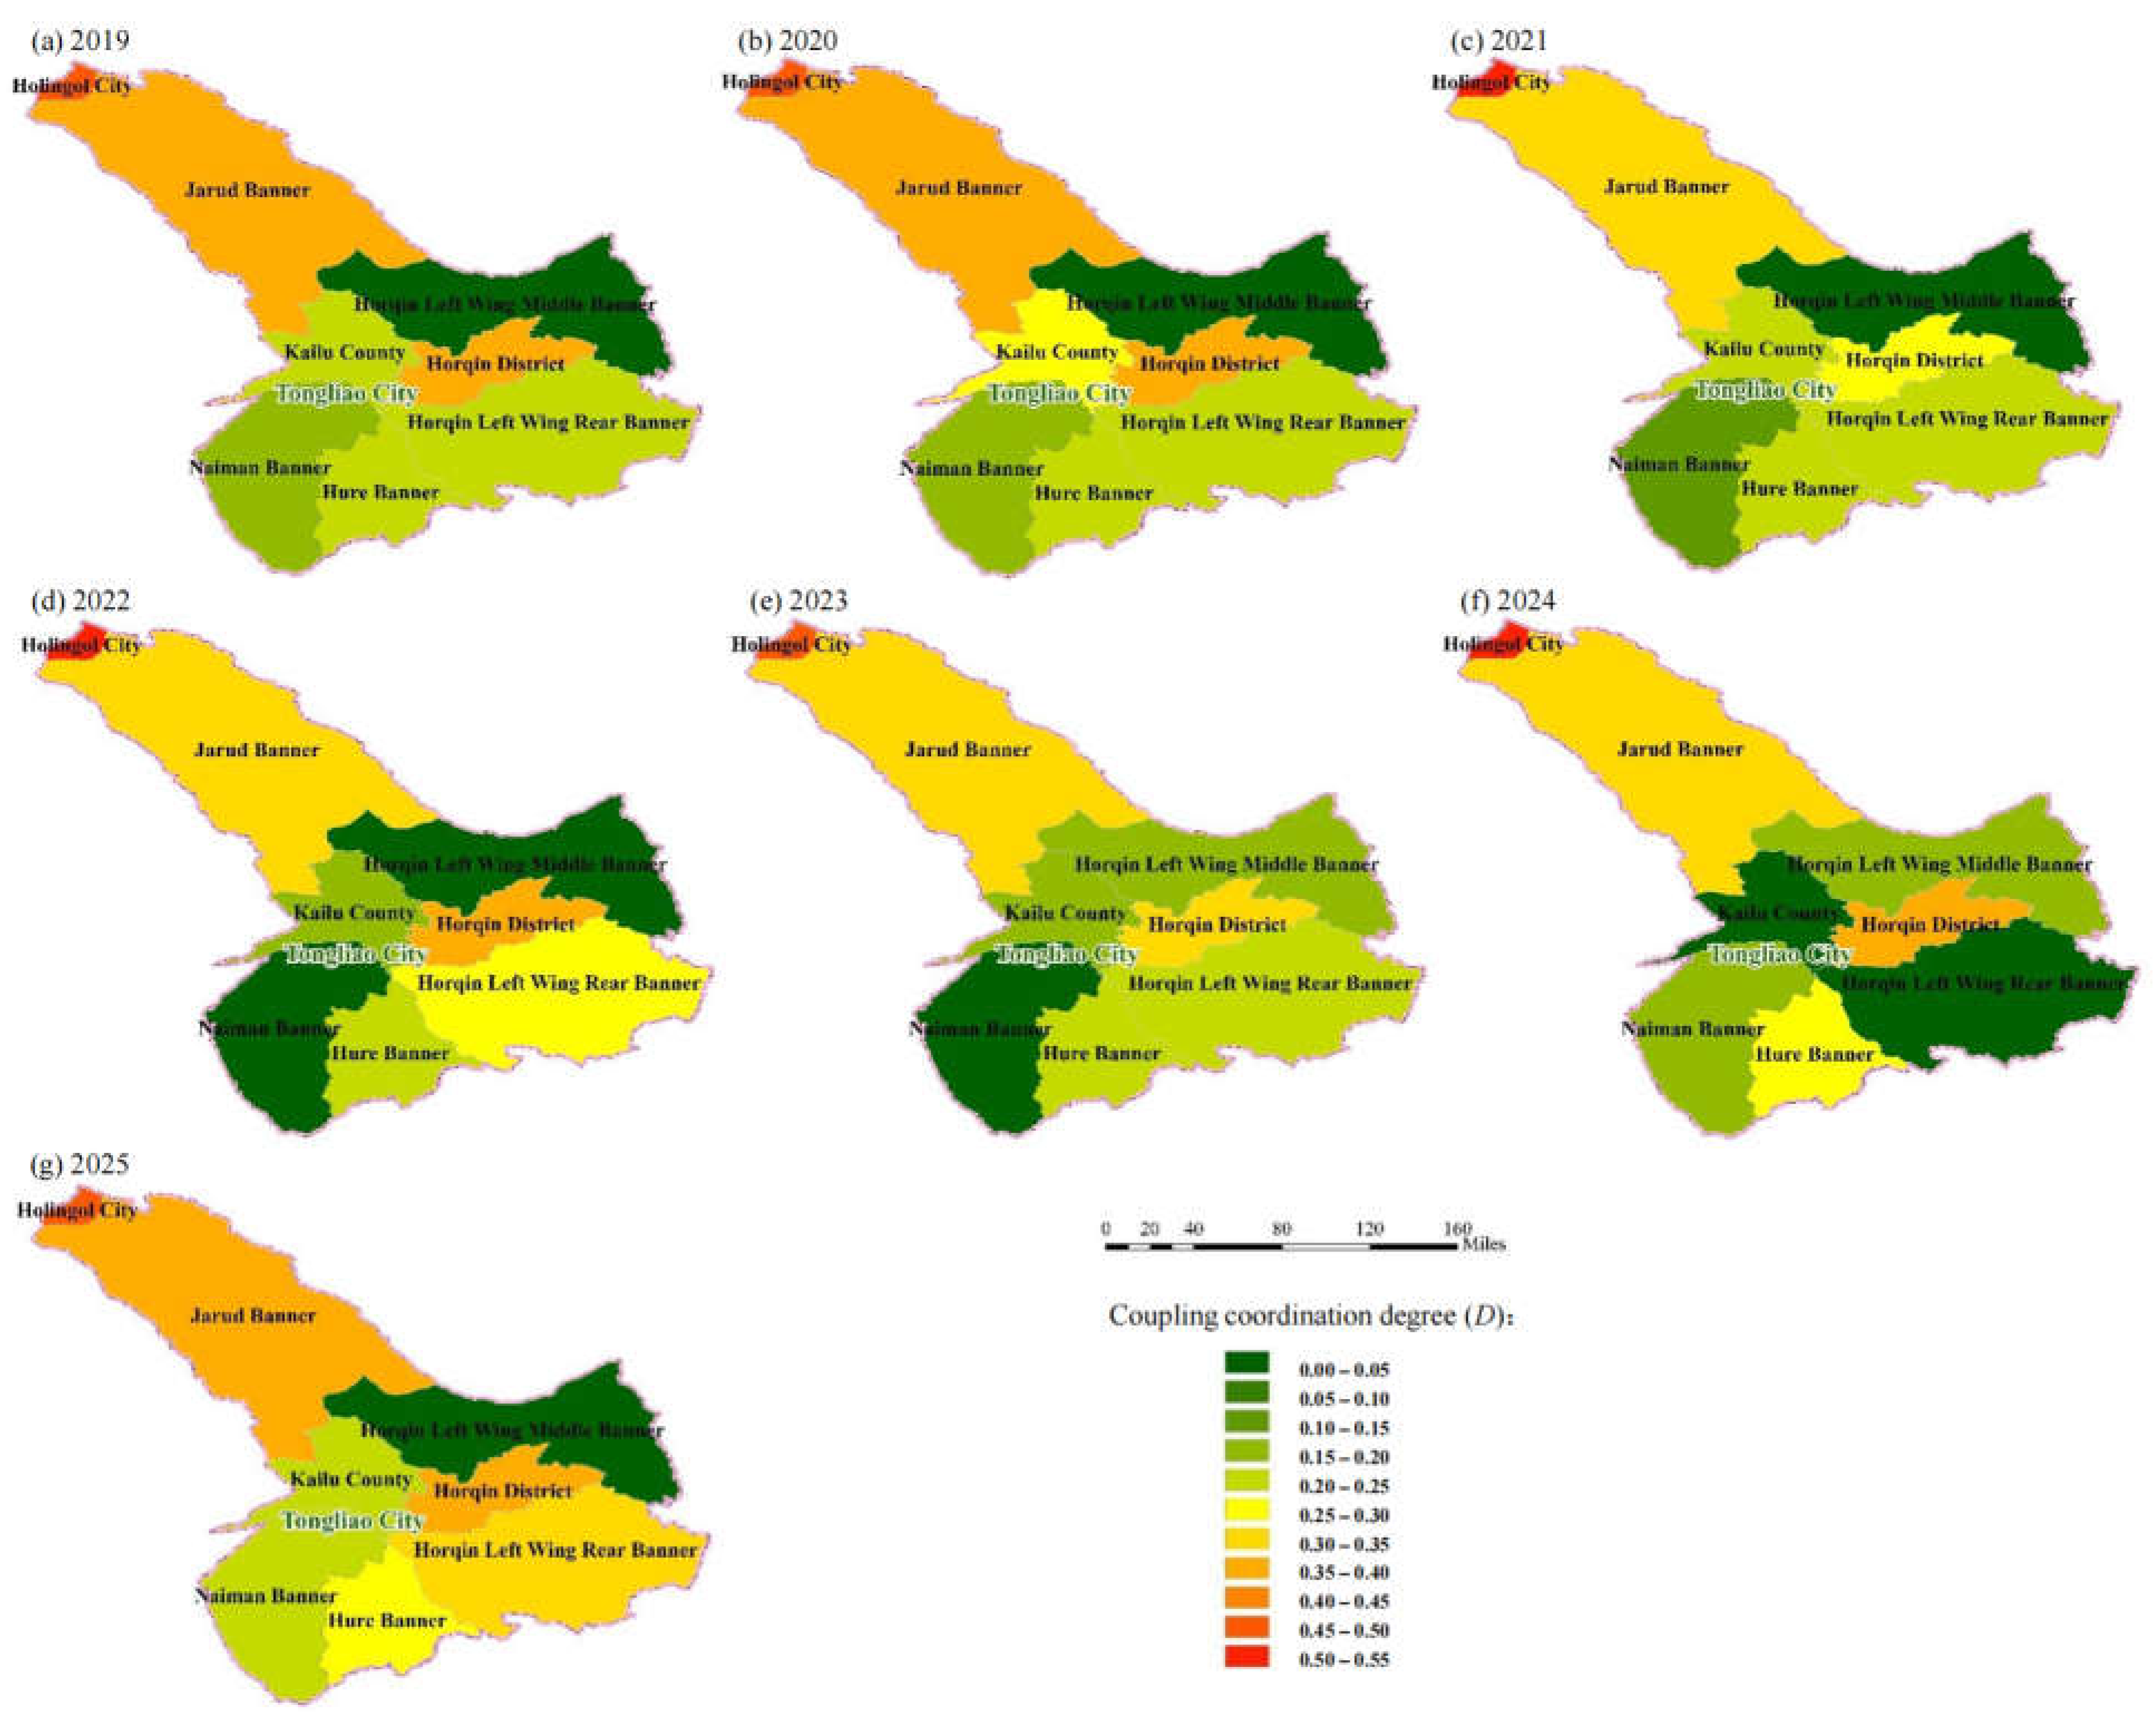

Table 1.
International classification of the Gini coefficient.
| Range | 0 | (0, 0.2) | [0.2, 0.3) | [0.3, 0.4) | [0.4, 0.5) | [0.5, 1) | 1 |
|---|---|---|---|---|---|---|---|
| Interpretation | Perfectly equal | Highly equal | Relatively equal | Reasonable | Polarized | Severely polarized | Absolutely unequal |
Table 2.
Evaluation indicator system for the water-ecology-economy matching pattern.
| Subsystem | No. | Indicator | Unit | Attribute |
|---|---|---|---|---|
| Water resources | 1 | Total water supply | 10⁴ m³ | Negative |
| 2 | Water use per 10⁴ yuan of GDP | m³/10⁴ yuan | Negative | |
| Ecology | 1 | NDVI | Dimensionless | Positive |
| 2 | Share of days with good or excellent air quality | % | Positive | |
| Economy | 1 | GDP | 10⁸ yuan | Positive |
| 2 | GDP per capita | yuan/person | Positive | |
| 3 | Urbanization rate | % | Positive |
Table 3.
Classification of the coupling coordination degree.
| Coordination level | Extreme disorder | Severe disorder | Moderate disorder | Slight disorder | Near disorder |
|---|---|---|---|---|---|
| D range | [0, 0.1) | [0.1, 0.2) | [0.2, 0.3) | [0.3, 0.4) | [0.4, 0.5) |
| Coordination level | Marginal coordination | Primary coordination | Intermediate coordination | Good coordination | Excellent coordination |
| D range | [0.5, 0.6) | [0.6, 0.7) | [0.7, 0.8) | [0.8, 0.9) | [0.9, 1.0] |
Disclaimer/Publisher’s Note: The statements, opinions and data contained in all publications are solely those of the individual author(s) and contributor(s) and not of MDPI and/or the editor(s). MDPI and/or the editor(s) disclaim responsibility for any injury to people or property resulting from any ideas, methods, instructions or products referred to in the content. |
© 2026 by the authors. Licensee MDPI, Basel, Switzerland. This article is an open access article distributed under the terms and conditions of the Creative Commons Attribution (CC BY) license (http://creativecommons.org/licenses/by/4.0/).
Copyright: This open access article is published under a Creative Commons CC BY 4.0 license, which permit the free download, distribution, and reuse, provided that the author and preprint are cited in any reuse.