

Submitted:
22 September 2026
Posted:
23 September 2026
You are already at the latest version
Abstract
The metabolic landscape of the post-implantation mouse embryo and its associated placenta remains incompletely characterised. Here, we performed untargeted LC–MS-based metabolomics on mouse embryos from E9.5 to E13.5 and on placentas from E10.5 to E12.5, and integrated these data with a published single-cell transcriptomic atlas of the same developmental window. We found that the embryonic metabolome undergoes progressive remodelling, with the most pronounced changes occurring around E11.5. By combining time-course analysis, WGCNA-based network prioritisation, and embryo–placenta comparison, we identified 56 core metabolites that increased coordinately in both tissues during this period. Single-cell analysis revealed that the definitive erythroid lineage was enriched for nicotinate and nicotinamide metabolism, with progressive upregulation of the NAD+ biosynthetic enzyme Nmnat2 during erythroid maturation. Correspondingly, niacinamide, NAD, and 1-methylnicotinamide increased in the embryo from E10.5 to E13.5. Regulon analysis showed that haematopoiesis-related transcriptional programmes, including Spi1 and Gfi1, correlated with development-associated metabolic modules. Together, our data provide a stage-resolved metabolomic resource and identify candidate metabolites that may support embryo growth in vitro.
Keywords:
metabolomics
; mouse embryo and placenta
; single-cell transcriptomics
; haematopoiesis
Introduction
The developmental window from embryonic day 9.5 (E9.5) to E13.5 in the mouse represents a critical phase of pregnancy during which organogenesis is actively underway and the embryo undergoes dramatic morphological and physiological transitions. Emerging evidence has established that metabolism is not merely a housekeeping activity during this period but a driving force that shapes developmental trajectories(Xu et al., 2025). Disruption of metabolic homeostasis at these stages can lead to structural malformations, growth restriction, or embryonic lethality, underscoring the fundamental requirement for precise metabolic control(Gao et al., 2026). A comprehensive understanding of the metabolic demands and by-product clearance of the post-implantation embryo is therefore essential—not only for deciphering the biochemical logic of embryogenesis, but also for informing the design of culture systems that can recapitulate or extend normal development ex vivo.
Current protocols for post-implantation mouse embryo culture, most notably the rotating-vessel system established by Hanna and colleagues, have enabled continuous development up to approximately E11.5 (Aguilera-Castrejon et al., 2021). Despite this advance, embryos cultured beyond this stage frequently exhibit growth retardation, suggesting that the medium fails to supply one or more essential metabolic factors or cannot adequately support the increasing complexity of the developing embryo. Because the placenta becomes the dominant route of nutrient delivery during this same window(Chen et al., 2026), characterising metabolic changes in both the embryo and the placenta may help identify factors that are physiologically important for supporting development after E11.5. Systematic metabolomic profiling of the embryo and placenta across this interval therefore offers a direct path toward this goal.
Metabolic transitions are a hallmark of developmental progression. In several systems, shifts between glycolytic and oxidative metabolism, or between different nutrient utilization strategies, accompany cell differentiation and tissue maturation(Cliff and Dalton, 2017; Zhang et al., 2012). Earlier metabolomic analysis of the mouse embryo has revealed a reprogramming of glucose metabolism during chorioallantoic branching at E8.5–E10.5, involving redirection of glucose carbon into the pentose phosphate pathway(Miyazawa et al., 2017). More recently, studies focusing on mid-gestation stages have identified E10.5–E11.5 as a particularly dynamic metabolic window(Perez-Ramirez et al., 2024; Solmonson et al., 2022). However, how these metabolic changes relate to the simultaneous maturation of specific cell lineages and to placental function has not been fully resolved.
Among the developmental events occurring during this window, the establishment of the definitive haematopoietic system is of particular interest. The maturation of definitive erythroid cells and the formation of a functional circulatory system are essential for oxygen transport and nutrient distribution within the rapidly growing embryo(Baron et al., 2012; Palis, 2014). This process imposes specific metabolic demands, such as high rates of haem synthesis, membrane remodelling, and a range of other metabolic reprogramming events(Lyu et al., 2024). Whether and how embryonic metabolic changes are coordinated with erythroid maturation remains poorly understood.
To address these gaps, we performed untargeted LC–MS-based metabolomics on mouse embryos at five time points (E9.5, E10.5, E11.5, E12.5, and E13.5) and on placentas at three matched time points (E10.5, E11.5, and E12.5). We integrated these data with a published single-cell transcriptomic atlas (Cao et al., 2019) to identify metabolic changes associated with specific cell populations, with a focus on the definitive erythroid lineage. Through a combination of time-course analysis, network-based prioritisation, and regulon–metabolite correlation, we identified a core set of metabolites that increase coordinately in the embryo and placenta and that are associated with haematopoietic transcriptional programmes. We further established an ex vivo embryo culture platform as a basis for testing whether these candidate metabolites can support development beyond the current in vitro barrier. Our analysis reveals coordinated metabolic changes around E11.5 and provides a resource and candidate list for improving post-implantation embryo culture.
2. Results
2.1. Stage-Associated Metabolic Remodelling in the Mouse Embryo from E9.5 to E13.5
To characterise the metabolic landscape of the post-implantation mouse embryo, we collected embryos at five consecutive developmental stages—E9.5, E10.5, E11.5, E12.5, and E13.5—and subjected them to untargeted LC–MS-based metabolomics (Figure 1A). After stringent quality filtering, 639 endogenous metabolites were retained for downstream analysis (Figure S1B). Inter-replicate correlation within each stage was high, confirming the robustness of the dataset (Figure S1C).
Principal component analysis (PCA) revealed that samples formed a continuous trajectory along PC1 according to developmental time (Figure 1B). E9.5 and E10.5 samples clustered closely, as did E12.5 and E13.5 samples, whereas the largest separation was observed between E11.5 and E12.5. This pattern indicates that the embryonic metabolome undergoes progressive remodelling, with the most pronounced compositional shift occurring immediately after E11.5.
Pairwise comparisons between consecutive stages were consistent with this view. The largest numbers of significantly altered metabolites were observed in the E11.5 versus E10.5 and E12.5 versus E11.5 comparisons, marking the period around E11.5 as the most metabolically dynamic phase of the examined window (Figure 1C-G). Among the top altered metabolites, octanoylcarnitine increased from E9.5 to E10.5, 5-thymidylic acid increased from E10.5 to E11.5, and fructose-1,6-bisphosphate increased from E11.5 to E12.5 (Figure 1C–F). In addition, several phosphatidylinositol and phosphatidylglycerol species were among the metabolites that increased between E12.5 and E13.5. KEGG pathway enrichment analysis of the E11.5 versus E10.5 comparison identified enrichment of fructose and mannose metabolism, taurine and hypotaurine metabolism, and arginine biosynthesis (Figure S1G). The E12.5 versus E11.5 comparison was enriched for glycine, serine and threonine metabolism, the pentose phosphate pathway, and valine, leucine and isoleucine biosynthesis (Figure S1H). These pathways are broadly involved in carbon utilisation, amino acid interconversion, and biomass production, suggesting that the embryo adjusts its metabolic network as organogenesis progresses.
To identify metabolites whose abundance increased across the full developmental window, we applied one-way ANOVA followed by a directional criterion requiring higher abundance at E13.5 than at E9.5. This approach identified a substantial set of metabolites with progressively increasing abundance (Figure 1H). Mfuzz clustering of all detected metabolites further revealed distinct temporal patterns, including clusters characterised by continuous increase, continuous decrease, and transient changes (Figure 1I). The increasing clusters contained metabolites such as myo-inositol(Placidi et al., 2024), taurine(Guérin et al., 2001), and several nucleotide derivatives, which have established roles in signalling, protection against reactive oxygen species, and nucleotide metabolism, respectively.
Taken together, these analyses establish that the embryonic metabolome undergoes stage-associated remodelling, with the most dynamic changes centred around E11.5. This metabolic reorganisation coincides with a period of rapid organ expansion and increasing biosynthetic demand, supporting the view that E11.5 represents a key developmental window in which metabolic and morphological changes are tightly coordinated.
2.2. Metabolomic Comparison of the Placenta and Embryo Reveals a Shared Set of Metabolites Increasing from E10.5 to E12.5
Because the placenta becomes the dominant site of maternal–fetal exchange during this window, we reasoned that metabolites increasing in both the embryo and placenta might represent factors whose availability becomes increasingly important for development. We therefore performed untargeted metabolomics on placentas collected at E10.5, E11.5, and E12.5, matching the embryonic time points (Figure 2A). PCA of placental metabolomic profiles showed a gradual shift along PC1 with developmental stage, indicating progressive metabolic maturation of the placenta itself (Figure 2A).
Pairwise comparisons identified 82 upregulated metabolites in E11.5 versus E10.5 and 51 in E12.5 versus E11.5 (Figure 2B–D). Among the top metabolites, cholic acid increased from E10.5 to E11.5, whereas maltotriose and maltotetraose increased from E11.5 to E12.5. These examples illustrate that the placenta undergoes metabolic changes involving both bile acid-related and carbohydrate-related pathways during this interval. To focus on metabolites that increased in both tissues, we compared the ANOVA-defined increasing metabolites from the embryo and placenta. This analysis identified 73 shared metabolites whose abundance increased with developmental time in both tissues (Figure 2E). Heatmap visualisation confirmed coordinated increases in these metabolites across matched embryonic and placental samples (Figure 2F). This shared set likely contains both metabolites that are transferred from mother to fetus and metabolites that are synthesised independently in each tissue, reflecting the functional interplay between placental supply and embryonic demand.
KEGG pathway enrichment analysis of the 73 shared metabolites revealed significant enrichment of pantothenate and CoA biosynthesis, ascorbate and aldarate metabolism, and taurine and hypotaurine metabolism (Figure 2G). Pantothenate is an essential precursor of coenzyme A, which is required for fatty acid oxidation, the TCA cycle, and numerous biosynthetic reactions(Barritt et al., 2024), while taurine functions as an osmolyte and antioxidant(Guérin et al., 2001). Representative metabolites from the shared set, including D-fructose and pseudouridine, showed progressive increases in both tissues from E10.5 to E12.5 (Figure 2H–I).
Collectively, these results identify a set of metabolites whose abundance rises in both the embryo and placenta during mid-gestation, suggesting coordinated metabolic adaptation between the two tissues. This shared set provides a focused starting point for identifying factors that may support embryonic growth during this critical period.
2.3. WGCNA Identifies Development-Associated Metabolite Modules and Converges on a Core Set of Metabolites Co-Increasing in the Embryo and Placenta
The analyses above identified metabolites that increased in the embryo or in both embryo and placenta. However, metabolites rarely act in isolation; they are organised into coordinated networks. To capture this organisation and further prioritise candidates, we performed WGCNA on the embryonic metabolomic dataset. This analysis grouped metabolites into modules of co-abundant compounds with similar accumulation patterns (Figure 3A). Among the identified modules, Module 3 showed the strongest positive correlation with developmental stage, followed by Module 2, whereas Module 1 displayed the strongest negative correlation (Figure 3B). This indicates that the embryonic metabolome can be decomposed into distinct modules that are differentially associated with developmental progression.
Pathway enrichment analysis of Module 3, the module most strongly associated with development, revealed enrichment of ascorbate and aldarate metabolism, pantothenate and CoA biosynthesis, and valine, leucine and isoleucine biosynthesis (Figure 3C). Module 2 was enriched for fructose and mannose metabolism, the pentose phosphate pathway, and taurine and hypotaurine metabolism (Figure 3D). These pathways converge on central carbon metabolism, nucleotide precursor generation, and antioxidant defence, all of which are likely to be in high demand during rapid organogenesis. The distinct enrichment profiles of Modules 2 and 3 also suggest that developmentally associated metabolites are organised into multiple regulatory layers, rather than a single linear programme.
To derive a high-confidence set of candidate metabolites, we intersected the union of Module 2 and Module 3 with the 73 metabolites that increased in both embryo and placenta (Figure 3E). This convergence yielded 56 core metabolites that were simultaneously developmentally associated in the embryonic WGCNA network and co-increasing in the two tissues. Correlation network analysis of the top 30 core metabolites revealed densely connected groups (Figure 3F), suggesting that these metabolites may be co-regulated or functionally interrelated. Several representative core metabolites—glyceric acid, arginylglycine, riboflavin, myo-inositol, taurine, and ergothioneine—displayed progressive increases in both embryonic and placental samples (Figure 3G–L). These compounds include a riboflavin derivative involved in cofactor synthesis(Jiménez-Nava et al., 2026), the signalling lipid precursor myo-inositol(Placidi et al., 2024), the antioxidant ergothioneine(Chen et al., 2024), and taurine, all of which have potential roles in supporting development. Glyceric acid is connected to serine/glycine metabolism and one-carbon flux, while arginylglycine represents a dipeptide whose accumulation may reflect increased amino acid turnover.
In summary, by combining tissue-level time-course analysis with network-based module detection, we narrowed the candidate space to 56 core metabolites that show coordinated increases in the embryo and placenta and are embedded in development-associated networks. This core set provides a rational basis for prioritising metabolites with potential functional relevance to mid-gestation development.
2.4. Integrative Single-Cell and Metabolomic Analysis Reveals a Metabolic Programme Associated with Definitive Erythroid Maturation
Because whole-embryo metabolomics cannot resolve cell-type-specific contributions, we next integrated our metabolomic data with a published single-cell transcriptomic atlas of the E9.5–E13.5 mouse embryo(Cao et al., 2019). We re-embedded the atlas using UMAP and annotated 38 cell types spanning major lineages and organ primordia (Figure 4A). Cell-type proportion analysis revealed substantial shifts in cellular composition across the five stages (Figure 4B), consistent with rapid tissue expansion and lineage diversification during organogenesis.
To identify metabolic programmes that are specific to individual cell types, we focused on cell-type-enriched metabolic genes. Among the 38 annotated populations, the definitive erythroid lineage showed enrichment of several metabolic pathways, including phenylalanine metabolism, beta-alanine metabolism, and nicotinate and nicotinamide metabolism (Figure 4C–D). Nicotinate and nicotinamide metabolism is of particular interest because it feeds NAD+ biosynthesis, which is essential for redox balance, energy metabolism, and numerous enzymatic reactions. The enrichment of this pathway in definitive erythroid cells suggests that NAD+ metabolism may be especially important during erythroid maturation.
To examine how metabolic gene expression changes during erythroid maturation, we inferred pseudotime for definitive erythroid lineage cells using Palantir and visualised the differentiation trajectory with CellRank (Figure 4E–F). Along this trajectory, early erythroid progenitors expressed higher levels of Sulf1, Kcnb2, Kcnq5, and Kdm5b, whereas more mature cells progressively upregulated Nmnat2, Cacna2d1, Grik3, Slc2a1, and Snca (Figure 4G). Among the late-stage genes, Nmnat2 encodes a key enzyme in NAD+ biosynthesis, directly linking the transcriptional programme to the enriched nicotinate/nicotinamide pathway(Ryu et al., 2018). Slc2a1 encodes GLUT1, the primary glucose transporter in erythrocytes(Martí-Mateos et al., 2026), which supports glycolytic energy production in maturing red cells. The upregulation of these genes suggests that definitive erythroid maturation is accompanied by an increased capacity for NAD+ synthesis and glucose uptake.
To determine whether these transcriptional changes were reflected at the metabolite level, we examined the activity of the nicotinate and nicotinamide metabolism pathway using embryonic metabolomic data. Pathway activity increased progressively from E10.5 to E13.5 (Figure 4H), and the contributing metabolites—niacinamide, NAD, and 1-methylnicotinamide—showed corresponding increases during this period (Figure 4I). The coordinated rise in pathway activity and metabolite abundance, together with the transcriptional upregulation of Nmnat2 in maturing erythroid cells, supports the idea that enhanced NAD+ metabolism is a feature of definitive erythroid maturation during this developmental window.
Taken together, these results identify a metabolic programme associated with definitive erythroid maturation, characterised by increased nicotinate/nicotinamide metabolism and NAD+ biosynthesis. Because erythroid cells are essential for oxygen transport and the establishment of functional circulation, this programme may contribute to the maturation of the haematopoietic system during organogenesis.
2.5. Integrative Regulon–Metabolite Correlation Analysis Reveals Coordinated Variation Between Transcriptional Programmes and Metabolic Modules
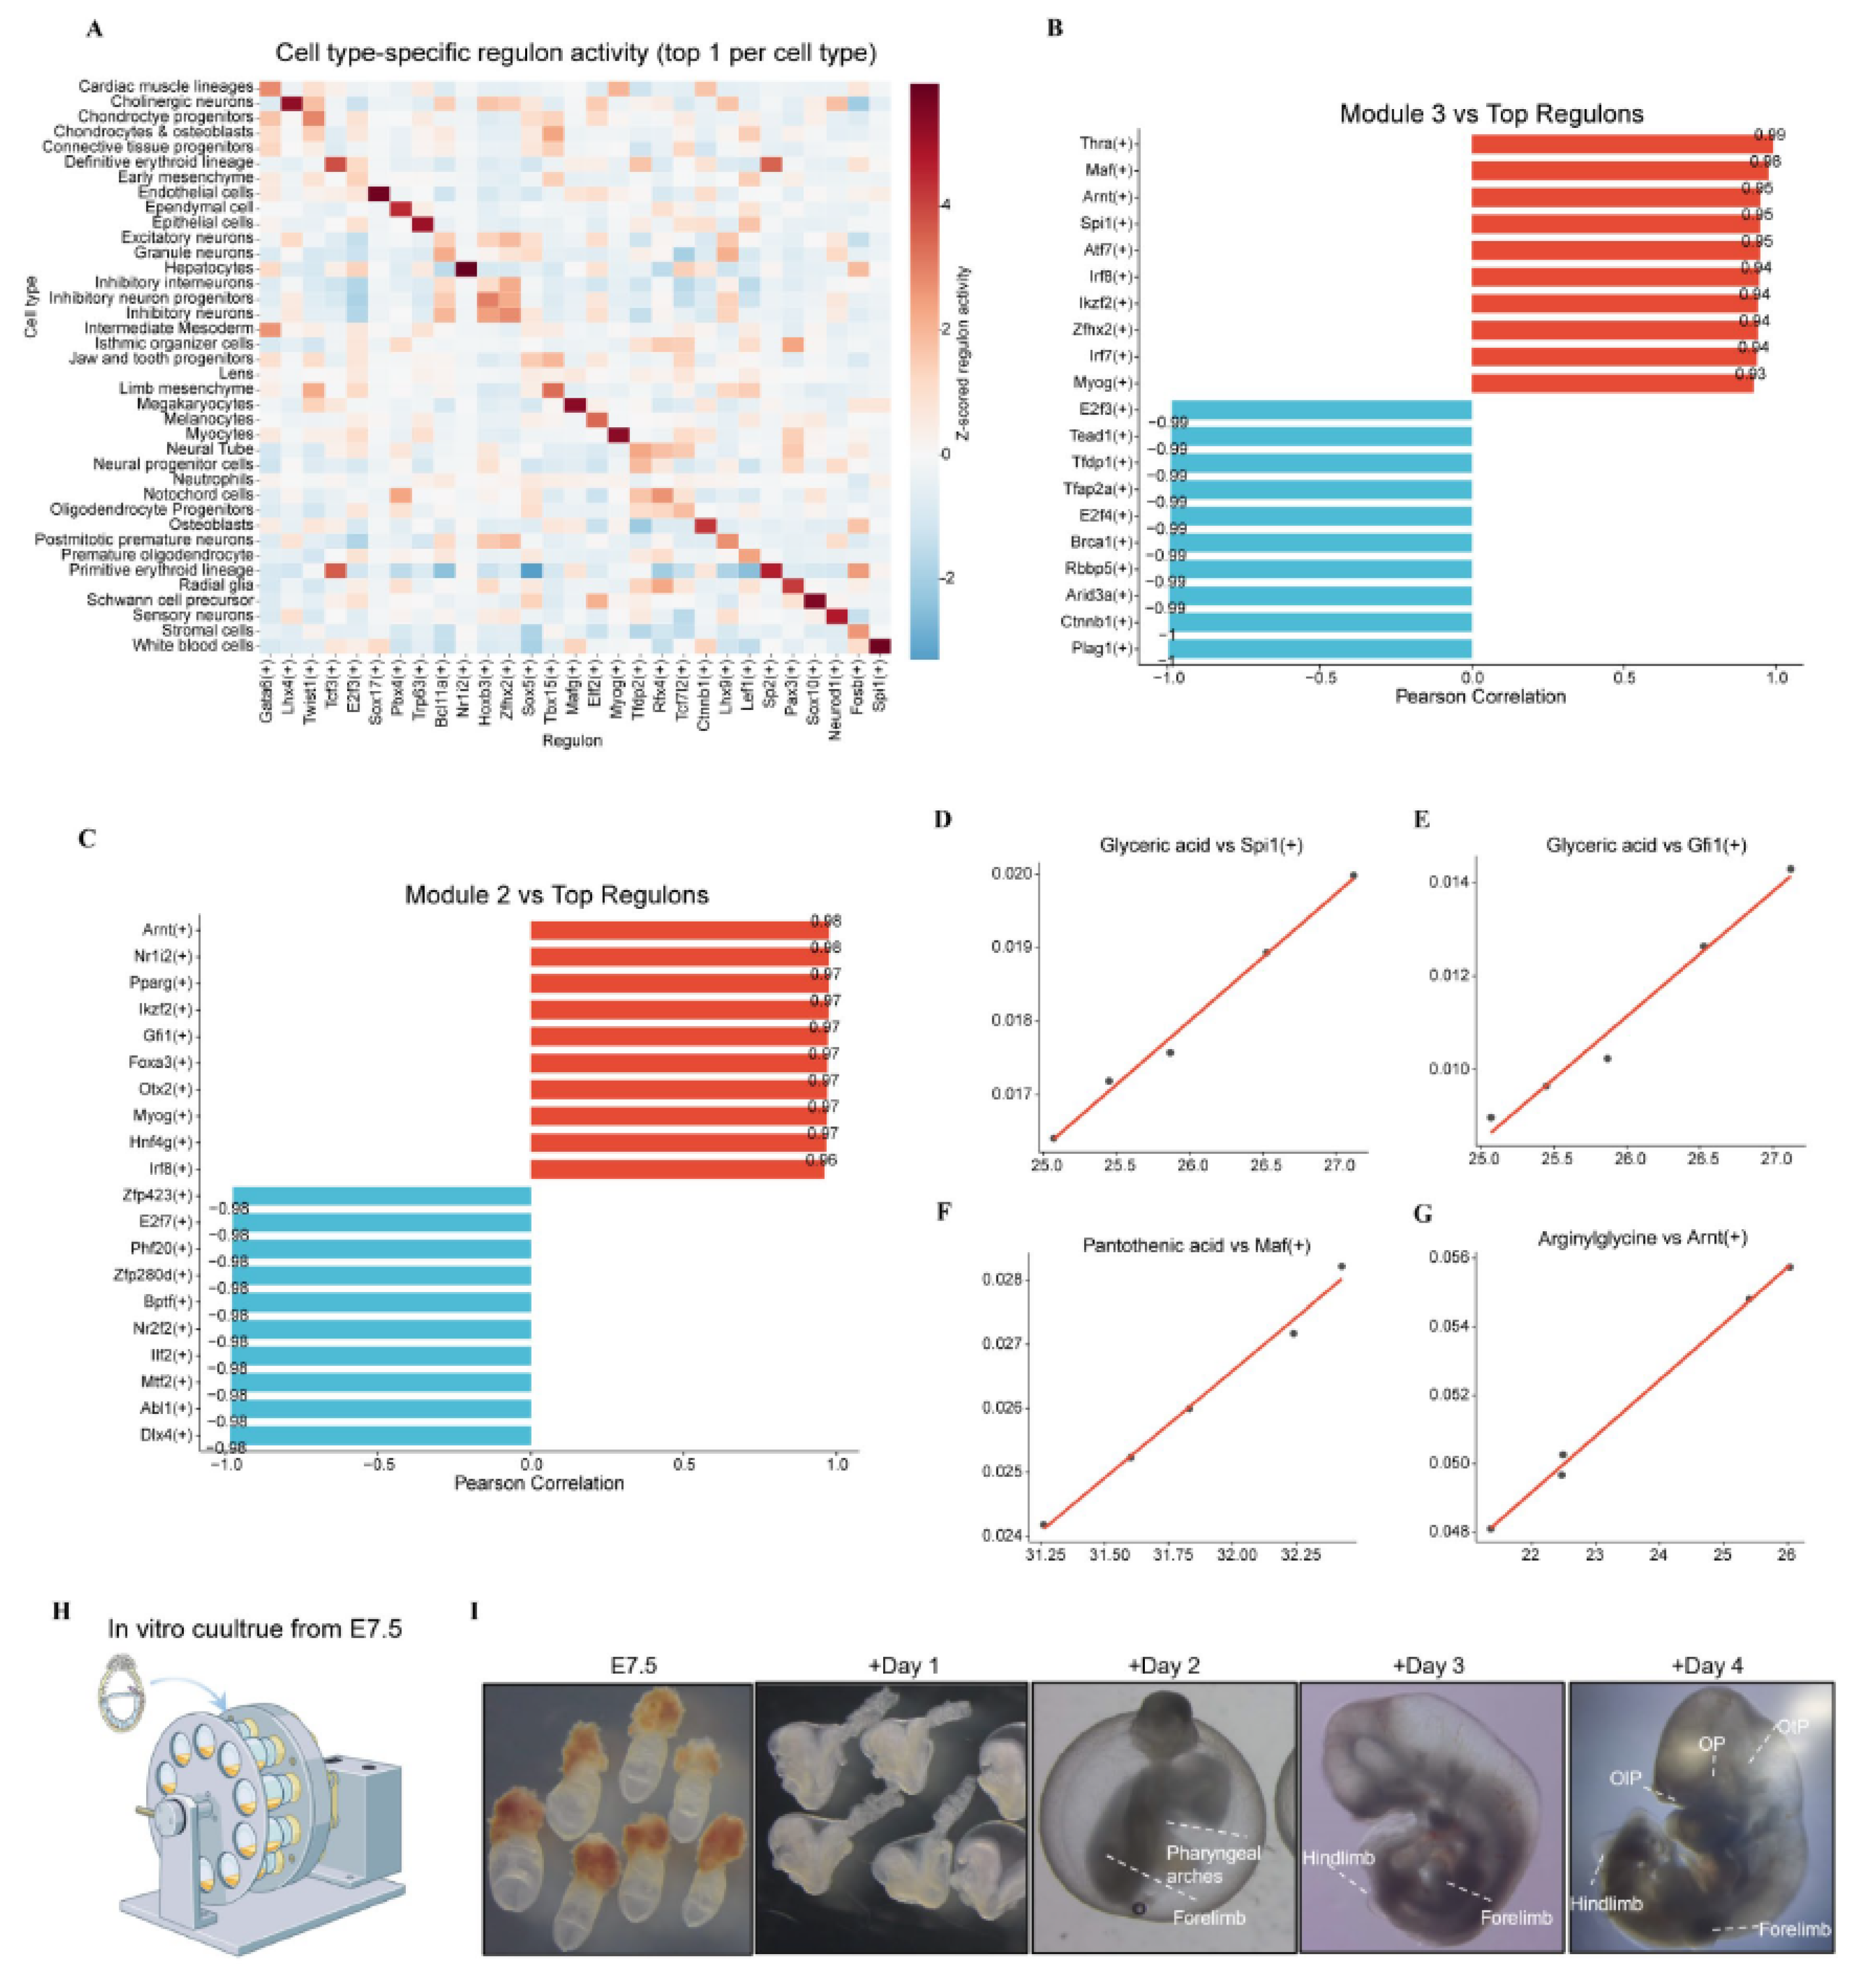
The coordinated behaviour of development-associated metabolite modules raised the question of whether these metabolic changes are accompanied by corresponding transcriptional programmes. To explore this, we performed pySCENIC analysis to infer regulon activity from the single-cell transcriptomic data. The top cell-type-specific regulons included known lineage regulators, such as Gata6(+) in cardiomyocytes, TCF3(+) in the definitive erythroid lineage, and Spi1(+) in white blood cells (Figure 5A). Spi1 encodes PU.1, a master regulator of haematopoietic specification, and its identification as the top regulon in the white blood cell compartment likely reflects the inclusion of haematopoietic stem/progenitor cells within this broad cluster.
We next correlated the activity of these regulons with the abundance of metabolites in the two development-associated WGCNA modules. For Module 3, high positive correlations were observed for Thra(+), Maf(+), Arnt(+), Spi1(+), and Atf7(+) (Figure 5B). Thra encodes the thyroid hormone receptor α, which is involved in energy metabolism and cardiovascular development; Arnt is a central mediator of hypoxia-inducible responses(Mandl and Depping, 2014); and Spi1 is essential for haematopoietic lineage specification(Oikawa et al., 1999). For Module 2, high positive correlations were found for Arnt(+), Nr1i2(+), Pparg(+), Ikzf2(+), and Gfi1(+) (Figure 5C). Among these, Pparg is a nuclear receptor with established roles in lipid metabolism, while Gfi1 is identified as one direct target of RUNX1 and critical regulators of hematopoietic transition(van der Meer et al., 2010). The enrichment of haematopoiesis-related regulons among the top correlates of both modules is consistent with the erythroid-focused findings from the single-cell analysis and points to coordinated variation between haematopoietic transcriptional programmes and these metabolic modules.
Representative metabolite–regulon correlations—glyceric acid with Spi1(+), glyceric acid with Gfi1(+), pantothenic acid with Maf(+), and arginylglycine with Arnt(+)—further illustrate these associations (Figure 5D–G). Glyceric acid is connected to serine/glycine metabolism and one-carbon flux; pantothenic acid is the precursor of CoA; and arginylglycine reflects amino acid turnover. The positive correlations between these metabolites and haematopoiesis-related regulons indicate coordinated changes between specific metabolic outputs and transcriptional programmes during this window.
Finally, to provide a functional context for future testing of candidate metabolites, we established a rotating-vessel post-implantation embryo culture system adapted from Hanna and colleagues (Figure 5H). Embryos explanted at E7.5 and cultured ex vivo developed to approximately E11.5, recapitulating key morphological milestones including somitogenesis, neural tube closure, and limb bud formation (Figure 5I). In this system, we also performed a preliminary assessment of glutamine metabolism: exogenous glutamine was taken up by cultured embryos, and pharmacological inhibition of glutaminase with CB839 impaired embryo development and gastruloid formation (Figure S2). These observations provide a starting point for using this culture platform to test candidate metabolites identified in our analysis.
Collectively, these analyses reveal coordinated variation between development-associated metabolic modules and specific transcriptional programmes, particularly those related to haematopoietic development, and establish an ex vivo platform for future functional interrogation of candidate metabolites.
3. Discussion
In this study, we combined untargeted metabolomics of the mouse embryo and placenta with single-cell transcriptomic analysis to characterise the metabolic changes that accompany organogenesis from E9.5 to E13.5. We identified a set of metabolites whose abundance increases coordinately in the embryo and placenta, prioritised 56 core candidates through network-based analysis, and linked these metabolic changes to transcriptional programmes associated with definitive erythroid maturation. We further established an ex vivo embryo culture platform that can be used to test the functional relevance of candidate metabolites.
The metabolic remodelling we observed was progressive, with the most pronounced changes occurring around E11.5. This stage represents a pivotal point in mouse development, when organ primordia are being established and the embryo transitions from relatively simple to increasingly complex body plans. Previous metabolomic analysis of mid-gestation mouse embryos identified E10.5–E11.5 as a major metabolic transition(Perez-Ramirez et al., 2024; Solmonson et al., 2022), and our data are broadly consistent with that finding. In our dataset, the largest number of differentially abundant metabolites was detected between E11.5 and E12.5, followed by E11.5 versus E10.5. These results indicate that the period immediately around E11.5, rather than a single exact time point, is the most metabolically dynamic phase of the examined window. Slight differences in the exact interval of maximum change may reflect differences in embryo staging, sample processing, or metabolite coverage; however, the overall conclusion that E11.5 lies at the centre of a major metabolic reorganisation is consistent between studies. This metabolic reorganisation coincides with the functional maturation of the chorioallantoic placenta and the shift from yolk sac-derived to maternal blood-borne nutrition(Kalisch-Smith, 2025), as well as with rapid expansion of organ primordia and the onset of definitive haematopoiesis(Chen et al., 2022; de Bruijn et al., 2000). The convergence of these developmental events supports the notion that E11.5 represents a critical window in which metabolic and developmental programmes become tightly coordinated.
This study included matched placental metabolomic data, as the placenta became the primary route of nutrient delivery during this window; metabolites that increase in both tissues may represent factors whose availability is coupled to embryonic demand. The 73 shared increasing metabolites and the 56 core metabolites that also mapped to development-associated WGCNA modules provide a focused set of candidates for future functional testing. Among these, myo-inositol and taurine are particularly notable. Myo-inositol is a precursor for phosphoinositide signalling and has established roles in neural tube closure(Greene and Copp, 1997), while taurine functions as an osmolyte and antioxidant with known importance for cardiovascular and neural development(Lambert et al., 2015). The presence of pantothenate-related metabolites is also of interest, given that coenzyme A is required for fatty acid oxidation and a wide range of biosynthetic pathways(Barritt et al., 2024). These observations are consistent with a high demand for membrane biogenesis, signalling lipids, and cofactor synthesis during mid-gestation organogenesis.
The integration of our metabolomic data with single-cell transcriptomics highlighted the definitive erythroid lineage as a site of active metabolic specialisation. Erythroid cells showed enrichment of nicotinate and nicotinamide metabolism at the transcriptional level, accompanied by progressive increases in niacinamide, NAD, and 1-methylnicotinamide in the embryo. The upregulation of Nmnat2, which encodes a key NAD+ biosynthetic enzyme, in maturing erythroid cells further supports the coordination of these observations. NAD+ is essential for redox balance and energy metabolism, and erythroid cells face particular demands in this regard as they accumulate haemoglobin and prepare for oxygen transport. The establishment of functional circulation is a prerequisite for efficient nutrient distribution within the growing embryo, and metabolic support of erythroid maturation may therefore contribute to this process. These findings point to a functional link between embryonic metabolism and the maturation of the haematopoietic system.
Our regulon analysis identified several transcriptional programmes whose activity correlated with development-associated metabolic modules. Among the top correlates were regulons linked to haematopoietic specification, such as Spi1 and Gfi1, and regulators of metabolic adaptation, such as Arnt and Pparg. These observations reveal coordinated variation between haematopoietic transcriptional programmes and metabolic outputs during this developmental window, although the causal relationships underlying these associations remain to be established.
Yet, this study has several limitations. The metabolomic measurements were performed on whole-embryo and whole-placenta lysates and therefore represent tissue-level averages, which cannot resolve cell-type-specific or spatially localised metabolic differences. In addition, the functional relevance of the candidate metabolites identified here remains to be tested directly.
The core metabolite set defined in this study provides a concrete basis for functional follow-up. Using the ex vivo embryo culture platform described here, we will next test whether supplementation with selected candidate metabolites can support development beyond the current E11.5 barrier. Given the association we observed between metabolic changes and erythroid maturation, a particularly promising direction is to determine whether promoting haematopoietic development through specific metabolites improves nutrient transport and thereby extends embryo culture. Ultimately, the metabolomic atlas and candidate list presented here provide a foundation for systematically improving post-implantation embryo culture and for understanding how metabolism supports organogenesis.
4. Methods
4.1. Mouse Embryo Collection
All animal procedures were approved by the Animal Research Committee guidelines of Zhejiang University (research license ZJU20230458) and performed in accordance with relevant ethical guidelines. C57BL/6J mice were maintained under specific-pathogen-free conditions on a 12-h light/dark cycle with ad libitum access to food and water. Timed matings were set up overnight, and the morning of vaginal plug detection was designated as embryonic day 0.5 (E0.5). Pregnant females were euthanised by cervical dislocation, and embryos were dissected at E9.5, E10.5, E11.5, E12.5 and E13.5 in ice-cold phosphate-buffered saline (PBS). Extra-embryonic membranes were removed, and individual embryos were snap-frozen in liquid nitrogen within 5 min of dissection and stored at −80 °C until metabolomic extraction. Five biological replicates were collected for E9.5, E10.5, and E11.5, and four biological replicates for E12.5 and E13.5. Placentas were collected at E10.5, E11.5, and E12.5, with four biological replicates per stage. All embryo and placenta samples weighed at least 40 mg. To ensure consistent sample loading for LC–MS, frozen samples were first ground and homogenised, and an aliquot equivalent to approximately 20 mg of tissue was used for metabolite extraction. All samples were processed and analysed in a single batch to avoid potential batch effects.
4.2. Rat Serum Preparation
Rat serum was prepared accordingly(Li et al., 2025). Adult male Sprague-Dawley rats (8–9 weeks old, 280–350 g) maintained under specific pathogen-free conditions were fasted for 18–24 h with access to water to normalise blood glucose. Under 2.5%–4% isoflurane anaesthesia, blood was drawn from the abdominal aorta using a 21G needle attached to a 20 ml syringe, then immediately transferred to 15 ml centrifuge tubes and spun at 4,000 g for 15 min at 4 °C. To promote fibrin clot formation, the tubes were left at 4 °C for an additional 1.5–2 h. The resulting clot was gently compressed with curved forceps to release residual serum, which was then collected into fresh 15 ml tubes. Serum was heat-inactivated in a 55 °C water bath for 45 min and passed through a 0.22 μm filter. Aliquots were stored at −80 °C, and each batch was tested for its ability to support embryo development prior to experimental use.
4.3. Post-Implantation Embryo Culture
Embryos were cultured using the rotating-vessel system essentially as described by Hanna and colleagues(Aguilera-Castrejon et al., 2021). Briefly, E7.5 embryos (late gastrulation stage) were dissected from decidua in pre-warmed DMEM medium supplemented with 10% (vol/vol) fetal bovine serum, 100 U ml⁻¹ penicillin and 100 μg ml⁻¹ streptomycin. The collected embryos were cultured in DMEM/F12 medium supplemented with 75% rat serum, glucose, 1× glutamine, 11 mM HEPES, and 1× antibiotic-antimycotic solution. Glucose and oxygen concentrations were increased daily in a stepwise manner. From embryonic day (E) 7.5 (designated as day 0), the glucose concentration was initiated at 3 mg/mL and increased by 0.5 mg/mL per day. Oxygen tension was progressively elevated from 5% to 13%, 18%, and 21% on consecutive days starting from E7.5, and then maintained at 21% thereafter. Cultures were maintained at 37 °C under a pressure of 6.5 psi. Medium was refreshed every 24 h. For inhibitor experiments, CB839 was dissolved in DMSO and added to the culture medium at a final concentration of 200 μM from day 1 of culture; an equivalent volume of DMSO was used as a vehicle control. Embryo development was monitored daily by bright-field microscopy, and the developmental stage was assessed by established morphological criteria.
4.4. Immunofluorescence
Embryos were fixed in 4% paraformaldehyde in PBS overnight at 4 °C, permeabilised with 0.1% Triton X-100 in PBS for 30 min, and blocked with 10% normal donkey serum in PBS for 1 h at room temperature(Li et al., 2025). Primary antibodies used were anti-Sox2 (1:200). After overnight incubation at 4 °C, embryos were washed and incubated with Alexa Fluor-conjugated secondary antibodies (1:500) for 1 h at room temperature. Nuclei were counterstained with DAPI. Images were acquired using a confocal microscope.
4.5. Gastruloid Formation and Treatment
Mouse embryonic stem cells were maintained on mitotically inactivated mouse embryonic fibroblasts in standard ES cell medium. To generate gastruloids, cells were dissociated and aggregated in 96-well ultra-low attachment plates according to established protocols(Beccari et al., 2018). Approximately 300 stem cells per well were seeded in N2B27 medium and allowed to aggregate into embryoid bodies (EBs). At 48 hours post-seeding, the cultures were treated with 3 µM CHIR99021 (CHIR). After 24 hours of treatment, the medium was replaced with fresh N2B27 medium to withdraw CHIR, and subsequently refreshed daily. After 96 h, well-formed gastruloids were treated with CB839 (200 μM) or vehicle, and morphology was assessed at 120 h. Gastruloid length was measured using ImageJ.
4.6. Metabolite Extraction for LC-MS
Embryos and placentas were snap-frozen in liquid nitrogen immediately after dissection. Each sample (approximately 40 mg) was ground and homogenised, and an aliquot corresponding to approximately 20 mg of tissue was used for extraction. The aliquot was homogenised in 200 μL of water using a bead-beater, and 800 μL of methanol/acetonitrile (1:1, v/v) was added for metabolite extraction. The mixture was centrifuged at 14,000 g for 20 min at 4 °C, and the supernatant was dried in a vacuum centrifuge. For LC–MS analysis, the dried residue was reconstituted in 100 μL of acetonitrile/water (1:1, v/v), centrifuged at 14,000 g for 15 min at 4 °C, and the supernatant was used for injection. A pooled quality control (QC) sample was prepared by mixing equal aliquots of all reconstituted samples and was injected periodically to monitor instrument stability. All embryo and placenta samples were analysed in the same batch.
4.7. Liquid Chromatography–Mass Spectrometry
Untargeted metabolomics was performed using an UHPLC system (1290 Infinity LC, Agilent Technologies) coupled to a quadrupole time-of-flight mass spectrometer (TripleTOF 6600, AB Sciex) at Shanghai Applied Protein Technology Co., Ltd. For HILIC separation, an ACQUITY UPLC BEH Amide column (2.1 mm × 100 mm, 1.7 μm; Waters) was used. In both positive and negative electrospray ionisation (ESI) modes, the mobile phase consisted of A = 25 mM ammonium acetate and 25 mM ammonium hydroxide in water, and B = acetonitrile. The gradient was: 95% B for 0.5 min, linearly reduced to 65% B in 6.5 min, then reduced to 40% B in 1 min and held for 1 min, followed by an increase to 95% B in 0.1 min, with a 3-min re-equilibration period. The ESI source conditions were: Ion Source Gas 1 60, Ion Source Gas 2 60, curtain gas 30, source temperature 600 °C, and IonSpray Voltage Floating ± 5500 V. In MS-only acquisition, spectra were acquired over m/z 60–1,000 Da with an accumulation time of 0.20 s/spectrum. In auto MS/MS acquisition, product ion scans were acquired over m/z 25–1,000 Da with an accumulation time of 0.05 s/spectrum, using information-dependent acquisition (IDA) in high-sensitivity mode. The collision energy was 35 V ± 15 eV, and declustering potential was 60 V (positive) and −60 V (negative). Isotopes within 4 Da were excluded, and up to 10 candidate ions were monitored per cycle.
4.8. Metabolomics Data Processing
Raw MS data were converted to mzXML format using ProteoWizard MSConvert and processed with XCMS software. Peak detection was performed using the centWave algorithm (m/z tolerance 10 ppm, peakwidth c(10, 60), prefilter c(10, 100)). Peak grouping was performed with bw = 5, mzwid = 0.025, and minfrac = 0.5. CAMERA was used for annotation of isotopes and adducts. Only features with more than 50% nonzero measurements in at least one sample group were retained. Metabolite identification was performed by matching accurate mass (m/z error < 10 ppm) and MS/MS spectra against an in-house database constructed with authentic standards, as well as public databases including HMDB, KEGG, and METLIN.
4.9. Preprocessing and Quality Control
Data matrices from positive and negative modes were separately processed. Features with >50% missing values were removed, and values ≤0 were set to NA. Quantile-based probabilistic quotient normalisation (PQN) was applied, followed by QC-based filtering (features with relative standard deviation >30% in QC samples were discarded). Remaining missing values were imputed with half the minimum positive value per feature. Data were log₂-transformed, and the positive- and negative-mode matrices were merged by taking the maximum intensity per metabolite. QC samples were then removed from the final matrix. Metabolite names were standardised, and redundant features sharing the same HMDB ID were collapsed by retaining the feature with the highest detection score. Endogenous metabolites were retained based on HMDB origin annotation or SuperClass. The final dataset comprised 639 metabolites across 35 biological samples. Between-replicate reproducibility was assessed by Pearson correlation.
4.10. Differential Metabolite Analysis
Pairwise comparisons between consecutive developmental stages (E10.5 vs E9.5, E11.5 vs E10.5, E12.5 vs E11.5, E13.5 vs E12.5) were performed using the limma package. Metabolites were considered significantly altered when they met the following criteria: variable importance in projection (VIP) > 1 from a PLS-DA model fitted to all stages, log₂ fold change > 0.32, and P < 0.05.
4.11. Multi-Stage One-Way ANOVA and Heatmap
One-way ANOVA was performed across the five stages using limma’s F-test with empirical Bayes moderation. Metabolites with adjusted P < 0.05 were considered significant. The top 100 most significant metabolites were selected for heatmap visualisation. Rows were ordered by the difference in mean expression between early (E9.5 + E10.5) and late (E12.5 + E13.5) stages.
4.12. Mfuzz Temporal Clustering
Mean abundance per stage was calculated for each metabolite (n = 4 replicates). Data were standardised (mean = 0, standard deviation = 1) and analysed using the Mfuzz package(Futschik and Carlisle, 2005). The number of clusters was set to 6, and the fuzzifier parameter was estimated automatically. The cluster showing a monotonic increase across stages (largest linear regression slope) was designated as the “continuously increasing” cluster.
4.13. Weighted Gene Co-Expression Network Analysis (WGCNA)
WGCNA was performed on all 693 metabolites using the WGCNA package(Zhang and Horvath, 2005). A signed network was constructed with a soft-thresholding power chosen to achieve scale-free topology (R² > 0.8). Modules were detected using dynamic tree cutting with a minimum module size of 15 and a merge cut height of 0.25. Module–trait correlations were calculated between module eigengenes and developmental stage. The module with the highest absolute correlation was selected for further analysis. Hub metabolites within the module were defined by intramodular connectivity.
4.14. Pathway Enrichment Analysis
Pathway enrichment was performed using the MetaboAnalyst web server (Pathway Analysis module) with the Mus musculus SMPDB library. For each metabolite set of interest (e.g., WGCNA module, Mfuzz cluster, intersecting metabolites), the list of metabolite names was submitted. Results were visualised as bubble plots or bar charts in R.
4.15. Pathway Activity Scoring
Single-sample gene set enrichment analysis (ssGSEA) was used to estimate pathway activity scores(Barbie et al., 2009; Subramanian et al., 2005). Gene sets (pathway definitions) were obtained from the SMPDB database by matching target pathway names to SMPDB pathway identifiers, and metabolite members were mapped to detected metabolites via standardised HMDB IDs. For each sample, ssGSEA scores were calculated using the GSVA package with a Gaussian kernel. Activity trajectories were plotted as mean ± s.e.m. across replicates for each stage.
4.16. Single-Cell Transcriptomic Data Analysis
Published single-cell RNA-seq data of E9.5–E13.5 mouse embryos were obtained(Cao et al., 2019). Data were processed using the Scanpy pipeline (version 1.2.2)(Wolf et al., 2018). After quality filtering to remove low-quality cells and potential doublets, counts were normalised and log-transformed, and 3000 highly variable genes were identified. Principal component analysis was performed with 30 PCs, and a neighbourhood graph was constructed using n_neighbors = 50, followed by UMAP embedding for visualisation. Cell types were annotated based on canonical marker genes and the original annotations provided by the source study. In total, 38 cell types were retained for downstream analysis. Cell-type proportions across developmental stages were calculated by counting annotated cells per stage and normalising to the total cell number per stage.
To identify cell-type-enriched metabolic genes, differential expression analysis was performed between each cell type and all other cells using the Wilcoxon rank-sum test implemented in Scanpy. Genes with significant enrichment and a metabolic annotation were retained. Dotplots were generated to visualise the expression of selected metabolic marker genes across cell types, with dot size representing the fraction of expressing cells and colour intensity indicating scaled average expression. KEGG pathway enrichment analysis of cell-type-enriched metabolic genes was performed using GSEApy with the KEGG gene set library(Fang et al., 2023).
4.17. Pseudotime and Differentiation Trajectory Analysis of Definitive Erythroid Lineage
To characterise the developmental progression of definitive erythroid lineage cells, we first subset cells annotated as definitive erythroid lineage from the full atlas. Pseudotime was inferred using Palantir (version 1.4.5)(Setty et al., 2019), which estimates differentiation trajectories from single-cell expression data. The resulting pseudotime ordering was used as input for CellRank (version 2.0.7) to visualise differentiation trajectories(Weiler and Theis, 2026). Arrows in the resulting trajectory plots indicate the inferred direction of differentiation from early progenitors toward more mature erythroid cells. Gene expression dynamics along pseudotime were visualised for selected metabolic genes by fitting smoothed expression trends and plotting scaled expression values against pseudotime.
4.18. pySCENIC Regulon Analysis
To infer cell-type-specific transcriptional regulatory programmes, we performed pySCENIC analysis (version 0.12.1)(Aibar et al., 2017; Kumar et al., 2021). Approximately 50,000 cells were sampled across developmental stages and cell types to balance computational efficiency and representation. The analysis consisted of three steps: (i) co-expression module detection using GRNBoost2, (ii) cis-regulatory motif enrichment using RcisTarget, and (iii) regulon activity scoring using AUCell. Regulon specificity scores (RSS) were calculated to identify regulons that are preferentially active in specific cell types. The top cell-type-specific regulon for each of the 38 cell types was selected based on RSS and visualised as a dotplot.
4.19. Correlation Analysis Between Metabolites and Regulons
To examine the relationship between development-associated metabolic modules and transcriptional regulatory programmes, we correlated metabolite abundance with regulon activity scores. WGCNA module metabolites were correlated with regulon activity across samples using Pearson correlation. Regulons showing the highest positive correlations with each module were identified and reported. In addition, representative core metabolites from the intersection set were correlated with selected regulons of interest. Correlation strength and direction were visualised using scatter plots, with each point representing a biological sample.
4.20. Statistical Analysis and Reproducibility
All metabolomic analyses were performed in R (version 4.4.3). For boxplots, the box limits represent the interquartile range (IQR), the centre line denotes the median, and whiskers extend to the most extreme data point within 1.5 × IQR from the box. Individual replicates are shown as points. No statistical methods were used to pre-determine sample size; sample sizes were chosen based on feasibility and prior experience with embryonic metabolomics. Experiments were not randomised, and investigators were not blinded to allocation during outcome assessment, as morphological assessment of embryo development was unambiguous.
4.21. Data and Code Availability
The code and data supporting the findings of this study are available in an anonymous GitHub repository for peer-review purposes at the following link: https://anonymous.4open.science/r/Metabolomics-mouse-embryo-and-placenta-try4F3C.
The repository includes all input and processed data, as well as R and Python scripts required to reproduce the analyses. The single-cell transcriptomic data used in this study were obtained from Cao et al. (2019) and are available in the Gene Expression Omnibus (GEO) database under accession number GSE119945. All other data supporting the findings of this study are available from the corresponding author upon reasonable request.
Supplementary Materials
The following supporting information can be downloaded at the website of this paper posted on Preprints.org. Supplementary information includes supplemental figure legend and supplemental figures S1-S2.
Author Contributions
W.W. and Jia Z. collected the mouse embryos. W.W. and W.L. performed the data analysis. W.W. designed and carried out the validation experiments. W.W. edited the figures and wrote the original manuscript. W.W., Jia Z, and L.Z. participated in the discussion and modification of figures. Jin Z. supervised this work. L.Z. and Jin Z. completed the final manuscript.
Funding
This work was funded by the National Natural Science Foundation of China (Nos. 82373238 to J.Zhang.), the Key program of National Natural Science of China (32430029), the Department of Science and Technology of Zhejiang Province (Nos.2024SSYS0021), National Natural Science Foundation of China (82300800), and the National Science Foundation of Zhejiang Province (LY24C120001 to L.Z.).
Institutional Review Board Statement
The animal study protocol was approved by the Institutional Review Board of Zhejiang University (protocol code ZJU20230458 and approval date 23 November 2023).
Informed Consent Statement
Not applicable.
Data Availability Statement
The original data presented in the study are openly available in [GitHub] at [https://anonymous.4open.science/r/Metabolomics-mouse-embryo-and-placenta-try4F3C].
Acknowledgments
Technical support was provided by the core facilities at the Zhejiang University School of Medicine, the core facilities at the Zhejiang University Medical Center and Liangzhu Laboratory.
Conflicts of Interest
The authors declare no conflict of interest.
References
- Aguilera-Castrejon, A.; Oldak, B.; Shani, T.; Ghanem, N.; Itzkovich, C.; Slomovich, S.; Tarazi, S.; Bayerl, J.; Chugaeva, V.; Ayyash, M.; et al. Ex utero mouse embryogenesis from pre-gastrulation to late organogenesis. Nature 2021, 593, 119–124. [Google Scholar] [CrossRef]
- Aibar, S.; González-Blas, C.B.; Moerman, T.; Huynh-Thu, V.A.; Imrichova, H.; Hulselmans, G.; Rambow, F.; Marine, J.C.; Geurts, P.; Aerts, J.; et al. SCENIC: single-cell regulatory network inference and clustering. Nat. Methods 2017, 14, 1083–1086. [Google Scholar] [CrossRef]
- Barbie, D.A.; Tamayo, P.; Boehm, J.S.; Kim, S.Y.; Moody, S.E.; Dunn, I.F.; Schinzel, A.C.; Sandy, P.; Meylan, E.; Scholl, C.; et al. Systematic RNA interference reveals that oncogenic KRAS-driven cancers require TBK1. Nature 2009, 462, 108–112. [Google Scholar] [CrossRef]
- Baron, M.H.; Isern, J.; Fraser, S.T. The embryonic origins of erythropoiesis in mammals. Blood 2012, 119, 4828–4837. [Google Scholar] [CrossRef]
- Barritt, S.A.; DuBois-Coyne, S.E.; Dibble, C.C. Coenzyme A biosynthesis: mechanisms of regulation, function and disease. Nat. Metab. 2024, 6, 1008–1023. [Google Scholar] [CrossRef]
- Beccari, L.; Moris, N.; Girgin, M.; Turner, D.A.; Baillie-Johnson, P.; Cossy, A.C.; Lutolf, M.P.; Duboule, D.; Arias, A.M. Multi-axial self-organization properties of mouse embryonic stem cells into gastruloids. Nature 2018, 562, 272–276. [Google Scholar] [CrossRef]
- Cao, J.; Spielmann, M.; Qiu, X.; Huang, X.; Ibrahim, D.M.; Hill, A.J.; Zhang, F.; Mundlos, S.; Christiansen, L.; Steemers, F.J.; et al. The single-cell transcriptional landscape of mammalian organogenesis. Nature 2019, 566, 496–502. [Google Scholar] [CrossRef]
- Chen, A.; Liao, S.; Cheng, M.; Ma, K.; Wu, L.; Lai, Y.; Qiu, X.; Yang, J.; Xu, J.; Hao, S.; et al. Spatiotemporal transcriptomic atlas of mouse organogenesis using DNA nanoball-patterned arrays. Cell 2022, 185, 1777–1792.e1721. [Google Scholar] [CrossRef]
- Chen, G.; Liu, Z.; Wei, M.; Li, Q.; Wu, L.; Yu, K.; Xu, Y.; Yu, D.; Ma, W.; Wang, H.; et al. Dynamics of the Mammalian Placental Metabolome in Placentogenesis and Embryonic Development. Adv. Sci. (Weinh) 2026, 13, e07928. [Google Scholar] [CrossRef]
- Chen, L.; Zhang, L.; Ye, X.; Deng, Z.; Zhao, C. Ergothioneine and its congeners: anti-ageing mechanisms and pharmacophore biosynthesis. Protein Cell 2024, 15, 191–206. [Google Scholar] [CrossRef]
- Cliff, T.S.; Dalton, S. Metabolic switching and cell fate decisions: implications for pluripotency, reprogramming and development. Curr. Opin. Genet. Dev. 2017, 46, 44–49. [Google Scholar] [CrossRef]
- de Bruijn, M.F.; Speck, N.A.; Peeters, M.C.; Dzierzak, E. Definitive hematopoietic stem cells first develop within the major arterial regions of the mouse embryo. EMBO J. 2000, 19, 2465–2474. [Google Scholar] [CrossRef]
- Fang, Z.; Liu, X.; Peltz, G. GSEApy: a comprehensive package for performing gene set enrichment analysis in Python. In Bioinformatics (Oxford, England); 2023; p. 39. [Google Scholar]
- Futschik, M.E.; Carlisle, B. Noise-robust soft clustering of gene expression time-course data. J. Bioinform. Comput. Biol. 2005, 3, 965–988. [Google Scholar] [CrossRef]
- Gao, Y.; Yu, X.; Wang, Y.; Wang, H.; Wang, Y.L.; Shyh-Chang, N. Metabolic control of feto-placental development and pregnancy outcomes. Nat. Rev. Endocrinol. 2026, 22, 153–165. [Google Scholar] [CrossRef]
- Greene, N.D.; Copp, A.J. Inositol prevents folate-resistant neural tube defects in the mouse. Nat. Med. 1997, 3, 60–66. [Google Scholar] [CrossRef]
- Guérin, P.; El Mouatassim, S.; Ménézo, Y. Oxidative stress and protection against reactive oxygen species in the pre-implantation embryo and its surroundings. Hum. Reprod. Update 2001, 7, 175–189. [Google Scholar] [CrossRef]
- Jiménez-Nava, R.A.; Chávez-Camarillo, G.M.; Cristiani-Urbina, E. Biosynthesis, Regulation, and Biotechnological Production Strategies of Riboflavin (Vitamin B(2)) and Its Derivatives: A Review. Pharmaceuticals (Basel, Switzerland) 2026, 19. [Google Scholar]
- Kalisch-Smith, J.I. (2025). Feto-placental blood vessel development. Development 152.
- Kumar, N.; Mishra, B.; Athar, M.; Mukhtar, S. Inference of Gene Regulatory Network from Single-Cell Transcriptomic Data Using pySCENIC. Methods Mol. Biol. 2021, 2328, 171–182. [Google Scholar] [CrossRef]
- Lambert, I.H.; Kristensen, D.M.; Holm, J.B.; Mortensen, O.H. Physiological role of taurine--from organism to organelle. Acta Physiol. 2015, 213, 191–212. [Google Scholar] [CrossRef]
- Li, H.; Guan, W.; Huang, J.; Shen, P.; Wu, J.; Luo, H.; Yang, Y.; Ning, S.; Chang, L.; Zhao, H.; et al. A complete model of mouse embryogenesis through organogenesis enabled by chemically induced embryo founder cells. Cell 2025, 188, 5912–5930.e5920. [Google Scholar] [CrossRef]
- Lyu, J.; Ni, M.; Weiss, M.J.; Xu, J. Metabolic regulation of erythrocyte development and disorders. Exp. Hematol. 2024, 131, 104153. [Google Scholar] [CrossRef]
- Mandl, M.; Depping, R. Hypoxia-inducible aryl hydrocarbon receptor nuclear translocator (ARNT) (HIF-1β): is it a rare exception? Mol. Med. 2014, 20, 215–220. [Google Scholar] [CrossRef]
- Martí-Mateos, Y.; Safari, Z.; Bevers, S.; Midha, A.D.; Flanigan, W.R.; Joshi, T.; Huynh, H.; Desousa, B.R.; Blume, S.Y.; Baik, A.H.; et al. Red blood cells serve as a primary glucose sink to improve glucose tolerance at altitude. Cell Metab. 2026, 38, 529–545.e528. [Google Scholar] [CrossRef]
- Miyazawa, H.; Yamaguchi, Y.; Sugiura, Y.; Honda, K.; Kondo, K.; Matsuda, F.; Yamamoto, T.; Suematsu, M.; Miura, M. Rewiring of embryonic glucose metabolism via suppression of PFK-1 and aldolase during mouse chorioallantoic branching. Development 2017, 144, 63–73. [Google Scholar] [CrossRef]
- Oikawa, T.; Yamada, T.; Kihara-Negishi, F.; Yamamoto, H.; Kondoh, N.; Hitomi, Y.; Hashimoto, Y. The role of Ets family transcription factor PU.1 in hematopoietic cell differentiation, proliferation and apoptosis. Cell Death Differ. 1999, 6, 599–608. [Google Scholar] [CrossRef]
- Palis, J. Primitive and definitive erythropoiesis in mammals. Front. Physiol. 2014, 5, 3. [Google Scholar] [CrossRef]
- Perez-Ramirez, C.A.; Nakano, H.; Law, R.C.; Matulionis, N.; Thompson, J.; Pfeiffer, A.; Park, J.O.; Nakano, A.; Christofk, H.R. Atlas of fetal metabolism during mid-to-late gestation and diabetic pregnancy. Cell 2024, 187, 204–215 e214. [Google Scholar] [CrossRef]
- Placidi, M.; Casoli, G.; Tatone, C.; Di Emidio, G.; Bevilacqua, A. Myo-Inositol and Its Derivatives: Their Roles in the Challenges of Infertility. Biology 2024, 13. [Google Scholar] [CrossRef]
- Ryu, K.W.; Nandu, T.; Kim, J.; Challa, S.; DeBerardinis, R.J.; Kraus, W.L. (2018). Metabolic regulation of transcription through compartmentalized NAD(+) biosynthesis. Science 360.
- Setty, M.; Kiseliovas, V.; Levine, J.; Gayoso, A.; Mazutis, L.; Pe’er, D. Characterization of cell fate probabilities in single-cell data with Palantir. Nat. Biotechnol. 2019, 37, 451–460. [Google Scholar] [CrossRef]
- Solmonson, A.; Faubert, B.; Gu, W.; Rao, A.; Cowdin, M.A.; Menendez-Montes, I.; Kelekar, S.; Rogers, T.J.; Pan, C.; Guevara, G.; et al. Compartmentalized metabolism supports midgestation mammalian development. Nature 2022, 604, 349–353. [Google Scholar] [CrossRef]
- Subramanian, A.; Tamayo, P.; Mootha, V.K.; Mukherjee, S.; Ebert, B.L.; Gillette, M.A.; Paulovich, A.; Pomeroy, S.L.; Golub, T.R.; Lander, E.S.; et al. Gene set enrichment analysis: a knowledge-based approach for interpreting genome-wide expression profiles. Proc. Natl. Acad. Sci. U S A 2005, 102, 15545–15550. [Google Scholar] [CrossRef]
- van der Meer, L.T.; Jansen, J.H.; van der Reijden, B.A. Gfi1 and Gfi1b: key regulators of hematopoiesis. Leukemia 2010, 24, 1834–1843. [Google Scholar] [CrossRef]
- Weiler, P.; Theis, F.J. CellRank: consistent and data view agnostic fate mapping for single-cell genomics. Nat. Protoc. 2026, 21, 3552–3579. [Google Scholar] [CrossRef]
- Wolf, F.A.; Angerer, P.; Theis, F.J. SCANPY: large-scale single-cell gene expression data analysis. Genome Biol. 2018, 19, 15. [Google Scholar] [CrossRef]
- Xu, Y.; Xie, W.; Zhang, J. Metabolic regulation of key developmental events during mammalian embryogenesis. Nat. Cell Biol. 2025, 27, 1219–1229. [Google Scholar] [CrossRef]
- Zhang, B.; Horvath, S. A general framework for weighted gene co-expression network analysis. Stat. Appl. Genet. Mol. Biol. 2005, 4, Article17. [Google Scholar] [CrossRef]
- Zhang, J.; Nuebel, E.; Daley, G.Q.; Koehler, C.M.; Teitell, M.A. Metabolic regulation in pluripotent stem cells during reprogramming and self-renewal. Cell Stem Cell 2012, 11, 589–595. [Google Scholar] [CrossRef]
Figure 1.
Stage-associated metabolic remodelling in the mouse embryo from E9.5 to E13.5.(A) Schematic of the experimental design. Mouse embryos were collected at five developmental stages (five biological replicates for E9.5, E10.5, and E11.5; four biological replicates for E12.5 and E13.5). Placentas were collected at three developmental stages (four biological replicates for E10.5, E11.5, and E12.5) for parallel metabolomic profiling. All samples were subjected to untargeted LC–MS-based metabolomics.(B) Principal component analysis (PCA) scores plot of all embryonic samples. Samples are ordered along PC1 according to developmental stage, with a gradual transition from early to late gestation.(C–F) Volcano plots of pairwise comparisons between consecutive developmental stages: E10.5 versus E9.5 (C), E11.5 versus E10.5 (D), E12.5 versus E11.5 (E), and E13.5 versus E12.5 (F). Significantly altered metabolites (|log₂ fold change| > 0.32, VIP > 1, raw P < 0.05) are coloured in red (upregulated) or blue (downregulated). The top three up- and downregulated metabolites are annotated.(G) Bar chart showing the number of significantly changed metabolites in each consecutive stage comparison. In our dataset, the largest number of changes was detected between E11.5 and E12.5, although metabolites changed across all intervals.(H) Heatmap of the top 100 metabolites ranked by one-way ANOVA across all five stages, illustrating a broad temporal gradient.(I) Mfuzz clustering of all endogenous metabolites across developmental time. Six distinct temporal patterns were identified (clusters 1–6). Clusters 1 and 6 comprise metabolites that progressively increased from E9.5 to E13.5, whereas the remaining clusters showed decreasing or transient patterns.
Figure 1.
Stage-associated metabolic remodelling in the mouse embryo from E9.5 to E13.5.(A) Schematic of the experimental design. Mouse embryos were collected at five developmental stages (five biological replicates for E9.5, E10.5, and E11.5; four biological replicates for E12.5 and E13.5). Placentas were collected at three developmental stages (four biological replicates for E10.5, E11.5, and E12.5) for parallel metabolomic profiling. All samples were subjected to untargeted LC–MS-based metabolomics.(B) Principal component analysis (PCA) scores plot of all embryonic samples. Samples are ordered along PC1 according to developmental stage, with a gradual transition from early to late gestation.(C–F) Volcano plots of pairwise comparisons between consecutive developmental stages: E10.5 versus E9.5 (C), E11.5 versus E10.5 (D), E12.5 versus E11.5 (E), and E13.5 versus E12.5 (F). Significantly altered metabolites (|log₂ fold change| > 0.32, VIP > 1, raw P < 0.05) are coloured in red (upregulated) or blue (downregulated). The top three up- and downregulated metabolites are annotated.(G) Bar chart showing the number of significantly changed metabolites in each consecutive stage comparison. In our dataset, the largest number of changes was detected between E11.5 and E12.5, although metabolites changed across all intervals.(H) Heatmap of the top 100 metabolites ranked by one-way ANOVA across all five stages, illustrating a broad temporal gradient.(I) Mfuzz clustering of all endogenous metabolites across developmental time. Six distinct temporal patterns were identified (clusters 1–6). Clusters 1 and 6 comprise metabolites that progressively increased from E9.5 to E13.5, whereas the remaining clusters showed decreasing or transient patterns.
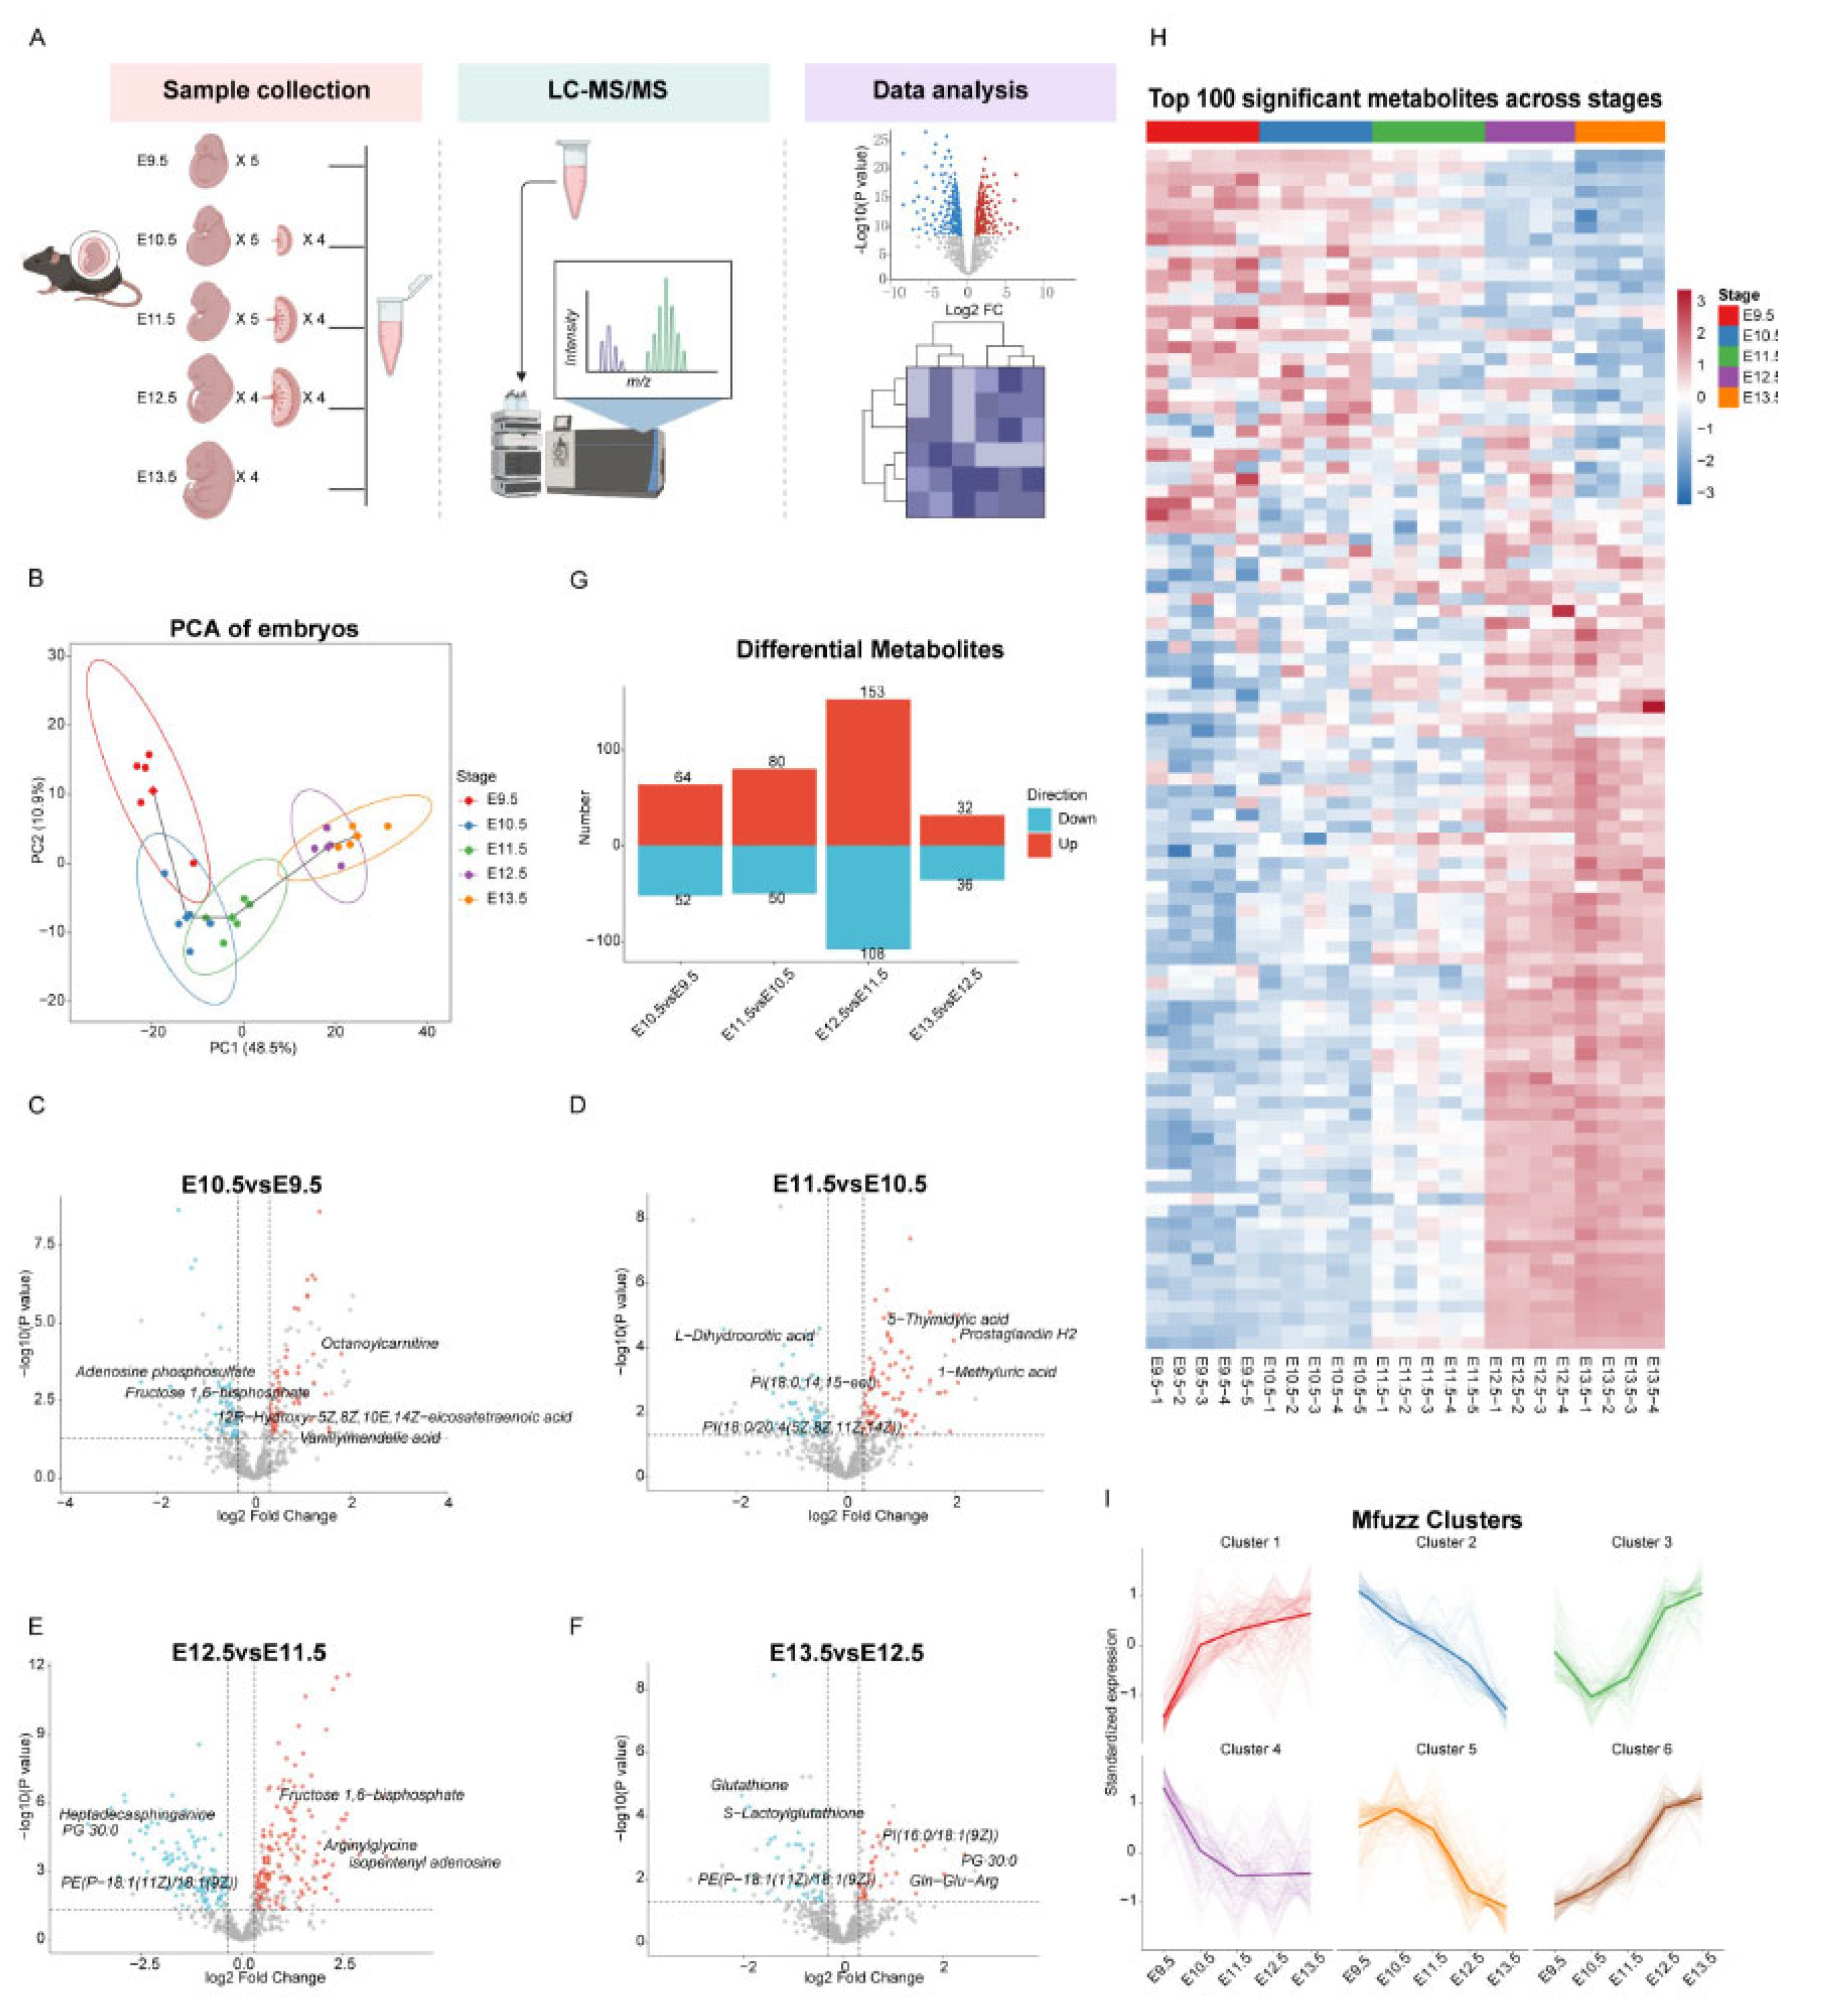
Figure 2.
Metabolomic comparison of the placenta and embryo reveals a shared set of metabolites increasing from E10.5 to E12.5.(A) Principal component analysis (PCA) scores plot of placental metabolomic profiles at E10.5, E11.5, and E12.5. Samples are ordered along PC1 according to developmental stage, indicating gradual metabolomic change.(B, C) Volcano plots of pairwise comparisons between consecutive placental stages: E11.5 versus E10.5 (B) and E12.5 versus E11.5 (C). Significantly altered metabolites (|log₂ fold change| > 0.32, VIP > 1, raw P < 0.05) are coloured in red (upregulated) or blue (downregulated). The top three up- and downregulated metabolites are annotated.(D) Bar chart showing the number of significantly upregulated metabolites in each pairwise comparison. The E11.5 versus E10.5 comparison identified 82 upregulated metabolites, whereas E12.5 versus E11.5 identified 51.(E) Venn diagram showing the overlap between metabolites with ANOVA-defined increasing trends in the placenta and embryo. A total of 73 metabolites were shared, representing metabolites that increased in both tissues during this window.(F) Heatmap of the 73 shared metabolites across matched embryonic and placental samples at E10.5, E11.5, and E12.5.(G) KEGG pathway enrichment analysis of the 73 shared metabolites. Significantly enriched pathways included pantothenate and CoA biosynthesis, ascorbate and aldarate metabolism, taurine and hypotaurine metabolism, and other metabolic pathways, suggesting coordinated metabolic changes in the embryo and placenta.(H, I) Boxplots showing the abundance of D-fructose (H) and pseudouridine (I) in embryonic and placental samples across E10.5, E11.5, and E12.5. Both metabolites increased with developmental time in both tissues.
Figure 2.
Metabolomic comparison of the placenta and embryo reveals a shared set of metabolites increasing from E10.5 to E12.5.(A) Principal component analysis (PCA) scores plot of placental metabolomic profiles at E10.5, E11.5, and E12.5. Samples are ordered along PC1 according to developmental stage, indicating gradual metabolomic change.(B, C) Volcano plots of pairwise comparisons between consecutive placental stages: E11.5 versus E10.5 (B) and E12.5 versus E11.5 (C). Significantly altered metabolites (|log₂ fold change| > 0.32, VIP > 1, raw P < 0.05) are coloured in red (upregulated) or blue (downregulated). The top three up- and downregulated metabolites are annotated.(D) Bar chart showing the number of significantly upregulated metabolites in each pairwise comparison. The E11.5 versus E10.5 comparison identified 82 upregulated metabolites, whereas E12.5 versus E11.5 identified 51.(E) Venn diagram showing the overlap between metabolites with ANOVA-defined increasing trends in the placenta and embryo. A total of 73 metabolites were shared, representing metabolites that increased in both tissues during this window.(F) Heatmap of the 73 shared metabolites across matched embryonic and placental samples at E10.5, E11.5, and E12.5.(G) KEGG pathway enrichment analysis of the 73 shared metabolites. Significantly enriched pathways included pantothenate and CoA biosynthesis, ascorbate and aldarate metabolism, taurine and hypotaurine metabolism, and other metabolic pathways, suggesting coordinated metabolic changes in the embryo and placenta.(H, I) Boxplots showing the abundance of D-fructose (H) and pseudouridine (I) in embryonic and placental samples across E10.5, E11.5, and E12.5. Both metabolites increased with developmental time in both tissues.
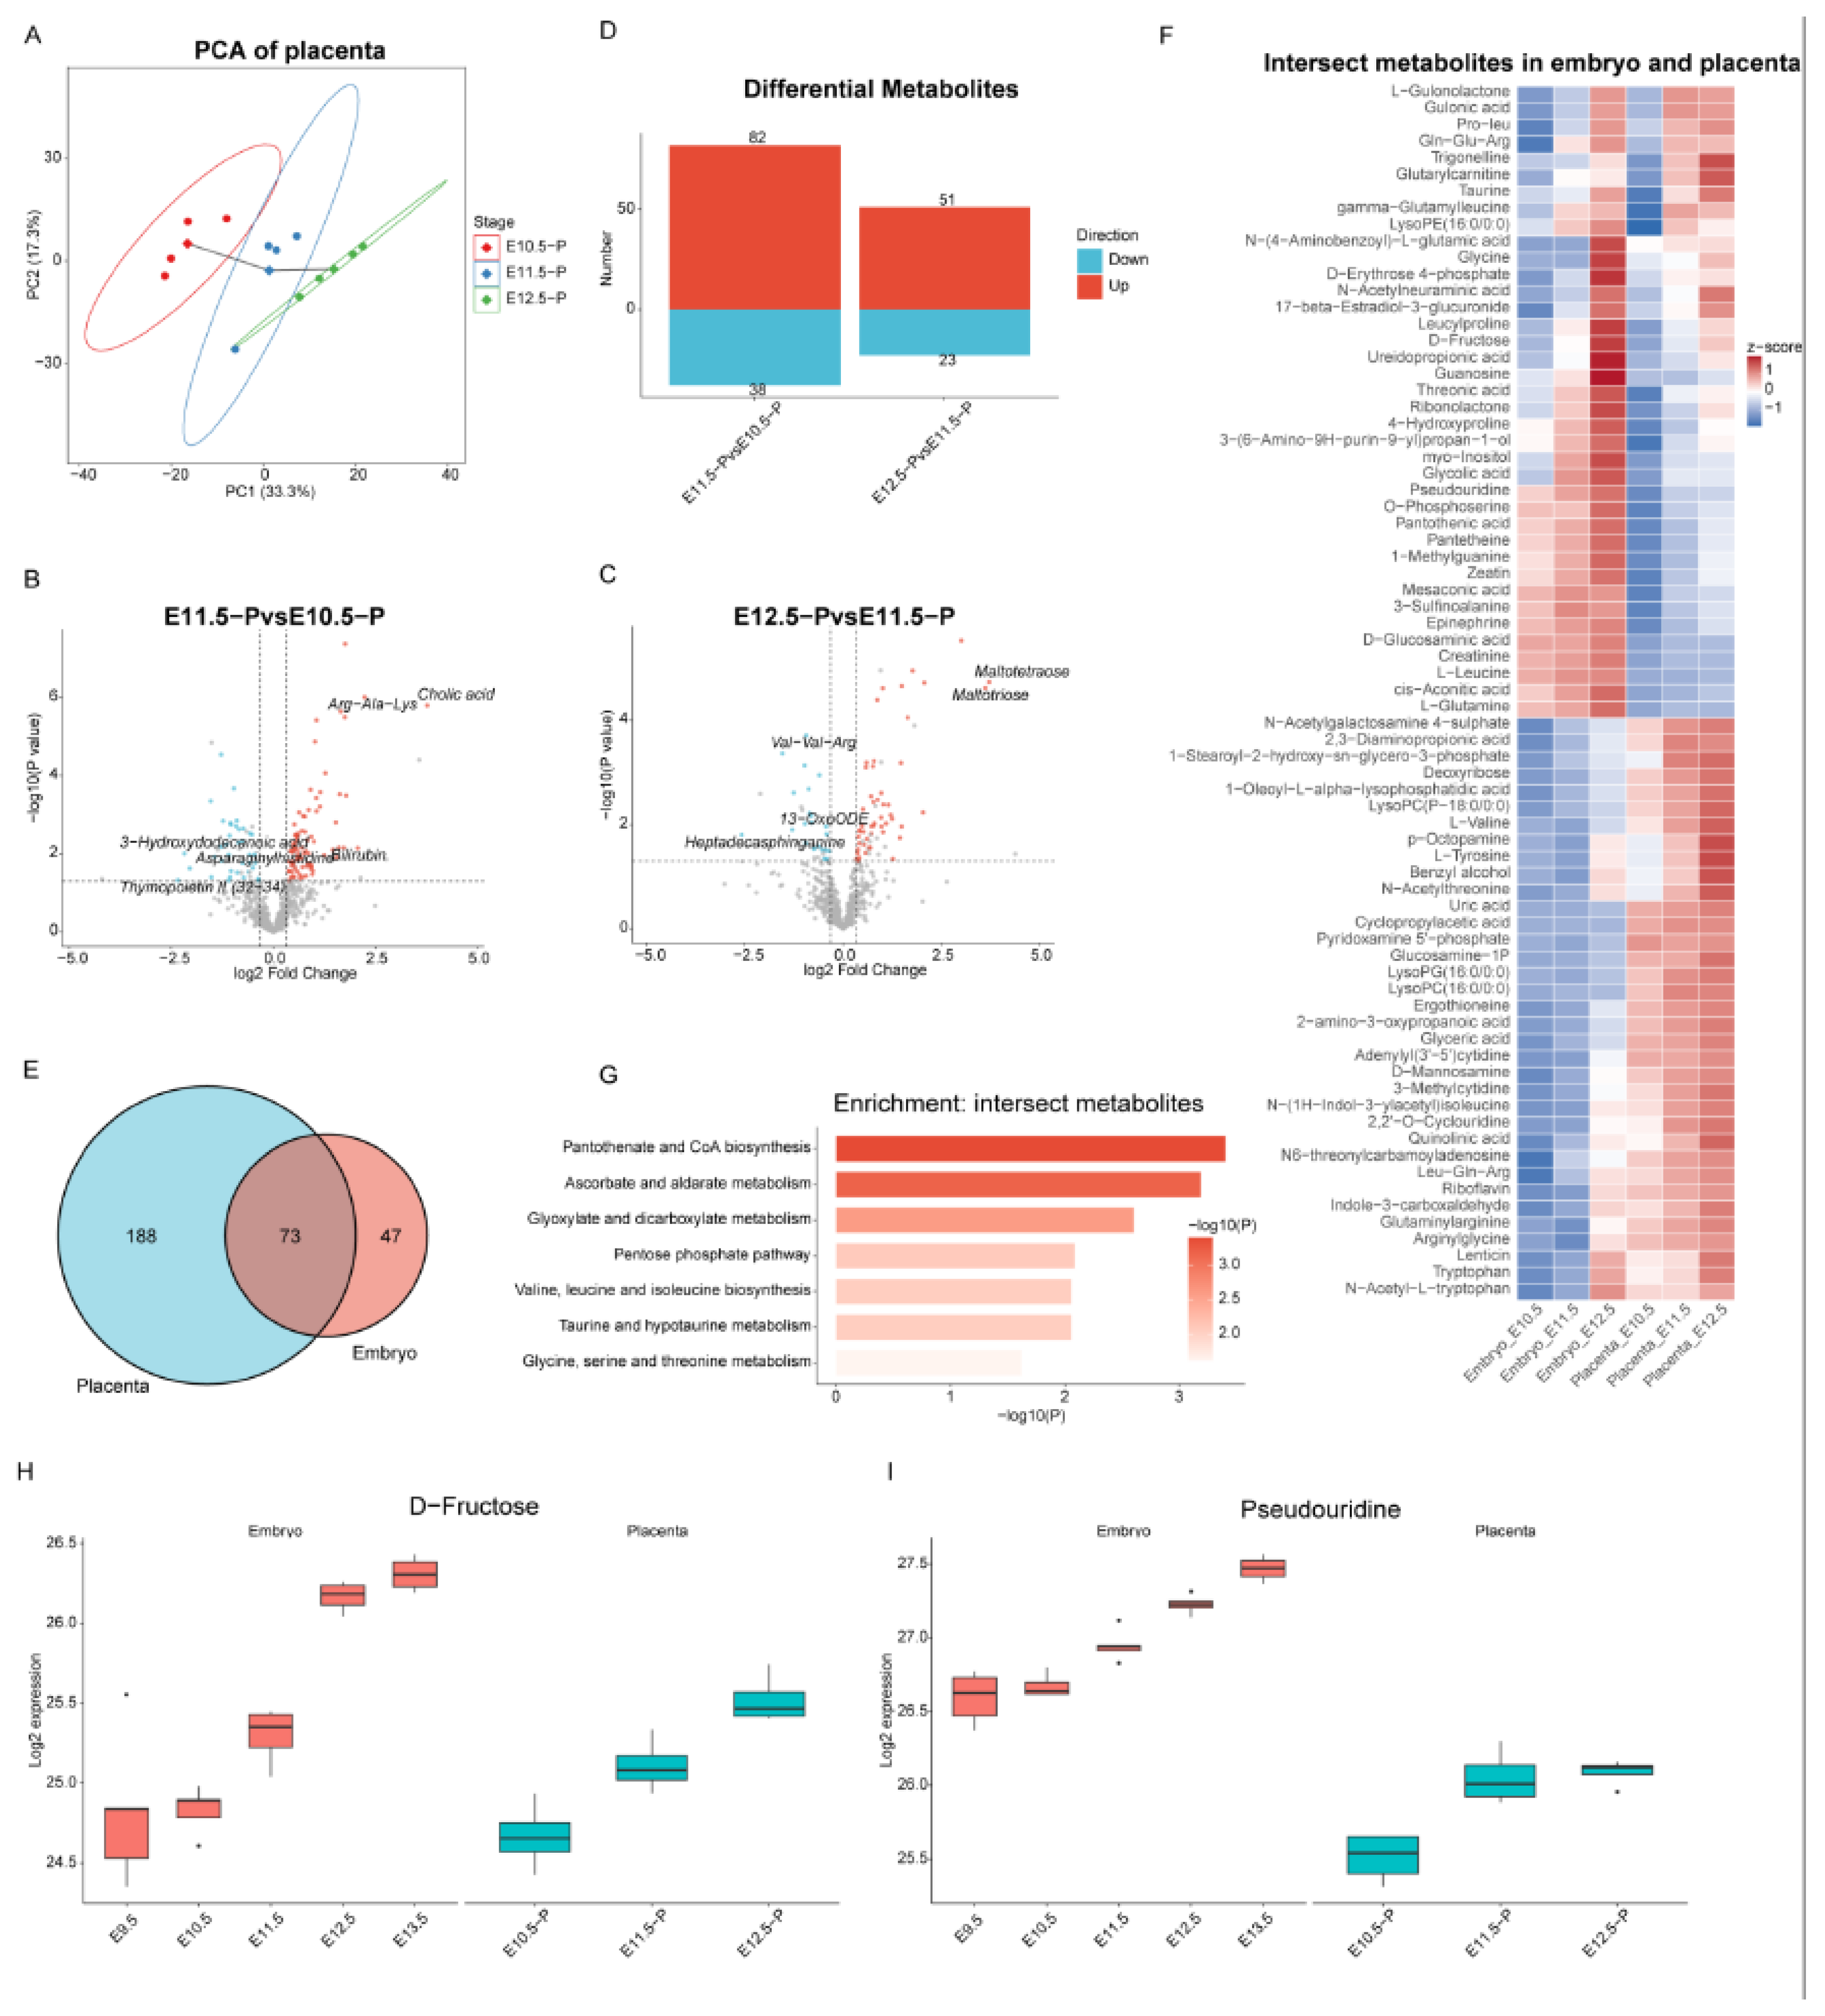
Figure 3.
WGCNA identifies development-associated metabolite modules and converges on a core set of metabolites co-increasing in the embryo and placenta.(A) WGCNA dendrogram of embryonic metabolites. Branches are coloured according to module assignment, identifying modules of co-abundant metabolites across developmental stages.(B) Module–stage correlation heatmap. Module 3 showed the strongest positive correlation with developmental stage, followed by Module 2, whereas Module 1 showed the strongest negative correlation.(C) KEGG pathway enrichment analysis of metabolites in Module 3. Significantly enriched pathways included ascorbate and aldarate metabolism, pantothenate and CoA biosynthesis, and valine, leucine and isoleucine biosynthesis.(D) KEGG pathway enrichment analysis of metabolites in Module 2. Significantly enriched pathways included fructose and mannose metabolism, the pentose phosphate pathway, and taurine and hypotaurine metabolism.(E) Venn diagram showing the overlap between the union of Module 2 and Module 3 metabolites and the 73 metabolites with ANOVA-defined increasing trends shared by the embryo and placenta. This identified 56 core metabolites that were both developmentally associated and co-increasing in the two tissues.(F) Correlation network of the top 30 core metabolites. Nodes represent metabolites and edges represent pairwise correlations, highlighting densely connected groups among the 56 core metabolites.(G–L) Boxplots showing the abundance of six representative core metabolites: glyceric acid (G), arginylglycine (H), riboflavin (I), myo-inositol (J), taurine (K), and ergothioneine (L). Individual points represent biological replicates.
Figure 3.
WGCNA identifies development-associated metabolite modules and converges on a core set of metabolites co-increasing in the embryo and placenta.(A) WGCNA dendrogram of embryonic metabolites. Branches are coloured according to module assignment, identifying modules of co-abundant metabolites across developmental stages.(B) Module–stage correlation heatmap. Module 3 showed the strongest positive correlation with developmental stage, followed by Module 2, whereas Module 1 showed the strongest negative correlation.(C) KEGG pathway enrichment analysis of metabolites in Module 3. Significantly enriched pathways included ascorbate and aldarate metabolism, pantothenate and CoA biosynthesis, and valine, leucine and isoleucine biosynthesis.(D) KEGG pathway enrichment analysis of metabolites in Module 2. Significantly enriched pathways included fructose and mannose metabolism, the pentose phosphate pathway, and taurine and hypotaurine metabolism.(E) Venn diagram showing the overlap between the union of Module 2 and Module 3 metabolites and the 73 metabolites with ANOVA-defined increasing trends shared by the embryo and placenta. This identified 56 core metabolites that were both developmentally associated and co-increasing in the two tissues.(F) Correlation network of the top 30 core metabolites. Nodes represent metabolites and edges represent pairwise correlations, highlighting densely connected groups among the 56 core metabolites.(G–L) Boxplots showing the abundance of six representative core metabolites: glyceric acid (G), arginylglycine (H), riboflavin (I), myo-inositol (J), taurine (K), and ergothioneine (L). Individual points represent biological replicates.
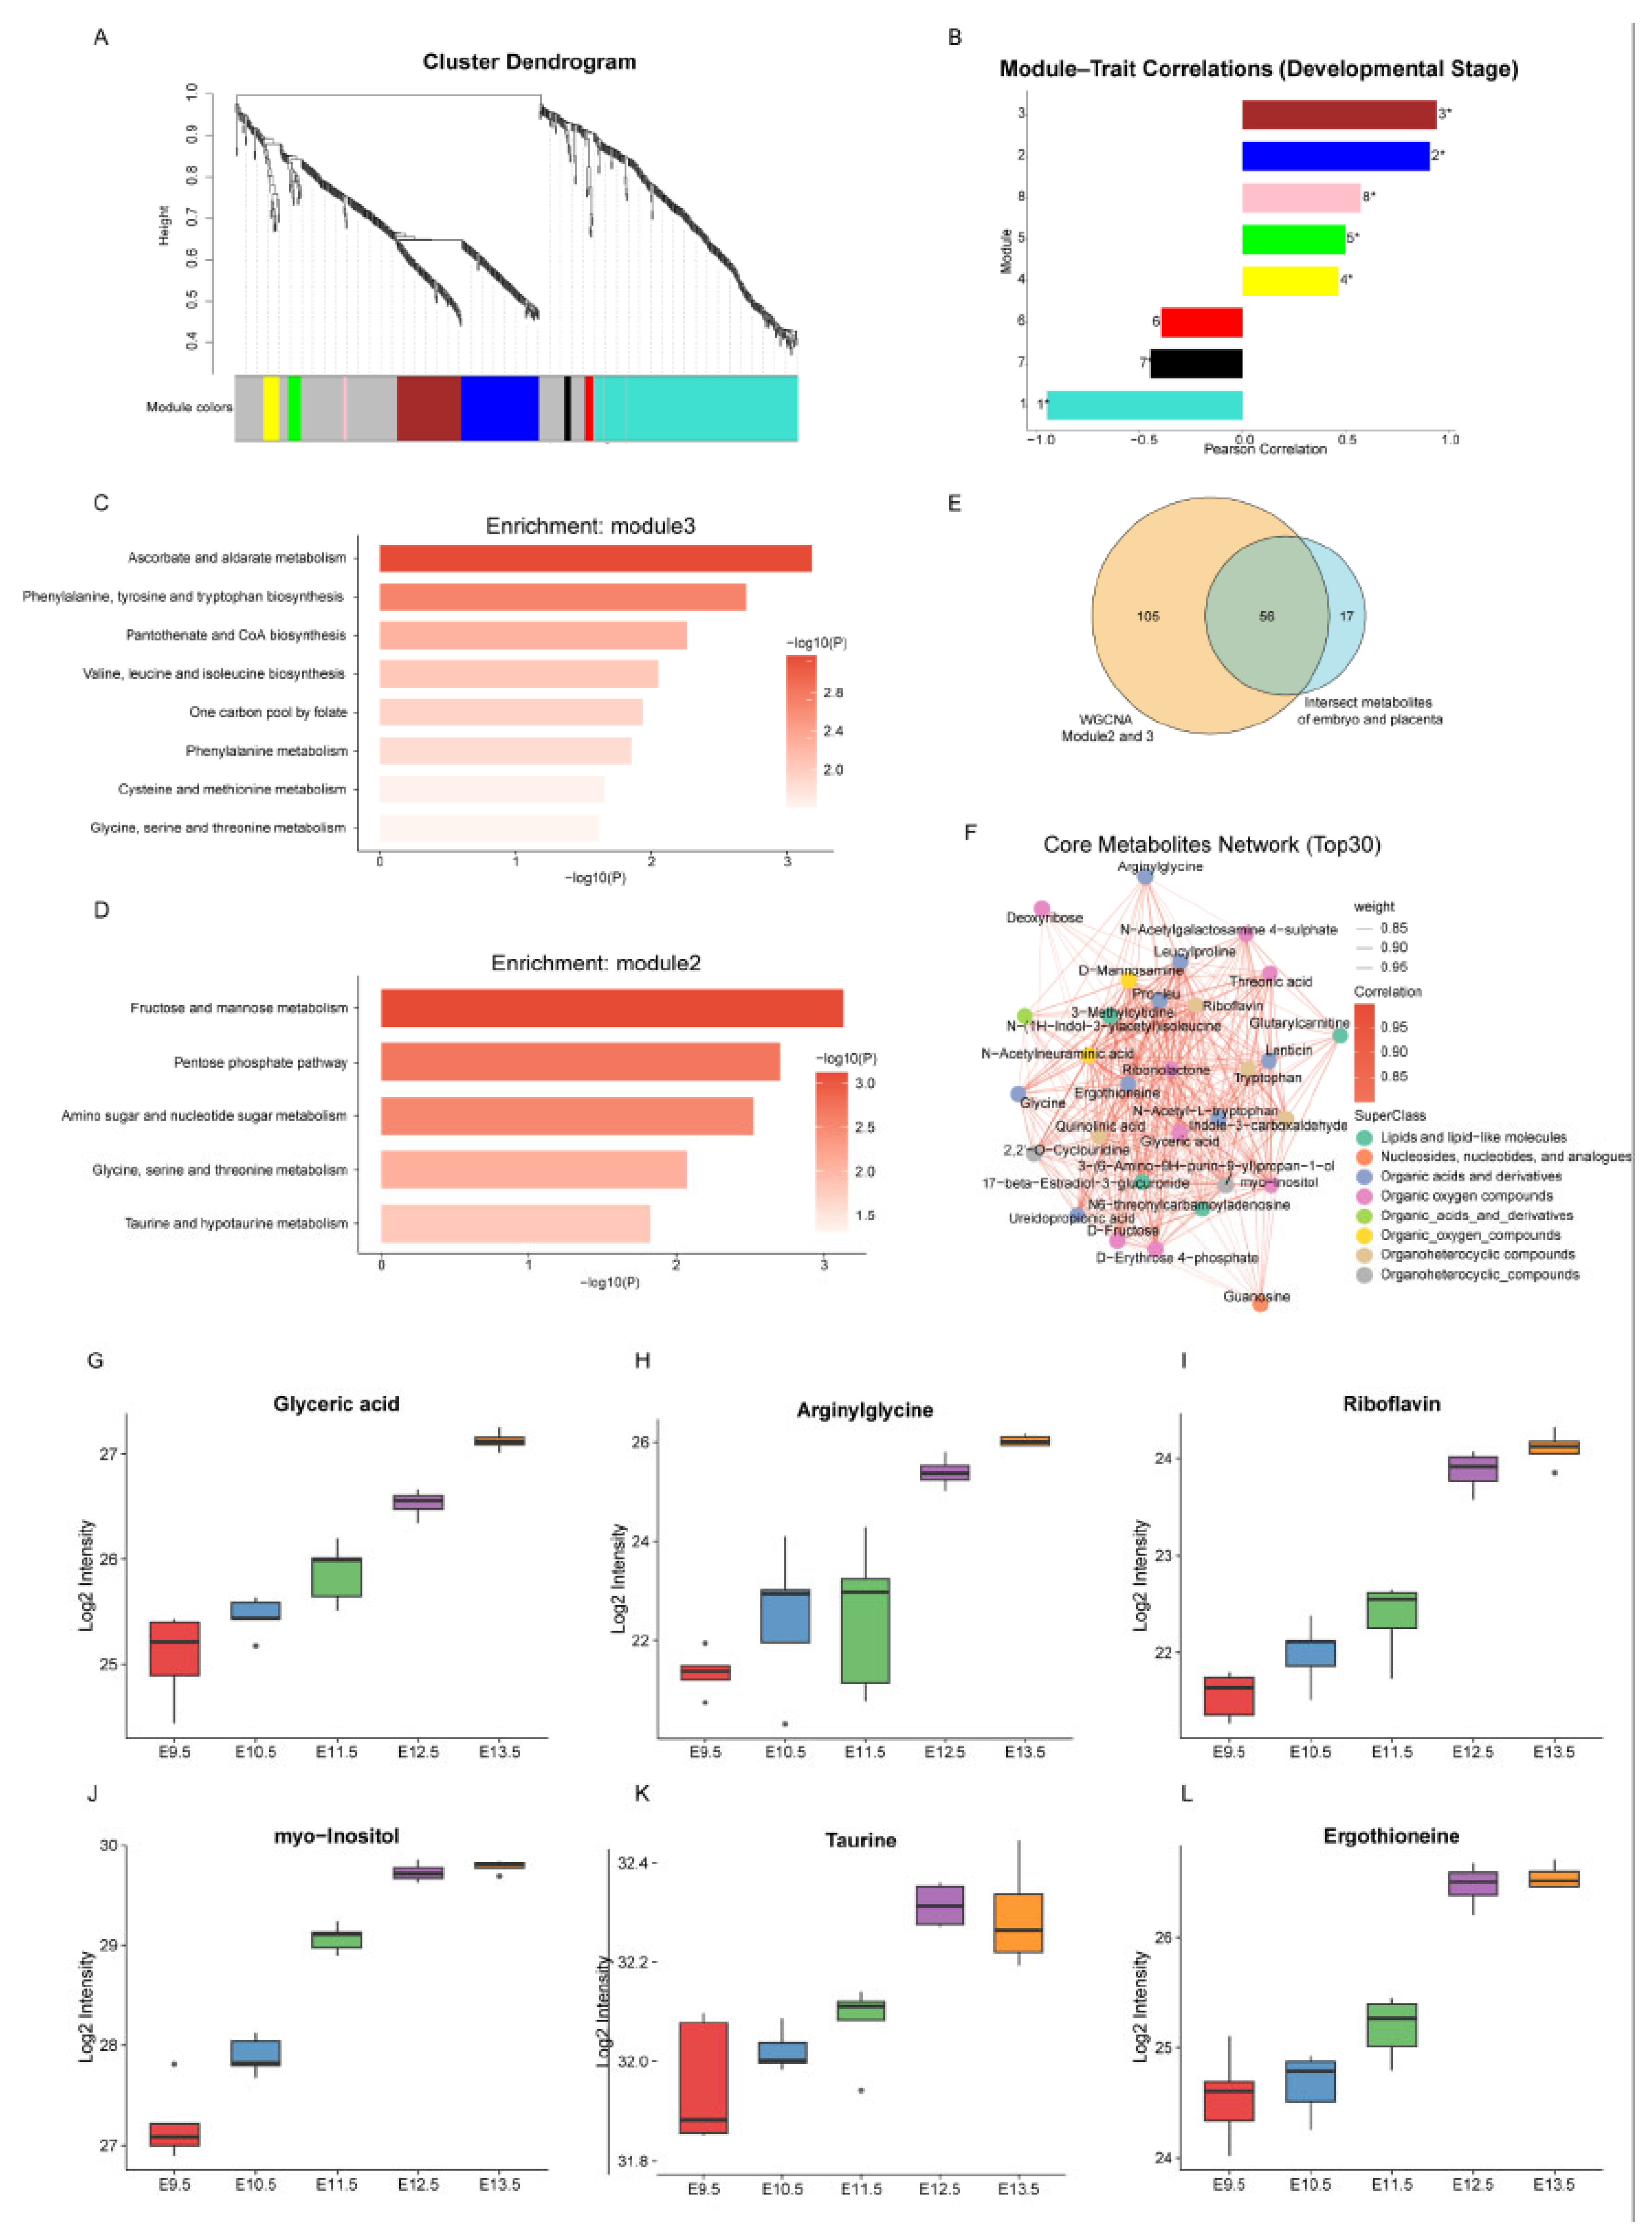
Figure 4.
Integrative single-cell and metabolomic analysis reveals a metabolic programme associated with definitive erythroid maturation.(A) UMAP embedding of single-cell transcriptomes from E9.5–E13.5 mouse embryos, coloured by 38 annotated cell types. Data were obtained from a published atlas (Cao et al., 2019) and re-embedded for visualisation.(B) Dynamic changes in cell type proportions across the five developmental stages, illustrating the extensive cellular remodelling during this window.(C) Dotplot of selected cell-type-enriched metabolic genes. Dot size represents the fraction of expressing cells, and colour intensity indicates scaled average expression.(D) KEGG pathway enrichment analysis of metabolic genes enriched in the definitive erythroid lineage. Significantly enriched pathways included phenylalanine metabolism, beta-alanine metabolism, and nicotinate and nicotinamide metabolism.(E) UMAP embedding of definitive erythroid lineage cells, coloured by inferred pseudotime.(F) CellRank-inferred differentiation trajectory of definitive erythroid lineage cells, based on Palantir pseudotime. Arrows indicate the direction of differentiation from early progenitors toward more mature erythroid cells.(G) Expression dynamics of representative metabolic genes along the definitive erythroid pseudotime. Early-stage cells showed higher expression of Sulf1, Kcnb2, and Kcnq5, whereas more mature cells progressively upregulated Nmnat2, Cacna2d1, and Slc2a1.(H) Pathway activity score of nicotinate and nicotinamide metabolism estimated from embryonic metabolomic data, showing a progressive increase from E10.5 to E13.5.(I) Heatmap of metabolites associated with nicotinate and nicotinamide metabolism. Niacinamide, NAD, and 1-methylnicotinamide increased from E10.5 to E13.5, consistent with the pathway activity trajectory.
Figure 4.
Integrative single-cell and metabolomic analysis reveals a metabolic programme associated with definitive erythroid maturation.(A) UMAP embedding of single-cell transcriptomes from E9.5–E13.5 mouse embryos, coloured by 38 annotated cell types. Data were obtained from a published atlas (Cao et al., 2019) and re-embedded for visualisation.(B) Dynamic changes in cell type proportions across the five developmental stages, illustrating the extensive cellular remodelling during this window.(C) Dotplot of selected cell-type-enriched metabolic genes. Dot size represents the fraction of expressing cells, and colour intensity indicates scaled average expression.(D) KEGG pathway enrichment analysis of metabolic genes enriched in the definitive erythroid lineage. Significantly enriched pathways included phenylalanine metabolism, beta-alanine metabolism, and nicotinate and nicotinamide metabolism.(E) UMAP embedding of definitive erythroid lineage cells, coloured by inferred pseudotime.(F) CellRank-inferred differentiation trajectory of definitive erythroid lineage cells, based on Palantir pseudotime. Arrows indicate the direction of differentiation from early progenitors toward more mature erythroid cells.(G) Expression dynamics of representative metabolic genes along the definitive erythroid pseudotime. Early-stage cells showed higher expression of Sulf1, Kcnb2, and Kcnq5, whereas more mature cells progressively upregulated Nmnat2, Cacna2d1, and Slc2a1.(H) Pathway activity score of nicotinate and nicotinamide metabolism estimated from embryonic metabolomic data, showing a progressive increase from E10.5 to E13.5.(I) Heatmap of metabolites associated with nicotinate and nicotinamide metabolism. Niacinamide, NAD, and 1-methylnicotinamide increased from E10.5 to E13.5, consistent with the pathway activity trajectory.
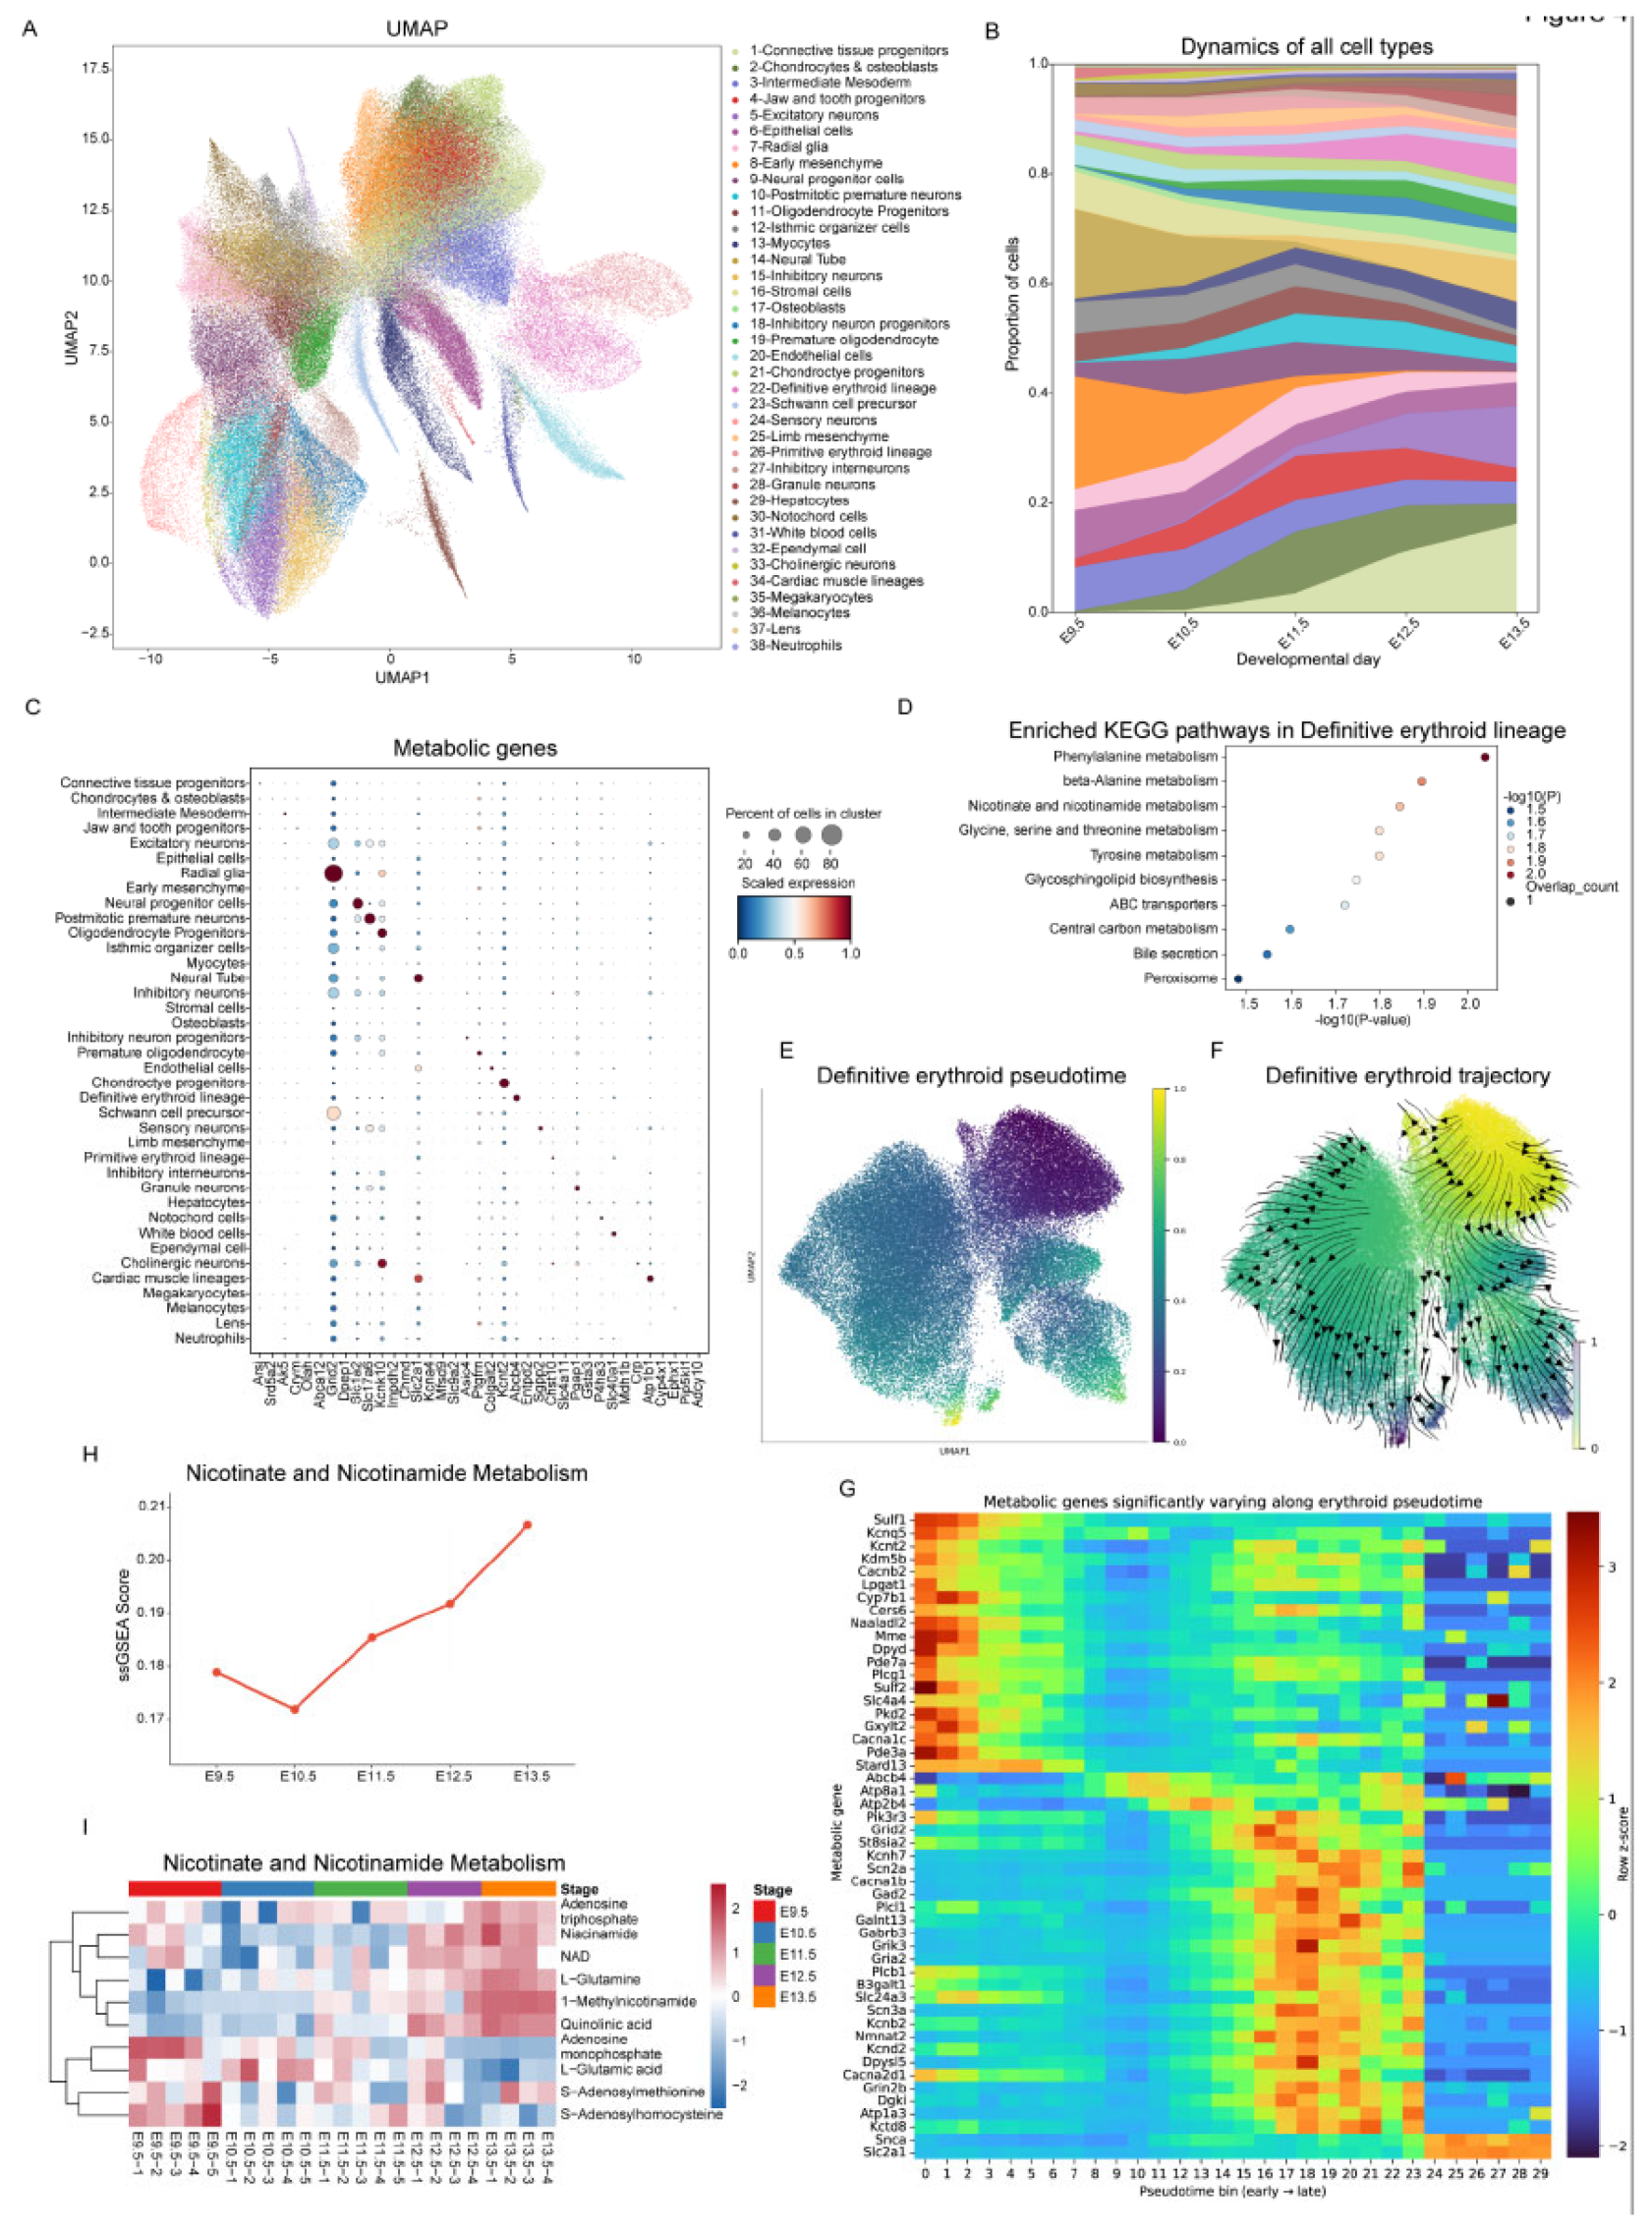
Figure 5.
Integrative regulon–metabolite correlation analysis identifies candidate transcriptional regulators of developmental metabolic programmes.(A) Dotplot of the top cell-type-specific regulon based on pySCENIC regulon specificity score for each of the 38 annotated cell types. Representative examples include Gata6(+) in cardiomyocytes, TCF3(+) in the definitive erythroid lineage, and Spi1(+) in white blood cells, the latter likely reflecting haematopoietic stem/progenitor populations grouped within this broad category.(B) Correlation analysis between metabolites in WGCNA Module 3 and regulon activity scores. Regulons showing high positive correlations included Thra(+) (thyroid hormone signalling and metabolic regulation), Maf(+) (differentiation and stress response), Arnt(+) (hypoxia and metabolic adaptation), Spi1(+) (haematopoietic lineage specification), and Atf7(+) (stress and metabolic gene regulation).(C) Correlation analysis between metabolites in WGCNA Module 2 and regulon activity scores. Regulons showing high positive correlations included Arnt(+) (hypoxia and metabolic adaptation), Nr1i2(+) (xenobiotic and energy metabolism), Pparg(+) (lipid metabolism and adipogenesis), Ikzf2(+) (immune cell development), and Gfi1(+) (haematopoietic stem cell and lymphoid development).(D–G) Representative metabolite–regulon correlation plots: glyceric acid with Spi1(+) (D), glyceric acid with Gfi1(+) (E), pantothenic acid with Maf(+) (F), and arginylglycine with Arnt(+) (G). Each point represents a sample; correlation strength and direction are indicated.(H) Schematic of the rotating-vessel post-implantation embryo culture system, adapted from Hanna and colleagues (2021). Embryos are collected at E7.5 and cultured ex vivo under continuous rotation with rat serum-supplemented medium.(I) Bright-field images showing morphological progression of embryos cultured from E7.5 to E11.5 in the rotating-vessel system, demonstrating that key developmental milestones observed in vivo can be recapitulated ex vivo.
Figure 5.
Integrative regulon–metabolite correlation analysis identifies candidate transcriptional regulators of developmental metabolic programmes.(A) Dotplot of the top cell-type-specific regulon based on pySCENIC regulon specificity score for each of the 38 annotated cell types. Representative examples include Gata6(+) in cardiomyocytes, TCF3(+) in the definitive erythroid lineage, and Spi1(+) in white blood cells, the latter likely reflecting haematopoietic stem/progenitor populations grouped within this broad category.(B) Correlation analysis between metabolites in WGCNA Module 3 and regulon activity scores. Regulons showing high positive correlations included Thra(+) (thyroid hormone signalling and metabolic regulation), Maf(+) (differentiation and stress response), Arnt(+) (hypoxia and metabolic adaptation), Spi1(+) (haematopoietic lineage specification), and Atf7(+) (stress and metabolic gene regulation).(C) Correlation analysis between metabolites in WGCNA Module 2 and regulon activity scores. Regulons showing high positive correlations included Arnt(+) (hypoxia and metabolic adaptation), Nr1i2(+) (xenobiotic and energy metabolism), Pparg(+) (lipid metabolism and adipogenesis), Ikzf2(+) (immune cell development), and Gfi1(+) (haematopoietic stem cell and lymphoid development).(D–G) Representative metabolite–regulon correlation plots: glyceric acid with Spi1(+) (D), glyceric acid with Gfi1(+) (E), pantothenic acid with Maf(+) (F), and arginylglycine with Arnt(+) (G). Each point represents a sample; correlation strength and direction are indicated.(H) Schematic of the rotating-vessel post-implantation embryo culture system, adapted from Hanna and colleagues (2021). Embryos are collected at E7.5 and cultured ex vivo under continuous rotation with rat serum-supplemented medium.(I) Bright-field images showing morphological progression of embryos cultured from E7.5 to E11.5 in the rotating-vessel system, demonstrating that key developmental milestones observed in vivo can be recapitulated ex vivo.
Disclaimer/Publisher’s Note: The statements, opinions and data contained in all publications are solely those of the individual author(s) and contributor(s) and not of MDPI and/or the editor(s). MDPI and/or the editor(s) disclaim responsibility for any injury to people or property resulting from any ideas, methods, instructions or products referred to in the content. |
© 2026 by the authors. Licensee MDPI, Basel, Switzerland. This article is an open access article distributed under the terms and conditions of the Creative Commons Attribution (CC BY) license (http://creativecommons.org/licenses/by/4.0/).
Copyright: This open access article is published under a Creative Commons CC BY 4.0 license, which permit the free download, distribution, and reuse, provided that the author and preprint are cited in any reuse.