
Submitted:
22 September 2026
Posted:
23 September 2026
You are already at the latest version
Abstract
Background: Commercial flavoured dairy products contain milk-derived minerals and proteins that may protect enamel, but they may also contain acids capable of promoting erosion. This study investigated the effects of repeated exposure to six flavoured dairy products on primary tooth enamel in vitro. Methods: A total of 108 non-carious primary molars were allocated to independent analytical sets: 56 intact teeth for weight analysis (n = 7/group), 28 teeth sectioned to obtain 56 enamel specimens for Vickers microhardness testing (n = 7/group), and 24 intact teeth for micro-CT analysis (n = 3/group). Six dairy products, cola and artificial saliva constituted eight experimental groups. Specimens were exposed for 5 min twice daily for six months. Weight and microhardness were assessed at baseline and after 1, 3 and 6 months; apparent mineral density was assessed at baseline and after 6 months. Results: At six months, mean weight decreased by 10.5%-14.0% in the dairy-product groups and by 20.6% in the cola group, compared with 0.8% in the artificial-saliva group. Mean microhardness decreased by 60.2%-68.3% in the dairy-product groups and by 60.6% in the cola group, whereas the artificial-saliva group showed a 17.1% increase. Significant time and time-by-group effects were observed for weight and microhardness (p < 0.001). No significant within-group or between-group differences were detected by micro-CT (p > 0.05). Conclusions: Repeated exposure to the tested flavoured dairy products produced measurable reductions in whole-tooth weight and enamel surface microhardness under the experimental conditions. The exploratory micro-CT analysis did not detect statistically significant changes in apparent mineral density. Adequately powered in situ and clinical studies are required before these findings can inform dietary recommendations.
Keywords:
dental erosion
; primary enamel
; dairy products
; microhardness
; micro-computed tomography
; pediatric dentistry
1. Introduction
Dental erosion is a chemically mediated, irreversible loss of dental hard tissue that occurs without the involvement of bacterial acids [1]. In children, repeated contact with dietary acids may soften enamel before tissue loss becomes clinically apparent [1,2]. This process differs from dental caries: carious demineralisation results from bacterial metabolism of fermentable carbohydrates within a biofilm, whereas an acidic food or beverage may act directly on an exposed tooth surface. As the present model did not include biofilm, it evaluated direct erosive effects and cannot provide information on the cariogenic potential of sugars in the tested products.
Initial pH represents only one aspect of an erosive challenge. Titratable acidity and buffering capacity influence both the amount of alkali required for neutralisation and the persistence of the acidic environment. The chemical identity of the acid is also relevant; citrate, for example, can both donate hydrogen ions and chelate calcium. Mineral dissolution may be further modified by calcium, phosphate and fluoride concentrations, saturation with respect to hydroxyapatite, viscosity, surface adherence and oral clearance [2,3,15,28]. Consequently, products with similar initial pH values may affect enamel differently, and mineral or protein constituents may partially offset the effect of a low-pH formulation.
Calcium, phosphate and casein in milk may limit enamel dissolution or promote mineral recovery under certain experimental conditions [3,4]. Fermentation and flavouring, however, may introduce organic acids, fruit ingredients and added sugars, thereby altering the physicochemical properties of the final product. Flavoured dairy products therefore combine potentially protective milk-derived constituents with a possible acidic challenge. Previous investigations of yoghurts, yoghurt drinks, fermented milk and other beverages have reported inconsistent findings [16,17,18,19,24]. Differences in product formulation, dental substrate, exposure regimen, saliva substitute and analytical method limit direct comparison among studies.
Findings obtained from permanent teeth cannot necessarily be extrapolated to the primary dentition. Primary enamel is thinner and differs in its structural and mineral characteristics, which may influence both the rate and depth of acid-induced changes [5,22,23]. Erosive wear in primary teeth may also indicate continued susceptibility after eruption of the permanent dentition [6,7]. Nevertheless, evidence regarding prolonged, repeated exposure of primary enamel to commercially available flavoured dairy products remains limited.
No single laboratory endpoint can fully characterise dental erosion. Whole-tooth weight reflects cumulative change but is influenced by specimen size and hydration. Surface microhardness is sensitive to localised softening, whereas micro-computed tomography (micro-CT) measures attenuation within a selected volume without sectioning the tooth. The sensitivity of micro-CT depends on spatial resolution, image reconstruction, calibration and sample size [12,14]. Microhardness and nanoindentation can detect early surface alteration, although their results are affected by surface preparation and indentation location [23]. We therefore used three complementary outcomes and considered both agreement and discordance among measurements obtained at different spatial scales.
This study aimed to determine the effects of repeated exposure to six commercially available flavoured dairy products on primary tooth enamel over six months in vitro. Cola and artificial saliva served as the positive and negative controls, respectively. The prespecified outcomes were whole-tooth weight, Vickers surface microhardness and micro-CT-derived apparent mineral density. The null hypothesis was that repeated exposure to the dairy products would not alter these outcomes relative to the control groups.
2. Materials and Methods
Sample Preparation
The study included 108 extracted, non-carious human primary molars. The protocol was approved by the Scientific Research Ethics Committee of the Karadeniz Technical University Faculty of Medicine (approval no. 2016/123; 19 October 2016). Teeth were excluded if they exhibited caries, restorations, previous endodontic treatment, developmental defects or loss of coronal structure. Eligible teeth were stored in 0.5% chloramine-T until specimen preparation. Residual deposits were subsequently removed using a pumice-water slurry and a polishing brush mounted in a low-speed handpiece.
The sample was allocated to three mutually exclusive analytical sets (Figure 1). The weight-analysis set comprised 56 intact molars. For microhardness testing, 28 additional molars were sectioned at the cementoenamel junction and divided buccolingually to obtain 56 enamel specimens. The remaining 24 intact molars constituted the micro-CT set. This allocation accounts for all 108 teeth. No post-allocation exclusions or specimen losses were documented in the archived records.
For microhardness testing, the 56 enamel specimens were embedded in eight acrylic blocks, with seven specimens per block and the enamel surfaces exposed. Flat test surfaces were prepared sequentially using 600-, 900- and 1200-grit aluminium-oxide abrasive papers; care was taken to avoid exposing dentine. Two coats of nail varnish were applied to each specimen, leaving a central circular enamel window approximately 0.5 mm in diameter. Before baseline assessment and commencement of the exposure protocol, the blocks were stored in distilled water at 37 °C for 24 h.
Experimental Design
The intact teeth and mounted specimens were randomly assigned to eight experimental groups: biscuit-flavoured petit suisse yoghurt, strawberry yoghurt drink, strawberry milkshake, strawberry yoghurt, forest-fruit kefir, banana kefir, cola and artificial saliva. Cola served as the positive control and artificial saliva as the negative control. Each group comprised seven intact teeth for weight analysis, seven enamel specimens mounted in one acrylic block for microhardness testing and three intact teeth for micro-CT (n = 7, n = 7 and n = 3, respectively). Although the archived thesis states that allocation was random, the method used to generate the allocation sequence was not recorded. Table 1 presents the manufacturer-reported ingredients and measured initial pH values.
Initial pH was measured using a portable digital pH meter (HI 8314; Hanna Instruments, Michigan, USA). These measurements were used to characterise the products at baseline and were not regarded as comprehensive indicators of erosive potential. Titratable acidity, buffering capacity, acid concentration and quantitative concentrations of calcium, phosphate and fluoride were not measured.
After baseline assessment, specimens in groups 1-7 were immersed in the assigned test product for 5 min twice daily. This regimen was intended to represent two standardised snack-related exposures per day rather than continuous contact. Immersions were performed at room temperature. Although the procedure standardised contact time, it did not reproduce the effects of drinking pattern and oral clearance on tooth-surface pH in vivo [27]. After each immersion, the specimens were rinsed with distilled water and returned to artificial saliva until the next exposure. Specimens in the negative-control group remained in artificial saliva throughout and were not exposed to a test product.
Artificial saliva was prepared at the Faculty of Dentistry, Karadeniz Technical University, and contained sodium chloride (0.4 g/L), potassium chloride (0.4 g/L), calcium chloride monohydrate (0.795 g/L), sodium dihydrogen phosphate monohydrate (0.69 g/L) and sodium sulfide nonahydrate (0.005 g/L), with distilled water added to a final volume of 1000 mL [4]. The test products and artificial saliva were replaced daily. Because the composition of artificial saliva can influence rehardening after erosive exposure, findings obtained with this formulation should not be extrapolated to natural saliva or to other laboratory formulations [29]. Cycling continued for six months. Weight and microhardness were measured at baseline and after 1, 3 and 6 months; micro-CT was performed at baseline and after 6 months. This regimen imposed repeated standardised challenges and should not be considered equivalent to six months of typical dietary consumption.
Weight and Hardness Measurements
The 56 intact teeth allocated to weight analysis were weighed at baseline and after 1, 3 and 6 months using a precision balance (Kern & Sohn GmbH, Frankfurt, Germany), and values were recorded in grams. Because intact natural teeth varied in size, longitudinal change within each specimen was more informative than unadjusted between-group comparisons of absolute weight. Whole-tooth weight was retained as a cumulative gravimetric outcome, while its sensitivity to residual moisture and inability to localise tissue loss were considered when interpreting the findings.
Vickers microhardness was measured in the 56 embedded enamel specimens at the same four time points using a microhardness tester (Innovatest, Limburg, the Netherlands). At each assessment, three indentations were made near the centre of the exposed enamel window, approximately 100 µm apart, using a 50-gf load applied for 10 s. The arithmetic mean of the three measurements was reported as the Vickers hardness number (VHN). All seven specimens within an acrylic block belonged to the same experimental group.
Micro-CT Scanning and Analysis
The 24 intact teeth allocated to micro-CT were scanned at baseline and after six months using a SkyScan 1172 system (Bruker microCT, Kontich, Belgium) at Inonu University Faculty of Dentistry. Acquisition was performed with an 11-megapixel camera, a 0.5-mm aluminium-copper filter, a tube voltage of 100 kV, a current of 100 µA, a 360° rotation and a rotation step of 0.40°. Each scan lasted approximately 45-50 min and generated approximately 500-550 cross-sectional images per tooth at a voxel/section thickness of 8.89 µm.
Image processing was undertaken at the Biomaterials and Tissue Engineering Research Center, Middle East Technical University. DICOM-compatible images were converted to BMP format and analysed using CTAn version 1.13.5.1 (Bruker microCT). The lesion area was delineated as the region of interest, converted to a binary image and restricted to enamel (Figure 2). Because the archived protocol did not document calibration using hydroxyapatite phantoms, the attenuation-derived outcome is reported as apparent rather than absolute mineral density.
Statistical Analysis
Statistical analyses were performed using SPSS version 17.0 (SPSS Inc., Chicago, IL, USA). Normality was assessed with the Shapiro-Wilk test. Weight and microhardness were analysed using repeated-measures ANOVA, with time as the within-specimen factor and experimental group as the between-specimen factor. Greenhouse-Geisser-corrected results are reported for within-specimen effects, and Bonferroni adjustment was applied to post hoc comparisons. Mauchly's test and the between-subjects group main-effect table were not available in the archived SPSS output and could not be reconstructed. Partial eta squared was calculated from the available sums of squares for the time and time-by-group effects. As the micro-CT dataset included only three teeth per group, parametric assumptions could not be evaluated reliably; these data were therefore analysed exploratorily using the Wilcoxon signed-rank test for within-group comparisons and the Kruskal-Wallis test for between-group comparisons. All tests were two-sided, and p < 0.05 was considered statistically significant. No a priori power calculation was reported, and blinding of outcome assessment was not documented.
3. Results
Evaluation of Time-Dependent Weight Data
All teeth and derived enamel specimens included in the three analytical sets were represented in the available outcome tables. Weight and microhardness were assessed at four time points, whereas apparent mineral density was assessed at baseline and six months. Findings are reported separately for each analytical method because the outcomes reflect different aspects of enamel alteration.
Weight changed significantly over time (Greenhouse-Geisser-corrected F(1.544, 71.003) = 198.817, p < 0.001, partial η² = 0.814), with a significant time-by-group interaction (F(10.805, 71.003) = 4.212, p < 0.001, partial η² = 0.395; Table 2).
Mean weight decreased progressively in all dairy-product groups and in the cola group, whereas the artificial-saliva group remained relatively stable (Table 3). Between baseline and six months, mean weight decreased by 10.5%-14.0% in the dairy-product groups, 20.6% in the cola group and 0.8% in the artificial-saliva group. As baseline weights differed among natural teeth and the study was not designed as an equivalence trial, the absence of selected between-group differences was not interpreted as evidence of equivalent erosive effects.
Evaluation of Time-Dependent Microhardness Data
Microhardness changed significantly over time (Greenhouse-Geisser-corrected F(1.778, 69.327) = 522.869, p < 0.001, partial η² = 0.931), with a significant time-by-group interaction (F(12.443, 69.327) = 39.026, p < 0.001, partial η² = 0.875; Table 4).
Mean VHN decreased markedly in all dairy-product groups and in the cola group (Table 5). Between baseline and six months, mean VHN decreased by 60.2%-68.3% in the dairy-product groups and by 60.6% in the cola group. Conversely, mean VHN in the artificial-saliva group increased by 17.1%, from 295.3 to 345.9 VHN, and varied significantly over time (p = 0.001).
At 1, 3 and 6 months, mean VHN values in all dairy-product groups and in the cola group were lower than those in the artificial-saliva group (p < 0.001). At one month, the strawberry yoghurt drink, strawberry yoghurt, forest-fruit kefir, banana kefir and cola groups had lower values than the petit suisse yoghurt and strawberry milkshake groups. At three months, values in the strawberry yoghurt drink, strawberry yoghurt, forest-fruit kefir and banana kefir groups were lower than those in the strawberry milkshake group. Figure 3 shows the percentage change from baseline, including the unexpected increase observed in the control group.
Evaluation of Micro-CT Analysis
Baseline and six-month apparent mineral-density values are presented in Table 6.
Mean apparent mineral density decreased numerically in most groups; however, no statistically significant within-group or between-group differences were detected (p > 0.05). Given the sample size of three teeth per group, this analysis was exploratory and had limited statistical power. The absence of statistical significance was therefore not interpreted as evidence of mineral preservation or equivalence among groups.
4. Discussion
The principal findings were progressive reductions in whole-tooth weight and surface microhardness following repeated exposure to each flavoured dairy product and to cola. Specimens maintained in artificial saliva showed minimal weight change but an unexpected increase in mean VHN. By contrast, the exploratory micro-CT analysis detected no statistically significant change in apparent mineral density. The null hypothesis was therefore rejected for the longitudinal weight and microhardness outcomes, but not for the micro-CT outcome. These endpoints should not be combined into a single estimate of erosion because they differed in spatial scale, analytical sensitivity and statistical power.
The twice-daily 5-min immersion protocol ensured consistent contact time and enabled longitudinal assessment [8,9,10,11,12]. Exposure periods of this duration have been used in experimental erosion models, partly because salivary mineral saturation may recover after a brief acidic challenge [10,11,12]. Nevertheless, laboratory immersion does not reproduce drinking behaviour, swallowing, salivary clearance, temperature variation or individual dietary patterns [26,27]. Repetition over six months created a substantial cumulative exposure. The observed changes therefore represent responses to the standardised protocol and should not be interpreted as estimates of tissue loss during usual consumption by children.
Preparation of a flat enamel surface improved the reproducibility of microhardness testing but altered the biological substrate. Polishing removed part of the highly mineralised outer enamel and eliminated natural surface topography, which may influence product retention and clearance. The protocol also excluded acquired pellicle, an important protective barrier against acid dissolution [25,30]. Despite standardisation, baseline VHN values remained variable, reflecting natural differences among primary teeth. Changes relative to each specimen's baseline were therefore evaluated alongside the absolute measurements.
Micro-CT allows repeated, non-destructive assessment of the same intact tooth and evaluation of subsurface regions [14]. Although apparent mineral density decreased numerically in most groups, the differences were not statistically significant and do not demonstrate mineral preservation. Microhardness testing evaluates a localised softened surface, whereas micro-CT averages attenuation across a selected volume; shallow alterations may therefore influence indentation measurements before producing a detectable volumetric signal. Detection was further limited by the inclusion of only three teeth per group and by the absence of documented phantom calibration, image-registration settings and threshold parameters.
Cola was selected as the positive control because its low pH and phosphoric-acid content are associated with enamel dissolution [13,15]. At six months, the cola group showed the greatest mean reduction in whole-tooth weight (20.6%) and a marked reduction in mean VHN (60.6%), indicating that the gravimetric and surface measures detected substantial alteration under the experimental protocol. Corresponding reductions in the dairy-product groups were 10.5%-14.0% for weight and 60.2%-68.3% for VHN. Although the descriptive microhardness ranges overlapped, the study was neither designed nor powered as an equivalence or non-inferiority trial. Consequently, non-significant pairwise comparisons cannot establish that any dairy product was as erosive as cola.
The measured initial pH values ranged from 3.80 to 4.33 for the dairy products and were 2.45 for cola. Although all dairy products were acidic, initial pH alone cannot explain the ranking or magnitude of their effects. Milk-derived calcium, phosphate, proteins and citrate salts may influence saturation and mineral exchange, whereas fermentation products and organic acids may intensify the acidic challenge [3,18]. Titratable acidity, buffering capacity, mineral concentrations and degree of saturation were not measured; therefore, the mechanisms underlying differences among products remain uncertain. Studies that directly characterise beverages similarly indicate that initial pH is an incomplete predictor of erosive potential [24,28].
Previous studies also indicate that flavoured dairy products should not be considered a homogeneous category. Mesquita-Guimaraes et al. [16] observed no enamel erosion following shorter exposure to selected yoghurt products in a 28-day reflux model, whereas Tedesco et al. [17] reported erosive activity of yoghurt drinks on primary enamel. Kargul et al. [18] demonstrated variation in the erosive and buffering properties of different yoghurts, and Pimentel et al. [19] evaluated fermented milk in the presence and absence of fluoride. Differences in product formulation, acid composition, specimen preparation, exposure regimen and analytical endpoint may account for these divergent findings and support product-specific interpretation.
Citric acid was listed as an acidity regulator in several of the tested products. In addition to providing hydrogen ions, citrate can chelate calcium and thereby promote mineral dissolution [3,15]. However, the net effect of a finished food cannot be inferred from a single listed ingredient. Experimental studies of ion release from paediatric restorative materials have shown that local pH can alter the availability of calcium, phosphate and fluoride [20,21]. Although these models provide relevant mechanistic context for local mineral homeostasis, they do not constitute direct evidence regarding dietary exposure.
The 17.1% increase in mean VHN in the artificial-saliva group warrants cautious interpretation. The calcium- and phosphate-containing formulation may have permitted mineral deposition on the polished enamel surface, and artificial-saliva composition is known to influence the rehardening response [29]. However, variation in indentation location, natural surface topography, specimen repositioning or instrument performance may also have contributed. As neither surface composition nor mineral deposition was measured, the increase cannot be attributed conclusively to remineralisation. The unexpected control response also indicates that between-group comparisons should be interpreted alongside within-specimen trajectories and baseline variability.
The present findings have primarily methodological and hypothesis-generating implications rather than direct clinical applications. Initial pH and manufacturer-reported ingredients alone are insufficient to predict the enamel effects of a flavoured dairy product. Future laboratory screening should combine standardised surface outcomes with measurements of titratable acidity, buffering capacity, calcium and phosphate concentrations, and degree of saturation. Although the results support consideration of the frequency and duration of acidic exposure during dietary counselling, they do not justify recommending avoidance of dairy products or clinically ranking the products tested.
Future studies should incorporate an a priori sample-size calculation, independent exposure vessels or statistical methods that account for clustering, standardised drying before weighing and blinded outcome assessment. Product characterisation should include replicate pH measurements, titratable acidity, buffering capacity, acid identity and concentration, calcium, phosphate, fluoride and viscosity. Volumetric assessment would be strengthened by hydroxyapatite-phantom calibration, registered longitudinal scans, prespecified thresholds and paired plots for individual teeth. Subsequent in situ studies should incorporate acquired pellicle, physiological salivary flow, realistic sipping and clearance patterns, and shorter, clinically plausible exposure periods before clinical recommendations are considered.
This study has several limitations. The in vitro model did not reproduce acquired pellicle, biofilm, physiological salivary flow or oral clearance, although saliva and pellicle are important modifiers of erosion in vivo [25,26,30]. The use of polished enamel and prolonged scheduled immersion also differs from usual consumption. The archived protocol did not document the duration of chloramine-T storage, generation of the randomisation sequence, product volume per specimen, agitation conditions, exact number of exposure days and cycles, pH-meter calibration and replicate measurements, pH of the artificial saliva, or storage temperature between challenges. Titratable acidity, buffering capacity, acid concentration and quantitative calcium, phosphate and fluoride concentrations were not measured.
Additional limitations concern measurement and statistical analysis. The model and resolution of the balance and the method used to standardise moisture before weighing were not documented. Consequently, whole-tooth gravimetry may have been influenced by hydration and could not localise tissue loss. Seven enamel specimens within each group shared one acrylic block and exposure environment, introducing potential clustering and pseudoreplication. The distances between subsequent indentations and previous deformation zones or enamel-window margins were not recorded. Micro-CT included only three teeth per group and lacked documented reconstruction parameters, threshold values, longitudinal registration and hydroxyapatite-phantom calibration. The statistical archive did not include Mauchly's test or the between-subjects group main-effect table. No a priori power analysis was reported, and outcome-assessor blinding was not documented.
Neither the available ethics approval letter nor the archived thesis specified a separate informed-consent procedure for donation and research use of the extracted teeth. Collectively, these limitations restrict causal and quantitative interpretation, preclude conclusions of equivalence among products and necessitate confirmation in adequately powered in situ and clinical studies.
Despite these limitations, the study provides longitudinal data from human primary enamel assessed using three distinct analytical methods. It demonstrates measurable gravimetric and surface-microhardness changes following repeated exposure under controlled conditions and highlights that weight, microhardness and attenuation-based micro-CT measurements should not be considered interchangeable indicators of erosion.
5. Conclusions
Under the conditions of this six-month in vitro model, the tested flavoured dairy products produced mean whole-tooth weight reductions of 10.5%-14.0%, compared with 20.6% for cola and 0.8% for artificial saliva. Mean VHN decreased by 60.2%-68.3% in the dairy-product groups and by 60.6% in the cola group, whereas the artificial-saliva group showed an unexpected increase of 17.1%. These descriptive similarities do not demonstrate equivalence. The exploratory micro-CT analysis, based on three teeth per group, detected no statistically significant change in apparent mineral density. Given the small micro-CT sample, unexpected control response and limitations of the in vitro model, adequately powered in situ and clinical studies are required before the findings can inform dietary recommendations.
Author Contributions
Conceptualization, O.B.; methodology, O.B. and S.M.E.; investigation, S.M.E.; data curation, S.M.E.; formal analysis, S.M.E.; resources, O.B.; supervision, O.B.; project administration, O.B.; visualization, S.M.E.; writing (original draft), S.M.E.; writing (review and editing), S.M.E. and O.B. All authors have read and agreed to the published version of the manuscript.
Funding
This research was funded by the Scientific and Technological Research Council of Türkiye (TÜBİTAK), 1002 Rapid Support Program, grant number 117S809.
Institutional Review Board Statement
The study was approved by the Scientific Research Ethics Committee of the Karadeniz Technical University Faculty of Medicine (approval no. 2016/123; 19 October 2016).
Informed Consent Statement
The study used extracted primary teeth. The available ethics approval documentation and archived thesis did not specify a separate informed-consent procedure for the donation and research use of the extracted teeth.
Data Availability Statement
The data presented in this study are available from the corresponding author upon reasonable request.
Conflicts of Interest
The authors declare no conflicts of interest.
References
- Marschner, F.; Kanzow, P.; Wiegand, A. Anamnestic risk factors for erosive tooth wear: systematic review, mapping, and meta-analysis. J. Dent. 2024, 144, 104962. [Google Scholar] [CrossRef] [PubMed]
- Marschner, F.; Kanzow, P.; Wiegand, A. Systematic review and meta-analysis on prevalence and anamnestic risk factors for erosive tooth wear in the primary dentition. Int. J. Paediatr. Dent. 2025, 35(2), 389–404. [Google Scholar] [CrossRef] [PubMed]
- Larnani, S.; Song, Y.; Kim, S.; Park, Y.S. Examining enamel-surface demineralization upon exposure to acidic solutions and the remineralization potential of milk and artificial saliva. Odontology 2025, 113(1), 201–212. [Google Scholar] [CrossRef] [PubMed]
- Yesilyurt, C.; Sezer, U.; Ayar, M.; Alp, C.; Tasdemir, T. The effect of a new calcium-based agent, Pro-Argin, on the microhardness of bleached enamel surface. Aust. Dent. J. 2013, 58(2), 207–212. [Google Scholar] [CrossRef] [PubMed]
- Arafa, A.; Filfilan, S.S.; Fansa, H.A. Erosive effect of beverages on surface hardness and ultrastructure of deciduous tooth enamel. Pediatr. Dent. J. 2022, 32(3), 186–192. [Google Scholar] [CrossRef]
- Harding, M.; Whelton, H.; Shirodaria, S.; O'Mullane, D.; Cronin, M.S. Is tooth wear in the primary dentition predictive of tooth wear in the permanent dentition? Report from a longitudinal study. Community Dent. Health 2010, 27(1), 41–45. [Google Scholar] [PubMed]
- Ganss, C.; Klimek, J.; Giese, K. Dental erosion in children and adolescents: a cross-sectional and longitudinal investigation using study models. Community Dent. Oral Epidemiol. 2001, 29(4), 264–271. [Google Scholar] [CrossRef] [PubMed]
- Kazemi Roudsari, P.; Attarzadeh, H. Effect of fresh orange juice and industrial orange juice on enamel microhardness of primary teeth: an in vitro study. Front Dent. 2026, 23, 9. [Google Scholar] [CrossRef] [PubMed]
- Lan, Z.; Zhao, I.S.; Li, J.; Li, X.; Yuan, L.; Sha, O. Erosive effects of commercially available alcoholic beverages on enamel. Dent. Mater. J. 2023, 42(2), 236–240. [Google Scholar] [CrossRef] [PubMed]
- Bashir, E.; Lagerlof, F. Effect of citric acid clearance on the saturation with respect to hydroxyapatite in saliva. Caries Res. 1996, 30(3), 213–217. [Google Scholar] [CrossRef] [PubMed]
- Bolan, M.; Ferreira, M.; Vieira, R.S. Erosive effects of acidic center-filled chewing gum on primary and permanent enamel. J. Indian Soc. Pedod. Prev. Dent. 2008, 26(4), 149–152. [Google Scholar] [CrossRef] [PubMed]
- Attin, T.; Wegehaupt, F.J. Methods for assessment of dental erosion and erosive tooth wear in different research settings. Monogr. Oral Sci. 2025, 33, 81–103. [Google Scholar] [CrossRef] [PubMed]
- Jameel, R.A.; Zaidi, S.J.A.; Siddiqui, S.; Rehman, A.; Gul, J.; Saquib, M.; Abdul Rahim, Z. The effects of beverage erosion on enamel: evaluating surface characteristics and loss of calcium and phosphate ions. Discov. Appl. Sci. 2024, 6, 439. [Google Scholar] [CrossRef]
- Zander, V.; Chan, D.; Sadr, A. Microcomputed tomography evaluation of root dentin caries prevention by topical fluorides and potassium iodide. Sensors 2019, 19(4), 874. [Google Scholar] [CrossRef] [PubMed]
- Inchingolo, A.M.; Malcangi, G.; Ferrante, L.; Del Vecchio, G.; Viapiano, F.; Mancini, A.; et al. Damage from carbonated soft drinks on enamel: a systematic review. Nutrients 2023, 15(7), 1785. [Google Scholar] [CrossRef] [PubMed]
- Mesquita-Guimaraes, K.S.F.; Scatena, C.; Borsatto, M.C.; Rodrigues-Junior, A.L.; Serra, M.C. Effect of foods and drinks on primary tooth enamel after erosive challenge with hydrochloric acid. Braz. Oral Res. 2015, 29(1), 1–7. [Google Scholar] [CrossRef] [PubMed]
- Tedesco, T.K.; Gomes, N.G.; Soares, F.Z.M.; Rocha, R.O. Erosive effects of beverages in the presence or absence of caries simulation by acidogenic challenge on human primary enamel: an in vitro study. Eur. Arch. Paediatr. Dent. 2012, 13(1), 36–40. [Google Scholar] [CrossRef] [PubMed]
- Kargul, B.; Caglar, E.; Lussi, A. Erosive and buffering capacities of yogurt. Quintessence Int. 2007, 38(5), 381–385. [Google Scholar] [PubMed]
- Pimentel, G.L.D.O.; Bomfim, M.D.S.; Chaves, J.D.S.; Santos, M.A.D.; Mendonca, A.C.; Limeira, J.D.R.; et al. The effect of fermented milk on deciduous enamel in the presence and absence of fluoride: an in vitro study. Minerva Stomatol. 2013, 62(7-8), 289–294. [Google Scholar]
- Aliberti, A.; Gasparro, R.; Triassi, M.; Piscopo, M.; Ausiello, P.; Tribst, J.P.M. Fluoride release from pediatric dental restorative materials: a laboratory investigation. Dent. J. 2025, 13(5), 224. [Google Scholar] [CrossRef] [PubMed]
- Aliberti, A.; Di Duca, F.; Triassi, M.; Montuori, P.; Scippa, S.; Piscopo, M.; Ausiello, P. The effect of different pH and temperature values on Ca2+, F-, PO43-, OH-, Si, and Sr2+ release from different bioactive restorative dental materials: an in vitro study. Polymers 2025, 17(5), 640. [Google Scholar] [CrossRef] [PubMed]
- Hunter, M.L.; West, N.X.; Hughes, J.A.; Newcombe, R.G.; Addy, M. Relative susceptibility of deciduous and permanent dental hard tissues to erosion by a low pH fruit drink in vitro. J. Dent. 2000, 28(4), 265–270. [Google Scholar] [CrossRef] [PubMed]
- Lippert, F.; Parker, D.M.; Jandt, K.D. Susceptibility of deciduous and permanent enamel to dietary acid-induced erosion studied with atomic force microscopy nanoindentation. Eur. J. Oral Sci. 2004, 112(1), 61–66. [Google Scholar] [CrossRef] [PubMed]
- Lussi, A.; Kohler, N.; Zero, D.; Schaffner, M.; Megert, B. A comparison of the erosive potential of different beverages in primary and permanent teeth using an in vitro model. Eur. J. Oral Sci. 2000, 108(2), 110–114. [Google Scholar] [CrossRef] [PubMed]
- Carvalho, T.S.; Baumann, T.; Lussi, A. In vitro salivary pellicles from adults and children have different protective effects against erosion. Clin. Oral Investig. 2016, 20(8), 1973–1979. [Google Scholar] [CrossRef] [PubMed]
- Hara, A.T.; Zero, D.T. The potential of saliva in protecting against dental erosion. Monogr. Oral Sci. 2014, 25, 197–205. [Google Scholar] [CrossRef] [PubMed]
- Johansson, A.K.; Lingstrom, P.; Imfeld, T.; Birkhed, D. Influence of drinking method on tooth-surface pH in relation to dental erosion. Eur. J. Oral Sci. 2004, 112(6), 484–489. [Google Scholar] [CrossRef] [PubMed]
- Jensdottir, T.; Bardow, A.; Holbrook, P. Properties and modification of soft drinks in relation to their erosive potential in vitro. J. Dent. 2005, 33(7), 569–575. [Google Scholar] [CrossRef] [PubMed]
- Ionta, F.Q.; Mendonca, F.L.; de Oliveira, G.C.; de Alencar, C.R.B.; Honorio, H.M.; Magalhaes, A.C.; Rios, D. In vitro assessment of artificial saliva formulations on initial enamel erosion remineralization. J. Dent. 2014, 42(2), 175–179. [Google Scholar] [CrossRef] [PubMed]
- Hara, A.T.; Ando, M.; Gonzalez-Cabezas, C.; Cury, J.A.; Serra, M.C.; Zero, D.T. Protective effect of the dental pellicle against erosive challenges in situ. J. Dent. Res. 2006, 85(7), 612–616. [Google Scholar] [CrossRef] [PubMed]
Figure 1.
Allocation of the 108 primary molars to the three analytical methods.
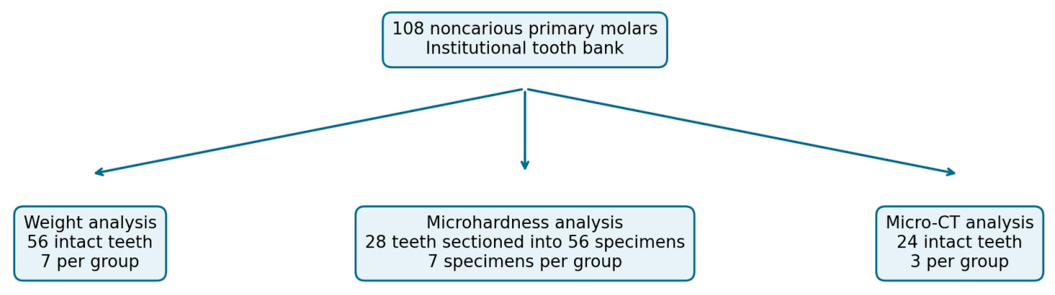
Figure 2.
Micro-CT image-analysis workflow. a) Reconstructed image; b) conversion to BMP format; c) definition of the enamel region of interest; d) analysis restricted to enamel.
Figure 2.
Micro-CT image-analysis workflow. a) Reconstructed image; b) conversion to BMP format; c) definition of the enamel region of interest; d) analysis restricted to enamel.
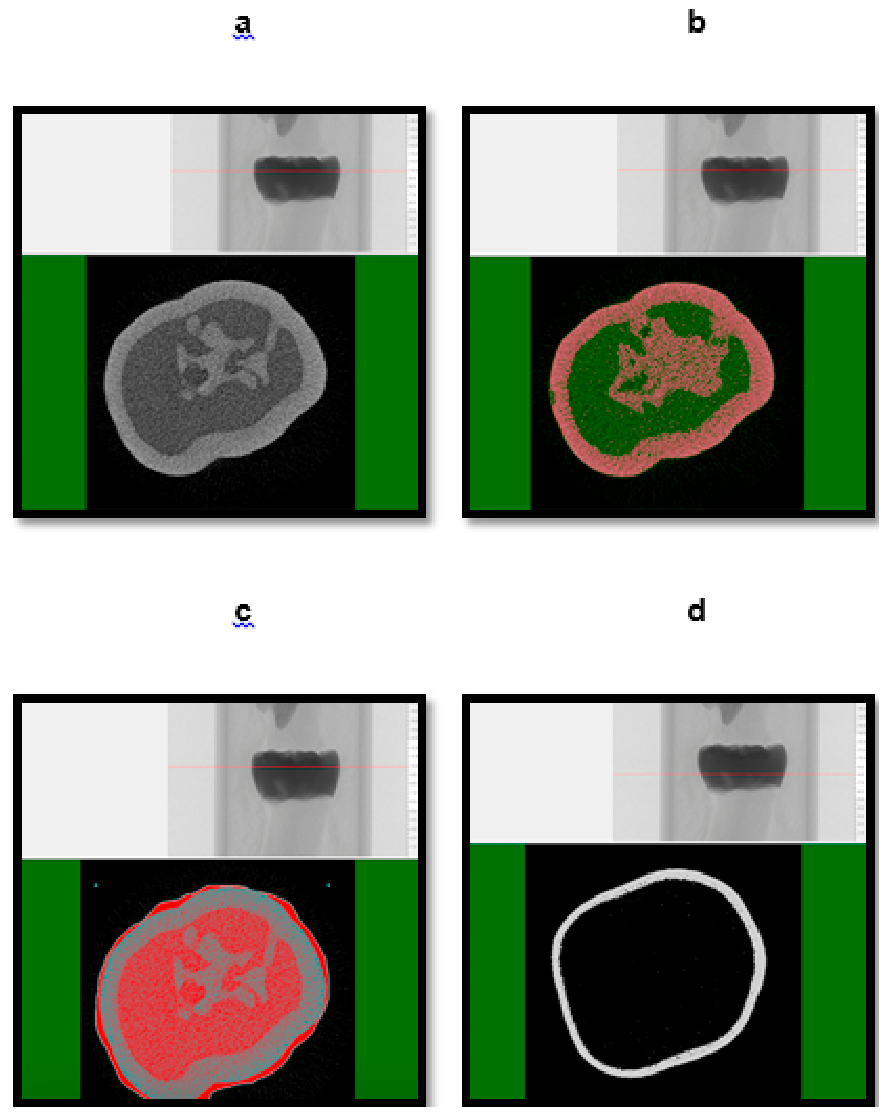
Figure 3.
Percentage change in mean Vickers microhardness from baseline by product group.
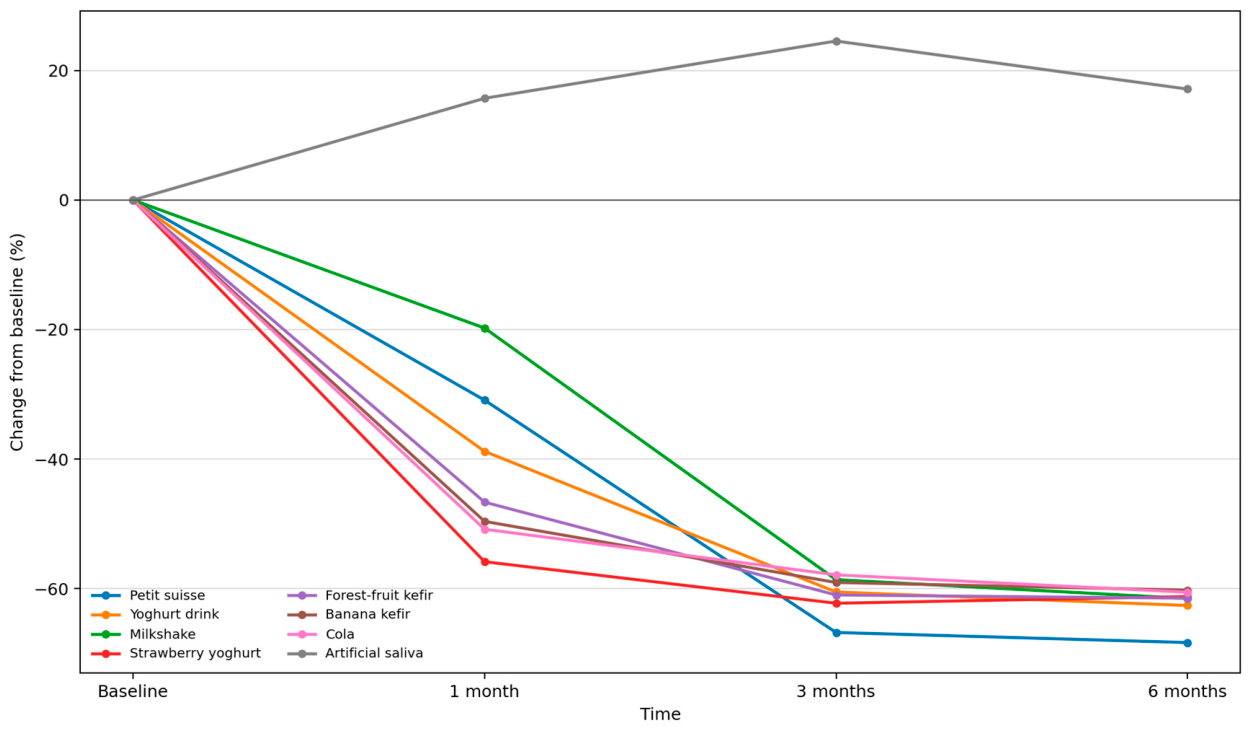

Table 1.
Composition and measured pH values of the tested products.
| Product | Manufacturer-reported composition | pH |
|---|---|---|
| Biscuit petit suisse yoghurt | Fresh cheese, beet sugar, biscuit sauce (5%) (beet sugar, tricalcium phosphate, biscuit powder, flavouring, tricalcium citrate, modified starch), citric acid, thickeners, modified starch, tricalcium citrate, vitamin D3 | 4.01 |
| Strawberry yoghurt drink | Yoghurt (84.2%), beet sugar, strawberry puree (6%), modified starch, tricalcium citrate, natural flavours, black carrot juice concentrate, vitamin D3 | 3.97 |
| Strawberry milkshake | Cow's milk, strawberry and vanilla sauce (6%), beet sugar, modified starch, yoghurt culture, sodium citrate, citric acid | 4.13 |
| Strawberry yoghurt | Cow's milk, strawberry sauce (6%), sugar, strawberry puree, flavouring, modified starch, thickeners, citric acid, maltodextrin, yoghurt culture | 4.33 |
| Forest-fruit kefir | Cow's milk, beet sugar, forest-fruit puree, modified starch, natural flavouring, red beet juice concentrate, kefir culture and yeast | 3.80 |
| Banana kefir | Cow's milk, beet sugar, banana puree (3.6%), modified starch, natural banana flavouring, citric acid, kefir culture and yeast | 4.05 |
| Cola | Water, sugar or fructose-glucose syrup, carbon dioxide, colourant, phosphoric acid, flavourings, caffeine | 2.45 |
* Composition reported by the manufacturers. ** Initial pH measured with a portable digital pH meter.
Table 2.
Greenhouse-Geisser-corrected repeated-measures ANOVA results for weight.
| Effect | df1 | df2 | F | p | Partial η² |
|---|---|---|---|---|---|
| Time | 1.544 | 71.003 | 198.817 | <0.001 | 0.814 |
| Time × group | 10.805 | 71.003 | 4.212 | <0.001 | 0.395 |
Table 3.
Weight over time by product group (mean ± SD; n = 7 per group).
| Product | Baseline | 1 month | 3 months | 6 months | Change (%) |
|---|---|---|---|---|---|
| Biscuit petit suisse yoghurt | 0.6945 ± 0.2399 | 0.6727 ± 0.2312 | 0.6515 ± 0.2274 | 0.6162 ± 0.2159 | -11.3 |
| Strawberry yoghurt drink | 0.7253 ± 0.1320 | 0.6843 ± 0.1432 | 0.6593 ± 0.1342 | 0.6272 ± 0.1229 | -13.5 |
| Strawberry milkshake | 0.7521 ± 0.2400 | 0.7232 ± 0.2373 | 0.6937 ± 0.2247 | 0.6520 ± 0.2085 | -13.3 |
| Strawberry yoghurt | 0.5455 ± 0.2437 | 0.5256 ± 0.2472 | 0.4991 ± 0.2488 | 0.4693 ± 0.2460 | -14.0 |
| Forest-fruit kefir | 0.6481 ± 0.2695 | 0.6264 ± 0.2634 | 0.5881 ± 0.2571 | 0.5799 ± 0.2556 | -10.5 |
| Banana kefir | 0.5069 ± 0.1921 | 0.4831 ± 0.1918 | 0.4440 ± 0.1815 | 0.4454 ± 0.1764 | -12.1 |
| Cola | 0.5001 ± 0.1229 | 0.4707 ± 0.1202 | 0.4284 ± 0.1066 | 0.3973 ± 0.1030 | -20.6 |
| Artificial saliva | 0.6949 ± 0.3334 | 0.6933 ± 0.3311 | 0.6896 ± 0.3262 | 0.6890 ± 0.3425 | -0.8 |
Table 4.
Greenhouse-Geisser-corrected repeated-measures ANOVA results for microhardness.
| Effect | df1 | df2 | F | p | Partial η² |
|---|---|---|---|---|---|
| Time | 1.778 | 69.327 | 522.869 | <0.001 | 0.931 |
| Time × group | 12.443 | 69.327 | 39.026 | <0.001 | 0.875 |
Table 5.
Vickers microhardness over time by product group (mean ± SD; n = 7 per group).
| Product | Baseline | 1 month | 3 months | 6 months | Change (%) |
|---|---|---|---|---|---|
| Biscuit petit suisse yoghurt | 365.7 ± 156.5 | 252.7 ± 129.0 | 121.5 ± 105.7 | 115.8 ± 105.4 | -68.3 |
| Strawberry yoghurt drink | 287.8 ± 116.8 | 176.1 ± 130.9 | 113.6 ± 101.9 | 107.6 ± 102.6 | -62.6 |
| Strawberry milkshake | 316.1 ± 119.1 | 253.6 ± 128.4 | 130.8 ± 110.2 | 121.6 ± 110.5 | -61.5 |
| Strawberry yoghurt | 300.8 ± 123.0 | 132.8 ± 119.7 | 113.5 ± 104.0 | 116.6 ± 110.8 | -61.2 |
| Forest-fruit kefir | 282.5 ± 115.9 | 150.7 ± 118.4 | 110.2 ± 106.3 | 108.8 ± 103.1 | -61.5 |
| Banana kefir | 270.4 ± 129.0 | 136.2 ± 124.7 | 110.7 ± 103.7 | 107.5 ± 103.1 | -60.2 |
| Cola | 286.8 ± 123.8 | 141.0 ± 128.7 | 120.8 ± 108.0 | 113.1 ± 104.0 | -60.6 |
| Artificial saliva | 295.3 ± 124.9 | 341.7 ± 118.9 | 367.8 ± 114.2 | 345.9 ± 112.9 | +17.1 |
Table 6.
Apparent mineral-density values at baseline and six months (g/cm³; n = 3 per group).
| Product | Baseline min | Baseline mean ± SD | Baseline max | 6-month min | 6-month mean ± SD | 6-month max |
|---|---|---|---|---|---|---|
| Biscuit petit suisse yoghurt | 3.027 | 3.075 ± 0.044 | 3.115 | 2.810 | 2.883 ± 0.101 | 3.000 |
| Strawberry yoghurt drink | 3.089 | 3.145 ± 0.049 | 3.174 | 2.809 | 2.842 ± 0.031 | 2.871 |
| Strawberry milkshake | 2.774 | 2.925 ± 0.248 | 3.212 | 2.809 | 2.891 ± 0.076 | 2.960 |
| Strawberry yoghurt | 2.767 | 2.859 ± 0.151 | 3.034 | 2.817 | 2.833 ± 0.016 | 2.850 |
| Forest-fruit kefir | 2.761 | 2.871 ± 0.182 | 3.082 | 2.721 | 2.842 ± 0.166 | 3.032 |
| Banana kefir | 2.749 | 2.770 ± 0.023 | 2.795 | 2.719 | 2.755 ± 0.045 | 2.807 |
| Cola | 2.769 | 2.782 ± 0.017 | 2.803 | 2.736 | 2.771 ± 0.031 | 2.794 |
| Artificial saliva | 3.019 | 3.031 ± 0.012 | 3.044 | 2.996 | 3.020 ± 0.041 | 3.068 |
Disclaimer/Publisher’s Note: The statements, opinions and data contained in all publications are solely those of the individual author(s) and contributor(s) and not of MDPI and/or the editor(s). MDPI and/or the editor(s) disclaim responsibility for any injury to people or property resulting from any ideas, methods, instructions or products referred to in the content. |
© 2026 by the authors. Licensee MDPI, Basel, Switzerland. This article is an open access article distributed under the terms and conditions of the Creative Commons Attribution (CC BY) license (http://creativecommons.org/licenses/by/4.0/).
Copyright: This open access article is published under a Creative Commons CC BY 4.0 license, which permit the free download, distribution, and reuse, provided that the author and preprint are cited in any reuse.