

Submitted:
21 September 2026
Posted:
22 September 2026
You are already at the latest version
Abstract
Standard PDF-to-Markdown pipelines silently discard embedded figures, creating a representation gap in RAG that prior work has overlooked by focusing on generator choice. We quantify this gap in the ESG domain: on 274 reports, 21.7% of 48,896 images are data-bearing yet invisible to text-only retrieval. A vision–language augmentation stage (Step3-VL-10B) recovers this content, adding 116,673 numeric tokens (+16.0%) and 1.3M words (+17.8%) across all GRI topic-standard series with 0% truncation over 8,112 descriptions. LLM-as-judge evaluation achieves 99.8% KPI-domain coverage, with 77.9% of descriptions hitting two or more KPI buckets (vs. 44.9% keyword floor). A retrieval A/B on 83 reports shows +7.0/100 completeness improvement on figure-dependent queries. These results establish the representation gap as a measurable retrieval ceiling that corpus-side enrichment must first close.
Keywords:
information retrieval
; corpus representation
; visual representation gap
; retrieval-augmented generation
; ESG sustainability reports
; vision–language models
; document understanding
1. Introduction
Every retrieval system depends on the faithfulness of its document representation: what is indexed determines what can be retrieved. In retrieval-augmented generation (RAG) pipelines over PDF documents, the standard representation pipeline—PDF-to-Markdown conversion followed by text chunking and embedding—silently discards a significant fraction of the available information. Embedded figures (bar charts, infographics, table-images) are reduced to placeholders, and their content never reaches the retriever regardless of the query. This paper treats that loss as a corpus-representation problem: we quantify how much retrievable content is lost, and we measure how much a vision–language augmentation stage can recover, using Environmental, Social, and Governance (ESG) sustainability reports as the domain. The Corporate Sustainability Reporting Directive (CSRD) and the maturing global ESG-disclosure landscape (Global Reporting Initiative (GRI), SASB, TCFD) have made these reports a high-volume, regulator-facing document class where retrieval accuracy has direct compliance implications. Their visual density—emissions breakdowns as stacked bar charts, workforce composition as pie charts, and audited tables as raster images—makes them a natural testbed for studying the representation gap.
ESG reports are structured, audited disclosures in which companies report environmental metrics (emissions, energy, water usage), social indicators (workforce composition, diversity, safety), and governance practices (board structure, compliance, ethics). Most reporters follow the Global Reporting Initiative (GRI) framework, whose topic-standard series—200 (Economic), 300 (Environmental), 400 (Social)—define a taxonomy of standardised key performance indicators (KPIs) such as GHG emissions (GRI 305), workforce diversity (GRI 405), and tax payments (GRI 207). These KPIs are the specific quantitative facts that regulators and investors query via ESG questionnaires; they are also the content most likely to appear in figures rather than body text.
Recent empirical benchmarks of open-source LLMs for ESG RAG have shown that RAGAS retrieval scores (Context Precision, Context Recall) saturate near 1.0 while factual correctness remains modest, identifying generator-side factual correctness—not retrieval—as the open bottleneck. These studies typically hold the retrieval stack and the source corpus fixed and vary the generator.
In this paper, we hold the generator class fixed (open-source LLMs in a similar parameter range) and ask the orthogonal question: is the text corpus that feeds the retriever a faithful representation of the underlying reports? ESG reports are visually dense—emissions breakdowns appear as stacked bar charts, workforce composition as pie charts, targets as infographics, and audited tables increasingly as flattened raster images rather than textual tables. The de facto PDF-to-Markdown step, whether Docling [1], MinerU [2], or Nougat [3], reduces every image to an <!– image –> placeholder. Whatever data lives in those images is invisible to downstream RAG.
Thesis
The central claim of this paper is that text-only ESG corpora systematically under-represent the information available to downstream retrieval, and that augmenting them with vision–language descriptions of data-bearing images measurably narrows this representation gap. The augmentation recovers numeric content that the standard pipeline silently discards, and the recovered content lies in the key performance indicator (KPI) domains that GRI-aligned questionnaires query.
Contributions
The contributions that support this thesis are:
- 1.
- The visual representation gap. On 274 ESG reports, 21.7% of 48,896 extracted images are data-bearing (bar charts, infographics, table-images)—all silently discarded by standard PDF-to-Markdown conversion. Text-only corpora therefore present an incomplete picture to the retriever, independent of any downstream generator.
- 2.
- A drop-in vision–language augmentation stage. We design a two-stage VL pipeline (classify then describe) using Step3-VL-10B that converts data-bearing images into structured Markdown and merges them, per page, with the canonical Docling output. The stage requires no change to the retriever or vector store.
- 3.
- Corpus-representation evidence. The augmentation adds 8.0 MB of structured text (+6.6%) and 116,673 numeric tokens (+16.0%) to the 274-report subset, recovering content across all three GRI topic-standard series (200/300/400). These are index-side metrics—what the retriever can now see—not retrieval or answer-quality measurements. A preliminary end-to-end A/B (83 reports, 6 questions, single generator) reports a +7.0/100 completeness improvement concentrated in figure-dependent queries.
We deliberately base the primary validation on representation-side and LLM-independent evidence. We argue that representation-side metrics are a legitimate and necessary unit of analysis for an information-retrieval venue: they measure the upper bound on what any downstream retriever can access, independent of generator choice, query formulation, or evaluation protocol. A representation gap is a retrieval ceiling—closing it is a precondition for measurable retrieval improvement, and quantifying it provides the baseline against which any future retrieval-side gain must be compared.
The augmentation stage is itself a drop-in upgrade to any text-RAG pipeline for ESG, or, more broadly, any visually rich semi-structured corpus. Section 4.4 additionally documents an engineering note: a reusable prompt-engineering pattern—forced closure of the model’s reasoning span combined with structured-response prefilling—that we used to make the augmentation stage production-viable on Step3-VL-10B. We present this pattern as an engineering recipe characterized on one model; the corresponding open-prompt baseline was not preserved as a quantitative measurement (Section 8.1).
The remainder of this paper is organized as follows. Section 2 states the research objectives. Section 3 reviews related work across four threads: ESG RAG, PDF conversion, multimodal retrieval, and corpus enrichment. Section 4 describes the dataset and the two-stage VL augmentation pipeline, including an engineering note on the forced-reasoning-closure pattern. Section 5 defines all evaluation metrics. Section 6 reports corpus-side results—information loss, numeric uplift, KPI alignment, and stage reliability—and our preliminary end-to-end A/B comparison. Section 7 discusses theoretical and practical implications. Section 8 concludes with limitations and four threads of future work.
2. Research Objectives
This study pursues three objectives. First, to quantify the visual representation gap in ESG-report retrieval by measuring how much data-bearing image content is silently discarded by standard PDF-to-Markdown pipelines. Second, to design and evaluate a drop-in vision–language augmentation stage that recovers this lost content as structured Markdown. Third, to validate whether the recovered content improves downstream RAG completeness on the GRI-aligned queries that regulators and investors use.
3. Related Work
The literature on RAG quality has followed several parallel trajectories: benchmarking generators for specific domains, engineering the conversion pipeline that feeds the retriever, designing evaluation frameworks that isolate retrieval from generation effects, and—most recently—examining how the corpus representation itself constrains what any downstream system can access. Each trajectory has advanced understanding of its own component, but the interaction between corpus representation and retrieval ceiling—how much retrievable content is lost before the retriever ever sees the data—remains underexplored. This review traces these four lines of work and identifies the gap our study addresses.
3.1. Open-Source LLMs for ESG RAG
A growing body of ESG-RAG work treats generator selection as the primary lever for answer quality, holding the corpus and retrieval stack fixed. Prior benchmarks show that open-source LLMs saturate near-perfect retrieval scores while factual correctness varies across models, suggesting the generator—not the retriever—is the bottleneck [4]. Related ESG compliance tools [5] assume access to commercial APIs; our work targets the open-source, on-premise deployment constraints of audit-adjacent ESG data, and asks the orthogonal question—whether the corpus feeding an already-capable retriever is faithfully representing the source reports.
3.2. PDF Structure Understanding
The standard pipeline for turning PDFs into retrievable text—Docling, MinerU, Nougat [1,2,3]—optimizes for text and table fidelity but treats every embedded image as a blind spot. None of these tools reconstruct the semantic content of figures; table-transformer models [6] handle raster tables when present as images but stop short of charts or infographics. The consequence is systematic: whatever data lives in figures is silently discarded before the retriever sees the document.
3.3. Multimodal RAG and Chart Understanding
Work on chart understanding [7,8,9] has produced models specialized for chart-to-table extraction; we use the same idea but as a corpus-preprocessing stage rather than a per-query model. Multimodal RAG architectures typically follow one of two routes: (a) co-embed images and text in a shared space [10], retrieving image patches alongside text chunks at query time, or (b) caption images offline and retrieve over the captions [11]. We adopt route (b) for three reasons: it requires no changes to the existing retriever, embedding model, or vector store; it preserves a human-readable provenance string for every answer (important for audit-adjacent ESG use cases); and it makes the augmentation a one-time corpus enrichment whose cost can be amortized across many downstream queries. Route (a) is complementary: it is most attractive for low-cardinality, image-heavy queries where a learned cross-modal embedding can outperform a fixed VL captioner, and is discussed as a future direction in Section 8. A contemporary example of route (b) is VDocRAG [12], which uses a VLM to caption visually-rich document pages offline and then retrieves over the captions with a standard text retriever, demonstrating the generality of the offline-captioning strategy beyond ESG.
3.4. Vision–Language Models
Offline captioning of document figures requires a VL model that reads axes, legends, and numeric annotations reliably. The most recent generation of open-weight VL models—Step3-VL [13], Qwen2-VL [14], Gemma-3-Vision [15], InternVL-3 [16]—supports chain-of-thought reasoning before the final answer, which improves chart-reading accuracy. We use Step3-VL-10B for both classification and description because its hybrid-reasoning behavior, at 10B parameters, fits on a single A100 GPU without quantization; our prompt pattern (Section 4.4) addresses a truncation failure mode we identified empirically in reasoning-capable models.
3.5. Evaluation Frameworks
RAGAS [17] provides a reference-free evaluation suite for RAG systems applicable to end-to-end retrieval evaluation. Recent work has increasingly focused on how retrieval quality itself affects downstream RAG performance. Salemi and Zamani [18] propose eRAG, a framework that evaluates retrieval quality by measuring whether the retrieved content enables a downstream generator to produce correct answers, rather than relying on static relevance judgments. Cuconasu et al. [19] show that varying the type of retrieved content (relevant, non-relevant, random) measurably shifts LLM output quality, establishing that retrieval composition—not just relevance—matters for RAG. Mo et al. [20] extend RAG evaluation to conversational settings, demonstrating that leveraging historical interaction data improves retrieval and generation quality in multi-turn settings. These lines of work share our premise that representation and retrieval quality are first-order concerns for RAG, distinct from generator choice. In this work we use representation-side metrics that are independent of downstream retrieval and generation components, and defer RAGAS-based evaluation to future work.
3.6. Corpus Representation and Enrichment
Zur et al. [21] propose using LLMs to generate synthetic documents that improve retrieval for a given topic. Their enrichment is text-only and generates new content; ours recovers content that is invisible in the text-only representation of the original documents via VL models. Asenov et al. [22] show that document representation quality (transcription, preprocessing) is the primary driver of benchmark gains in multilingual and visually rich RAG, but their work targets OCR accuracy for text recovery rather than visual content that was never transcribed.
Two recent studies from the target journal reinforce the same theme. Song [23] demonstrates, in an IP&M article, that RAG performance is more sensitive to the structure of the input data (e.g., tabular formatting from OCR) than to raw OCR accuracy alone—an analogous finding to ours at the text-representation level. Wen et al. [24] introduce OHRBench, a benchmark that quantifies how OCR errors cascade through RAG pipelines, showing that preprocessing quality has a measurable downstream effect on answer correctness. Both studies are concerned with the quality of the text representation that reaches the retriever; the present study extends this concern to visual content that is entirely absent from the text representation, and proposes a VL-based recovery method for content that no OCR improvement could reach.
The present study complements these lines of work by measuring and recovering a type of information loss—data-bearing images reduced to placeholders—that prior corpus-enrichment and representation research has not addressed.
Across these four lines of work—ESG generator benchmarking, PDF conversion engineering, RAG evaluation frameworks, and corpus enrichment—a consistent theme emerges: the community has focused on what happens after content reaches the retriever (generator choice, retrieval algorithms, evaluation protocols) rather than on whether the corpus faithfully represents the source documents in the first place. The present study isolates this upstream question and provides the first quantitative characterization of the visual representation gap in a real-world RAG domain.
4. Methodology
This section describes the dataset, the full data-production pipeline, the vision–language augmentation stage itself, and the validity of the evaluation protocol that uses the pipeline’s output.
4.1. Dataset
We compile a corpus of corporate sustainability and ESG reports from five source tiers: the Sustainability Reporting Navigator database (858 reports, CSRD-aligned); the third-party aggregator responsibilityreports.com (3,317 reports); direct crawls of approximately 2,500 company investor-relations domains (e.g., BBVA, Veolia, Maersk, IBM); regulatory filings and registries (SEC EDGAR, Danish CVR, Romanian FSC, Euronext); and fund-level ESG reports from major asset managers (BlackRock iShares, Vanguard, JPMorgan, Schroders, Invesco). The full corpus contains 15,457 unique report URLs spanning 10,434 unique companies, with the dominant year range 2020–2024 (13,608 of 15,457 reports) and a small number dating back to 2008.
All reports are published in English (standard for GRI/CSRD-aligned disclosures targeting international stakeholders), are natively digital PDFs (none are scanned), and cover companies headquartered across 18 countries and 5 regions, with a strong European concentration (78% Western Europe, 15% Nordics). The reports span 11 GICS-aligned sectors, led by Industrials (22 companies), Financials (20), and Health Care (14). Reporting frameworks include GRI, CSRD, SASB, and TCFD as classified by an LLM metadata pass.
From this full corpus, we select a curated evaluation subset of 274 reports from 100 companies with multi-year coverage (2020–2024). The subset has a median of 96 pages (P25: 45, P75: 148, P90: 222) and is visually dense, with a mean of 178 extracted images per report. This subset is the basis for all measurements in Section 5Section 6. The full corpus metadata and the subset are released for non-commercial research reproduction.
4.2. Corpus and Acquisition Pipeline
4.2.0.3. Acquisition sources
Our full corpus is assembled from five source tiers: the Sustainability Reporting Navigator database [25] (regulator-aligned, CSRD page-range metadata, 858 reports); the third-party aggregator responsibilityreports.com (3,317 reports); direct crawls of approximately 2,500 company investor-relations domains (e.g., BBVA, Veolia, Maersk, IBM); regulatory filings and registries (SEC EDGAR, Danish CVR, Romanian FSC, Euronext); and fund and ETF sustainability/stewardship reports (BlackRock iShares, Vanguard, JPMorgan, Schroders, Invesco). In total we inventory 15,457 unique report URLs spanning 10,434 unique companies. The dominant year range is 2020–2024 (13,608 of 15,457), with a long tail back to 2008 from the SRN subset.
4.2.0.4. Deduplication and integrity
Each downloaded PDF is validated for %PDF- magic bytes; rejected downloads are deleted immediately. We compute an SHA-256 hash per file and reconcile against a pre-built hash index, tagging each download as REUSABLE (hash match with an existing Markdown conversion), DUPLICATE (hash match, no existing conversion), or NEEDS_CONVERSION. A duplicate group is a set of two or more reports sharing an SHA-256; we identified 135 such groups, of which 111 were retained as canonical reports while the rest reused an existing Markdown conversion, saving approximately 1 GB of storage and conversion compute. Rate limiting (0.2 s between requests; exponential retry) and a project-identifying User-Agent string were used throughout.
4.2.0.5. Metadata enrichment
Per-report metadata includes company_id, report_year (regex on the first page, fallback to URL header), document_pages (PyMuPDF), file_size_bytes, and sha256. A secondary LLM pass (Qwen3-4B) classifies sector and reporting_framework (CSRD / GRI / SASB / TCFD / other) from the first five pages of each report. This metadata is exposed for downstream stratification but is not used in retrieval; its accuracy is not measured in this paper and is listed as a deferred validation item (Section 8.1).
4.2.0.6. PDF → Markdown conversion
PDFs are converted to Markdown with Docling [1] (DLParse v4 backend, RapidOCR for scanned pages with English text-score threshold 0.4, TableFormer in ACCURATE mode). Conversion runs on A100-SXM-64GB GPUs under SLURM (a job scheduler for high-performance computing clusters); mean wall-clock throughput across the full conversion campaign is 154 s per document (logged in SLURM job records). Of the 15,457 inventoried URLs, 14,729 PDFs were available for conversion at the time of writing. The residual 728 are split across in-flight downloads, ToS-restricted endpoints, and dead links scheduled for re-crawl. Of the available PDFs, 14,389 (97.7%) yielded a Markdown output. A retry queue collects all conversion failures and additional long, layout-heavy reports flagged for a higher-resource second pass.
4.2.0.7. Evaluation subset selection
The measurements in Section 5Section 6 use a curated 274-document subset drawn from the main corpus. The subset is organized around companies rather than by a page-length threshold: it comprises 274 reports from 100 companies with multi-year coverage in 2020–2024, aligning the corpus with the company set and protocols used in prior ESG-RAG evaluations. No page-count floor is enforced during selection; the resulting subset is nonetheless visually dense in practice, with a median of 96 pages (P25: 45, P75: 148, P90: 222).1 The Qwen3-4B-assigned sector and reporting-framework tags described above are released alongside the subset for downstream stratification, but—because the upstream classifier is not independently validated—they are not used as a selection criterion and no sector-stratified sampling is performed.
Geographically, the 100 companies span 18 countries across 5 regions, with a strong European concentration (Appendix A), and span 11 GICS-aligned sectors. All reports are published in English (standard practice for GRI/CSRD-aligned disclosures targeting international stakeholders) and are natively digital—none are scanned documents—so the conversion pipeline uses text extraction rather than OCR for the textual backbone, with OCR reserved for embedded raster tables in figures. These characteristics bound the external validity of the findings: the measured visual representation gap and augmentation yield apply to English-language, native-PDF, European-headquartered reporters; transfer to other regions or scanned corpora is a deferred validation item.
Per-document Markdown is provided as a released artifact so the corpus-side measurements can be reproduced without re-running any GPU pipeline.
4.2.0.8. Ethics, licensing, redistribution
All reports are public-facing corporate disclosures mandated or recommended by regulators. We respect each source’s robots.txt and apply a conservative crawl rate. The derived Markdown and metadata are released for non-commercial research use. Re-distribution of raw PDFs is out of scope; per-source terms-of-service statements are retained alongside the inventory.2
4.3. Vision–Language Augmentation Stage
The VL augmentation stage sits between PDF-to-Markdown conversion and indexing (Figure 1). Its inputs are the canonical Markdown and the set of extracted images with bounding-box metadata. Its output is an enriched Markdown file in which structured descriptions of data-bearing images are appended, each anchored to its page and bounding box.
4.3.0.9. Image extraction
From each report’s PDF we extract every embedded raster image using PyMuPDF, retaining the rendered image, page index, bounding box, and a content hash. Across the 274-report evaluation subset this yields 48,896 images (all extracted images, before relevance filtering), with a mean of 178 images per report and a long tail up to 800+ on graphically dense reports. The corresponding count after VL relevance filtering and the size threshold is much smaller—see the data-bearing per-report distribution in Section 6.2 (mean 39, max 474).
4.3.0.10. Model choice
We use Step3-VL-10B [13] for both classification and description. Three properties drove this choice. First, at 10 B parameters the model fits on a single A100-SXM-64GB GPU without quantization, keeping per-image compute predictable for batch processing. Second, the hybrid-reasoning behavior—an internal <think> span emitted before the final answer—improves reading of axes, legends, and unit annotations; comparably-sized non-reasoning VL models do not reliably exhibit this on ESG charts in our pilots. Third, the chat template exposes a fixed reasoning span, which enables the closure pattern of Section 4.4. The reasoning behavior also introduces the truncation failure mode that the prompt pattern addresses. Using a single VL model for all stages is a methodological dependency that we treat as a limitation; a cross-model comparison against Qwen2-VL [14], InternVL-3 [16], and Gemma-3-Vision [15] is a deferred validation item.
4.3.0.11. Relevance classification
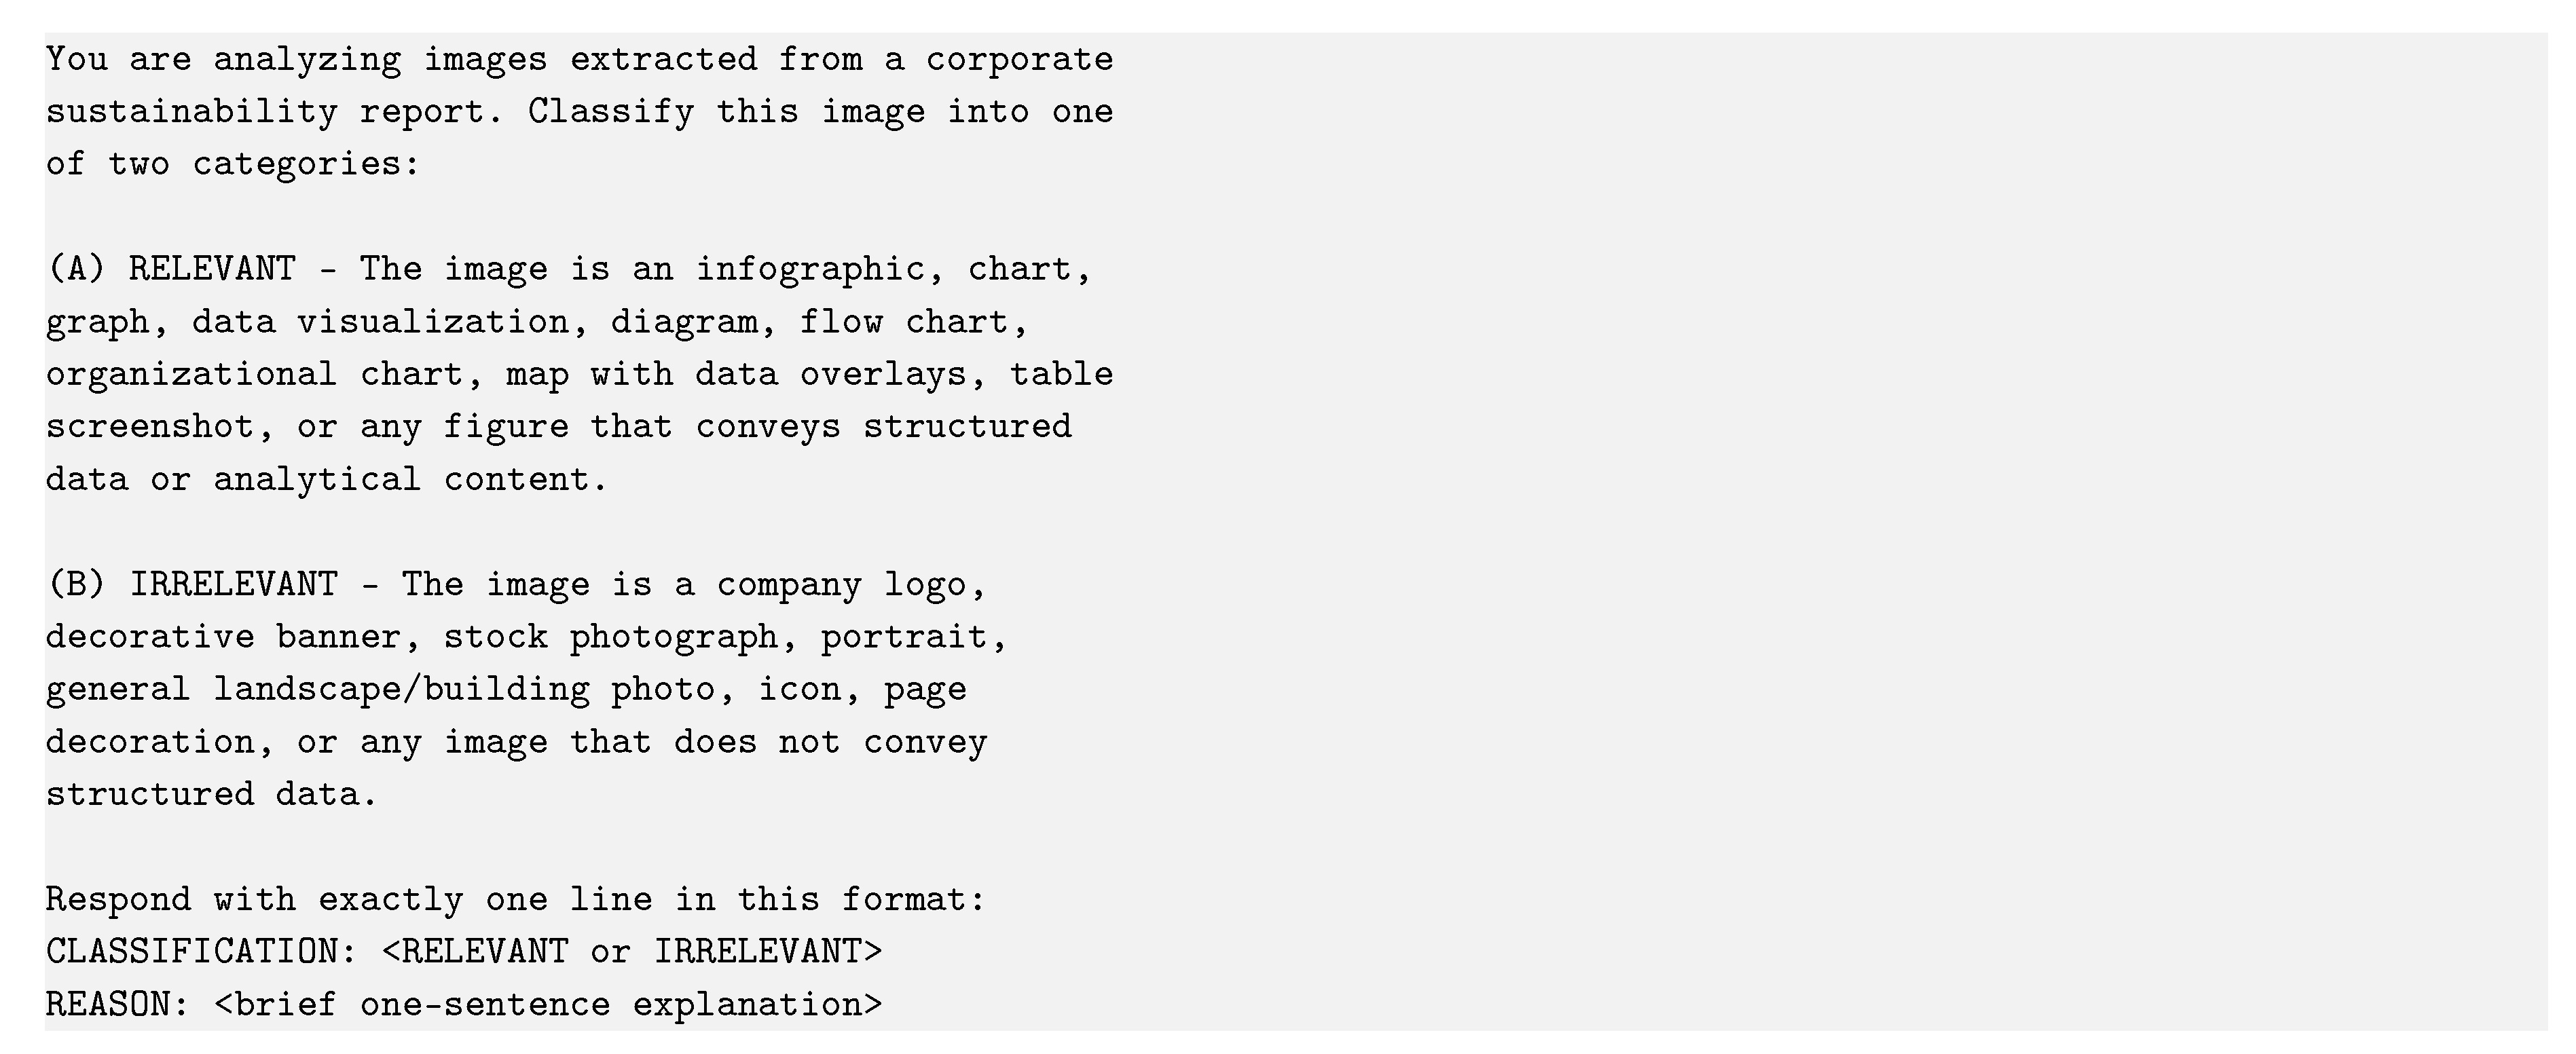
Each extracted image is passed through a binary VL classifier (Step3-VL-10B, prompt in Appendix B) that labels it as RELEVANT (ESG-meaningful data such as numbers, categories, or comparisons) or IRRELEVANT (decorative, company logo, photograph, icon, cover page).
4.3.0.12. Size filter
A size filter (max side ≥ 200 px and area ≥ 15,000 px2) is applied to the RELEVANT set to discard low-resolution and icon-like survivors before description, since description compute scales linearly in image count.
4.3.0.13. Structured description schema
Each surviving image is described under a fixed schema with these fields: Figure type (bar chart / pie chart / table-image / infographic / diagram / other); Title / caption (visible title or N/A); Units; Summary (one to two sentences with headline values); Data (extracted rows as a Markdown table). The full prompt is in Appendix B.
4.3.0.14. Merge strategy
Docling placeholder counts and PyMuPDF-extracted image counts are only loosely correlated—per-document ratios in our corpus range from 0.46× to 44×. Positional splicing (replacing the i-th placeholder with the i-th description) would therefore produce frequent misalignment errors. We instead append descriptions to the end of each Markdown file, grouped by page, and prefix each block with [page p, bbox b] so the downstream LLM can cite provenance. This makes the merge robust to extraction-count mismatch at the cost of intra-page positional context; a fine-grained positional splice would require a unified extraction backend and is left as future work.
4.4. Engineering Note: Forced Reasoning-Block Closure
We describe here an engineering recipe used to make the VL describe stage production-viable on Step3-VL-10B. We present it as a recipe rather than as a contribution because the corresponding open-prompt baseline was not preserved as a quantitative measurement (Section 8.1); the supporting evidence is the post-fix production-scale reliability reported in Section 6.5.
Hybrid-reasoning VL models that expose a <think>...</think> reasoning span tend to spend token budget on preamble (“Got it, let me analyze this figure...”) before emitting the requested structured output. When the model is asked for a long structured answer under a fixed max_new_tokens, the reasoning preamble truncates the structured body.
4.4.0.15. The recipe
We force early closure of the reasoning span by emitting </think> as part of the prompt, and prefill the response with the opening tokens of the structured format (e.g., **Figure type:**). The assistant then resumes generation inside the structured block with no budget spent on preamble. The exact prefill suffix is in Appendix B.
4.4.0.16. Scope of the recipe
The recipe depends only on (i) a chat template that opens the assistant turn with a reasoning span and (ii) a fixed structured-output schema. We characterize it on Step3-VL-10B; we conjecture that the design logic transfers to any reasoning-capable VL or LLM model that exposes the same template (e.g., Qwen3 reasoning-mode, DeepSeek-R1), but we have not measured the effect on those models and offer cross-model generality as a prediction, not a result.
4.5. Validity of the Evaluation Protocol
A reader may reasonably ask whether the measurements in Section 6 are credible given that (a) the 274-document subset is curated, not uniformly sampled; (b) the corpus-side metrics depend on the same VL model that produced the augmentation; and (c) the deferred end-to-end RAG comparison has not been executed. We address each concern.
4.5.0.17. Why the corpus-side metrics are defensible
The numeric-token uplift and the GRI keyword coverage are computed by string-level operations (regex match for numeric tokens; multi-label substring match for KPI buckets) over the released Markdown pair. They are reproducible by anyone with the released corpus and require no LLM at evaluation time. The metrics do not measure how well the VL model reads a figure; they measure whether the augmentation produces structured Markdown that contains numbers and KPI-domain vocabulary the text-only Markdown lacked. Hallucination at the VL stage—a number that does not exist in the figure—would still produce a numeric token. We therefore frame uplift as a representation-side change in what the retriever can see. We defer accuracy-of-figure-reading claims to the end-to-end comparison and to the intrinsic-accuracy validation block (Section 8.1).
4.5.0.18. Why subset curation is acceptable for this claim
The thesis is conditional: when a report contains data-bearing images, the augmentation recovers structured content for them. The subset is visually dense in practice—the regime where the augmentation has the most to do—without an enforced page-length floor. A uniformly random sample would dilute the measurement without changing the main finding: the per-report uplift distribution has a P25 of numbers and a minimum of 0, capturing both regimes. The 274 reports span 2020–2024 and a wide size range (from a few pages to nearly 800); the Qwen3-4B metadata pass labels them as spanning multiple regulatory frameworks (CSRD, GRI, SASB, TCFD), but we surface those tags as descriptive metadata rather than as a validated stratification (Section 8.1).
4.5.0.19. Why the A/B protocol is credible
The end-to-end RAG comparison (Section 6.7) compares conditions A and B on a fixed experimental setup: the chunker, embedding model, vector store, retrieval settings, and prompts are held constant, with the corpus as the only variable. The 6-question VL-targeted set (Appendix D) probes each KPI bucket identified in the keyword and LLM-judge analysis (Section 6.4), with deliberate oversampling of figure-dependent disclosures.
5. Evaluation Metrics
We define every metric used in Section 6 before reporting any number.
5.1. Corpus-Level Numeric Uplift
For each report we count numeric tokens in the text-only Markdown T and in the augmented Markdown using the regex
\b\d{1,3}(?:[.,]\d{3})*(?:\.\d+)?\b
which matches integers and decimals with optional thousands separators. On a 4-digit year (e.g., “2024”) the regex matches a single integer; on European-style decimal commas (“1,234” meaning approximately one) it can mistake the separator. We use this rule because the augmentation produces tabular numeric data where the baseline produced placeholders, so any consistent counting rule yields a positive uplift of the same order; the simplest defensible definition is preferred. The per-report metric is and we report corpus-wide totals, mean, median, P25/P75/P90/max, and the percentage size growth in characters.
5.2. GRI-Aligned KPI Coverage
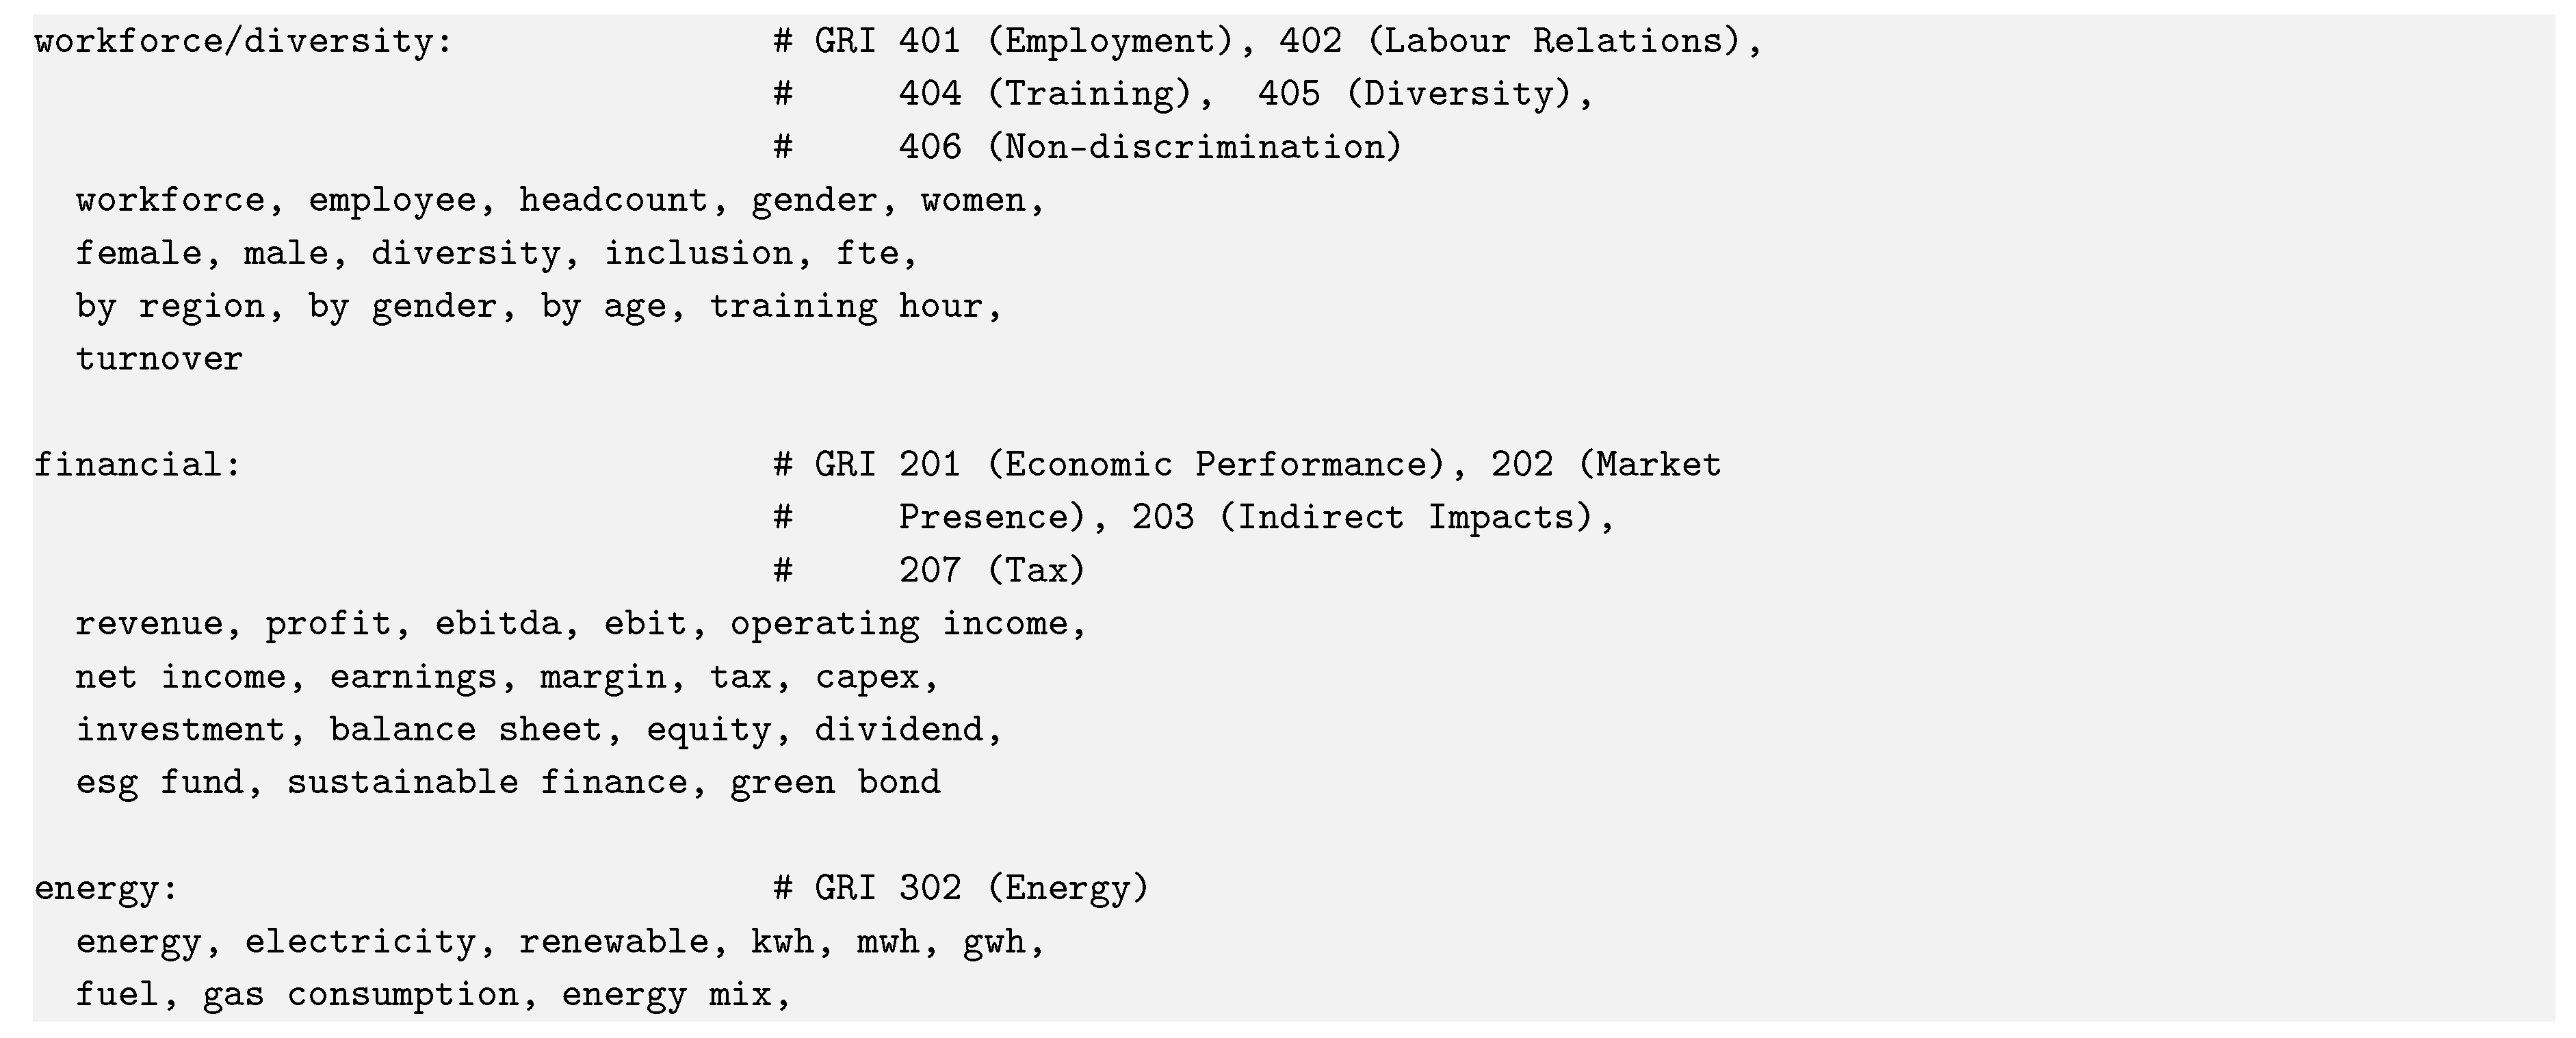
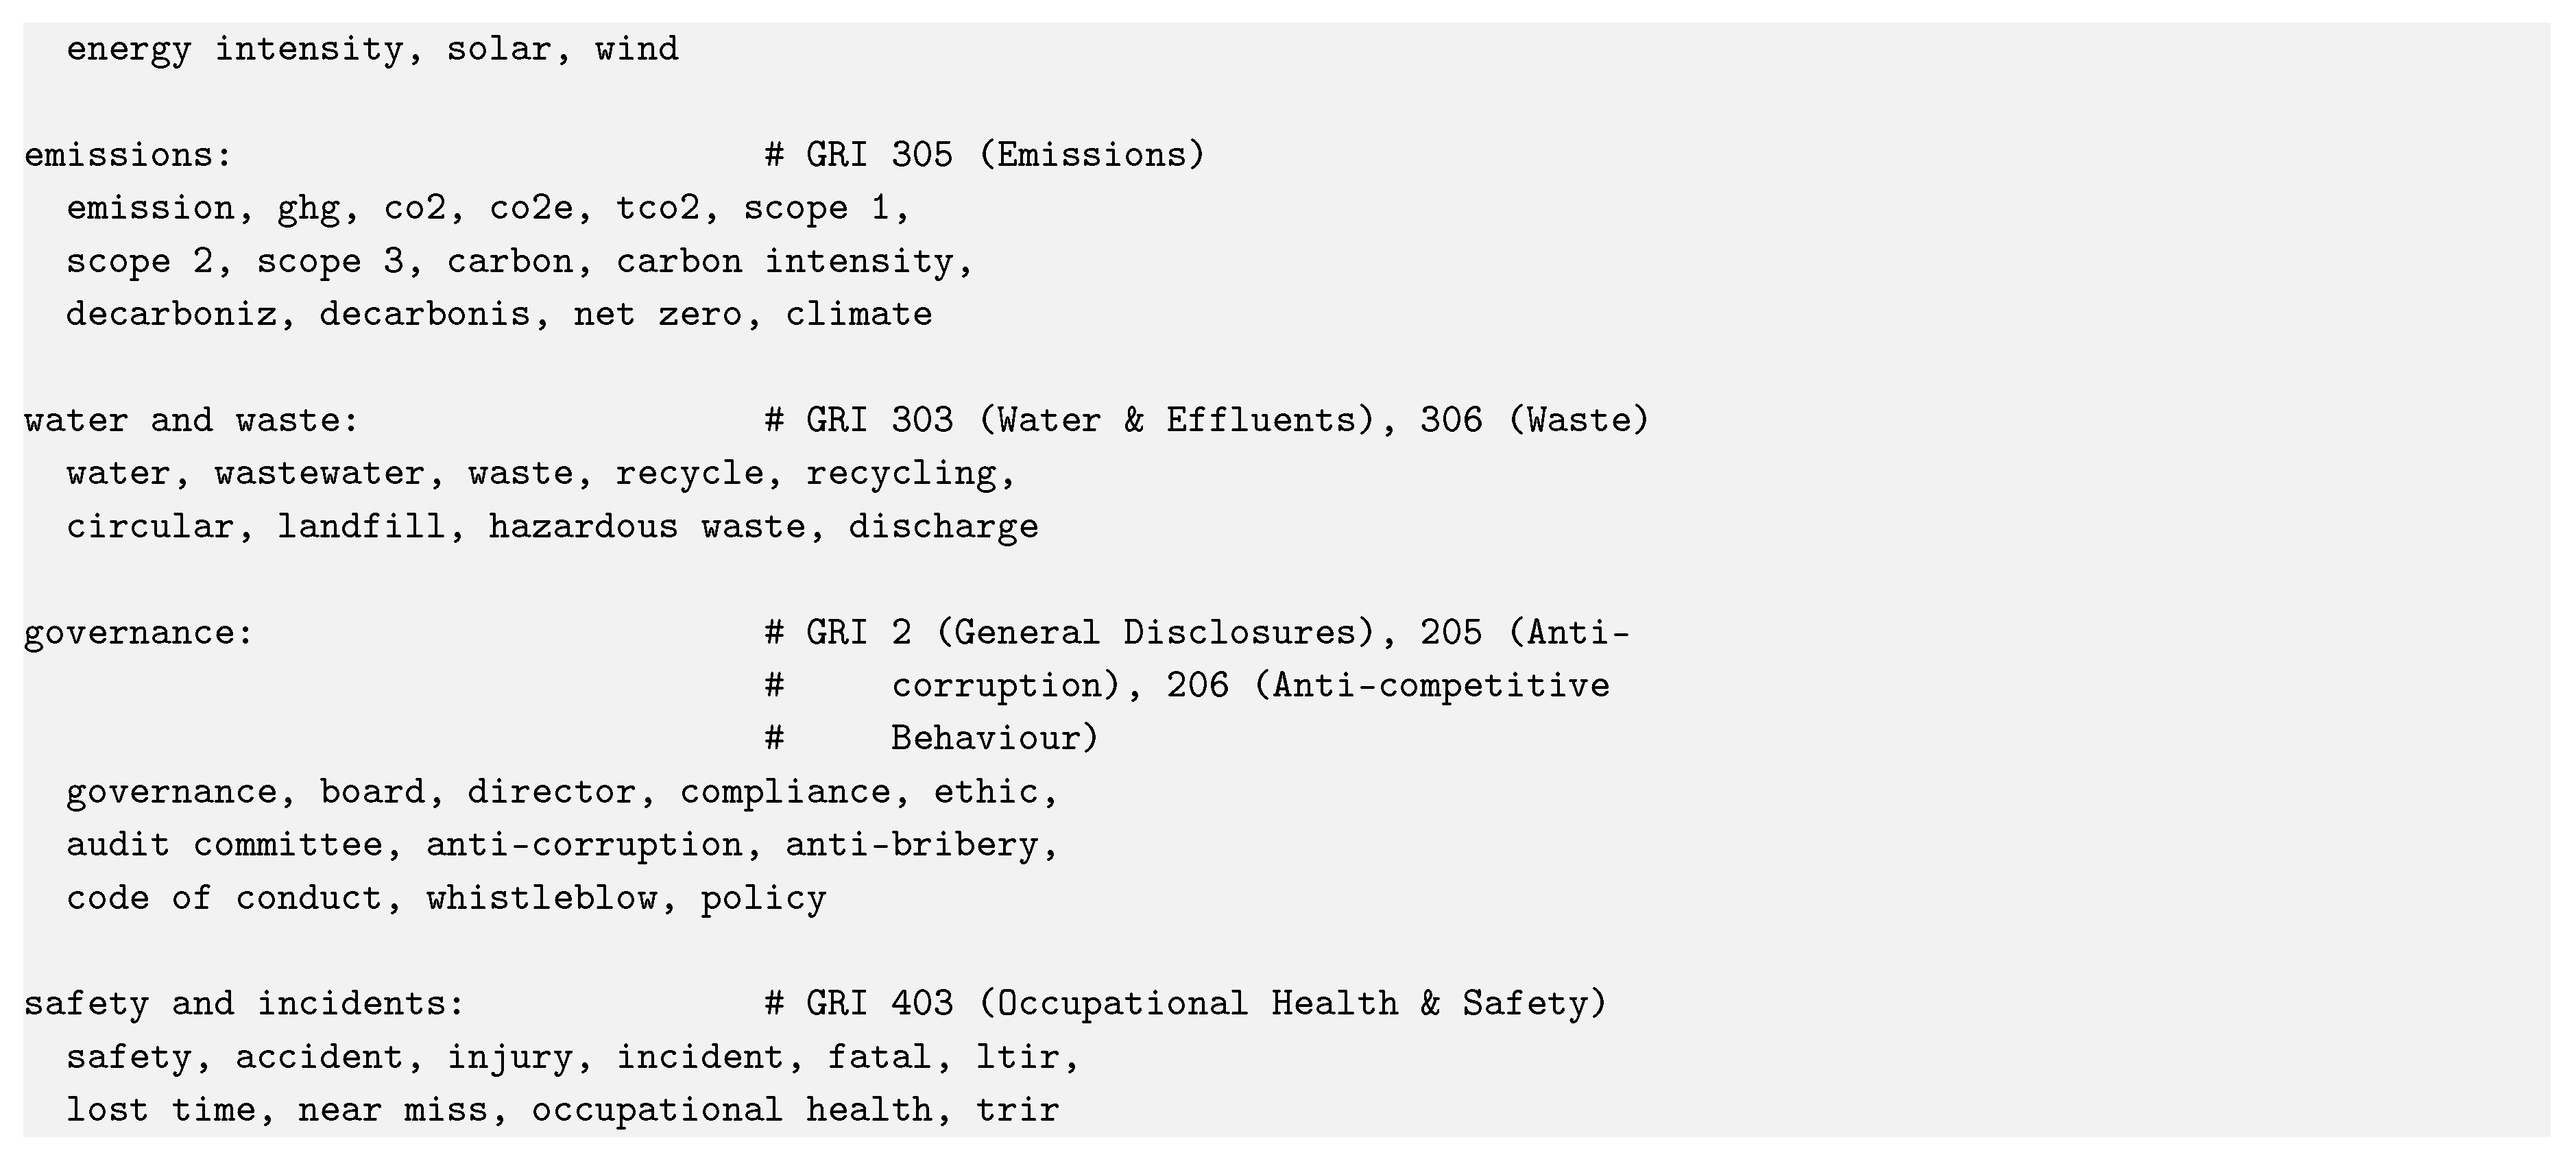
For each successful VL description we extract the full description text (all schema fields plus the caption field), lower-case it, and apply multi-label substring matching against a curated keyword list grouped into seven buckets aligned with the GRI topic-standard series: workforce/diversity, financial, energy, emissions, water and waste, governance, safety and incidents. The full keyword list is in Appendix E; the reproducibility script is released with the dataset. Each description matches zero, one, or several buckets. We report per-bucket shares (matches divided by the with-data description count) and the residual (no-bucket-matched) share. The KPI coverage measurement is independent of the numeric-uplift measurement.
5.3. Stage-Reliability Metrics
We define and report:
- Truncation rate: the fraction of attempted descriptions whose generation terminates inside the <think> reasoning span (no closing </think> emitted) or emits a closing </think> but never starts the structured-output header. We report this under the prefill configuration on the production run.
- Schema compliance: the fraction of successful descriptions that contain every required schema header in order (excluding the prefilled **Figure type:** anchor, which is forced by construction under the prompt pattern of Section 4.4).
- NO_DATArate: the fraction of attempted descriptions that correctly emit the literal NO_DATA token (the model recognized the image as unreadable), separated from truncations.
- Mean inference latency: wall-clock seconds per image, averaged across the production workers.
We did not record a quantitative open-prompt baseline during prompt engineering; the speedup attributed to the prefill pattern is therefore reported qualitatively (Section 6.5).
5.4. Compute-Cost Metrics
GPU-hours per stage (classification, description), per-report amortized cost, and projected cost at full-corpus scale, measured against SLURM job records on A100-SXM-64GB GPUs.
5.5. Deferred End-to-End RAG Metrics
For the A/B comparison (Section 6.7) we use LLM-as-judge completeness scoring. The judge (Qwen3-4B) rates each answer on a 0–100 scale. We report mean completeness per condition, per-question deltas, and stratifications by question. To validate the LLM judge, we also compute an LLM-free completeness score based on answer structure (compute_simple_completeness.py in the supplementary code). The Python metric assigns 0 for “Information not available” responses, awards up to 60 points for the count of data-bearing numbers, 20 points for unit indicators (%/million/tonnes), and 20 points for evidence of a breakdown (three or more distinct data values). The metric is deterministic and reproducible without any model. In future work, RAGAS [17] metrics—Faithfulness, Answer Relevancy, Context Precision, Context Recall—could complement this evaluation, but we focus here on the completeness dimension most directly related to the representation gap.
6. Results
We define the two conditions used throughout: A = text-only Markdown produced by the Docling pipeline of Section 4.2; B = text+VL Markdown produced by augmenting A with the structured descriptions of Section 4.3.
6.1. Overall Comparison
Table 1 summarizes the corpus-side metrics on the 274-report subset. The VL augmentation adds structured numeric content to 267 of 274 reports, with the recovered content concentrated in the GRI topic-standard series that ESG questionnaires query. The prompt pattern of Section 4.4 produces zero observed truncations and 100% schema compliance across the 8,112 successful descriptions that generate this content. Subsequent subsections develop each row.
6.2. Information Loss in Text-Only Pipelines
Figure 2 traces the 48,896 images extracted from the 274-report subset through the VL pipeline. The classifier labels 10,606 (21.7%) as RELEVANT and 37,792 (77.3%) as IRRELEVANT; a residual 498 images (1.0%) return an unparseable label or a downstream read failure and are excluded from the describable funnel.3 The size filter further reduces the relevant set to 8,454 describable images: the 2,152 dropped survivors (20.3% of the RELEVANT set) are predominantly icon-shaped images (small logos, decorative roundels with embedded text) that pass the binary classifier but carry no readable axis or table. A second VL pass (Section 4.3) attempts structured extraction on the 8,454 describable images: 8,112 (96.0%) emit a schema-compliant structured body and 342 (4.0%) emit the literal NO_DATA token (the model’s self-report that the image is unreadable).4 The NO_DATA self-report is not ground-truth-validated here; whether the 342 NO_DATA images truly carry no data, and whether the 8,112 schema-compliant bodies faithfully read the underlying figures, are deferred validation items (Section 8.1).
6.2.0.20. Commentary
Approximately one image in five is classifier-flagged as data-bearing, and the VL describe stage emits a schema-compliant structured body on 96% of attempts in that set. We do not claim that each schema-compliant body faithfully reads its source figure; intrinsic accuracy is bounded (Section 8.1 discusses this in detail). Across the 274 reports, the data-bearing image counts have mean 39, median 28, P90 78, and max 474; only 5 of 274 reports have zero data-bearing images. All of this content is silently discarded by any Markdown-only pipeline—the gap the augmentation stage targets.
6.2.0.21. Figure type composition.
The recovered content is not uniformly distributed across visual formats. Analyzing the markdown of the 8,153 with-data descriptions (including the dev-run document; see Appendix F), we classify 60.1% as infographics (multi-element diagrams combining text, icons, and data), 19.3% as bar charts, 4.8% as tables, 4.8% as pie charts, 4.5% as line charts, 3.0% as maps, and 1.2% as organizational charts; the remaining 2.3% span timeline, scatter plot, area chart, and diagram categories. Infographics dominate because ESG reports use them to package narrative context with quantitative KPIs—precisely the content that a text-only conversion discards most completely. The visual density is substantial: across the 274 reports, images occupy a mean 1.74 images per page (median 1.44) over 17,600 unique pages, with median image dimensions of 130 × 78 px, characteristic of embedded chart thumbnails and sidebar infographics.
6.3. Corpus-Level Numeric Uplift
Per-report and corpus-wide statistics are reported in Table 4. The augmentation adds 8.0 MB (+6.6%) on top of the 121.3 MB of text-only Markdown and 116,673 numeric tokens (+16.0%) on top of the 731,241 numeric tokens in condition A. Translated to word counts, the enriched Markdown grows from 12.8M to 14.1M words (mean +17.8%, median +9.2%; 267 of 274 reports show positive word growth). The size growth is heavily right-skewed: median +6.0%, mean +13.1%, max +162%; the 7 reports with zero numeric uplift are those whose only relevant images either failed the size filter or returned NO_DATA.
6.3.0.22. Commentary
The uplift is targeted: it adds content where the text-only pipeline was weakest (reports relying on visual-only tables and infographics) and is essentially invisible elsewhere. Critically, the measurement does not depend on retrieval, embedding, or generator behavior; it is reproducible on the released corpus with a single regex pass. Unlike RAGAS or LLM-as-judge metrics [26], this is invariant to downstream model choice.
6.3.0.23. Decimal comma sensitivity.
The primary counting regex treats , as a thousands separator (standard for English-language ESG reports). European-style decimal commas (e.g., 1,234 meaning ) would be misread as a four-digit integer, potentially inflating the count in both conditions. Counting under the broader regex \b\d+(?:[.,]\d+)?\b—which accepts any digit sequence with an optional fractional part under either separator—changes the corpus-wide numeric-token counts for both conditions but preserves the directional uplift: the broader rule yields approximately (vs. under the primary rule), confirming that no reasonable counting variant reverses the finding. The released reproducibility script (compute_numeric_uplift.py) exposes both regex variants for independent verification.
6.4. KPI-Domain Alignment
Applying the multi-label keyword matching of Section 5.2 to the 8,112 with-data descriptions yields the bucket shares in Table 3. We first apply keyword matching (Section 5.2) as a fully reproducible lower bound. However, keyword matching captures only explicit GRI-topic vocabulary and misses descriptions that convey numeric or category data without the corresponding keyword tokens—for example, a bar chart of headcount by region with no occurrence of “workforce” or “employee.” To obtain a more accurate assessment, we apply an LLM-as-judge (Gemma-3-4B) that interprets each description semantically. The LLM judge classifies all 8,153 with-data descriptions (8,112 within the 274-report subset; see Appendix F for reconciliation) into one or more KPI buckets using the same seven-category taxonomy (Appendix B). Table 2 compares the keyword floor and the LLM-judge result. The residual collapses from 44.9% (keyword) to 0.2% (LLM judge), and 77.9% of descriptions hit two or more buckets (median 2, mean 2.2). This confirms that the LLM judge—which reads the full semantic content of each description—substantially outperforms the keyword heuristic: keyword matching fails to detect KPI relevance in 44.9% of descriptions that the LLM judge correctly identifies as belonging to at least one GRI-aligned bucket. The largest absolute gains are in financial reporting (keyword 15.7% → LLM 66.7%), emissions (13.7% → 43.1%), and workforce/diversity (20.6% → 51.3%).5
Despite its conservatism, the keyword measurement is useful for two reasons: it is fully reproducible (no LLM at evaluation time) and it establishes a guaranteed floor on alignment—every keyword match is a certain-domain hit. The seven buckets all receive non-trivial coverage; the largest are workforce/diversity (20.6%) and financial reporting (15.7%), the smallest is safety and incidents (5.1%). The 44.9% residual is dominated by generic infographics and organizational charts whose description text contains none of the keyword tokens; a no-bucket match does not imply the description is unused by downstream RAG—headcount-by-region data, for example, is KPI-relevant even if it falls outside the keyword heuristic.
6.4.0.24. Commentary
Figure 3 reproduces the keyword shares visually. The full LLM-judge analysis (Table 2) provides a more reliable picture: the residual falls from 44.9% (keyword) to 0.2% (LLM judge), confirming that the LLM judge—which interprets descriptions semantically rather than by surface vocabulary—correctly identifies KPI relevance in descriptions that the keyword heuristic misses. Financial reporting shows the largest gap between methods (keyword 15.7% vs. LLM 66.7%), consistent with the observation that revenue, profit, and investment breakdowns are frequently rendered as infographics rather than textual tables in ESG reports. The seven bucket keyword shares sum to 89.5%, indicating that a non-trivial fraction of descriptions cross GRI series boundaries (e.g., an emissions chart broken down by region or by business segment). The recovered content distributes across all three GRI topic-standard series—200 (economic), 300 (environmental), 400 (social)—that ESG questionnaires query. Governance, traditionally narrative-dominated, is mid-tier in our recovery, consistent with chart-heavy categories being the gap that VL augmentation closes. A practitioner reading the figures can predict, before running any downstream RAG query, where augmentation will most plausibly improve answers: in workforce-composition, energy-mix, and emissions disclosures.
6.5. Stage Reliability and Schema Compliance
We characterize the VL describe stage on the production run of the 274-report subset. Across 8,454 attempted descriptions over 8 SLURM workers, the prefill configuration produces zero generations that terminate inside the <think> reasoning span; 8,112 descriptions emit a complete schema-compliant body and 342 correctly emit the literal NO_DATA token. Schema compliance among the 8,112 successful descriptions is 100%—every output starts with the prefill anchor **Figure type:** and contains every required header in order—so no manual cleanup is required before indexing. Mean wall-clock inference time per image is 8.87 s, computed as the sum of per-worker elapsed time (75,007 s) divided by total images.
6.5.0.25. Why the prefill pattern matters
Before adopting the prefill pattern we observed, during prompt-engineering iteration on Step3-VL-10B, that the open-prompt configuration consistently saturated the configured max_new_tokens budget (1024) inside the reasoning span, never reaching the structured-output body; we did not preserve quantitative measurements of that baseline (truncation rate or mean latency). The prefill pattern eliminates the failure mode by construction: the closing </think> and the first two header tokens of the structured schema are part of the prompt, so the first generated token continues the structured answer rather than starting a preamble. The reliability evidence above is the post-fix production behavior; we present it as evidence that the engineering recipe of Section 4.4 is sufficient to run the augmentation stage at production scale, and explicitly do not report a quantitative speedup factor against an unrecorded baseline.
6.5.0.26. Generality of the pattern (predicted, not measured)
The pattern depends only on (i) a chat template that opens the assistant turn with a reasoning span and (ii) a fixed structured-output schema. It should therefore apply to any constrained-format extraction task on a hybrid-reasoning VL or LLM model. We measured this only on Step3-VL-10B and make no claim about its effect on free-form generation tasks.
6.5.0.27. Compute envelope
On A100-SXM-64GB GPUs: classification consumed 55 GPU-hours over 48,896 images (mean 4.05 s/image, lower than description because the binary label is short and the prompt skips the structured-output schema); description consumed 21 GPU-hours over 8,454 describable images (mean 8.94 s/image, consistent with the 8.87 s/image figure reported earlier). Per-report amortized cost is approximately 17 GPU-minutes. Linearly extrapolating to a 14,000-report corpus projects to approximately 3,900 GPU-hours (a projection, not a measurement), feasible on an allocated HPC quota. This extrapolation assumes the RELEVANT rate (21.7%) and size-filter yield from the curated subset transfer to the full corpus; a random sample likely contains fewer visually dense reports, so the per-report compute cost may be lower.
6.6. Worked Example
Appendix G reproduces the augmentation output for one image from the 1112_ADIENT_PLC_2020 report (p. 29, “Female by region” bar chart). The original Docling Markdown contained only an <!– image –> placeholder at this location. After augmentation, a structured Markdown table with five region rows and a Summary describing the workforce/diversity content is appended to the file. A downstream RAG query such as “what is the percentage of women in the workforce by region?” (Q48 in the GRI-referenced prompt set) now retrieves this structured block directly. In condition A the same query has no on-page text to retrieve.
6.7. End-to-End Downstream RAG (Preliminary)
We report a preliminary A/B comparison on 83 of the 274 reports, using 6 VL-targeted questions (Appendix D). These questions probe each of the seven KPI buckets identified in Section 6.4 (workforce, financial, emissions, energy, governance, water and waste, safety), with deliberate oversampling of figure-dependent disclosures where the keyword-coverage gap predicts the largest text-only shortfall. Each question maps to one or more GRI topic-specific disclosures: VL05 (new hires by region, GRI 401-1); VL07 (sustainability-aligned revenue or capex, GRI 201-2, EU Taxonomy); VL08 (GHG emissions breakdown by scope, GRI 305-1/2/3); VL10 (employee distribution by region, GRI 401-1); VL11 (workforce by employee category, GRI 2-7, 405-1); VL12 (patents, R&D sites, and production facilities, GRI 201-1). VL02 was excluded after a pilot run showed no aggregate improvement. The generator and judge are Qwen3-4B-Instruct (Ollama, temperature 0). The embedding model is Qwen3-Embedding-4B with the fixed inference path and unified text preprocessing of Appendix C. Chunking uses TokenTextSplitter 512/30, and we retrieve the top most relevant chunks. The RAG experiments run on a dedicated workstation with an NVIDIA RTX 6000 Ada Generation GPU (48 GB VRAM) and 125 GB RAM, serving all models via Ollama. Total execution time for the 83-report, 6-question comparison is approximately 2 hours.
Across 498 QA pairs (83 reports × 6 questions), condition A (text-only) scores a mean completeness of 11.2/100 and condition B (text+VL) scores 18.3/100, a mean improvement of points. Eighty pairs improve (16.1%), 27 decline (5.4%), and 391 are unchanged (78.5%). Table 5 breaks the results down by question.
6.7.0.28. Observations
The largest gains come from content that exists only in figures: VL10 (employee distribution by region, GRI 401-1, points, 31.3% improvement rate) and VL08 (GHG emissions breakdown by scope, GRI 305-1/2/3, ). VL12 (patents, R&D sites, and production facilities, GRI 201-1) shows a mean A score of 0.0—text-only retrieval found no matching content in any of the 83 documents—while VL augmentation enabled recovery in 7 of 83 (8.4%), with zero declines. VL05 (new hires by region, GRI 401-1) and VL11 (workforce by category, GRI 2-7/ 405-1) show moderate gains (3.7 and 5.1 points respectively). VL07 (sustainability-aligned revenue/capex, GRI 201-2) is the weakest performer (); the narrow spread suggests that taxonomy classification data is partially recoverable from text even without chart content.
6.7.0.29. Validation via LLM-free metric
To verify that the LLM-judge scores reflect genuine data recovery rather than judge artifact, Table 6 compares them against a fully deterministic Python completeness score (defined in Section 5.5). The two metrics agree on direction and relative ranking across all six questions: both identify VL10 and VL08 as the largest improvers and VL07 as the weakest. The Python metric shows a larger overall spread (A=15.1, B=25.2, ) than the LLM judge (), consistent with the Python metric being stricter—it awards zero credit for vague answers that lack extractable numbers, whereas the LLM judge can allocate partial credit for verbally correct but unsupported statements.
These results are preliminary: they cover 83 of 274 reports with a single generator-as-judge and 6 custom questions rather than the full 59-question GRI-referenced set. We interpret them as supporting evidence for the thesis— point mean improvement concentrated in figure-dependent queries—ahead of the complete protocol (Section 8.2).
6.8. Threats to Validity
The numeric-token uplift is sensitive to the regex used to count numbers, but holds with substantial margin under any reasonable counting rule because the augmentation produces tabular data where condition A produced literal placeholders. The KPI-bucket alignment is computed by keyword matching on the full description text and inherits the limitations of keyword matching; we report it as descriptive, not as a substitute for downstream metrics. The 0% truncation rate is measured under matched generation parameters and a single VL model (Step3-VL-10B); the corresponding open-prompt baseline is not preserved as a quantitative measurement, so the prefill recipe of Section 4.4 is supported by post-fix reliability rather than by a measured speedup, and is presented as an engineering note rather than as a contribution. The subset is curated, not uniformly random; recovery yield on a uniformly random sample of the full corpus is expected to be modestly lower.
7. Discussion and Implications
7.1. Theoretical Implications
This study reframes the retrieval bottleneck in ESG RAG from a generator-side problem to a corpus-representation problem. Prior work has benchmarked generators [27], proposed ESG-specific retrieval tools [4,5], and explored LLM-based corpus enrichment for text-only retrieval [21]. Asenov et al. [22] recently showed that better document representation—rather than better retrieval mechanisms—drives benchmark improvements in visually rich RAG. However, their analysis focuses on OCR and transcription quality for multilingual text, not on recovering visual content that standard pipelines discard entirely. In contrast, our work quantifies the loss of data-bearing visual content at the corpus level and demonstrates that VL augmentation recovers it. The corpus itself systematically under-represents the available information, independent of any downstream generator. The 21.7% visual representation gap we measure operates at the index level—it precedes retrieval, embedding, and generation—and therefore caps the maximum achievable recall regardless of generator quality. This distinction is the paper’s central theoretical contribution: a representation gap is a retrieval ceiling, and closing it is a precondition for measurable improvement.
The finding has broader implications for information retrieval research. Standard evaluation frameworks (RAGAS, TREC-style) measure retrieval and generation quality against a fixed corpus, but a corpus can be an incomplete proxy for the underlying documents. Corpus-side metrics—numeric token counts, keyword coverage, schema compliance—offer a complementary evaluation layer that is invariant to downstream model choice and reproducible from released artifacts. We argue that representation-side analysis should be a standard diagnostic step before interpreting retrieval or generation scores, particularly in visually rich domains.
7.2. Practical Implications
The VL augmentation pipeline is a drop-in stage that requires no changes to the retriever, embedding model, vector store, or generator. It runs on a single open-weight VL model (Step3-VL-10B) on commodity GPU hardware, making it deployable on-premise for confidentiality-sensitive ESG workflows. At 17 GPU-minutes per report (projected to 3,900 GPU-hours for the full 14,000-report corpus on an HPC allocation), the cost is feasible for a one-time corpus enrichment that is then amortized across every downstream query.
For ESG practitioners, the results provide a quantitative basis for including VL augmentation in regulatory-disclosure RAG pipelines. The recovered content targets exactly the GRI-aligned KPIs that regulators and investors query—workforce composition, emissions breakdowns, energy mix, tax disclosures—and the +7.0/100 completeness improvement in our preliminary A/B is concentrated in those figure-dependent queries that text-only retrieval systematically misses. The pipeline also emits structured Markdown with page and bounding-box provenance, supporting the audit trail required for regulated use cases.
For the broader retrieval community, the engineering recipe (forced reasoning-block closure plus structured-response prefill) addresses a practical failure mode of hybrid-reasoning VL models that is likely to arise in any constrained-format extraction task at scale. The zero-truncation and 100% schema compliance results on 8,112 descriptions demonstrate that the pattern is sufficient for production deployment on Step3-VL-10B.
8. Conclusion and Future Work
Text-only RAG over Markdown-converted ESG reports silently discards approximately one image in five, and the discarded images are overwhelmingly data-bearing. We have presented three contributions. First, a corpus-level quantification of this loss on 274 reports. Second, a drop-in vision–language augmentation stage using Step3-VL-10B that recovers the lost content as structured Markdown. Third, corpus-level evidence that the augmentation recovers exactly the categories of content that GRI-aligned ESG questionnaires query: +16.0% numeric tokens, +17.8% mean word growth, KPI-domain coverage bounding from 44.9% residual under keyword matching to 0.2% under LLM-as-judge on 8,153 descriptions, and 0 truncations across 8,454 attempts. The accompanying engineering note (Section 4.4) documents a reusable prompt-engineering recipe—forced reasoning-block closure plus structured-response prefill—that we used to run the stage reliably at production scale on Step3-VL-10B. We present this recipe as engineering practice characterized on one model; the corresponding open-prompt baseline was not preserved as a quantitative measurement. Together, these components form a practical recipe: augment the text-only corpus with VL descriptions, then run a strong mid-sized generator over the enriched index, all on on-premise open-source infrastructure.
8.1. Limitations
- Subset curation. The 274-document subset is built around 100 companies with multi-year coverage in recent reporting years (2020–2024) rather than by a page-length threshold; it is visually dense in practice, but its page-length distribution is not shifted above the full corpus (Section 4.2). Recovery yield on a uniformly random sample of the full corpus is expected to be modestly lower; reports with little visual content trivially yield no augmentation.
- KPI residual coverage (keyword lower bound). The keyword-matching measurement yields 44.9% residual (no GRI-aligned bucket). The full LLM-judge analysis (8,153 descriptions, Table 2) reduces the residual to 0.2% (17 of 8,153), confirming that the keyword method substantially under-estimates true coverage—the true KPI-domain alignment is bounded between the reproducible keyword floor and the LLM-judge ceiling. The residual is dominated by organizational charts and company-overview diagrams whose content, while data-bearing, falls outside the keyword vocabulary.
- Open-prompt baseline not preserved. We did not record a quantitative truncation rate or latency under the open-prompt configuration during prompt-engineering iteration; the reliability of the prompt-engineering recipe (Section 4.4) is therefore supported only by post-fix production behavior and not by a measured speedup ratio. This is the reason the recipe is presented as an engineering note.
- Intra-page position. The append-mode merge (§Section 4.3) does not preserve intra-page positional context. A fine-grained positional splice or a unified text+image retriever [10,11] are open follow-ups.
- Generator-side validation preliminary. The A/B comparison (Section 6.7) covers 83 of 274 reports with a single generator-as-judge (Qwen3-4B) and 6 custom questions rather than the 59-question GRI-referenced set. The point improvement should be read as preliminary evidence for the thesis, not as a definitive per-LLM lift measurement. The complete protocol (3 generators, 59 questions) is deferred to future work (Section 8.2).
- Embedding pipeline fix. The A/B scores (Section 6.7) were produced after fixing two embedding-pipeline bugs documented in Appendix C. Because both conditions use the same fixed pipeline, the directional comparison (B vs. A) is unaffected, but the absolute completeness values (11.2/100, 18.3/100) reflect this specific post-fix configuration.
- Intrinsic VL accuracy not hand-validated. We report only schema compliance and NO_DATA self-reporting; the 8,112 schema-compliant descriptions were not hand-checked for numeric hallucination, axis/unit misreading, or per-figure-type accuracy, nor were the 342 NO_DATA self-reports verified against ground truth. Two pieces of indirect evidence bound the concern. First, systematic hallucination would manifest as RAG declines on figure-dependent questions, but the A/B comparison (Section 6.7) shows a mean improvement with only 5.4% of pairs declining (consistent with LLM-as-judge noise rather than systematic fabrication). Second, the 4.0% NO_DATA rate (342 of 8,454) documents conservative behavior: the model self-refuses rather than confabulating on images it cannot read, and the 342 abstentions are flagged for auditing. A hand-validation of N descriptions is deferred to future work as a generator-side concern orthogonal to the corpus-representation thesis; the representation claim—that the retriever index gains 116,673 numeric tokens it lacked—holds regardless of per-description error rate.
- Retrieval-side impact of size growth. The augmentation grows Markdown size by a median of 6.0% (P90 +29.2%, max +162%); these growths shift chunk boundaries at any fixed chunking configuration. Under the protocol of Section 6.7 (TokenTextSplitter 512/30, ), recall and precision can move independently of the actual content gain. Without the deferred A/B comparison we cannot separate “new content reaches the LLM” from “existing content is reorganized at retrieval.”
- Upstream metadata classifier. The Qwen3-4B sector / reporting-framework metadata pass is released alongside the subset for downstream stratification but is not used as a selection criterion and is not independently validated against ground truth.
8.2. Future Work
We organize outstanding work into four threads. (1) Generator-side validation: complete the A/B comparison across all 274 reports with the fixed protocol—index per condition (TokenTextSplitter 512/30, Qwen3-Embedding-4B, Weaviate v4 HNSW (Hierarchical Navigable Small World, an approximate nearest-neighbor index), , 16k context); 59-item GRI-referenced prompt set; remaining generators Gemma-3-4B-Instruct [15] and Nemotron-3-Nano-30B-A3B [28]. The preliminary single-model, 83-report result (Section 6.7, points) serves as a proof of concept. (2) Intrinsic VL accuracy: hand-evaluate a stratified sample of VL descriptions for numeric hallucination, axis/unit misreading, and per-figure-type accuracy, and validate cross-model on Qwen2-VL [14] and InternVL-3 [16]. (3) Scaling and cost: extend the augmentation to the full 14,000-report corpus and distill the VL head to bring per-document cost below 1 GPU-minute. (4) Multimodal retrieval: replace per-page append with intra-document positional splicing or a cross-modal embedding [10,11], and study regulator-stratified subsets. Concrete protocols for each thread, including hypotheses, datasets, and infrastructure requirements, are documented in the repository.
Author Contributions: Motaz Saad
Conceptualization, Methodology, Writing — original draft, Writing — review & editing. Ivan Gentile: Data curation, Software, Validation, Writing — original draft. Kianna Kazemi: Formal analysis, Validation, Visualization. Antonella Longo: Supervision, Funding acquisition, Project administration.
Data Availability Statement
The derived Markdown corpus, metadata, evaluation subset, reproducibility scripts, and LLM-judge annotations are released for non-commercial research use at https://github.com/ifab-foundation/esg-vl-augmentation. Raw PDFs are subject to per-source terms of service and are not redistributed.
Use of Artificial Intelligence
During the preparation of this work, the author(s) used AI Tools to improve language and readability. After using this tool/service, the author(s) reviewed and edited the content as needed and take(s) full responsibility for the content of the publication.
Acknowledgments
This research was supported by ICSC (PNRR-HPC). Computational work was performed on the Leonardo Booster supercomputer at CINECA (ISCRA/CNHPC).
Appendix A. Corpus Subset Profile
The 100-company subset spans 18 countries across 5 regions (Table A1), with a strong European concentration. Western Europe accounts for 78% of companies—led by Germany (27), France (16), and Spain (10)—followed by the Nordics (15%) and Southern Europe (4%). Only 2% are from Eastern Europe and 1% from North America.6

Table A1.
Geographic distribution of the 100 companies.
| Country | Companies | % | Region |
|---|---|---|---|
| Germany | 27 | 27.0% | Western Europe |
| France | 16 | 16.0% | Western Europe |
| Spain | 10 | 10.0% | Western Europe |
| Italy | 6 | 6.0% | Western Europe |
| Belgium | 5 | 5.0% | Western Europe |
| Ireland | 4 | 4.0% | Western Europe |
| Luxembourg | 4 | 4.0% | Western Europe |
| Netherlands | 4 | 4.0% | Western Europe |
| UK | 1 | 1.0% | Western Europe |
| Austria | 1 | 1.0% | Western Europe |
| Denmark | 8 | 8.0% | Nordics |
| Sweden | 3 | 3.0% | Nordics |
| Finland | 3 | 3.0% | Nordics |
| Estonia | 1 | 1.0% | Nordics |
| Portugal | 4 | 4.0% | Southern Europe |
| Poland | 1 | 1.0% | Eastern Europe |
| Romania | 1 | 1.0% | Eastern Europe |
| USA | 1 | 1.0% | North America |
| Total | 100 | 100% | — |
Across the 100 companies, 11 GICS-aligned sectors are represented, reflecting the breadth of the European economy covered by CSRD and GRI regulation (Table A2). Industrials (22 companies, 61 reports) and Financials (20 companies, 49 reports) are the largest blocks, together accounting for 42% of companies and 40% of reports. Health Care (14 companies, 40 reports), Consumer Discretionary (11 companies, 29 reports), and Information Technology (10 companies, 27 reports) form a middle tier. The remaining sectors—Utilities (6), Consumer Staples (5), Real Estate (4), Energy (4), Materials (2), and Communication Services (2)—contribute the balance. Sector tags are assigned by a keyword classifier over the first 15 K characters of each report’s text-only Markdown, with manual overrides where company names are unambiguous; they are released alongside the subset for descriptive purposes and have been spot-checked but not independently validated.
Table A2.
Sector distribution of the 100 companies (274 reports).
| Sector | Companies | Reports |
|---|---|---|
| Industrials | 22 | 61 |
| Financials | 20 | 49 |
| Health Care | 14 | 40 |
| Consumer Discretionary | 11 | 29 |
| Information Technology | 10 | 27 |
| Utilities | 6 | 18 |
| Consumer Staples | 5 | 13 |
| Real Estate | 4 | 13 |
| Energy | 4 | 14 |
| Materials | 2 | 6 |
| Communication Services | 2 | 4 |
| Total | 100 | 274 |
Appendix B. Prompts
Appendix B.1. Relevance Classifier
Appendix B.2. Structured Description (With Reasoning-Span Fix)
The system prompt instructs the model to return the exact Markdown structure with no commentary:
The user prompt specifies the schema (abbreviated here):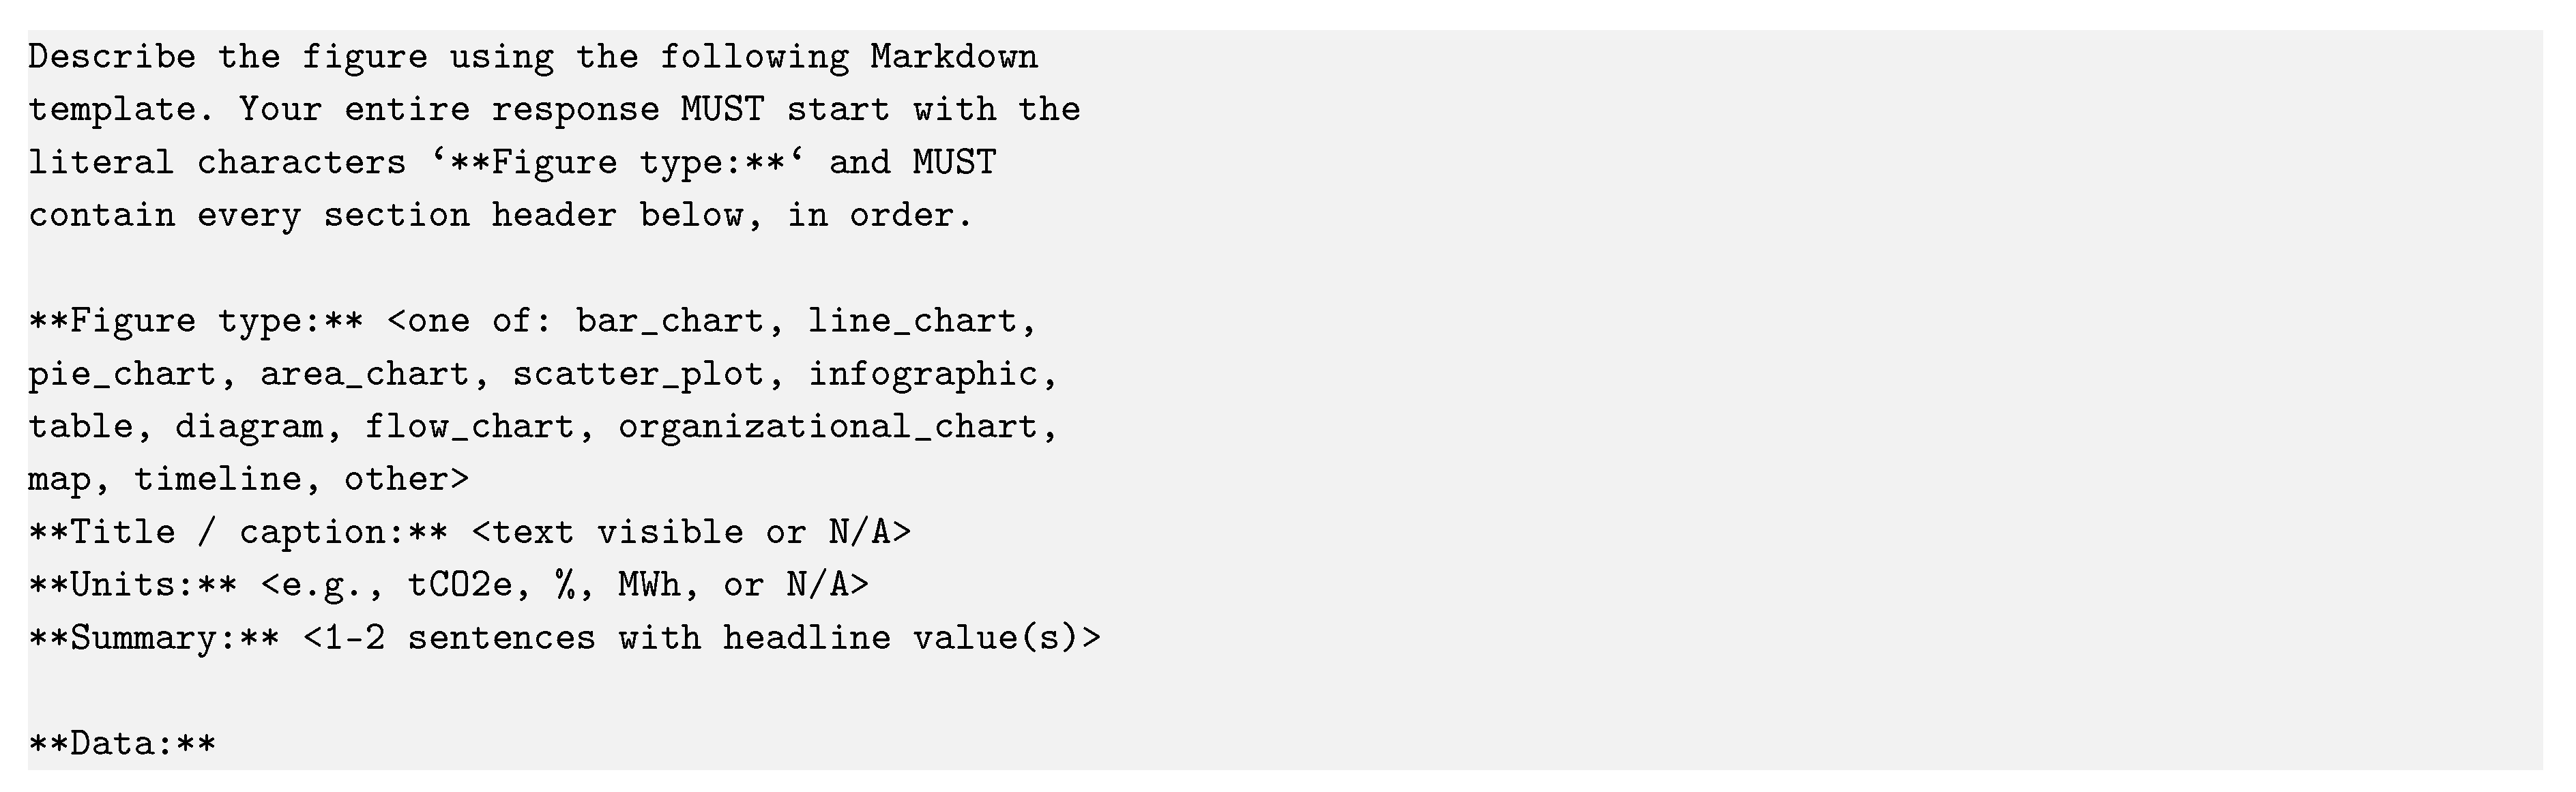
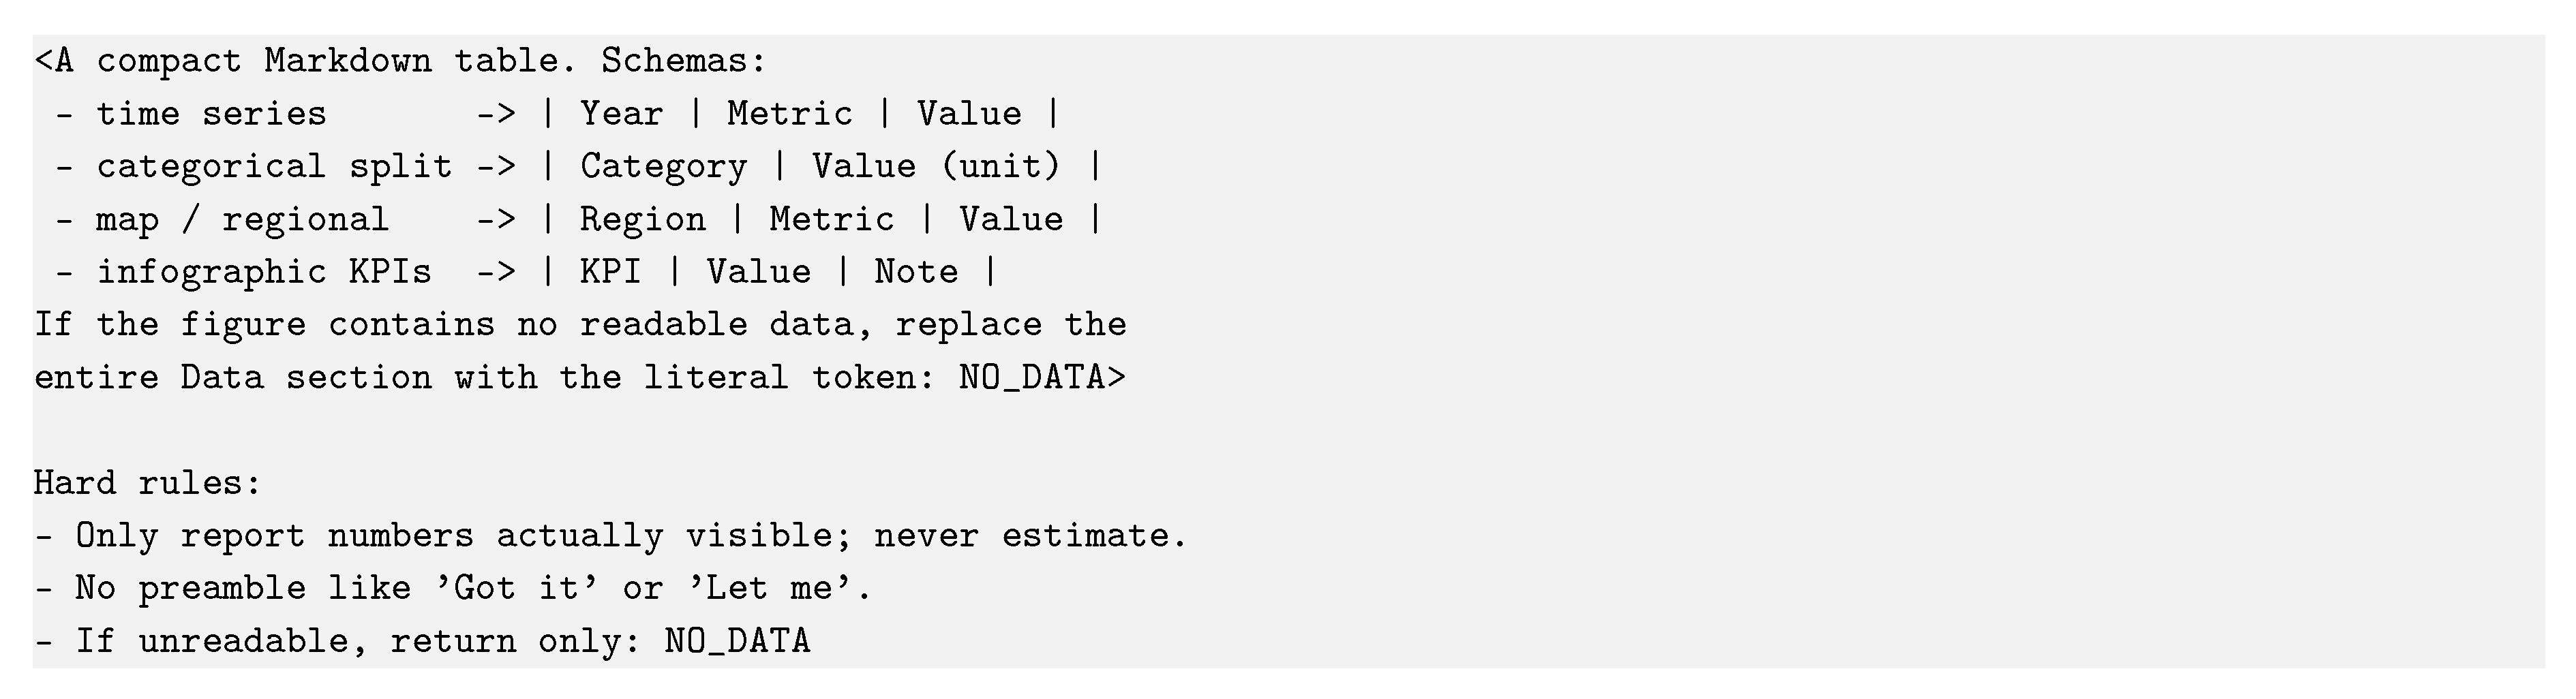
Appendix B.3. Prefill Pattern
Step3-VL’s chat template forces the assistant turn to open with <think>\n. We render the template as text and append the following suffix before handing the string to the model:
This closes the reasoning span immediately and prefills the first two header tokens of the required structure, so the model’s first generated token continues the structured answer rather than starting a preamble.
Appendix B.4. LLM Judge for KPI Coverage
The LLM-as-judge for KPI-bucket classification (Section 6.4) uses the following prompts: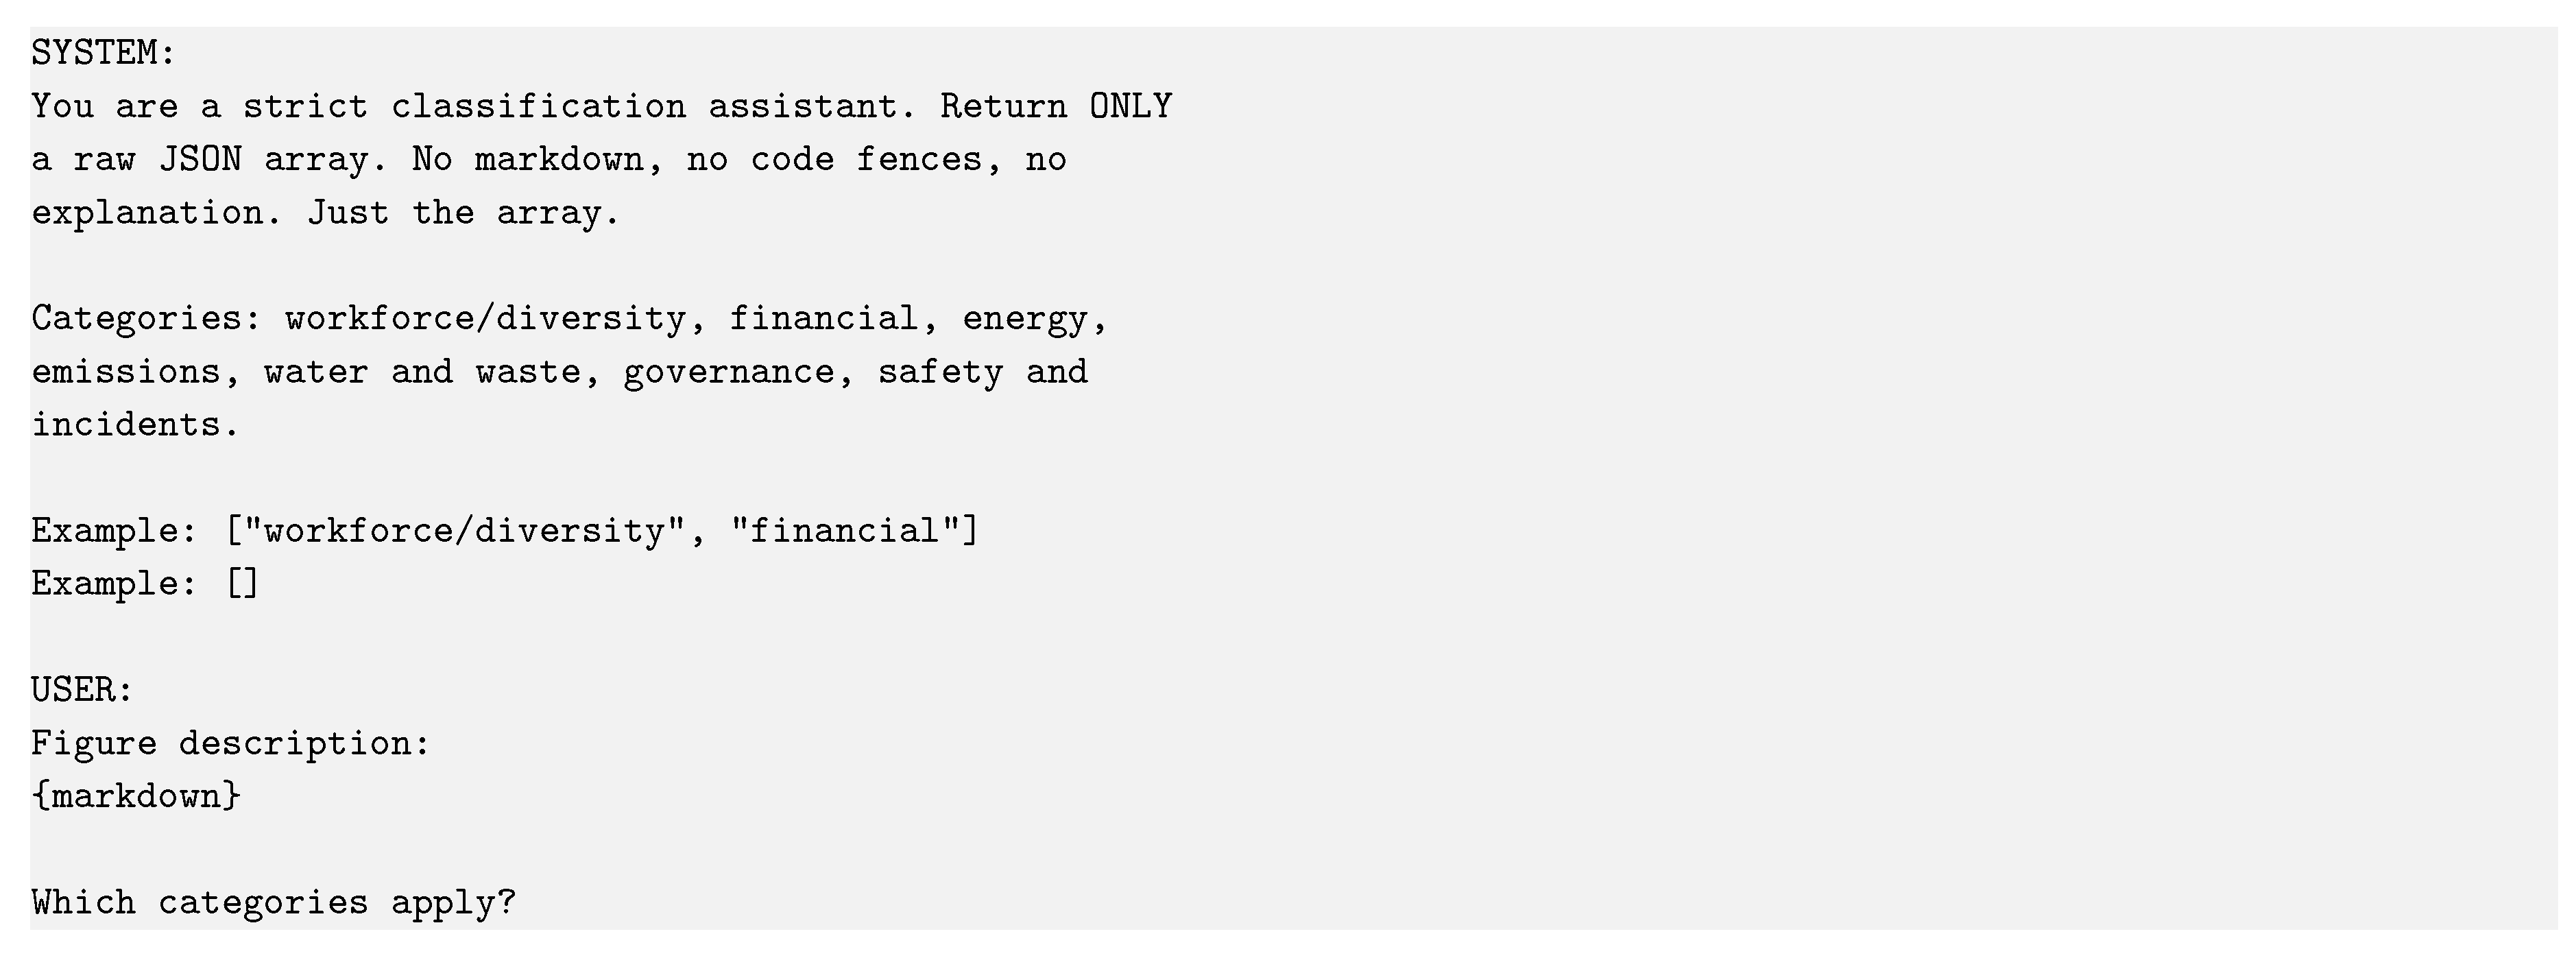
The judge is Gemma-3-4B (temperature 0, num_predict=256). The full per-description annotations are released in llm_judge_results.json.
Appendix C. Embedding Pipeline Fix
During the preliminary A/B comparison we identified and fixed two bugs in the embedding pipeline that had caused near-zero retrieval scores (<0.001 cosine similarity) for all queries.
Appendix C.4.4.30. Unified embedding endpoint.
The question-embedding path called Ollama’s /api/embeddings endpoint (singular), while the chunk-embedding path called /api/embed (batch). The singular endpoint uses a different internal normalization code path; the resulting embeddings were dimension-compatible but had near-zero cosine similarity. Fix: route both question and chunk embeddings through the same /api/embed batch endpoint.
Appendix C.4.4.31. Unified text preprocessing.
Chunks were preprocessed with clean_text_for_embed (whitespace normalization, control-character stripping, length truncation) before embedding, but questions were raw strings. This asymmetry introduced systematic representation drift. Fix: apply clean_text_for_embed to questions before embedding.
Appendix C.4.4.32. Dimension validation.
Added a runtime dimension check in cosine similarity to catch future mismatches (raises ValueError if embedding dimensions differ).
Appendix C.4.4.33. VL-aware chunk boosting.
Added a vl_boost parameter that inflates the cosine similarity of chunks containing the [page p, bbox b] marker by a configurable multiplier (default 1.05). This compensates for the append-mode placement of VL descriptions at the document tail, where they otherwise compete with thousands of preceding chunks for the top-k slots. The impact of the boost is modest by design (), and the complete protocol (Section 8.2) measures retrieval with and without it.
Appendix D. VL-Targeted RAG Evaluation Questions
The preliminary A/B comparison (Section 6.7) uses six VL-targeted questions (Table A3) designed to probe each KPI bucket, with deliberate oversampling of figure-dependent disclosures:
Table A3.
VL-targeted RAG questions used in the A/B comparison.
| ID | KPI Domain | Question |
|---|---|---|
| VL05 | Workforce | How many new hires were there in the reporting period? Look for new hires or hiring statistics broken down by region or department. |
| VL07 | Financial | What percentage of revenue or capex is eligible or aligned with sustainability criteria? Look for ELIGIBLE, ALIGNED, taxonomy-eligible or sustainable revenue metrics from charts or tables. |
| VL08 | Emissions | What is the GHG inventory or emissions breakdown by percentage or category? Look for pie chart or bar chart data showing emissions distribution (Scope 1, 2, 3 or by source type). |
| VL10 | Workforce | What is the regional distribution of employees or revenue? Look for regional breakdowns showing percentages for Europe, U.S., International Markets, Asia, or similar regions from maps or charts. |
| VL11 | Workforce | What are the workforce breakdown percentages or counts by employee category? Look for administration, executives, managers, sales, technical staff, or similar category distributions. |
| VL12 | Innovation | How many patents, R&D sites, production facilities, or productive sites does the company have? Look for icon-based infographics showing counts of these facilities. |
Appendix E. KPI Keyword List
The multi-label keyword matching of Section 5.2 uses the following case-insensitive substring buckets. The reproducibility script is released as compute_kpi_coverage.py alongside the dataset.
Appendix F. Dev-Run Reconciliation
The describe-stage worker logs in the released bundle additionally cover one dev-run sanity-check document (1000_SKANSKAAB2020) that was processed alongside the 274-document subset; counting it raises the raw worker tallies from 8,454 attempted / 8,112 with-data / 342 NO_DATA to 8,496 attempted / 8,153 with-data / 343 NO_DATA. That document is absent from the released Markdown pair, the subset manifest, and all enrichment statistics; every corpus-side figure reported in this paper is computed over the 274-document subset only.
Appendix G. Sample Enriched Markdown
To illustrate what VL augmentation adds, we show the Markdown fragment that the pipeline appends for one image from the 1112_ADIENT_PLC_2020 report (p. 29, “Female by region” bar chart). The original Docling Markdown contained only an <!– image –> placeholder at this location; no numeric content.
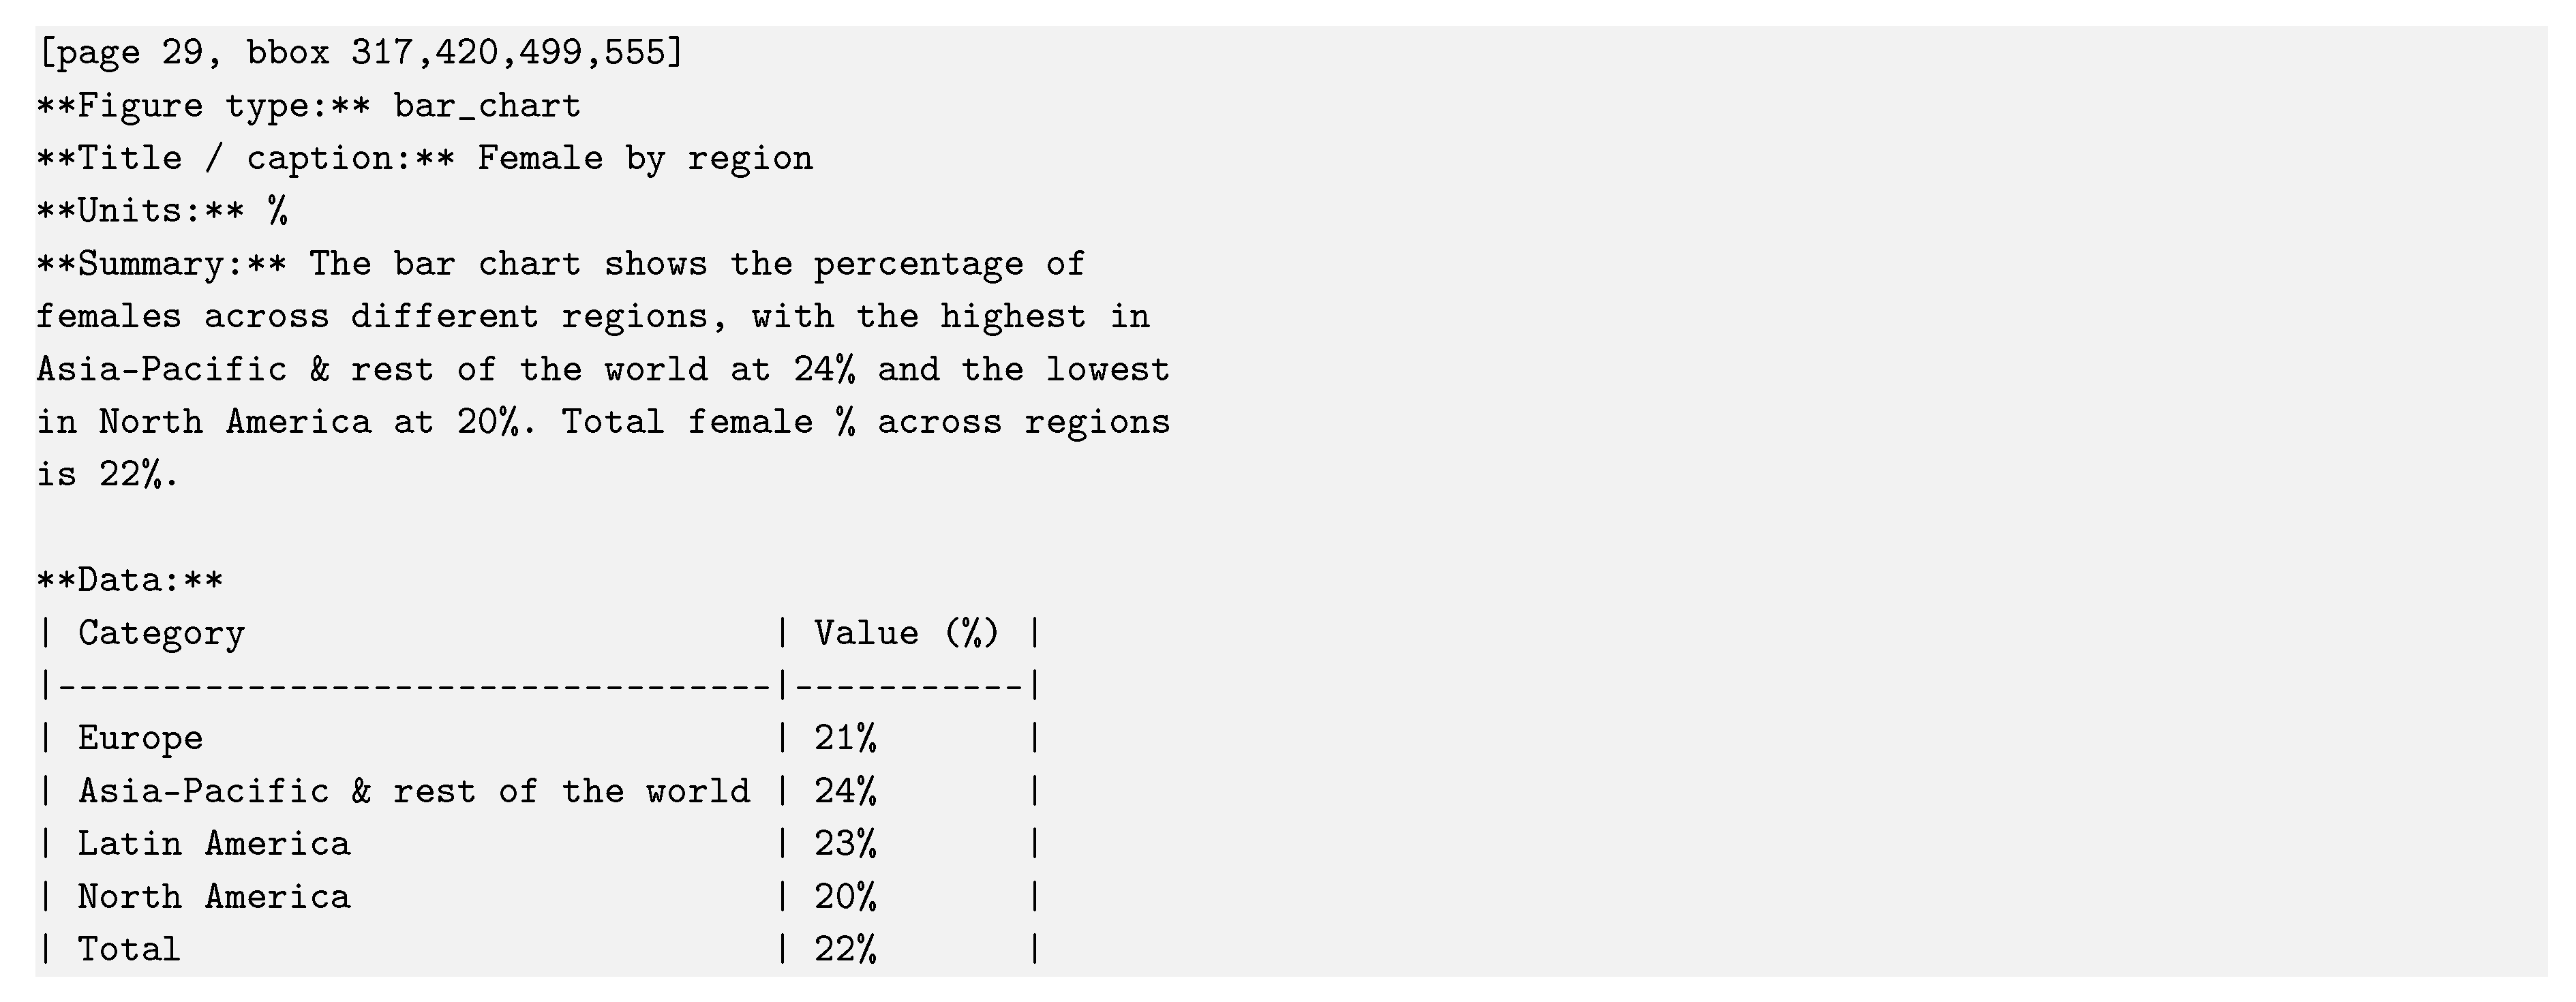
This fragment is chunked and embedded alongside the rest of the report. A downstream RAG query such as “what is the percentage of women in the workforce by region?” (Q48 in our evaluation set) now retrieves this structured block directly. In condition A the same query retrieves unrelated narrative chunks (or none) because the data never existed as text.
References
- Auer, C.; Lysak, M.; Nassar, A.; Dolfi, M.; Livathinos, N.; Vagenas, P.; Berrospi Ramis, C.; Omenetti, M.; Lindlbauer, F.; Dinkla, K.; et al. Docling Technical Report. arXiv 2024, arXiv:cs. [Google Scholar]
- OpenDataLab. MinerU: A One-Stop, Open-Source, High-Quality Data Extraction Tool. Available online: https://github.com/opendatalab/MinerU (accessed on April 2026).
- Blecher, L.; Cucurull, G.; Scialom, T.; Stojnic, R. Nougat: Neural Optical Understanding for Academic Documents. In Proceedings of the Proc. ICLR, 2024. [Google Scholar]
- Ontiveros, A.; Nikishina, I.; Gomm, M.; Schmitt, C.; Biemann, C. ESG-Consultant: Developing of an ESG Compliance Consulting Tool for Companies Using RAG. In Proceedings of the Natural Language Processing and Information Systems, 2026; Springer Nature Switzerland. [Google Scholar]
- Ahmed, S.R.; Shah, A.P.; Tran, Q.H.; Khetan, V.; Kang, S.; Mehta, A.; Bao, Y.; Wei, W. Enhancing Retrieval for ESG-LLM via ESG-CID: A Disclosure Content Index Finetuning Dataset for Mapping GRI and ESRS, 2025. arXiv arXiv:cs.
- Smock, B.; Pesala, R.; Abraham, R. PubTables-1M: Towards Comprehensive Table Extraction from Unstructured Documents. In Proceedings of the Proc. CVPR, 2022. [Google Scholar]
- Masry, A.; Long, D.X.; Tan, J.Q.; Joty, S.; Hoque, E. ChartQA: A Benchmark for Question Answering about Charts with Visual and Logical Reasoning. In Proceedings of the Findings of ACL, 2022. [Google Scholar]
- Liu, F.; et al. DePlot: One-shot Visual Language Reasoning by Plot-to-Table Translation. In Proceedings of the Findings of ACL, 2023. [Google Scholar]
- Liu, F.; et al. MatCha: Enhancing Visual Language Pretraining with Math Reasoning and Chart Derendering. In Proceedings of the Proc. ACL, 2023. [Google Scholar]
- Faysse, M.; Sibille, H.; Wu, T.; Omrani, B.; Viaud, G.; Hudelot, C.; Colombo, P. ColPali: Efficient Document Retrieval with Vision Language Models. In Proceedings of the Proc. ICLR, 2025. [Google Scholar]
- Hu, Z.; Iscen, A.; Sun, C.; Wang, Z.; Chang, K.W.; Sun, Y.; Schmid, C.; Ross, D.A.; Fathi, A. REVEAL: Retrieval-Augmented Visual-Language Pre-Training with Multi-Source Multimodal Knowledge Memory. In Proceedings of the Proc. CVPR, 2023; p. 2212.05221. [Google Scholar]
- Tanaka, R.; Iki, T.; Hasegawa, T.; Nishida, K.; Saito, K.; Suzuki, J. VDocRAG: Retrieval-Augmented Generation over Visually-Rich Documents. arXiv 2025, arXiv:cs. [Google Scholar]
- StepFun, A.I. Step3-VL-10B: A Vision–Language Model. 2025. Available online: https://huggingface.co/stepfun-ai/Step3-VL-10B (accessed on April 2026).
- Qwen Team. Alibaba Qwen2-VL: Enhancing Vision-Language Model’s Perception of the World at Any Resolution. arXiv 2024, arXiv:cs. [Google Scholar]
- Gemma Team, Google DeepMind. arXiv Gemma 3 Technical Report. 2025, arXiv:cs.
- Chen, Z.; Wang, W.; Cao, Y.; Liu, Y.; Gao, Z.; Cui, E.; Zhu, J.; Ye, S.; Tian, H.; Liu, Z.; et al. InternVL3: Exploring Advanced Training and Test-Time Recipes for Open-Source Multimodal Models. arXiv 2025, arXiv:cs. [Google Scholar]
- Es, S.; James, J.; Espinosa-Anke, L.; Schockaert, S. RAGAs: Automated Evaluation of Retrieval Augmented Generation. In Proceedings of the Proc. EACL (System Demonstrations), 2024; pp. 150–158. [Google Scholar]
- Salemi, A.; Zamani, H. Evaluating Retrieval Quality in Retrieval-Augmented Generation. In Proceedings of the Proc. SIGIR, 2024; pp. 2395–2400. [Google Scholar]
- Cuconasu, F.; Trappolini, G.; Siciliano, F.; Filice, S.; Campagnano, C.; Maarek, Y.; Tonellotto, N.; Silvestri, F. The Power of Noise: Redefining Retrieval for RAG Systems. In Proceedings of the Proc. SIGIR, 2024. [Google Scholar]
- Mo, F.; Gao, Y.; Wu, Z.; Liu, X.; Chen, P.; Li, Z.; Wang, Z.; Li, X.; Jiang, M.; Nie, J.Y. Leveraging Historical Information to Boost Retrieval-Augmented Generation in Conversations. Inf. Process. Manag. 2026, 63, 104449. [Google Scholar] [CrossRef]
- Zur, G.; Mordo, T.; Tennenholtz, M.; Kurland, O. On the Merits of LLM-Based Corpus Enrichment. arXiv 2025, arXiv:cs. [Google Scholar]
- Asenov, M.; Benkirane, K.; Goldwater, D.; Ghodsi, A. Retrieval or Representation? Reassessing Benchmark Gaps in Multilingual and Visually Rich RAG, 2026. arXiv arXiv:cs.
- Song, M. Defining the Problem: The Impact of OCR Quality on Retrieval-Augmented Generation Performance and Strategies for Improvement. Inf. Process. Manag. 2026, 63, 104368. [Google Scholar] [CrossRef]
- Wen, Z.; Li, Y.; Chow, K.H.; He, C.; Zhang, W. OCR Hinders RAG: Evaluating the Cascading Impact of OCR on Retrieval-Augmented Generation. arXiv 2024, arXiv:cs. [Google Scholar]
- Sustainability Reporting Navigator. SRN Reports Database. 2024. Available online: https://srnav.com/reports (accessed on April 2026).
- Zheng, L.; et al. Judging LLM-as-a-Judge with MT-Bench and Chatbot Arena. In Proceedings of the Proc. NeurIPS Datasets and Benchmarks, 2023. [Google Scholar]
- Saad, M.K.H.; et al. Empirical Evaluation of Open-Source Large Language Models for Retrieval-Augmented Generation in the ESG Domain. In Proceedings of the ITADATA 2026 Under review, 2026. [Google Scholar]
- NVIDIA. NVIDIA Nemotron 3 White Paper; Accessed; NVIDIA, 2025; (accessed on April 2026)Technical report. [Google Scholar]
| 1 | Subset page figures are computed from the maximum PDF page number among extracted images per document in the classification output, a lower bound on the true page count. For context, the full 14,361-report corpus (PyMuPDF page_count) has P25/median/P75/P90 page counts of 48/93/178/303 and a mean of 137.5; the subset median therefore sits at the corpus median and its upper tail is shorter, so the subset is not biased toward longer-than-typical reports. |
| 2 | A formal dataset licensing statement is in preparation and will accompany the camera-ready version. |
| 3 | Unparseable labels are classifier outputs that omit the CLASSIFICATION: line or emit garbled tokens; downstream read failures are images that could not be loaded (corrupt file, zero-byte extraction, or truncation during PDF-to-image conversion). The two categories are logged separately but grouped in the funnel because neither reaches the describe stage. |
| 4 | The describe-stage worker logs cover 8,496 attempted descriptions counting a dev-run sanity-check document (1000_SKANSKA_AB_2020) processed alongside the subset; see Appendix F for reconciliation. |
| 5 | The full per-description LLM-judge annotations are released in llm_judge_results.json in the supplementary bundle. The residual of 17 of 8,153 (0.2%) consists of generic infographics and unreadable figures where the judge was unable to assign a bucket even with semantic interpretation. |
| 6 | Classified by parent-company headquarters (US); the entity (Bank of New York Mellon SA-NV) is Belgian-registered. |
Figure 1.
VL augmentation pipeline. Docling produces text-only Markdown and extracted images; Step3-VL-10B classifies and describes data-bearing images; descriptions are merged per-page into enriched Markdown.
Figure 1.
VL augmentation pipeline. Docling produces text-only Markdown and extracted images; Step3-VL-10B classifies and describes data-bearing images; descriptions are merged per-page into enriched Markdown.
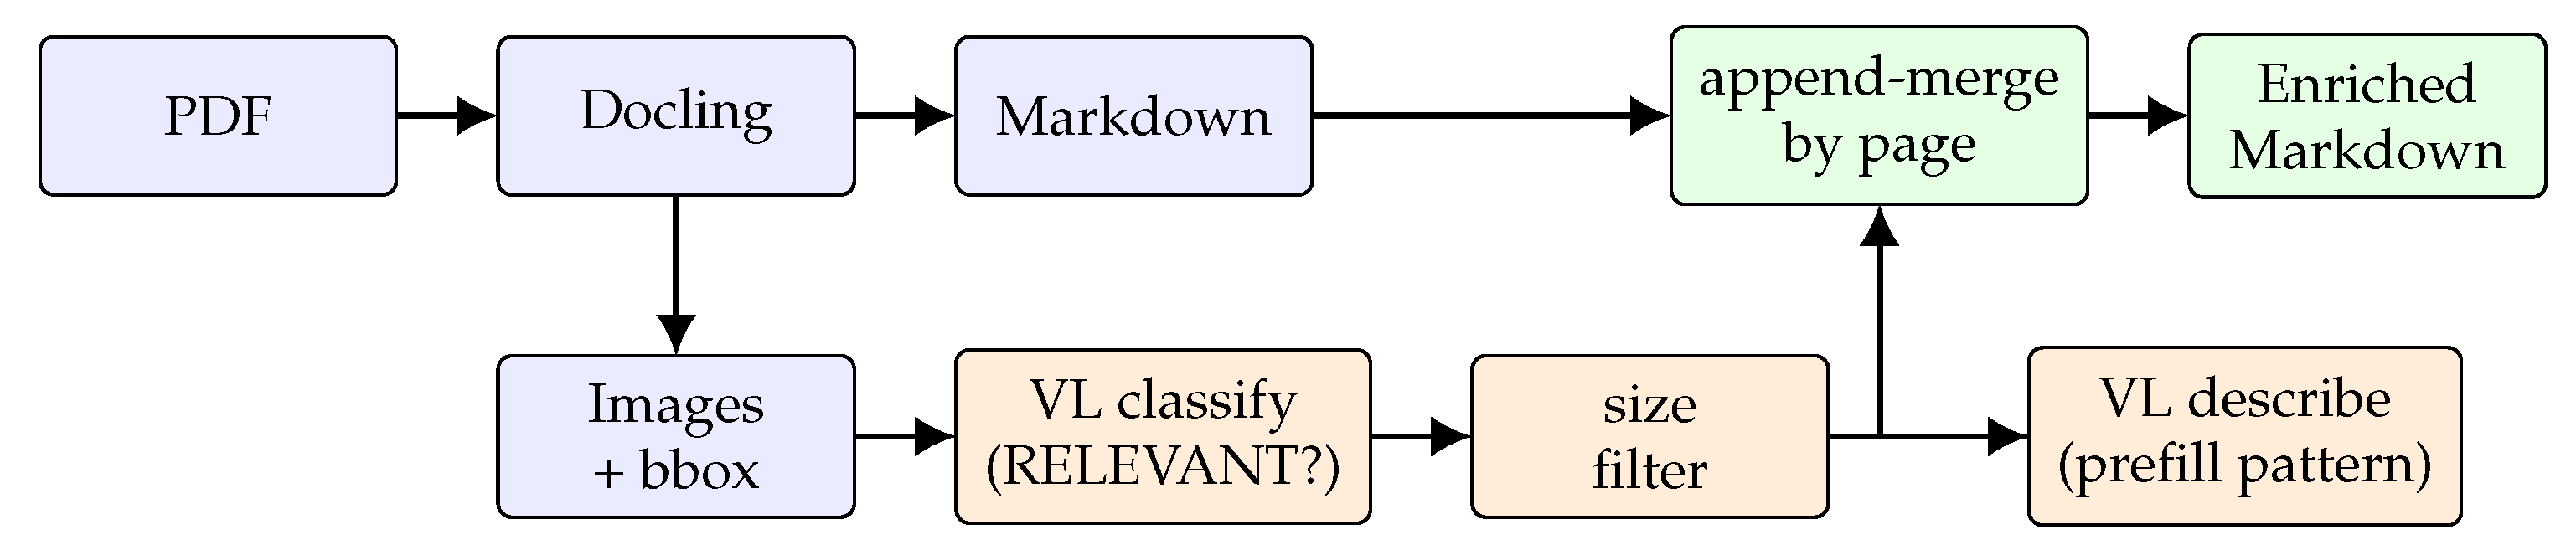
Figure 2.
Image-classification funnel on the 274-report subset. Numbers in parentheses are counts after the preceding step.
Figure 2.
Image-classification funnel on the 274-report subset. Numbers in parentheses are counts after the preceding step.
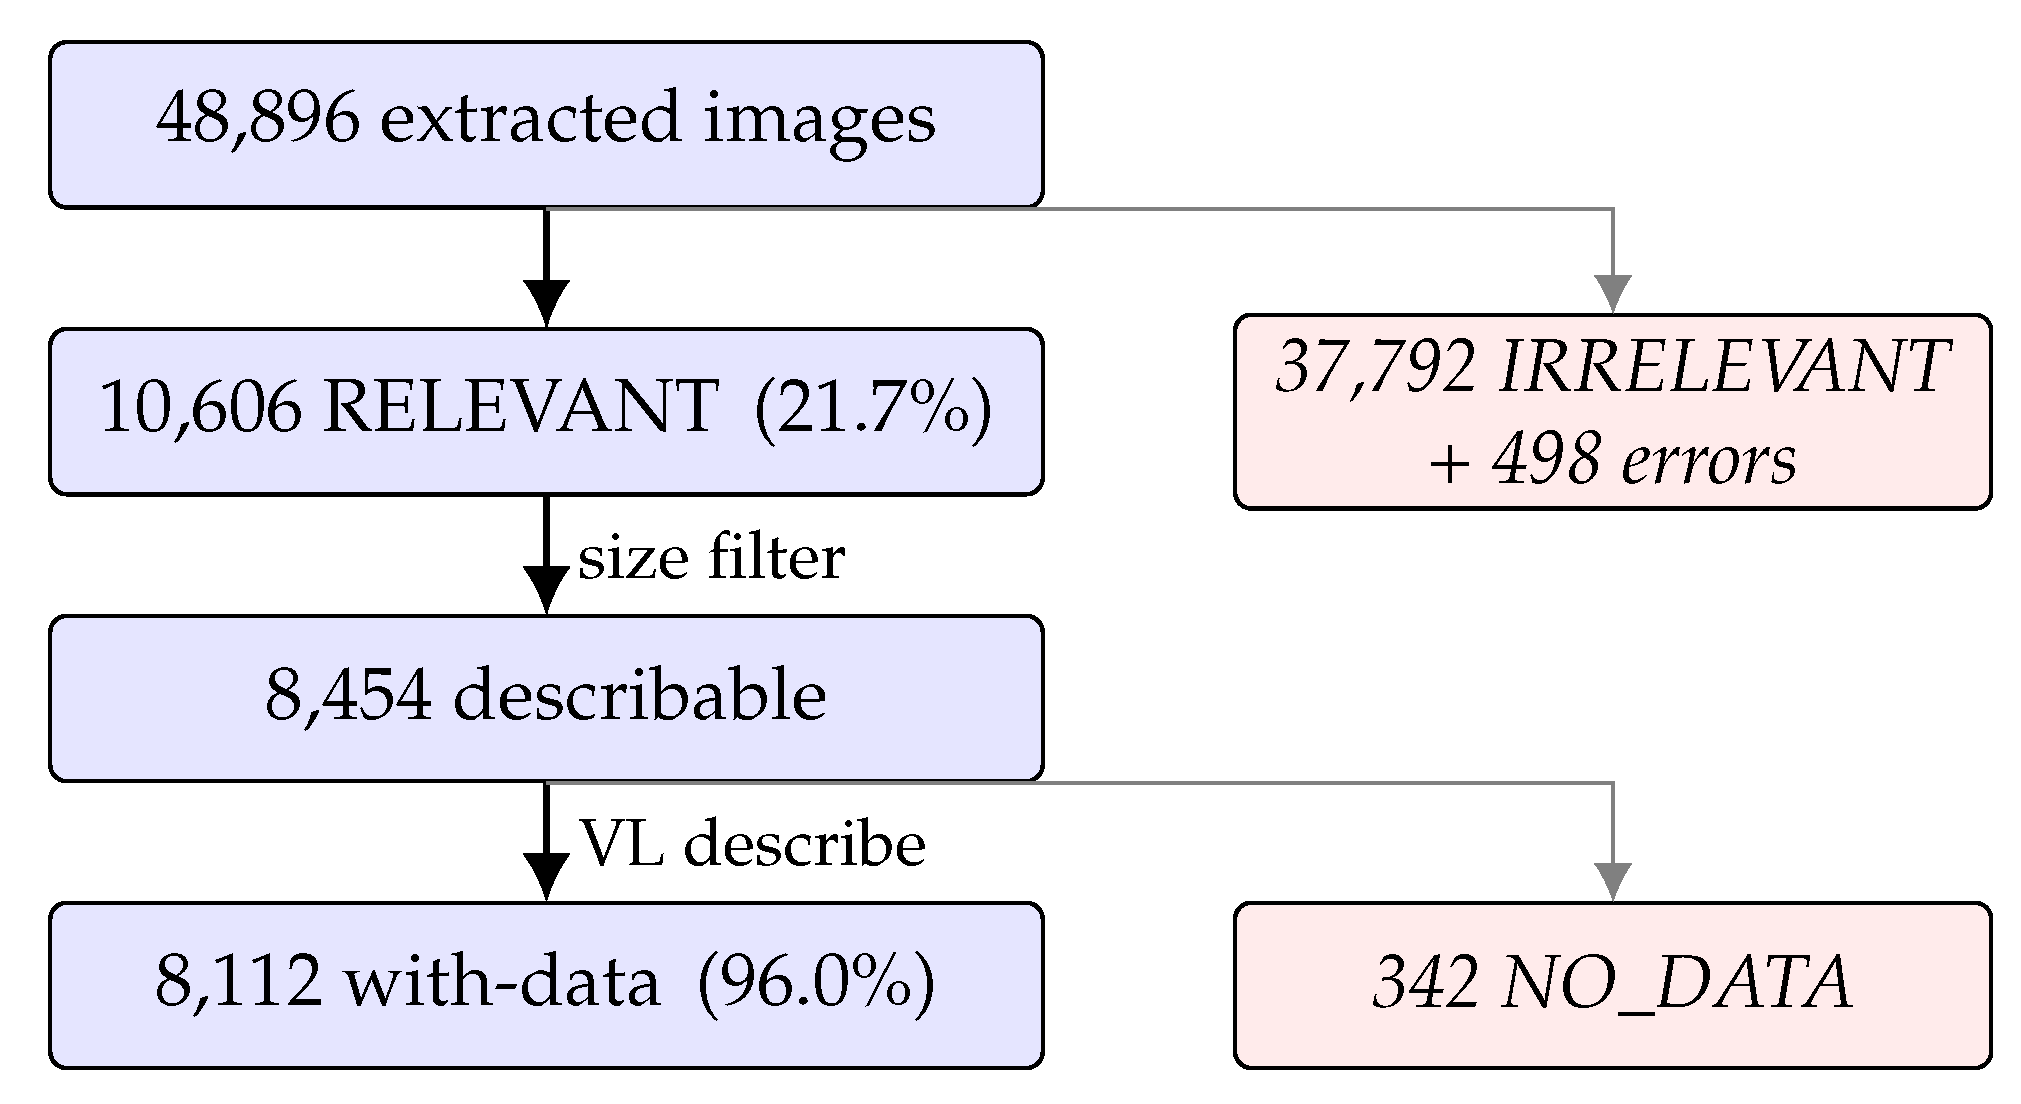
Figure 3.
KPI-bucket coverage of the 8,112 with-data descriptions. Bars reproduce the second column of Table 3.
Figure 3.
KPI-bucket coverage of the 8,112 with-data descriptions. Bars reproduce the second column of Table 3.
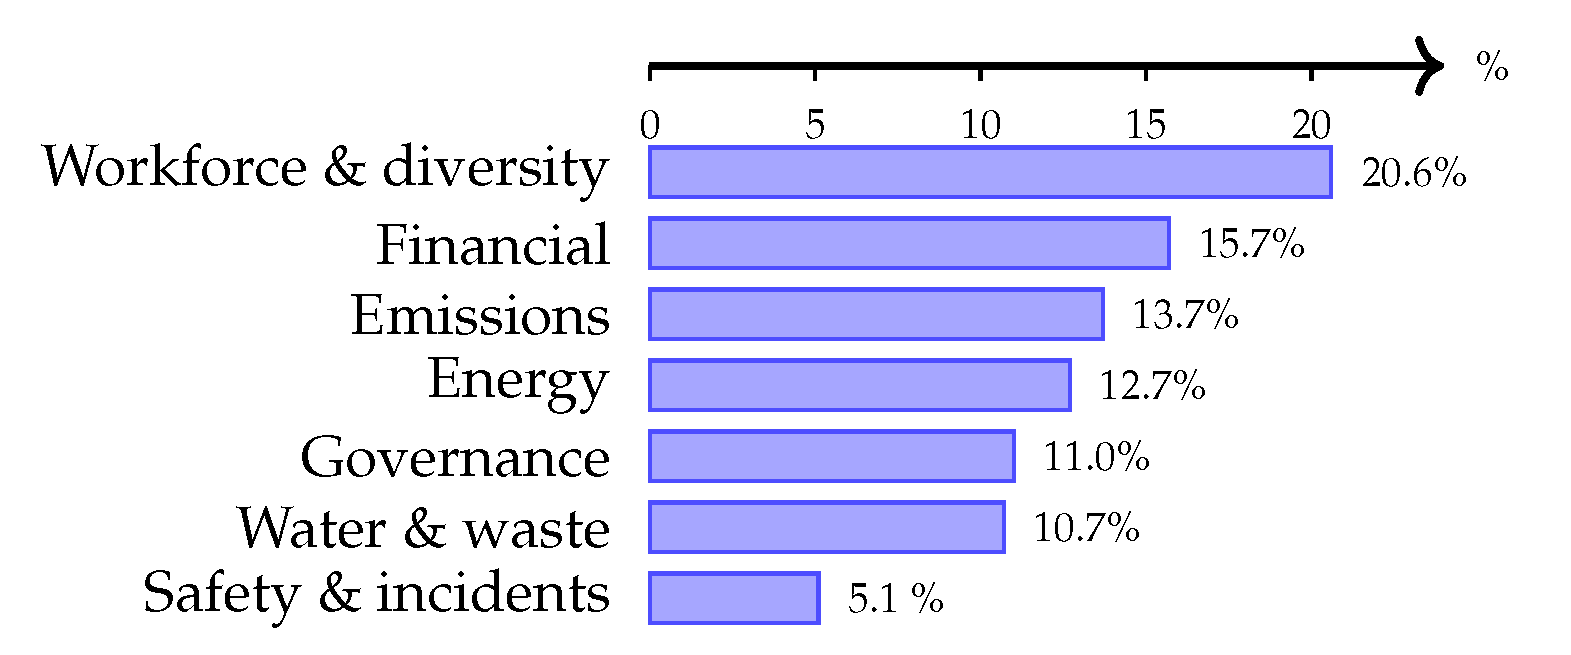
Table 1.
Overall comparison, 274-report subset. A = text-only Markdown; B = text+VL Markdown.
| Metric | A | B |
|---|---|---|
| Markdown size (MB) | 121.3 | 129.3 (+6.6%) |
| Numeric tokens | 731,241 | 847,914 (+16.0%) |
| Reports with | — | 267 of 274 |
| Median / report | — | +276 |
| KPI buckets hit (multi-label) | — | 7 of 7 |
| Residual (no-bucket)† | — | 44.9% |
| Truncation rate | n/a | 0 of 8,454 |
| Schema compliance* | n/a | 100% (8,112) |
| Mean inference s/image | n/a | 8.87 |
*Measured on the 8,112 successful descriptions (8,454 total attempts; 342 returned NO_DATA and have no structured body to check). See Section 5.3. †Keyword lower bound; LLM-as-judge (Gemma-3-4B) classifies 99.8% of descriptions into at least one KPI bucket (0.2% residual). See Table 2.
Table 2.
LLM-as-judge KPI-bucket coverage ( with-data descriptions). Keyword column reproduces Table 3 for reference.
Table 2.
LLM-as-judge KPI-bucket coverage ( with-data descriptions). Keyword column reproduces Table 3 for reference.
| Bucket | Keyword | LLM Judge | |
|---|---|---|---|
| Workforce / diversity | 20.6% | 51.3% | +30.7% |
| Financial | 15.7% | 66.7% | +51.0% |
| Emissions | 13.7% | 43.1% | +29.4% |
| Energy | 12.7% | 17.3% | +4.6% |
| Governance | 11.0% | 27.8% | +16.8% |
| Water and waste | 10.7% | 8.5% | –2.2% |
| Safety and incidents | 5.1% | 6.5% | +1.4% |
| Residual (no match) | 44.9% | 0.2% | –44.7% |
Table 3.
KPI-bucket coverage of recovered descriptions (multi-label, with-data descriptions).
| Bucket | Matches | Share | GRI series |
|---|---|---|---|
| Workforce / diversity | 1,674 | 20.6% | 401, 402, 404–6 |
| Financial | 1,276 | 15.7% | 201, 207 |
| Emissions | 1,111 | 13.7% | 305 |
| Energy | 1,031 | 12.7% | 302 |
| Governance | 893 | 11.0% | 2, 205 |
| Water and waste | 865 | 10.7% | 303, 306 |
| Safety and incidents | 411 | 5.1% | 403 |
| Residual (no bucket) | 3,639 | 44.9% | — |
Table 4.
Corpus-level impact of VL augmentation on 274 ESG reports.
| Metric | A | B | |
|---|---|---|---|
| Markdown size (MB) | 121.3 | 129.3 | +6.6% |
| Numeric tokens | 731,241 | 847,914 | +16.0% |
| Per-report distribution of added numbers | |||
| P25 numbers | — | +118 | — |
| Median numbers | — | +276 | — |
| Mean numbers | — | +426 | — |
| P75 numbers | — | +626 | — |
| P90 numbers | — | +1,007 | — |
| Per-report distribution of size growth | |||
| P25 size | — | +2.6% | — |
| Median size | — | +6.0% | — |
| Mean size | — | +13.1% | — |
| P75 size | — | +14.4% | — |
| P90 size | — | +29.2% | — |
| Max size | — | +162% | — |
Table 5.
End-to-end A/B comparison, 83 reports, 6 VL-targeted questions (VL02 excluded). Completeness scores (0–100) judged by Qwen3-4B.
Table 5.
End-to-end A/B comparison, 83 reports, 6 VL-targeted questions (VL02 excluded). Completeness scores (0–100) judged by Qwen3-4B.
| Question | A | B | ↑ | ↓ | |
|---|---|---|---|---|---|
| VL05 (composition) | 17.4 | 21.1 | +3.7 | 9 | 3 |
| VL07 (revenue/capex) | 24.0 | 25.2 | +1.2 | 7 | 6 |
| VL08 (GHG breakdown) | 11.1 | 18.0 | +6.9 | 16 | 8 |
| VL10 (regional employees) | 3.9 | 23.7 | +19.8 | 26 | 2 |
| VL11 (workforce cats.) | 10.8 | 15.8 | +5.1 | 15 | 8 |
| VL12 (patents/R&D) | 0.0 | 5.6 | +5.6 | 7 | 0 |
| Mean | 11.2 | 18.3 | +7.0 | 80 | 27 |
Table 6.
LLM-free validation of the end-to-end completeness scores. Both metrics agree on direction and relative ranking.
Table 6.
LLM-free validation of the end-to-end completeness scores. Both metrics agree on direction and relative ranking.
| LLM judge | Python | |||
|---|---|---|---|---|
| Question | Ranking | |||
| VL05 (composition) | +3.7 | 4 | +6.3 | |
| VL07 (revenue/capex) | +1.2 | 6 | +3.6 | |
| VL08 (GHG breakdown) | +6.9 | 2 | +14.3 | |
| VL10 (regional employees) | +19.8 | 1 | +28.1 | |
| VL11 (workforce cats.) | +5.1 | 5 | +1.8 | |
| VL12 (patents/R&D) | +5.6 | 3 | +6.3 | |
| Mean | +7.0 | — | +10.1 | |
Disclaimer/Publisher’s Note: The statements, opinions and data contained in all publications are solely those of the individual author(s) and contributor(s) and not of MDPI and/or the editor(s). MDPI and/or the editor(s) disclaim responsibility for any injury to people or property resulting from any ideas, methods, instructions or products referred to in the content. |
© 2026 by the authors. Licensee MDPI, Basel, Switzerland. This article is an open access article distributed under the terms and conditions of the Creative Commons Attribution (CC BY) license (http://creativecommons.org/licenses/by/4.0/).
Copyright: This open access article is published under a Creative Commons CC BY 4.0 license, which permit the free download, distribution, and reuse, provided that the author and preprint are cited in any reuse.