

Submitted:
21 September 2026
Posted:
22 September 2026
You are already at the latest version
Abstract
Background/Objectives: Frozen triage narratives may contain prognostic information not captured by urgency categories or vital signs. We evaluated their incremental value for hospital admission and subsequent critical outcomes among adults assigned Emergency Severity Index (ESI) levels 3-5. Methods: This single-center retrospective study used routine electronic records from 1 April 2025 to 30 June 2026. Models were developed using 51,735 visits (4852 admissions) in April-December 2025 and evaluated without refitting in 40,433 visits in January-June 2026. Hospital admission included accepted interhospital inpatient transfers. Separate models predicted index-hospital ICU transfer or death among completed, observable episodes, including 285 development events. ESI-only, structured, text-only and combined logistic models were compared using discrimination, calibration and patient-cluster bootstrap intervals. Grouped cross-validation and fixed model variants assessed overfitting and source-quality sensitivity. Results: Temporal evaluation included 3517 admissions (8.70%). Adding text increased admission AUROC from 0.763 to 0.835 (95% CI 0.828-0.841) and average precision from 0.246 to 0.340. The combined model had a calibration slope of 1.083 and observed-to-expected ratio of 0.982. Among 39,697 secondary-analysis visits, 177 had ICU transfer or death (0.446%); combined AUROC was 0.924 (95% CI 0.908-0.940) and average precision 0.076. Text gains persisted without the seven measured fields or their missingness indicators. Conclusions: Frozen triage text added predictive information in a later calendar period. Admission prediction estimates recorded disposition rather than medical necessity. Low critical-outcome precision, incomplete follow-up exclusions and single-center design preclude clinical deployment without further validation. No specific research funding or registration identifier was reported.
Keywords:
emergency department
; triage
; natural language processing
; hospital admission
; temporal evaluation
; calibration
; intensive care
; mortality
1. Introduction
Emergency department (ED) triage assigns urgency before the diagnostic assessment is complete, but patients within the same category can have different subsequent care requirements. Outcome-based electronic triage has identified risk variation within Emergency Severity Index (ESI) level 3 [1]. Previous studies have predicted hospital admission and critical outcomes from routinely collected triage information [2,3,4]. These are distinct questions: admission reflects a care disposition, whereas ICU transfer and in-hospital death indicate a critical hospital course. Neither endpoint alone establishes physiological deterioration after triage.
Triage narratives can record symptoms and circumstances that are incompletely represented by structured measurements. Disposition prediction from nursing triage notes is established [5], and combining structured data with free text has been evaluated across two hospitals [6]. A recent Journal of Clinical Medicine study developed a triage-level hospitalization model and evaluated it at another center [7]. The remaining question is therefore not whether text can predict admission in principle, but whether a strictly time-bounded narrative adds information in a specific target population and retains that information in a later period.
We evaluated frozen Polish-language triage records in adults assigned ESI levels 3-5. The primary objective was to quantify the incremental value of text for hospital admission, including accepted transfers for inpatient care. A separate secondary objective addressed subsequent index-hospital ICU transfer or death. We emphasized chronological separation, outcome-specific ascertainment, probability calibration and the workload associated with illustrative operating points.
2. Materials and Methods
2.1. Setting, Population and Study Design
This retrospective study used routinely collected records from the emergency department of the University Clinical Hospital in Poznań, Poland. The study period was 1 April 2025 through 30 June 2026. Eligible encounters involved patients aged at least 18 years, ESI levels 3-5, nonempty symptom or circumstances text in the finalized triage record, a recorded ED disposition and an ED discharge time. The unit of analysis was the ED visit. Repeat visits were retained; duplicated visit keys were checked before analysis. ESI levels 1-2 were outside the target population, and findings must not be generalized to those patients. No patient contact, additional procedure or clinical deployment occurred.
All eligible visits arriving in April-December 2025 formed the development period; January-June 2026 formed the temporal evaluation period. Every primary model, imputation statistic, scaling parameter and text vocabulary was fitted using development data only. The outcome hierarchy and calendar partition were revised during this retrospective project, and 2026 data had already been examined in earlier analyses. Consequently, this is not a prospectively registered or previously untouched confirmatory validation. Reporting was assessed against TRIPOD+AI [8]; the accompanying item-level map identifies both reported items and unresolved evidence requirements. Cohort construction is shown in Figure 1.
2.2. Predictor Timing and Provenance
The predictor boundary was completion of the first TOPSOR triage assessment. TOPSOR is Poland’s national system for managing patient service modes in emergency departments, established under the State Emergency Medical Services Act and implementing regulations [9,10,11]. The electronic triage card (KSM) is required to record the date and time of triage completion [12]. In the study implementation, the text and completion timestamp of the finalized first assessment cannot be edited. Reassessment (retriage) creates a separate assessment while preserving the first. The research exports supplied the first assessment for each visit; retriage assessments were excluded from the predictors. A published operational clarification from a TOPSOR representative at Lotnicze Pogotowie Ratunkowe (LPR) identifies retriage as the route for updating KSM data [13]. Later consultations, investigations, diagnoses and disposition decisions were separate records and were not used as predictors.
The triage-completion timestamp exists in the source database but was not included in the research export. The export also lacked a field-level edit history. Accordingly, this study used the first-assessment record boundary confirmed for the source implementation, without independently reconstructing each visit’s chronology from completion timestamps or database audit logs. These export limitations are distinct from the source system’s recording and preservation of the initial assessment.
Structured predictors were age, recorded sex, ambulance arrival, ESI category, pulse, systolic and diastolic blood pressure, oxygen saturation, temperature, pain score and respiratory rate. Sex and ambulance arrival were complete in the eligible cohorts. Diagnostic codes, laboratory values, disposition, destination ward and length of stay were used only for outcome construction or auditing and never entered the predictor matrix. Clinical history outside the frozen text fields was not included. Supplementary material describes the field boundary and preprocessing.
2.3. Outcomes and Observation Limits
The primary outcome was recorded hospital admission, defined by either transfer from the ED to an inpatient ward in the same hospital or referral/transfer to another hospital for further inpatient treatment. The investigators confirmed that the external-transfer code represented an agreed, targeted transfer after acceptance by the receiving institution. These two exact disposition codes, rather than the incompletely populated destination-ward field, defined positive labels. Other recorded dispositions were negative for this admission endpoint, including non-routine departures and ED death; the latter does not imply low clinical risk. A sensitivity analysis omitted non-routine departures and ED deaths. Completion of the subsequent inpatient stay was not required when the ED disposition was already known.
The secondary composite was transfer to a general ICU or death during the index hospital episode. ICU wards were identified from the source dictionary as A, OITP and OITS; cardiology intensive-care units were not automatically included. Transfers were extracted from the outgoing ward-transfer section using the transfer time, and direct ED-to-ICU disposition also counted. Deaths were obtained from the hospital death section, supplemented by the ED death disposition. Events were linked by canonical visit key and checked against the episode dates. The two components and their overlap were reported separately.
Predictors and outcomes were extracted algorithmically from their designated source fields. No additional human predictor rating or blinded chart adjudication of outcomes was performed. Outcome-derived fields were excluded from the predictor matrix. Investigator knowledge of the source workflow does not constitute blinded assessment of individual records.
The hospital-movement/death report ended at 30 June 2026 00:00. For secondary modeling, both development and evaluation cohorts therefore required a recorded hospital discharge at or before this cutoff and excluded external transfers, whose later outcomes in the receiving hospital were unavailable. Episodes with missing or later discharge times were not assumed to be event-free. The secondary analysis estimates risk among observable completed index episodes; this restriction can preferentially omit longer admissions near the cutoff. It is not complete follow-up of every visit in the primary cohort. Post-discharge deaths and events in other institutions were outside ascertainment.
2.4. Data Cleaning and Missing Values
Before model fitting, values outside broad technical plausibility ranges were set to missing, without attempting to reconstruct transcription errors: pulse 20-300/min, systolic pressure 40-300 mmHg, diastolic pressure 20-200 mmHg, oxygen saturation 30-100%, temperature 25-45 °C, respiratory rate 4-80/min and pain 0-10. These were analyst-defined quality-control bounds, not clinical safety thresholds. Invalid-value counts and all bounds are retained in the reproducibility outputs. Imputation used development-set medians, with indicator variables for predictors having missing values during fitting. Scaling parameters were also estimated from development data. Models were evaluated on the same eligible visits within each endpoint.
Missingness was reported by calendar month and outcome rather than assumed to be completely at random or at random. Visits with no narrative in either frozen text field were outside the primary text-evaluable cohort, including the structured comparators. Their admission frequency and basic characteristics were summarized separately. This makes the incremental comparison paired but limits applicability to settings where triage text is available. Unavailable text should not be interpreted as a low-risk prediction.
The structured comparator represents routinely available recorded triage data, not a complete physiological assessment. Median replacement permits computation but does not recover unrecorded physiology. Missingness indicators after range cleaning reflect both absent values and implausible entries set to missing. Their predictive contribution was examined separately from the recorded values in the explanatory analysis below.
Supplementary Tables S1 and S2 detail cohort accounting and dispositions. Monthly availability, quality-control rules, outcome-specific missingness and text-selection comparisons are provided in Supplementary Tables S3-S6, respectively.
2.5. Text Representation and Models
Symptom and circumstances fields were concatenated, lowercased, accent-folded and whitespace-normalized. A fixed regular expression removed common disposition-related phrases and ward references; ten fixed Polish workflow terms were also excluded during vectorization. Word unigrams and bigrams were represented by term frequency-inverse document frequency, with sublinear term frequency, minimum document frequency 10, maximum document frequency 98% and at most 20,000 features. The default token pattern retained alphanumeric tokens of at least two characters. No stemming, spelling correction, learned language model or post-triage text expansion was used. Exact regular expressions and settings are supplied in the analysis code.
The lexical representation was used as a transparent, computationally modest reference for estimating incremental text information. It does not explicitly resolve negation, temporality or longer contextual dependencies. No superiority or equivalence to a Polish-language contextual encoder was assumed or tested.
Separate L2-penalized logistic regressions were fitted for each endpoint with ESI only, structured predictors, text only, or structured predictors plus text. ESI was encoded categorically in the logistic models. Regularization C=0.5, the liblinear solver, maximum 2000 iterations and intercept scaling 100 were fixed for this analysis, without optimization on 2026 outcomes. No oversampling or class weighting was used. A histogram gradient-boosting model using structured data provided a nonlinear comparator. Additional combined models used more extensive workflow-language removal or the symptom field alone. These are robustness analyses, not independent evidence of input timestamps.
2.6. Evaluation and Uncertainty
We measured AUROC, average precision (reported as AUPRC), Brier score, calibration intercept and slope, observed-to-expected event ratio (O/E), and expected calibration error (ECE). Calibration was assessed on predicted probabilities without refitting the primary model. ECE used up to ten approximately equal-frequency bins with ties kept together; ESI-only predictions therefore formed three groups. Discrimination cannot substitute for calibration [14], and precision-recall analysis is informative when outcomes are uncommon [15].
Ninety-five percent confidence intervals used 500 paired nonparametric bootstrap samples of patients, preserving all linked visits of each sampled patient. Visits with no patient linkage formed singleton clusters. The same resampled patients were used to estimate combined-minus-structured differences. These intervals condition on the fitted development model and do not incorporate model-development uncertainty. Subgroup analyses by age, sex and ESI used 300 patient-cluster bootstrap replicates when at least ten events were present. Model training itself was not repeated within these evaluation bootstraps. ECE bin boundaries were fixed to the original evaluation predictions during resampling.
Calendar-month performance, the first 2026 visit of each linkable patient absent from the eligible development cohort, exclusion of external transfers, and exclusion of non-routine dispositions were evaluated as sensitivity analyses. In a separate model-updating experiment only, logistic recalibration was fitted to January-March 2026 predictions and evaluated in April-June 2026. This experiment was not pooled into the frozen-model primary result.
Illustrative thresholds were selected from five-fold patient-grouped out-of-fold predictions within development data to target 80%, 90% and 95% sensitivity, then applied unchanged to 2026. We reported sensitivity, specificity, positive and negative predictive values, confusion counts and flags per 1000 visits. These are exploratory workload descriptions, not recommended admission or alert thresholds. Cohort size reflected all available eligible records rather than a prospective sample-size calculation. Event counts, achieved confidence intervals and development diagnostics describe the resulting precision and stability; they do not establish that every subgroup or decision threshold is sufficiently supported [16].
2.7. Additional Robustness and Decision Analyses
We compared apparent development performance, pooled five-fold stratified patient-grouped out-of-fold performance and frozen temporal performance for structured and combined models. Each fold refitted imputation, scaling, vocabulary and regression using only its training records. Available patient groups were disjoint, but visits without linkage remained singleton groups. Fixed combined-model sensitivity variants used stronger regularization (C=0.1) or a 5000-term cap; separate structured and combined variants omitted pulse and diastolic pressure, the two fields with the most invalid source values. Every variant was reported, without choosing a replacement model from 2026 results. Actual fitted dimensions were counted. These supplementary analyses were specified post hoc after inspection of the primary results.
Exploratory decision curves considered hypothetical actions by ED clinicians or flow coordinators: earlier inpatient-bed coordination for admission risk, or prioritized clinician reassessment for critical-outcome risk. Net benefit was TP/N minus FP/N multiplied by pt/(1-pt), where pt is an assumed threshold [17]. Analyst-defined ranges were 1-30% and 0.1-2%, respectively; they were not clinically elicited, optimized or recommended. We compared model-based flagging with flag-all and flag-none strategies. Five hundred paired patient-cluster bootstrap replicates supplied pointwise intervals, conditional on the fitted models. No intervention effect, resource saving or improvement in patient outcomes was measured.
A local runtime benchmark measured 500 sequential single-record calls per combined model after 25 warm-up calls. In-memory text normalization, fitted preprocessing and prediction were timed. Database retrieval, network transport, authentication, concurrency and production queueing were excluded. The shared CPU environment, software versions and mean, median and tail latencies were recorded. Per-request memory and production integration were not assessed. The supplementary appendix reports the diagnostics, conditional decision curves and runtime specification in Tables S15-S19.
2.8. Contributions of Recorded Values and Missingness
A further post-hoc explanatory analysis used age, recorded sex, ESI and ambulance arrival as core predictors. These were complete in both eligible cohorts. Five fixed variants used core predictors alone; core plus missingness indicators for the seven measured triage fields; core plus median-imputed values without explicit indicators; core plus text without those measured fields or their indicators; and core plus missingness indicators and text. The original structured and combined models remained the reference models. All new models retained the original L2 penalty (C=0.5), ESI encoding and text specification, with medians, scaling, vocabulary and coefficients fitted only in 2025. No new thresholds were estimated, and no model was selected or replaced using 2026 performance.
Five hundred paired patient-cluster bootstrap samples described conditional uncertainty for the fixed models and prespecified contrasts within this additional analysis. These intervals were not adjusted for multiple exploratory comparisons or model-refitting uncertainty. The 2026 outcomes had already been examined in previous analyses. Removing explicit missingness indicators does not eliminate all recording information, because median replacement and correlated predictors can still reveal missingness. The contrasts are predictive comparisons, not a causal decomposition of physiological and documentation signals. Full results, paired differences and missingness before and after range cleaning are provided in Supplementary Tables S20-S22.
3. Results
3.1. Cohort and Data Availability
The study-period exports contained 112,315 visits. Of 97,647 adult ESI 3-5 visits, 5479 lacked both frozen text fields. The primary analysis included 51,735 development visits and 40,433 temporal-evaluation visits, all with an ED disposition. Admission occurred in 4852 development visits (9.38%) and 3517 evaluation visits (8.70%). Accepted external transfers contributed 384 and 241 positive labels, respectively. No duplicate canonical visit keys were detected. Table 1 summarizes the cohort; source flow, dispositions and missingness are detailed in the supplementary material.
Text was absent in 5405 of 57,140 development-period adult ESI 3-5 visits (9.46%) and 74 of 40,507 evaluation-period visits (0.18%). The admission proportions among visits without text were 9.31% and 13.51%, respectively; the latter estimate was based on only 74 visits. Pulse was available after quality control in 31.2% of development and 47.8% of evaluation visits. Respiratory rate was available in 4.2% and 6.0%. Thus, recorded measurements and missingness patterns differed substantially across periods, despite similar median ages.
Patient linkage was unavailable for 22,926 eligible development visits (44.3%) but only five evaluation visits. Training-fold grouping and the sensitivity analysis of previously unobserved patients are therefore incomplete protections against repeat-patient dependence in the development period. Evaluation bootstrap clustering was much more complete.
3.2. Primary Admission Prediction
The combined model achieved AUROC 0.835 (0.828-0.841) and AUPRC 0.340 (0.325-0.357), compared with 0.763 and 0.246 for structured predictors alone. The paired AUROC increment was 0.072 (95% CI 0.065-0.077) and the AUPRC increment was 0.094 (95% CI 0.083-0.106). The text-only AUROC was 0.800, while ESI alone achieved 0.681. Table 2 and Figure 2 present the discrimination results for both endpoints.
Full calibration results and paired incremental comparisons are presented in Supplementary Tables S7 and S8, respectively.
For admission, the combined-model calibration intercept was 0.125, slope 1.083, O/E 0.982 and ECE 0.00621. Its Brier score was lower than that of the structured model (0.06696 versus 0.07242), but ECE was not lower (0.00621 versus 0.00429); improvements in ranking therefore did not translate uniformly across every calibration summary. Calibration curves are shown in Figure 3.
3.3. Secondary Critical-Outcome Prediction
After excluding external transfers and episodes without complete index-hospital observation by the source cutoff, secondary cohorts contained 51,276 development visits with 285 events and 39,697 evaluation visits with 177 events (0.446%). Evaluation events comprised 54 ICU transfers and 154 deaths, with 31 visits experiencing both. Of the primary evaluation cohort, 497 episodes had a missing discharge time or continued beyond the ascertainment cutoff; a further 241 had external-transfer dispositions, with two visits meeting both exclusions. These visits were not treated as critical-outcome negatives.
In the secondary evaluation cohort, observation from arrival to the end of the index hospital episode lasted a median of 2.75 hours (IQR 1.47-4.58), reflecting the predominance of ED-only visits. Among 3,056 internally admitted completed episodes, the median was 5.95 days (IQR 3.09-10.01). These durations do not include surveillance after discharge (Supplementary Table S18).
Adding text increased secondary AUROC from 0.909 to 0.924 (95% CI 0.908-0.940) and AUPRC from 0.054 to 0.076. Paired increments were 0.015 (95% CI 0.010-0.020) for AUROC and 0.022 (95% CI 0.010-0.036) for AUPRC. The combined calibration slope was 0.964, O/E 0.937 and ECE 0.00059. The high AUROC coexisted with modest precision for this uncommon endpoint.
3.4. Robustness and Calendar Variation
Outcome-specific subgroup results appear in Supplementary Tables S9 and S10, and the sensitivity analyses in Supplementary Table S11.
Admission discrimination persisted with stricter workflow-language removal (AUROC 0.836) and symptom-only text (0.836). In 29,794 first evaluation-period visits from linkable patients not observed in the eligible development cohort, combined AUROC was 0.837. The nonlinear structured comparator achieved admission AUROC 0.768 and AUPRC 0.258; for ICU/death, it achieved 0.913 and 0.072. These checks support added text information beyond the selected structured baselines but do not constitute a comprehensive comparison with all modeling approaches.
Combined admission AUROC ranged from 0.824 to 0.848 across evaluation months; O/E ranged from 0.936 to 1.046. Critical-outcome O/E ranged from 0.510 to 1.350, based on 13-44 events per month. Figure 4 shows observed and predicted monthly risks. Age-, sex- and ESI-specific results and the separate Q1-to-Q2 recalibration experiment are reported in the supplementary material; small event counts constrain subgroup interpretation.
Supplementary Table S12 reports monthly combined-model results; Supplementary Table S13 separates frozen and Q1-recalibrated Q2 performance.
3.5. Illustrative Operating Points
Table 3 summarizes the performance of the development-selected operating points in the temporal evaluation cohort.
All 80%, 90% and 95% development-target operating points and their evaluation confusion counts are given in Supplementary Table S14.
The combined admission threshold yielded 88.8% sensitivity, 17.3% positive predictive value and 448 flags per 1000 evaluation visits. For ICU/death, the corresponding development-selected operating point yielded 87.0% sensitivity, 2.32% positive predictive value, 167 flags per 1000 and 23 missed events. There were 154 true-positive and 6,481 false-positive indications, or 42.1 false positives per true positive. Development targets were not guaranteed to persist in the later period. These results illustrate workload and residual risk rather than justify a clinical alert policy.
3.6. Model Stability and Source-Quality Sensitivity
Table 4 compares apparent, grouped out-of-fold and temporal performance.
Apparent combined-model performance exceeded grouped out-of-fold performance for both outcomes. Admission AUROC/AUPRC fell from 0.868/0.434 to 0.826/0.335; critical-outcome values fell from 0.949/0.174 to 0.923/0.095. Frozen temporal AUROCs were close to the out-of-fold estimates, but critical-outcome AUPRC was lower at 0.076. Actual text vocabularies contained 9084 and 8987 terms, respectively; 20,000 was a cap rather than the fitted dimension. With only 285 development critical events, these diagnostics do not eliminate high-dimensional model instability (Supplementary Table S15).
Omitting pulse and diastolic pressure yielded combined admission AUROC/AUPRC of 0.833/0.336 and critical-outcome values of 0.924/0.075. A 5000-term cap yielded 0.833/0.336 and 0.925/0.076. Stronger regularization reduced the corresponding values to 0.817/0.309 and 0.914/0.059. These fixed comparisons show limited sensitivity to the two anomalous fields and vocabulary reduction within this cohort; they do not repair source data, establish optimal regularization or replace external evaluation. Full results are in Supplementary Table S16.
3.7. Conditional Decision Analysis and Offline Runtime
Figure 5 and Supplementary Table S17 show conditional net benefit under the stated hypothetical actions. At an assumed 10% admission threshold, adding text increased net benefit by 10.70 per 1000 visits (pointwise 95% CI 9.29-12.04). For ICU/death, the increment at a 0.5% threshold was 0.062 per 1000 (95% CI -0.014 to 0.159), whereas at 1% it was 0.213 (0.045-0.385). The critical-outcome advantage was therefore not distinguishable from zero at every illustrated threshold. These weighted true-positive equivalents are not observed prevented deaths, reduced admissions or saved beds.
In the warmed offline benchmark, mean single-record computation took 3.31 ms for admission and 3.35 ms for ICU/death; 95th percentiles were 4.10 and 4.69 ms. This is a local function measurement, not end-to-end hospital latency. Environment and timing details are in Supplementary Table S18. The actual Q1 updating coefficients, distinct from Q2 calibration estimates, are provided in Supplementary Table S19.
3.8. Recorded Values and Missingness Indicators
Table 5 compares temporal discrimination across the seven predictor sets.
Adding missingness indicators alone changed core-model admission AUROC from 0.752 to 0.754; ICU/death AUROC changed from 0.896 to 0.892. Adding text without the measured fields or their indicators increased AUROC by 0.080 (95% CI 0.073-0.086) for admission and 0.024 (0.019-0.030) for ICU/death. Thus, missingness indicators alone did not explain the incremental text signal (Supplementary Table S21).
The full combined ICU/death model exceeded the core-plus-text model by 0.0037 in AUROC, but the paired interval included zero (95% CI -0.0058 to 0.0117). This does not establish equivalence or prove that the measured fields are unnecessary. Text can itself contain physiological information and encode documentation practices. Before/after-cleaning counts in Supplementary Table S22 distinguish absent parsed values from entries set to missing by the range rules; they do not independently audit original source cells.
4. Discussion
4.1. Principal Findings and Contribution
In this later-period evaluation of adult ESI 3-5 visits, frozen triage text added information to routinely available structured data for both outcomes. The admission AUROC increment of 0.072 was accompanied by an AUPRC increment of 0.094. The critical-outcome increment was smaller but remained positive in paired bootstrap intervals. The central contribution is the evaluation of the first completed TOPSOR triage assessment, with explicit exclusion of retriage and subsequent documentation, in a Polish-language cohort, with all of 2026 H1 reserved from primary model fitting and with explicit separation of disposition from critical-outcome ascertainment.
The explanatory comparison addresses a specific alternative interpretation: text gains persisted when all seven measured fields and their missingness indicators were omitted. This makes missingness indicators alone an insufficient explanation for the observed increment. It does not establish that the structured comparator captured complete physiology or that documentation behavior contributed no signal. The lexical reference also leaves comparative performance against contextual language models unresolved; its utility here is to quantify an incremental association with a fully specified representation.
This work extends established admission and text-based disposition prediction rather than introducing those tasks for the first time [2,5,6]. Previous studies have considered hospitalization and critical care separately [3,4], while outcome-based triage models have differentiated risk within conventional urgency categories [1]. The recent JCM hospitalization study underscores the importance of a clinically interpretable target and external evaluation [7]. Our temporal evaluation addresses calendar change but does not replace the geographic validation performed in other studies. Differences in populations, language, endpoint definition and event frequency prohibit claims of superiority based on cross-study AUROC values.
4.2. Clinical Interpretation
Hospital admission is an observed decision influenced by clinical needs, specialist pathways, available capacity and local practice. A model trained on that decision does not establish that admission was medically necessary or that a negative prediction supports safe discharge. Including accepted inpatient transfers avoids coding known inpatient dispositions as negatives merely because the receiving ward is outside the hospital. However, the resulting model still learns a local disposition process, not a universal need-for-hospitalization construct.
For the critical endpoint, the low event prevalence limits positive predictive value despite strong discrimination. At the illustrative operating point, most flagged patients did not experience the composite, and some events were missed. A future application would need a specific response, acceptable workload, prospective silent evaluation and clinical-impact testing. We do not recommend a probability threshold for admission, discharge or escalation.
The hypothetical decision-curve actions make the assumptions behind potential use explicit: an ED clinician could prioritize reassessment, while a flow coordinator could prepare an inpatient pathway. The curves quantify tradeoffs only if these actions and their relative costs are accepted. They cannot establish that the actions improve outcomes or that recorded admission was appropriate. Missing or non-finalized triage input would require routine clinical assessment without a model output. The offline benchmark suggests that computation itself can be brief, but leaves EHR availability, interface design, concurrent load and response time untested. Prehospital ambulance use was not evaluated; ambulance arrival was only an ED predictor.
The calibration results also argue against a single performance headline. Admission discrimination and Brier score improved with text, whereas its ECE was slightly higher than the structured comparator. Small ECE values for the rare critical endpoint partly reflect the low absolute risk scale and should be read alongside calibration slope, O/E and precision [14,15]. Model updating on Q1 followed by Q2 evaluation is informative as a separate experiment, but cannot be presented as performance of a model that never used 2026 outcomes.
The low positive predictive value for ICU/death is consequential despite its strong ranking performance. False-positive indications refer to absence of the specified composite; they do not prove that reassessment would be unnecessary. Equally, potential value cannot be assigned to those indications without studying a defined response. Alert fatigue, clinician behavior under time pressure and patient benefit were not evaluated. No claim of clinical readiness follows from AUROC, average precision or the conditional decision curves.
4.3. Limitations
First, this is a single-center retrospective study with no external geographic validation. The model may capture local language, documentation and referral patterns. Geographic validation is required before broad or commercial use. ESI 1-2 patients, children and visits without narrative text were excluded; applicability outside the analyzed cohort is unknown. The marked change in text availability and structured-variable missingness suggests that documentation practices are part of the learned signal. Median imputation with missingness indicators does not identify the mechanism of missing data or remove selection bias.
Second, the research export did not include the immutable triage-completion timestamps retained in the source database or the assessment history needed for an independent per-record audit. The regulatory documentation requirements and published TOPSOR operational clarification support the described record boundary, but they do not independently verify the mapping of every exported row to its first assessment. No source-log audit was performed. Text masking checks cannot prove chronology. Referral, specialty or prior-investigation language may represent information already known at arrival and local care pathways. Broad plausibility cleaning prevented gross numeric errors from entering models but did not reconstruct the true values and may have removed extreme genuine measurements.
Third, critical-outcome follow-up was incomplete for external transfers and for episodes extending beyond the hospital-event report. Restricting this analysis to completed episodes changes the estimand and can preferentially omit long stays near the cutoff. ICU transfer depends on availability and clinical decisions, and in-hospital death can occur long after presentation. Without adjudication, the composite cannot distinguish deterioration after triage from severe illness already present. Cardiac intensive-care units were not included in the general-ICU definition. No outcomes after discharge or at another institution were available.
Fourth, many development visits lacked patient linkage. Grouped cross-validation and the analysis of previously unobserved patients cannot fully eliminate repeated-patient overlap. In contrast, linkage in temporal evaluation was nearly complete, allowing a more reliable clustered uncertainty analysis. Bootstrap intervals condition on the fitted model, and subgroup intervals remain imprecise when events are sparse. Higher apparent than out-of-fold performance is consistent with optimism, although this descriptive gap also reflects smaller training samples within folds. Vocabulary reduction and stronger regularization checks do not quantify all model-development uncertainty. We did not undertake exhaustive algorithm comparison, formal sample-size planning, multicenter transportability testing or assessment of end-to-end implementation latency.
Age-, recorded-sex- and ESI-stratified analyses describe performance heterogeneity but are not a comprehensive fairness audit. Ethnicity, socioeconomic circumstances and language proficiency were not available for this assessment; small subgroup event counts also limit inference. The training and evaluation labels reflect local practice and may reproduce inequities in that practice. No equalized error-rate policy, stakeholder-defined acceptable disparity or effect of model use on disparities was evaluated.
Finally, the revised outcome hierarchy and use of the full available 2026 half-year followed previous examination of these data. The present analysis is a transparent retrospective redesign, not a newly untouched confirmatory experiment. Further validation should use newly accrued or geographically separate records with complete outcome follow-up and documented predictor timestamps.
5. Conclusions
Frozen triage narratives added predictive information for recorded hospital admission and for a separately ascertained critical hospital course among adults with ESI levels 3-5. The incremental signal persisted without measured triage fields or their missingness indicators. Development on April-December 2025 data and evaluation throughout January-June 2026 preserved the primary chronological fitting boundary. These single-center results support prospective and external evaluation; they do not establish safe autonomous disposition decisions or immediate clinical alerts.
Supplementary Materials
The following supporting information can be downloaded at the website of this paper posted on Preprints.org. Supplementary Appendix with cohort, quality-control, preprocessing, calibration, sensitivity, subgroup, operating-point, model-stability, decision-curve, runtime and predictor-set comparison results (Tables S1-S22); item-level TRIPOD+AI reporting map; reproducibility archive with executable code, aggregate outputs and scientific figures. Patient-level records and original text are excluded.
Protocol and Registration
No prospectively registered protocol or public protocol identifier was reported for this retrospective analysis. Dated code and analysis specifications document the executed methods and later additions; they are not a preregistration. Patient and Public Involvement: No patient or public involvement in study design, conduct, interpretation or dissemination was reported.
Author Contributions
P.K., conceptualization, methodology, software, validation, formal analysis, investigation, data curation, resources, visualization, writing-original draft, writing-review and editing, supervision and project administration; J.Ż.-K., data curation, validation and writing-review and editing; T.K., data curation, validation, supervision and writing-review and editing. All authors have read and agreed to the published version of the manuscript.
Funding
This research received no external funding.
Institutional Review Board Statement
Ethics committee approval was not required under Articles 21 and 29 of the Polish Act of 5 December 1996 on the Professions of Physician and Dentist, because this study was a retrospective, non-interventional analysis of routinely collected medical records and did not constitute a medical experiment [18]. No additional diagnostic or therapeutic procedures were performed for research purposes, and no patient recruitment, contact or changes to care occurred. Pseudonymized data were processed under institutional authorization.
Informed Consent Statement
Individual informed consent was not required for this retrospective secondary analysis of routinely collected pseudonymized clinical records. No additional patient contact or procedures were undertaken.
Data Availability Statement
Patient-level data and original triage notes are not publicly available because they contain sensitive health information under institutional control. Access requests may be considered by the institution subject to authorization and applicable data-protection and ethics requirements. Aggregate outputs and analysis code are supplied as Supplementary Materials; trained model objects containing the full text vocabulary are not publicly distributed.
Acknowledgments
During preparation of this manuscript, the authors used OpenAI ChatGPT Work with Codex for English language verification, analysis programming, source inspection, automated consistency checks, and figure and table preparation. Numerical results were generated by executable local analysis. The authors reviewed and edited the resulting material, approved the manuscript, and take full responsibility for its content.
Conflicts of Interest
The authors declare no conflicts of interest.
Clinical trial number
Not applicable.
References
- Levin, S.; Toerper, M.; Hamrock, E.; Hinson, J.S.; Barnes, S.; Gardner, H.; Dugas, A.; Linton, B.; Kirsch, T.; Kelen, G. Machine-Learning-Based Electronic Triage More Accurately Differentiates Patients With Respect to Clinical Outcomes Compared With the Emergency Severity Index. Ann. Emerg. Med. 2018, 71, 565–574.e2. [Google Scholar] [CrossRef] [PubMed]
- Hong, W.S.; Haimovich, A.D.; Taylor, R.A. Predicting hospital admission at emergency department triage using machine learning. PLoS ONE 2018, 13, e0201016. [Google Scholar] [CrossRef] [PubMed]
- Raita, Y.; Goto, T.; Faridi, M.K.; Brown, D.F.M.; Camargo, C.A., Jr.; Hasegawa, K. Emergency department triage prediction of clinical outcomes using machine learning models. Crit. Care 2019, 23, 64. [Google Scholar] [CrossRef] [PubMed]
- Tschoellitsch, T.; Seidl, P.; Böck, C.; Maletzky, A.; Moser, P.; Thumfart, S.; Giretzlehner, M.; Hochreiter, S.; Meier, J. Using emergency department triage for machine learning-based admission and mortality prediction. Eur. J. Emerg. Med. 2023, 30, 408–416. [Google Scholar] [CrossRef] [PubMed]
- Sterling, N.W.; Patzer, R.E.; Di, M.; Schrager, J.D. Prediction of emergency department patient disposition based on natural language processing of triage notes. Int. J. Med. Inform. 2019, 129, 184–188. [Google Scholar] [CrossRef] [PubMed]
- Chang, Y.-H.; Lin, Y.-C.; Huang, F.-W.; Chen, D.-M.; Chung, Y.-T.; Chen, W.-K.; Wang, C.C.N. Using machine learning and natural language processing in triage for prediction of clinical disposition in the emergency department. BMC Emerg. Med. 2024, 24, 237. [Google Scholar] [CrossRef] [PubMed]
- Trotzky, D.; Preisler, Y.; Amoyal, A.; Pachys, G.; Mosery, J.; Cohen, A.; Avisar, S.; Ziv Baran, T. Development of a Triage-Level Predictive Model for Hospitalization in the Emergency Department. J. Clin. Med. 2026, 15, 1901. [Google Scholar] [CrossRef] [PubMed]
- Collins, G.S.; Moons, K.G.M.; Dhiman, P.; Riley, R.D.; Beam, A.L.; Van Calster, B.; Ghassemi, M.; Liu, X.; Reitsma, J.B.; van Smeden, M.; et al. TRIPOD+AI statement: updated guidance for reporting clinical prediction models that use regression or machine learning methods. BMJ 2024, 385, e078378. [Google Scholar] [CrossRef] [PubMed]
- Republic of Poland. Act of 8 September 2006 on State Emergency Medical Services. Consolidated text, Journal of Laws 2026, item 141, Article 33a. Available online: https://eli.gov.pl/eli/DU/2026/141/ogl (accessed on 17 September 2026).
- Minister of Health, Republic of Poland. Regulation of 27 June 2019 on the Hospital Emergency Department. Consolidated text, Journal of Laws 2025, item 1646, Section 6. Available online: https://eli.gov.pl/eli/DU/2025/1646/ogl (accessed on 17 September 2026).
- Minister of Health; Republic of Poland. Regulation of 30 June 2021 on the System Managing Patient Service Modes in the Hospital Emergency Department. Journal of Laws 2021, item 1182. Available online: https://eli.gov.pl/eli/DU/2021/1182/ogl (accessed on 17 September 2026).
- Minister of Health; Republic of Poland. Regulation of 10 August 2021 Amending the Regulation on the Types, Scope and Templates of Medical Documentation and the Method of Its Processing. Journal of Laws 2021, item 1468; introducing Section 20a on the electronic triage card. Available online: https://eli.gov.pl/eli/DU/2021/1468/ogl (accessed on 17 September 2026).
- Jastrzębski, R. Triage ESI 5.0 i KSM. Odpowiadamy na pytania po webinarze. RescYou. 12 September 2024. Available online: https://rescyou.edu.pl/2024/09/12/triage-esi-5-0-i-ksm-odpowiadamy-na-pytania-po-webinarze/ (accessed on 17 September 2026).
- Van Calster, B.; McLernon, D.J.; van Smeden, M.; Wynants, L.; Steyerberg, E.W.; Topic Group ‘Evaluating diagnostic tests and prediction models’ of the STRATOS initiative. Calibration: the Achilles heel of predictive analytics. BMC Med. 2019, 17, 230. [Google Scholar] [CrossRef] [PubMed]
- Saito, T.; Rehmsmeier, M. The Precision-Recall Plot Is More Informative than the ROC Plot When Evaluating Binary Classifiers on Imbalanced Datasets. PLoS ONE 2015, 10, e0118432. [Google Scholar] [CrossRef]
- Riley, R.D.; Debray, T.P.A.; Collins, G.S.; Archer, L.; Ensor, J.; van Smeden, M.; Snell, K.I.E. Minimum sample size for external validation of a clinical prediction model with a binary outcome. Stat. Med. 2021, 40, 4230–4251. [Google Scholar] [CrossRef] [PubMed]
- Vickers, A.J.; Van Calster, B.; Steyerberg, E.W. A simple, step-by-step guide to interpreting decision curve analysis. Diagn. Progn. Res. 2019, 3, 18. [Google Scholar] [CrossRef] [PubMed]
- Republic of Poland. Act of 5 December 1996 on the Professions of Physician and Dentist. Consolidated text, Journal of Laws 2026, item 37, as amended. Available online: https://eli.gov.pl/eli/DU/2026/37/ogl (accessed on 17 September 2026).
Figure 1.
Cohort construction and outcome-specific denominators. Admission is determined by ED disposition. The secondary cohort additionally excludes external transfers and episodes without a hospital discharge time at or before 30 June 2026 00:00. Exclusion categories can overlap; exact counts are provided in Supplementary Table S1.
Figure 1.
Cohort construction and outcome-specific denominators. Admission is determined by ED disposition. The secondary cohort additionally excludes external transfers and episodes without a hospital discharge time at or before 30 June 2026 00:00. Exclusion categories can overlap; exact counts are provided in Supplementary Table S1.
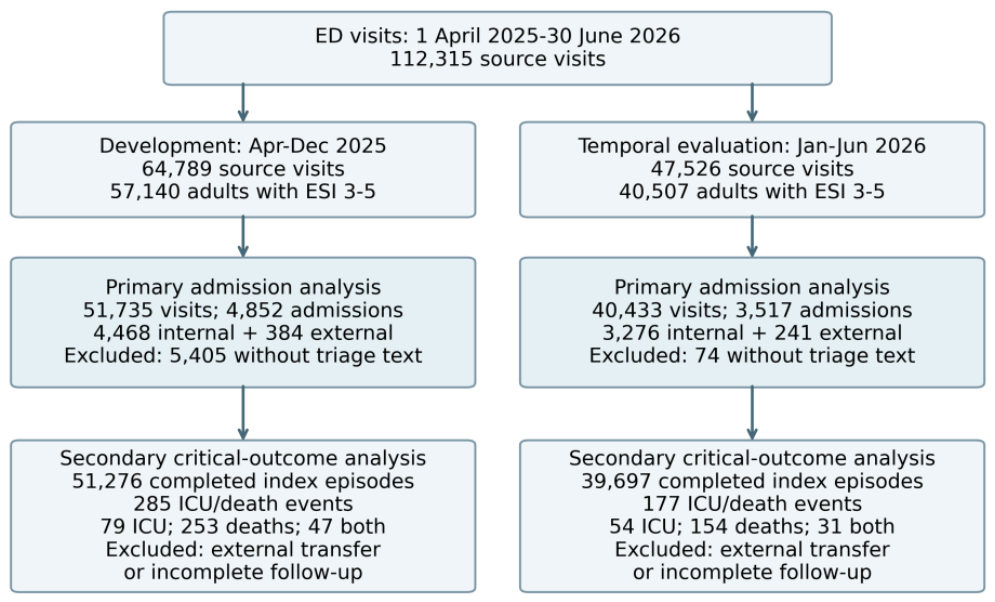
Figure 2.
ROC and precision-recall curves from the same evaluation visits within each outcome. Gray dotted lines show chance discrimination in ROC panels and observed event prevalence in precision-recall panels. The different outcome frequencies preclude comparison of precision values across endpoints as if they represented the same task.
Figure 2.
ROC and precision-recall curves from the same evaluation visits within each outcome. Gray dotted lines show chance discrimination in ROC panels and observed event prevalence in precision-recall panels. The different outcome frequencies preclude comparison of precision values across endpoints as if they represented the same task.
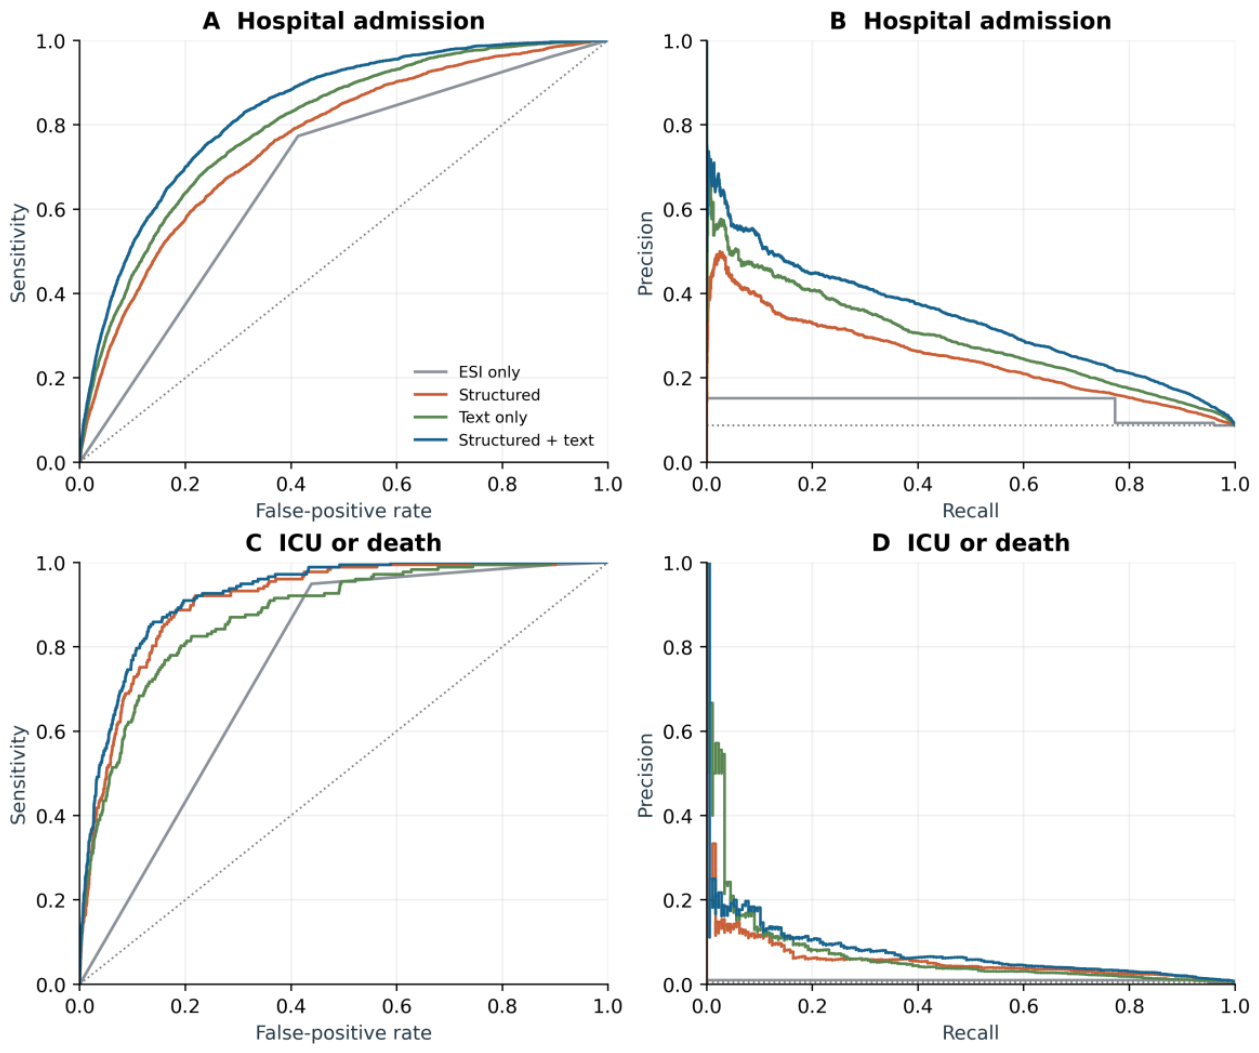
Figure 3.
Calibration by tie-preserving probability groups. Points represent group means, not individual-patient calibration guarantees. The scales differ between admission and the rare critical endpoint. The diagonal denotes agreement; subgroup counts and calibration intercepts/slopes are provided in the supplementary material.
Figure 3.
Calibration by tie-preserving probability groups. Points represent group means, not individual-patient calibration guarantees. The scales differ between admission and the rare critical endpoint. The diagonal denotes agreement; subgroup counts and calibration intercepts/slopes are provided in the supplementary material.
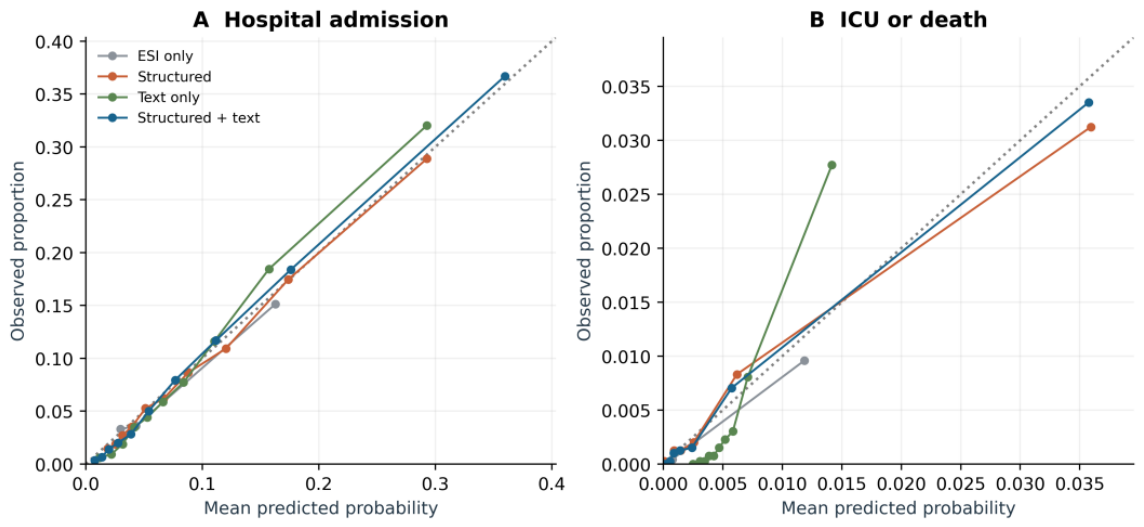
Figure 4.
Monthly observed event frequency and mean predicted probability from the frozen combined models. ICU/death denominators include only observable completed episodes; the late-June selection restriction must be considered when interpreting apparent temporal changes.
Figure 4.
Monthly observed event frequency and mean predicted probability from the frozen combined models. ICU/death denominators include only observable completed episodes; the late-June selection restriction must be considered when interpreting apparent temporal changes.
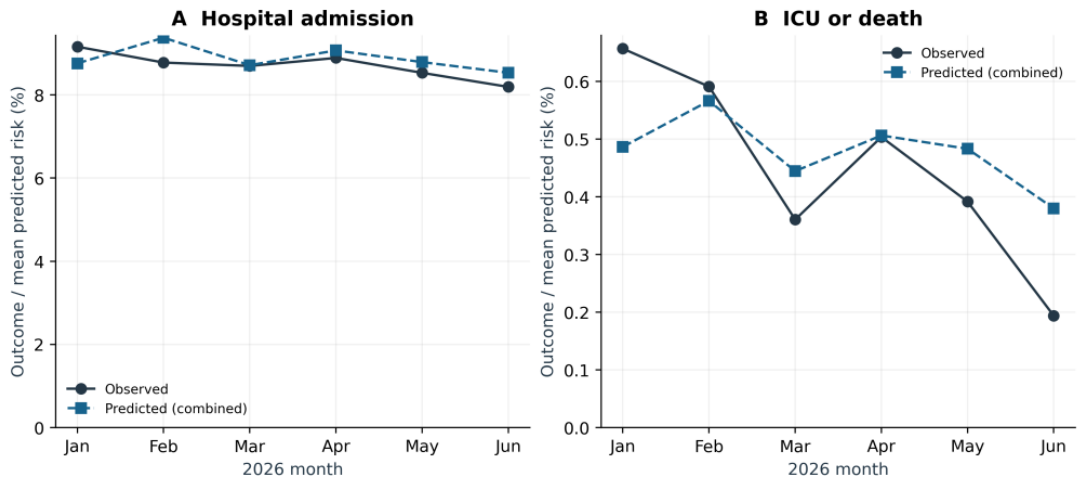
Figure 5.
Exploratory decision curves for hypothetical early bed coordination (admission) and prioritized clinician reassessment (ICU/death). Upper panels compare conditional net benefit with flag-all and flag-none strategies. Lower panels show combined-minus-structured differences with pointwise 95% patient-cluster bootstrap intervals. Thresholds encode assumed benefit-harm tradeoffs and were not clinically agreed. The critical analysis retains the restriction to completed observable episodes; no patient benefit or action policy was tested.
Figure 5.
Exploratory decision curves for hypothetical early bed coordination (admission) and prioritized clinician reassessment (ICU/death). Upper panels compare conditional net benefit with flag-all and flag-none strategies. Lower panels show combined-minus-structured differences with pointwise 95% patient-cluster bootstrap intervals. Thresholds encode assumed benefit-harm tradeoffs and were not clinically agreed. The critical analysis retains the restriction to completed observable episodes; no patient benefit or action policy was tested.
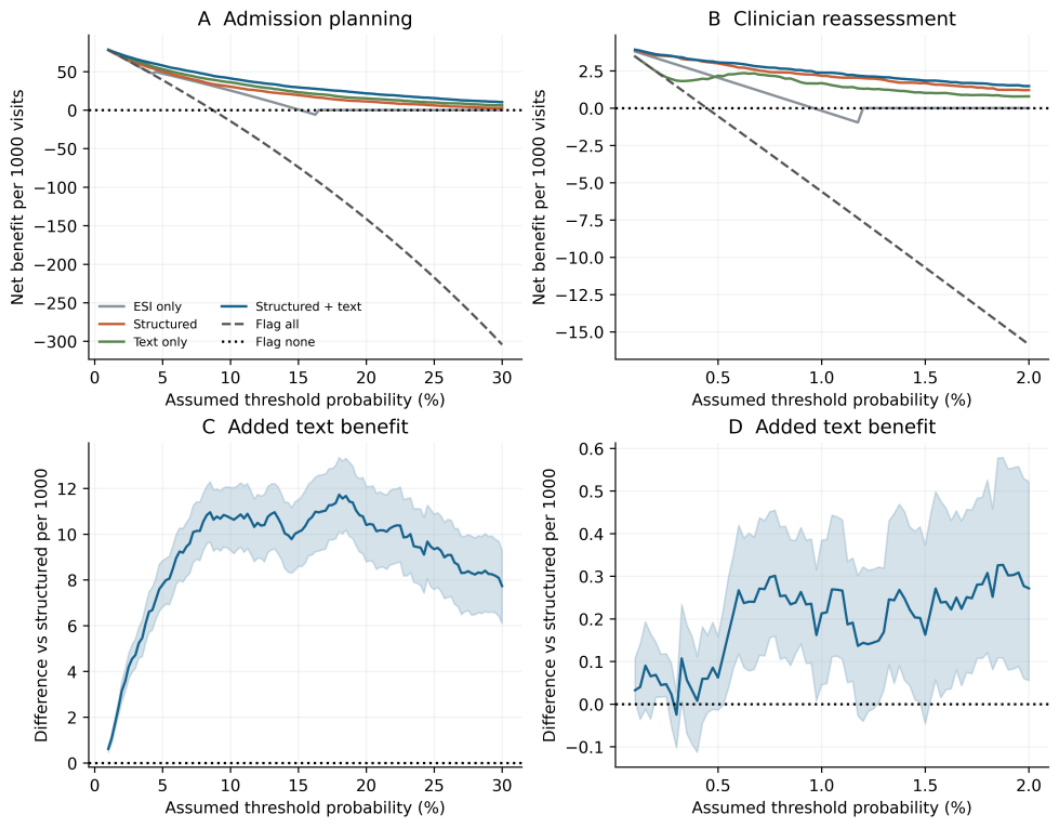

Table 1.
Primary text-evaluable cohorts and predictor availability after quality control.
| Characteristic | Apr-Dec 2025 | Jan-Jun 2026 |
|---|---|---|
| Visits | 51,735 | 40,433 |
| Age, years, median (IQR) | 46 (32-68) | 46 (31-66) |
| Male sex | 24,917 (48.2%) | 19,550 (48.4%) |
| Arrival by ambulance | 5,301 (10.2%) | 3,967 (9.8%) |
| ESI 3 | 22,541 (43.6%) | 17,972 (44.4%) |
| ESI 4 | 23,549 (45.5%) | 18,220 (45.1%) |
| ESI 5 | 5,645 (10.9%) | 4,241 (10.5%) |
| Recorded admission | 4,852 (9.4%) | 3,517 (8.7%) |
| Internal admission | 4,468 (8.6%) | 3,276 (8.1%) |
| Accepted external transfer | 384 (0.7%) | 241 (0.6%) |
| Pulse available | 31.2% | 47.8% |
| Blood pressure available | 39.9% | 47.6% |
| Oxygen saturation available | 34.3% | 54.4% |
| Temperature available | 12.5% | 12.6% |
| Pain score available | 12.0% | 35.3% |
| Respiratory rate available | 4.2% | 6.0% |
Table 2.
Frozen-model temporal performance (95% confidence intervals for discrimination).
| Outcome/model | AUROC (95% CI) | AUPRC (95% CI) | Brier | ECE | O/E |
|---|---|---|---|---|---|
| Admission ESI only |
0.681 (0.674-0.689) | 0.138 (0.133-0.144) | 0.07619 | 0.00856 | 0.917 |
| Admission Structured |
0.763 (0.755-0.771) | 0.246 (0.234-0.259) | 0.07242 | 0.00429 | 0.958 |
| Admission Text only |
0.800 (0.793-0.807) | 0.292 (0.278-0.309) | 0.07005 | 0.01216 | 1.000 |
| Admission Structured + text |
0.835 (0.828-0.841) | 0.340 (0.325-0.357) | 0.06696 | 0.00621 | 0.982 |
| ICU/death ESI only |
0.756 (0.739-0.770) | 0.009 (0.008-0.011) | 0.00442 | 0.00119 | 0.790 |
| ICU/death Structured |
0.909 (0.890-0.928) | 0.054 (0.039-0.081) | 0.00437 | 0.00092 | 0.920 |
| ICU/death Text only |
0.875 (0.853-0.899) | 0.071 (0.045-0.112) | 0.00436 | 0.00385 | 0.824 |
| ICU/death Structured + text |
0.924 (0.908-0.940) | 0.076 (0.055-0.110) | 0.00430 | 0.00059 | 0.937 |
Admission: 40,433 visits and 3517 events. ICU/death: 39,697 completed observable episodes and 177 events. AUPRC denotes average precision. O/E is the observed event count divided by the sum of predicted probabilities. Confidence intervals for Brier, ECE and O/E are supplied in the aggregate results.
Table 3.
Exploratory thresholds targeting 90% development out-of-fold sensitivity, applied unchanged to 2026.
Table 3.
Exploratory thresholds targeting 90% development out-of-fold sensitivity, applied unchanged to 2026.
| Outcome/model | Threshold | Sensitivity | Specificity | PPV | Flags/1000 | Missed events |
|---|---|---|---|---|---|---|
| Admission Structured |
0.04185 | 90.2% | 40.1% | 12.54% | 625.6 | 345 |
| Admission Structured + text |
0.05422 | 88.8% | 59.4% | 17.25% | 447.7 | 394 |
| ICU/death Structured |
0.00366 | 88.7% | 80.6% | 2.00% | 197.5 | 20 |
| ICU/death Structured + text |
0.00448 | 87.0% | 83.6% | 2.32% | 167.1 | 23 |
Table 4.
Apparent, grouped out-of-fold and temporal results for the combined models.
| Outcome | Evaluation | AUROC | AUPRC | Calibration slope |
|---|---|---|---|---|
| Admission | Development apparent | 0.868 | 0.434 | 1.373 |
| Admission | Development out-of-fold | 0.826 | 0.335 | 1.117 |
| Admission | Temporal evaluation | 0.835 | 0.340 | 1.083 |
| ICU/death | Development apparent | 0.949 | 0.174 | 1.238 |
| ICU/death | Development out-of-fold | 0.923 | 0.095 | 1.018 |
| ICU/death | Temporal evaluation | 0.924 | 0.076 | 0.964 |
The out-of-fold predictions come from smaller development folds with preprocessing refitted within each fold. Differences from temporal results are affected by calendar change and outcome prevalence and are not themselves an unbiased estimate of temporal optimism.
Table 5.
Temporal discrimination in the explanatory comparison of predictor sets.
| Predictor set | Admission AUROC | Admission AUPRC | ICU/death AUROC | ICU/death AUPRC |
|---|---|---|---|---|
| Core predictors | 0.752 | 0.222 | 0.896 | 0.029 |
| Core + missingness indicators | 0.754 | 0.224 | 0.892 | 0.028 |
| Core + imputed values without indicators | 0.762 | 0.245 | 0.913 | 0.052 |
| Original structured model | 0.763 | 0.246 | 0.909 | 0.054 |
| Core + text without measured fields or indicators | 0.832 | 0.332 | 0.921 | 0.065 |
| Core + indicators + text | 0.832 | 0.333 | 0.917 | 0.062 |
| Original combined model | 0.835 | 0.340 | 0.924 | 0.076 |
Core predictors are age, recorded sex, ESI and ambulance arrival. The seven measured fields are pulse, systolic and diastolic pressure, oxygen saturation, temperature, pain and respiratory rate. All variants use the same outcome-specific cohorts. These post-hoc comparisons do not select a replacement for the original models. Confidence intervals and calibration measures are reported in Supplementary Table S20.
Disclaimer/Publisher’s Note: The statements, opinions and data contained in all publications are solely those of the individual author(s) and contributor(s) and not of MDPI and/or the editor(s). MDPI and/or the editor(s) disclaim responsibility for any injury to people or property resulting from any ideas, methods, instructions or products referred to in the content. |
© 2026 by the authors. Licensee MDPI, Basel, Switzerland. This article is an open access article distributed under the terms and conditions of the Creative Commons Attribution (CC BY) license.
Copyright: This open access article is published under a Creative Commons CC BY 4.0 license, which permit the free download, distribution, and reuse, provided that the author and preprint are cited in any reuse.