

Submitted:
20 September 2026
Posted:
21 September 2026
You are already at the latest version
Abstract
This study develops a research and verification framework for a triaxial reinforcement topology consisting of three continuous reinforcement families oriented at 0°, 60°, and 120° in two-way reinforced-concrete slabs. The manuscript is reorganized around a four-axis framework linking (I) topology, density, and spacing; (II) reinforcement quantity and reduction; (III) structural resistance and serviceability; and (IV) effective depth and load-transfer geometry. Four complementary methods are used: analytical derivation, code-based reference checks, nonlinear finite-element analysis in ABAQUS/Standard, and comparative calibration against the S1–S10 numerical matrix. The analytical model establishes the exact density transformation s_h=[3/(2R_h)]s_o and the equal-steel spacing relation s_h=1.5s_o. It also gives the idealized equal-steel relations E_hex=0.75E_0 and m_n=1.5m_0 within the adopted mesh formulation. These identities are explicitly separated from research hypotheses, including the 50% total-steel reduction target and k=0.60. The FE matrix shows matched resistance ratios ranging from approximately 0.957 to 1.028, with S9 reaching 225 kN/m2 relative to 235 kN/m2 for S8 and a reported peak central deflection of 0.77 mm. A 1.83 × 1.83 m demonstration, matched directly to four of the original ABAQUS specimens under four-edge simply supported conditions, shows that preliminary code-based reinforcement quantities substantially exceed the nominal steel embedded in the reference finite-element models, underscoring that any claimed reduction must be verified case by case rather than assumed. The resulting framework is therefore presented as a testable research methodology rather than a finalized design code.
Keywords:
triaxial reinforcement
; hexagonal reinforcement
; two-way slabs
; reinforcement topology
; ABAQUS
; load transfer
; reinforcement reduction
; structural serviceability
1. Introduction
Conventional two-way reinforced-concrete slabs are predominantly detailed with two orthogonal reinforcement families. Previous experimental and analytical studies have shown that reinforcement arrangement can influence slab stiffness, strength, deformation, and the development of tensile membrane action [16]. Three-way reinforcement has also been investigated previously; Aoyagi, Yamada, and Takahashi examined three-way reinforced-concrete containment models and reported changes in shear rigidity and large-deformation energy absorption [26]. Accordingly, the present study does not claim that three-way reinforcement is itself unprecedented.
The research problem addressed here is narrower and more quantitative: whether a planar 0°/60°/120° reinforcement network can be described by a consistent set of transformation rules and governing limits that permit controlled reduction of total reinforcement while maintaining the required strength, serviceability, and detailing performance. The central contribution is therefore the integration of geometry, reinforcement quantity, structural verification, and load-transfer descriptors into a single decision framework.
A key methodological requirement is to distinguish four categories of statements: (a) identities derived from the adopted mathematical idealization; (b) observations calibrated from the existing FE matrix; (c) proposed research parameters requiring further validation; and (d) requirements that remain mandatory under the governing concrete design code. This distinction is maintained throughout the revised manuscript.
2. Research Gap, Hypothesis, and Objectives
The principal hypothesis is that the 0°/60°/120° network provides a more directionally distributed reinforcement field than a conventional orthogonal grid and may therefore permit a lower total reinforcement quantity for selected slab geometries. The hypothesis does not assume that steel quantity alone controls capacity; instead, the admissible reduction is governed by the most demanding structural or detailing requirement.
The objectives are to: (1) derive the density and spacing transformation for a triaxial mesh; (2) establish idealized directional stiffness and moment relationships; (3) formulate a governing reinforcement envelope; (4) compare matched S1–S10 ABAQUS configurations; (5) identify the role of spacing, effective depth, and load-transfer geometry; and (6) demonstrate the procedure on a 1.83 × 1.83 m two-way slab matched directly to four of the original ABAQUS specimens.
3. Research Methodology and Evidence Structure
| Method | Primary task | Output | Evidence status |
| M1—Analytical / mathematical | Topology, density, symmetry, spacing and geometric descriptors | Closed-form equations and dimensionless ratios | Derived within adopted model |
| M2—Code/design reference | Minimum steel, spacing, strength, serviceability, shear, punching and detailing | Reference design envelope | Code-based where applicable |
| M3—Nonlinear FE | ABAQUS/Standard comparison of orthogonal and triaxial configurations | P_u, deflection, cracking and stress redistribution | Numerical evidence |
| M4—Comparative calibration | Matched S1–S10 ratios and parametric trends | R_P, ΔP and governing trends | Model-specific calibration |
| ACI CODE-318-25 is used as the current reference for conventional reinforced-concrete design and detailing. The triaxial-specific equations in this paper are research equations; they are not presented as provisions contained in ACI CODE-318-25 [15]. Shrinkage and temperature reinforcement, shear, punching shear, crack control, anchorage, cover, durability, and constructability remain independent checks. | |||
4. Four-Axis Theoretical Framework
4.1. Axis I—Topology, Density, and Spacing
Let s_o be the spacing of each reinforcement family in the conventional 0°/90° system and s_h the spacing of each family in the 0°/60°/120° system. For equal bar area A_b, the reinforcement density per unit slab area is proportional to the number of families divided by their spacing.
ρ_o = 2A_b/s_o (1)
ρ_h = 3A_b/s_h (2)
R_h = ρ_h/ρ_o = 3s_o/(2s_h) (3)
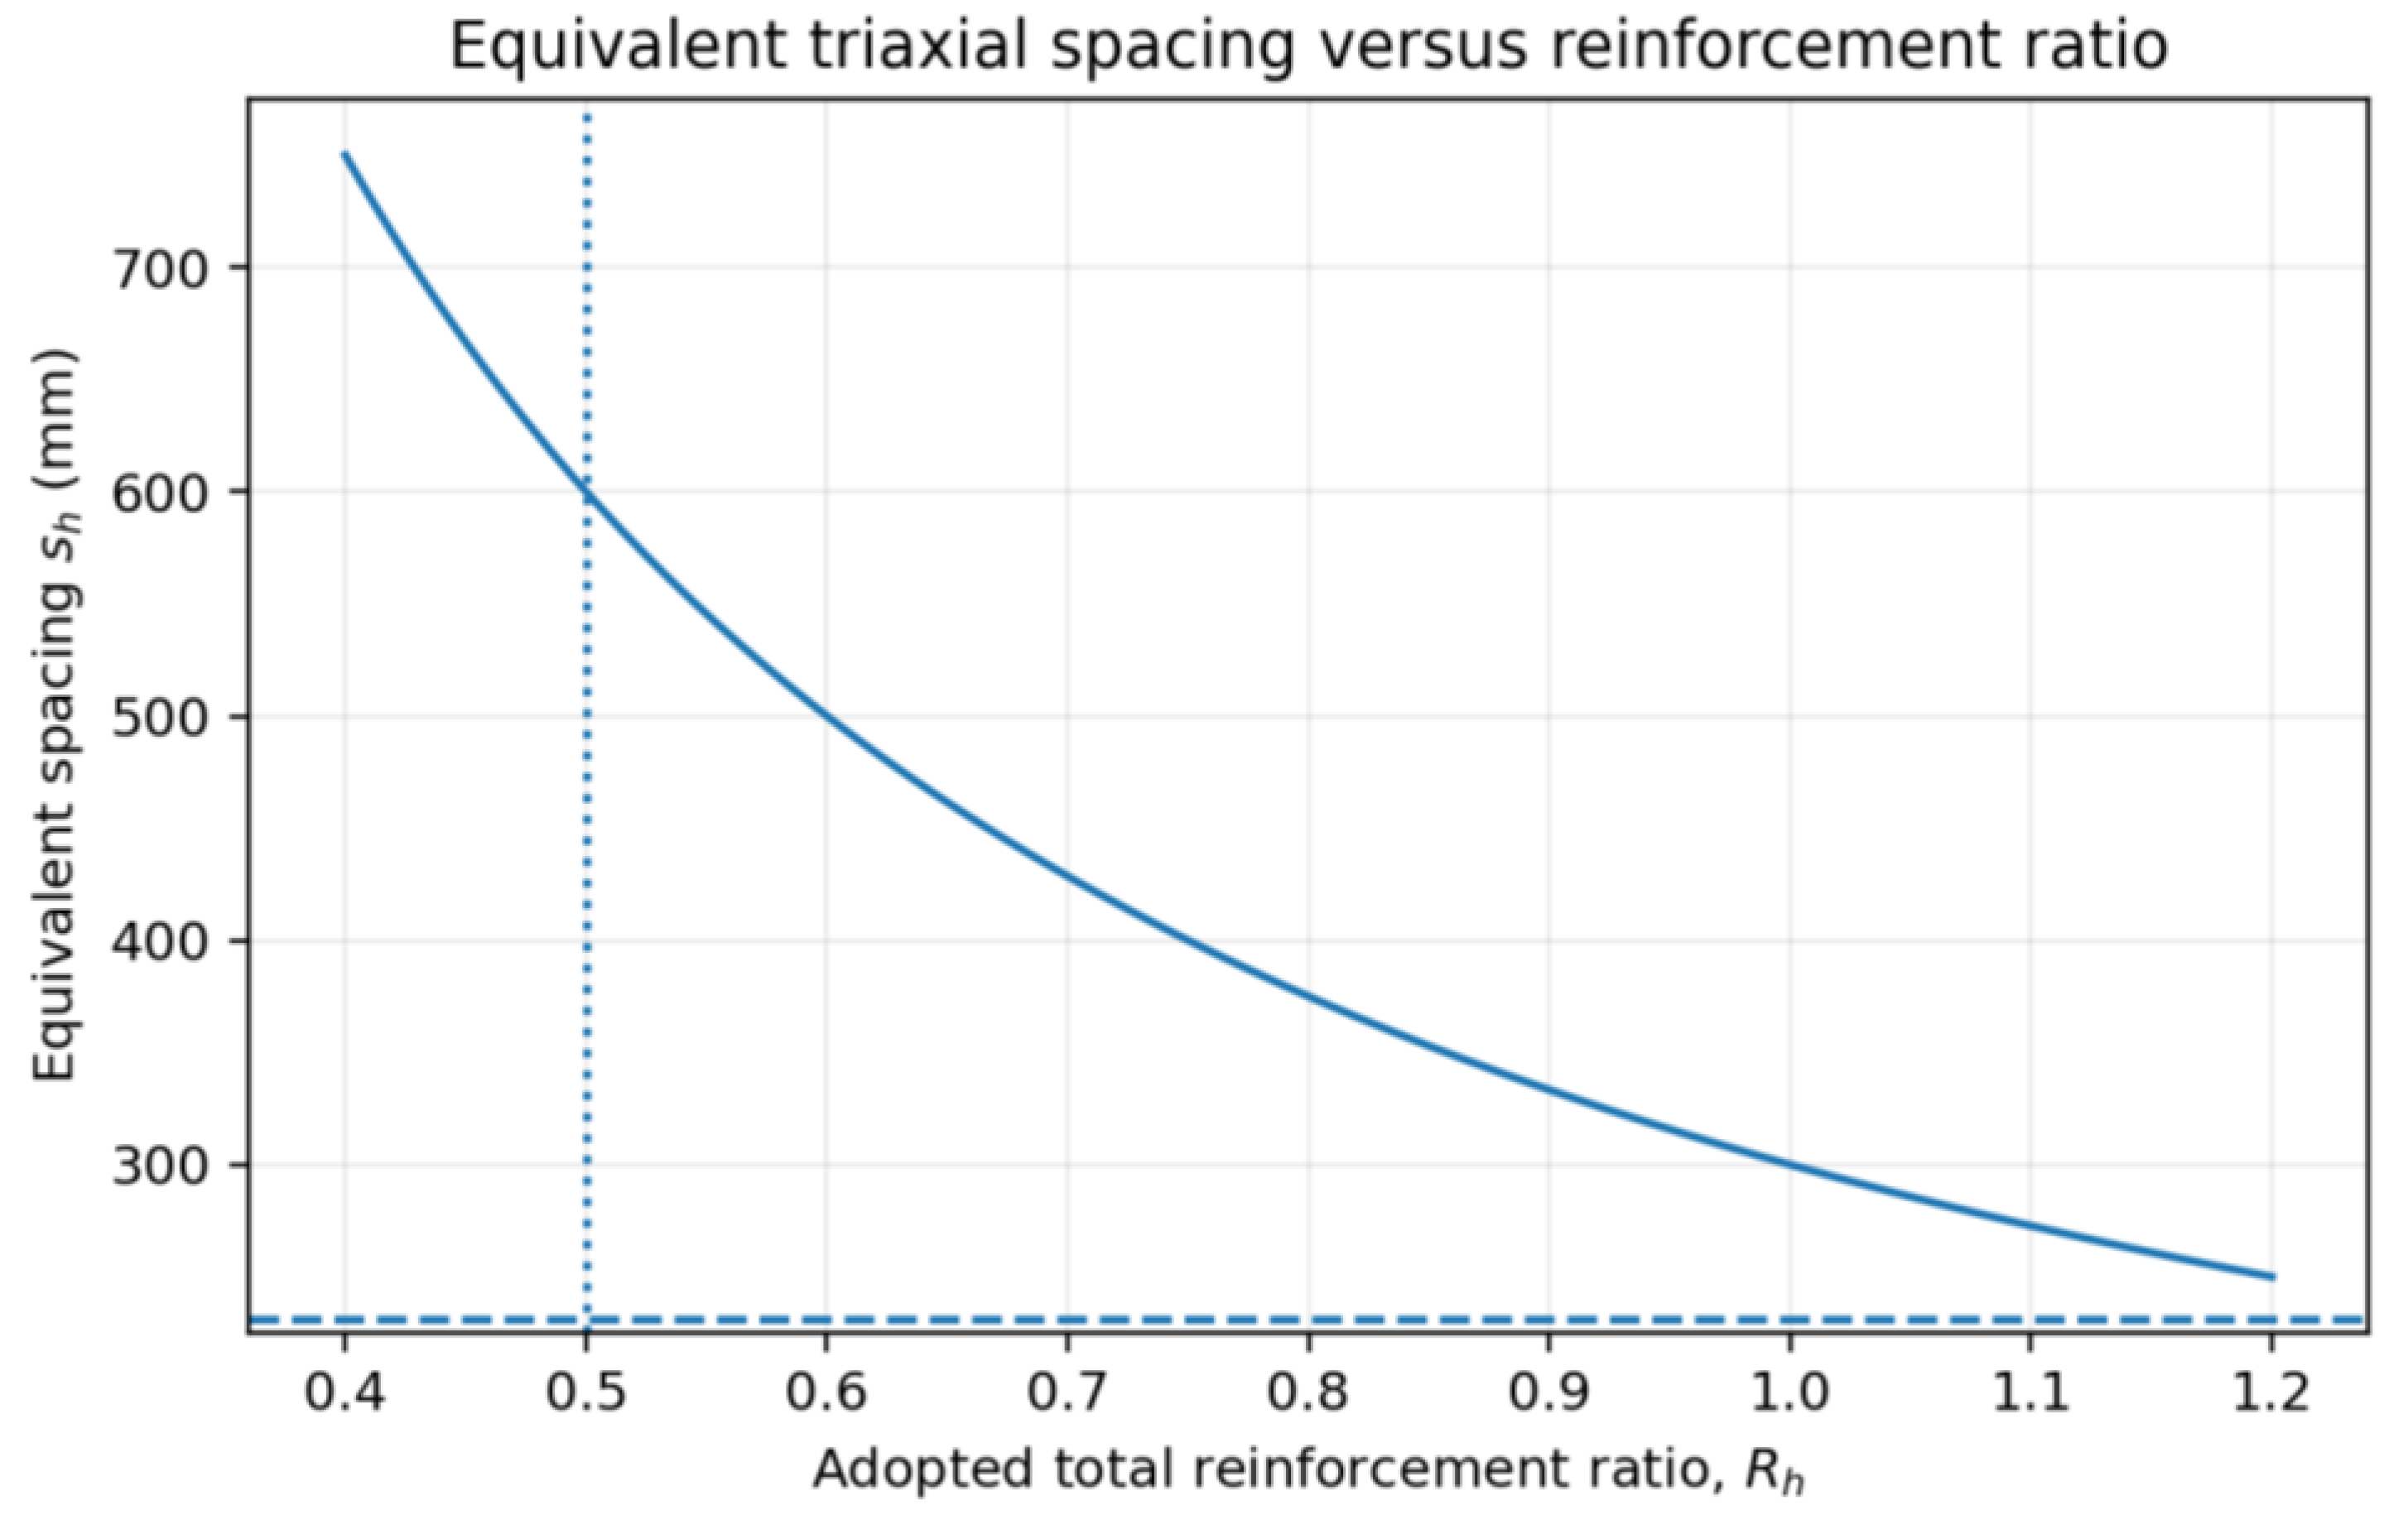
s_h = [3/(2R_h)] s_o (4)
| R_h | Interpretation | Equivalent spacing |
| 1.0 | Equal total steel | 1.5 s_o |
| 0.6 | Intermediate research level | 2.5 s_o |
| 0.5 | Nominal 50% research target | 3.0 s_o |
The transformation in Equation (4) is a quantity-equivalence relation, not a maximum-spacing provision. If the resulting spacing exceeds an applicable detailing or crack-control limit, the spacing must be reduced and the actual reinforcement quantity recalculated.
s_f = min(s_h, s_3w) (5)
s_3w ≤ min(2h, 450 mm, 1.85d) (6)
The 2h and 450 mm terms are retained as reference two-way slab spacing limits. The 1.85d term is a proposed geometric research bound and is not identified as an ACI requirement.
Figure 1 shows the bar-orientation geometry of the two systems schematically, before the density and spacing transformation is derived analytically.
Figure 1.
Schematic bar-orientation comparison between the conventional 0°/90° orthogonal grid and the proposed 0°/60°/120° triaxial mesh (illustrative geometry, not to scale).
Figure 1.
Schematic bar-orientation comparison between the conventional 0°/90° orthogonal grid and the proposed 0°/60°/120° triaxial mesh (illustrative geometry, not to scale).
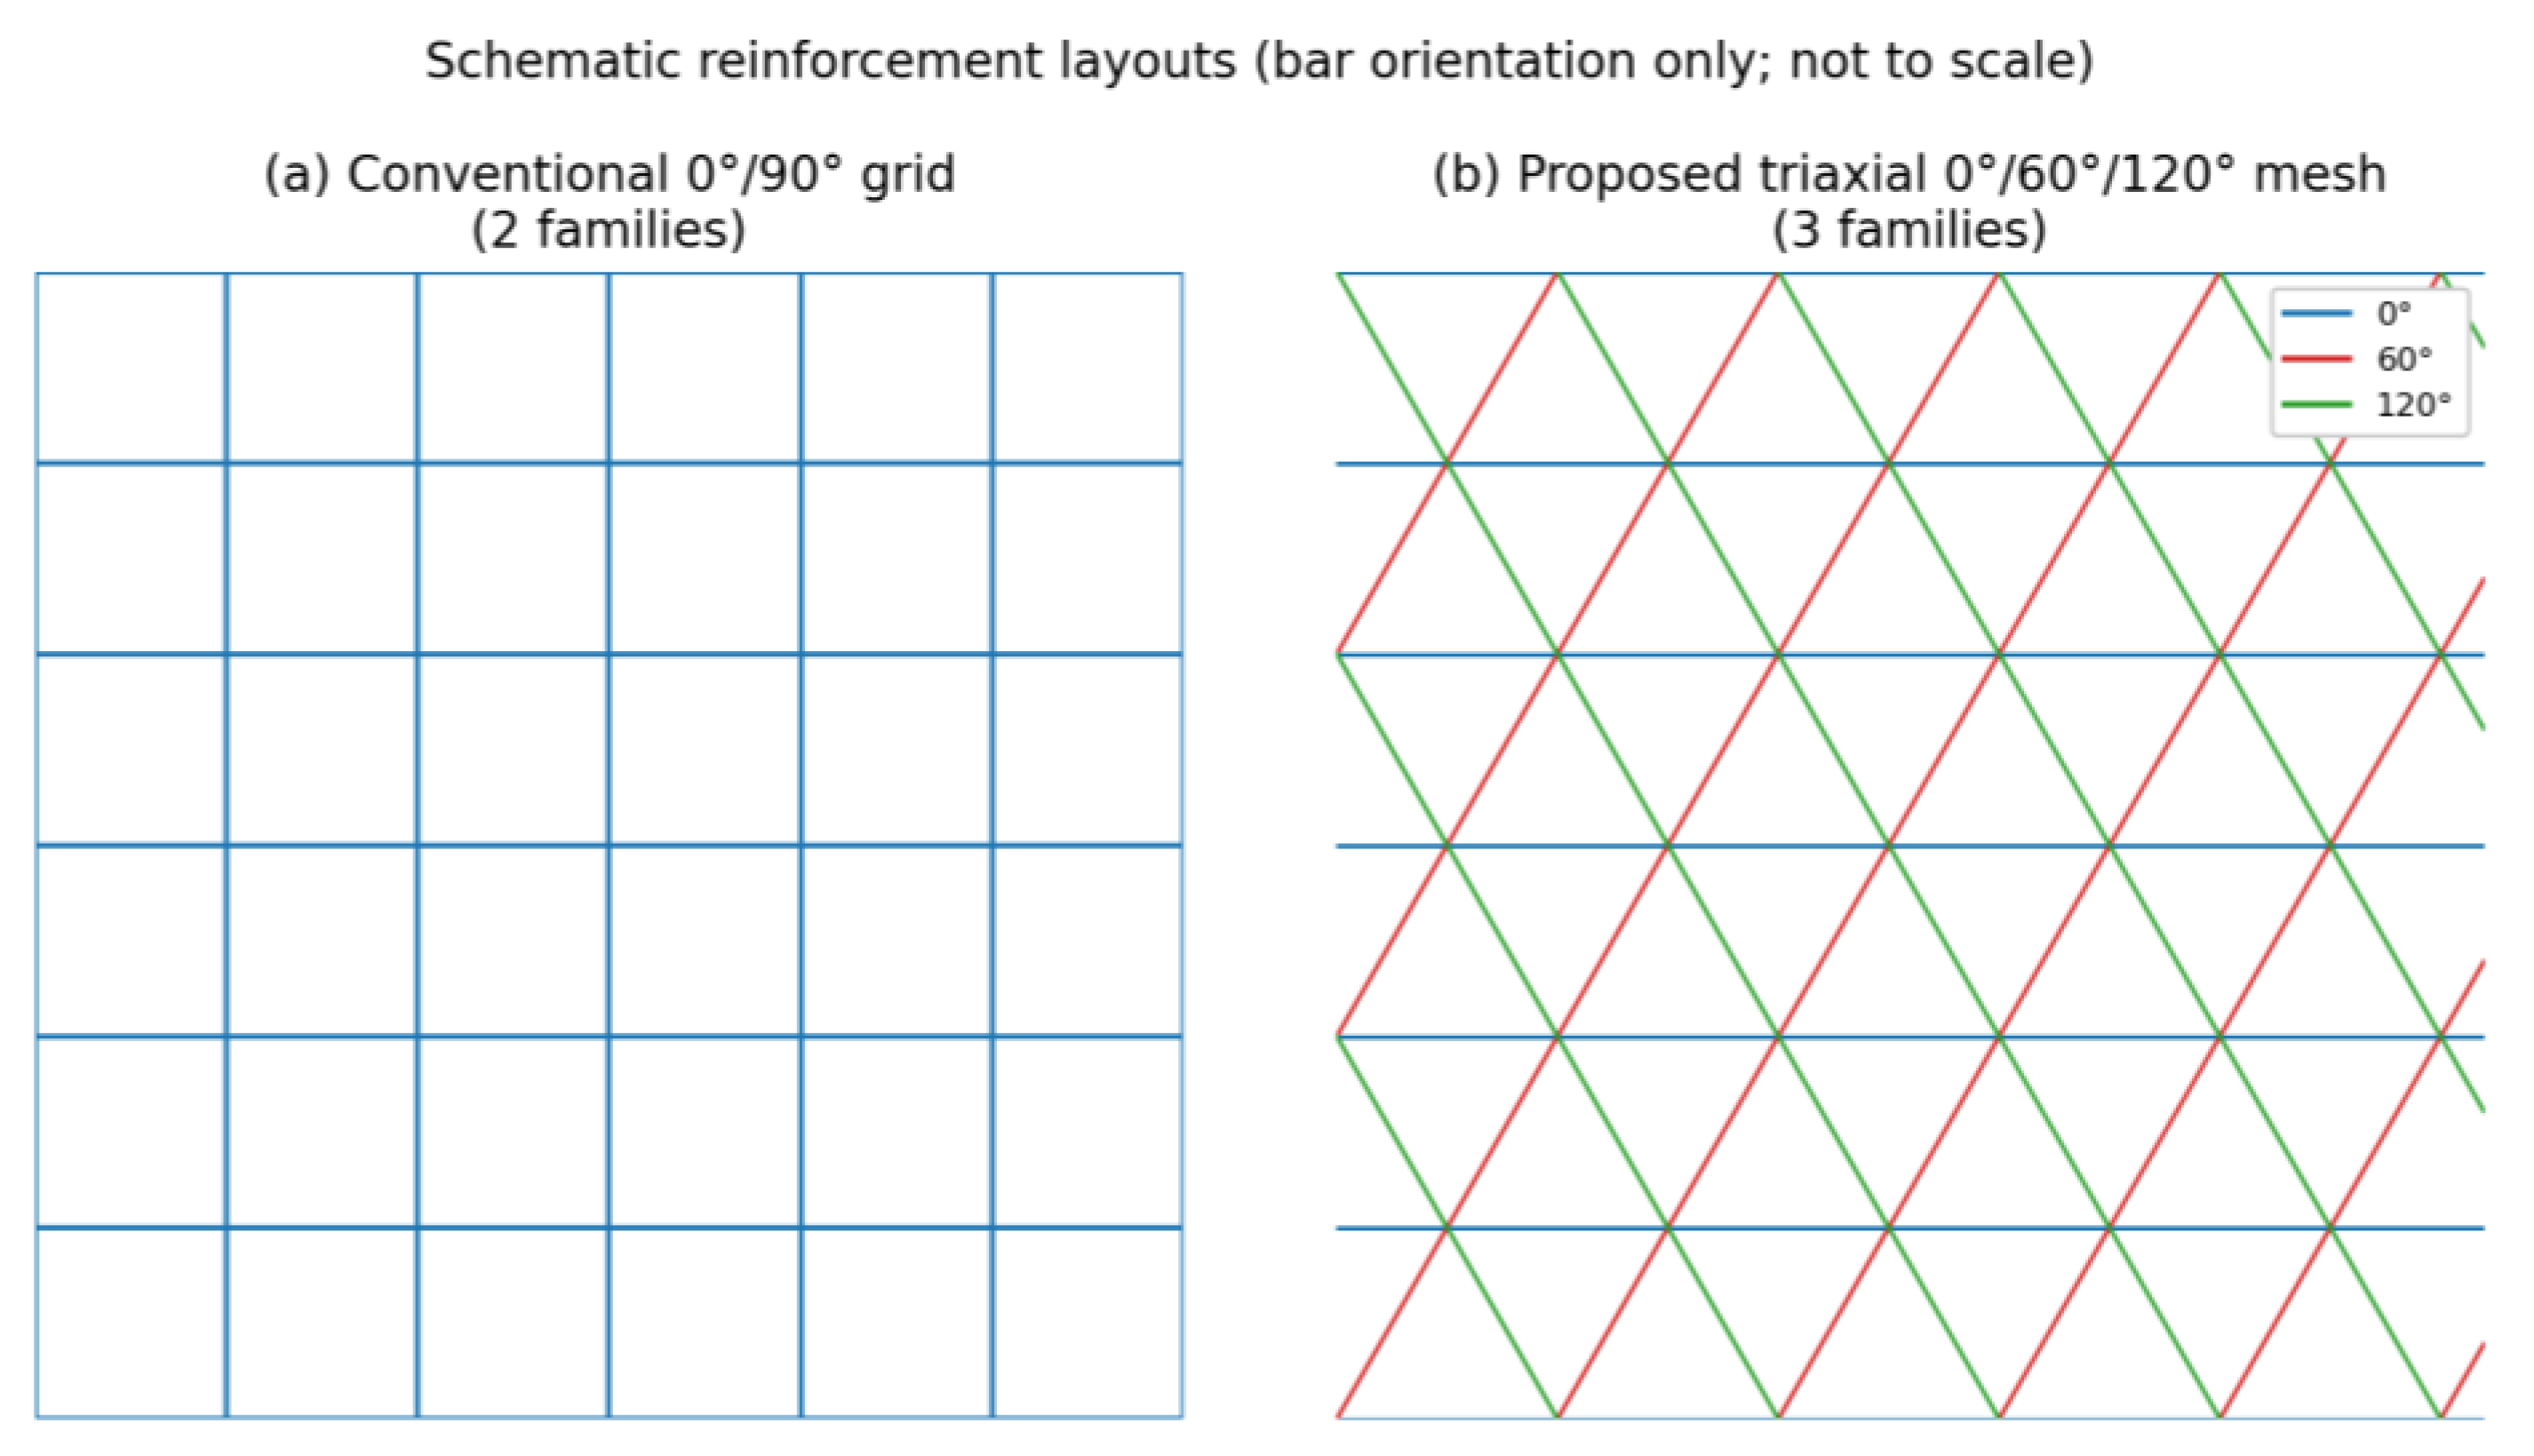
Figure 2.
Equivalent triaxial spacing as a function of the adopted total reinforcement ratio (s_o = 200 mm).
Figure 2.
Equivalent triaxial spacing as a function of the adopted total reinforcement ratio (s_o = 200 mm).
4.2. Axis II—Reinforcement Quantity and Idealized Directional Response
For equal total steel, the reference orthogonal reinforcement ratio is distributed among three equally spaced directions. Within the adopted idealized membrane/mesh formulation, the directional stiffness and moment expressions are rotation-invariant.
ρ_3 = (2/3)ρ_o (7)
E_hex(φ) = E_s ρ_3 Σ cos4(φ − kπ/3) = 0.75E_sρ_o (8)
m_n(φ) = m_o[cos2φ + cos2(φ−60°) + cos2(φ−120°)] = 1.5m_o (9)
Equations (8) and (9) are idealized mathematical results at equal total steel. They should not be interpreted as direct proof that a real cracked reinforced-concrete slab develops 1.5 times the conventional capacity.
2T cos30° = H → T = H/√3 = 0.577H (10)
The coefficient 1/√3 is a geometric projection coefficient associated with the adopted triangular force-transfer idealization. It is kept separate from the 1.5 moment relation to avoid double counting. The practical value k=0.60 is retained only as a research hypothesis. With a secondary conventional component represented by αA_m, the arithmetic relation is:
R_h = k/(1+α) (11)
For k=0.60 and α=0.20, Equation (11) gives R_h=0.50. This arithmetic demonstrates internal consistency of the proposed target but does not establish α=0.20 as a universal fraction for two-way slabs.
4.3. Axis III—Structural Resistance and Serviceability
Reinforcement quantity is treated as an input variable rather than a direct surrogate for structural capacity. The principal numerical comparison is defined as:
R_P = P_u,triax/P_u,ref (12)
ΔP = (R_P − 1)×100% (13)
Each candidate configuration must satisfy flexural resistance, one-way shear, punching shear where applicable, deformation limits, crack-width requirements, reinforcement strain limits, concrete compression/damage criteria, anchorage and development, cover, minimum reinforcement, and constructability. The triaxial network does not automatically eliminate shrinkage-and-temperature reinforcement.
4.4. Axis IV—Effective Depth and Load-Transfer Geometry
Because the triaxial system may occupy multiple layers or crossing levels, effective depth must be defined consistently. For a three-layer idealization:
d_1 = h − c_c − d_b/2 (14)
d_2 = h − c_c − 1.5d_b (15)
d_3 = h − c_c − 2.5d_b (16)
d_avg ≈ h − c_c − 1.5d_b (17)
The bar-diameter envelope 0.06≤d_b/d≤0.07 is retained as a research parameter rather than a code limit. A geometric load-diffusion descriptor is defined by:
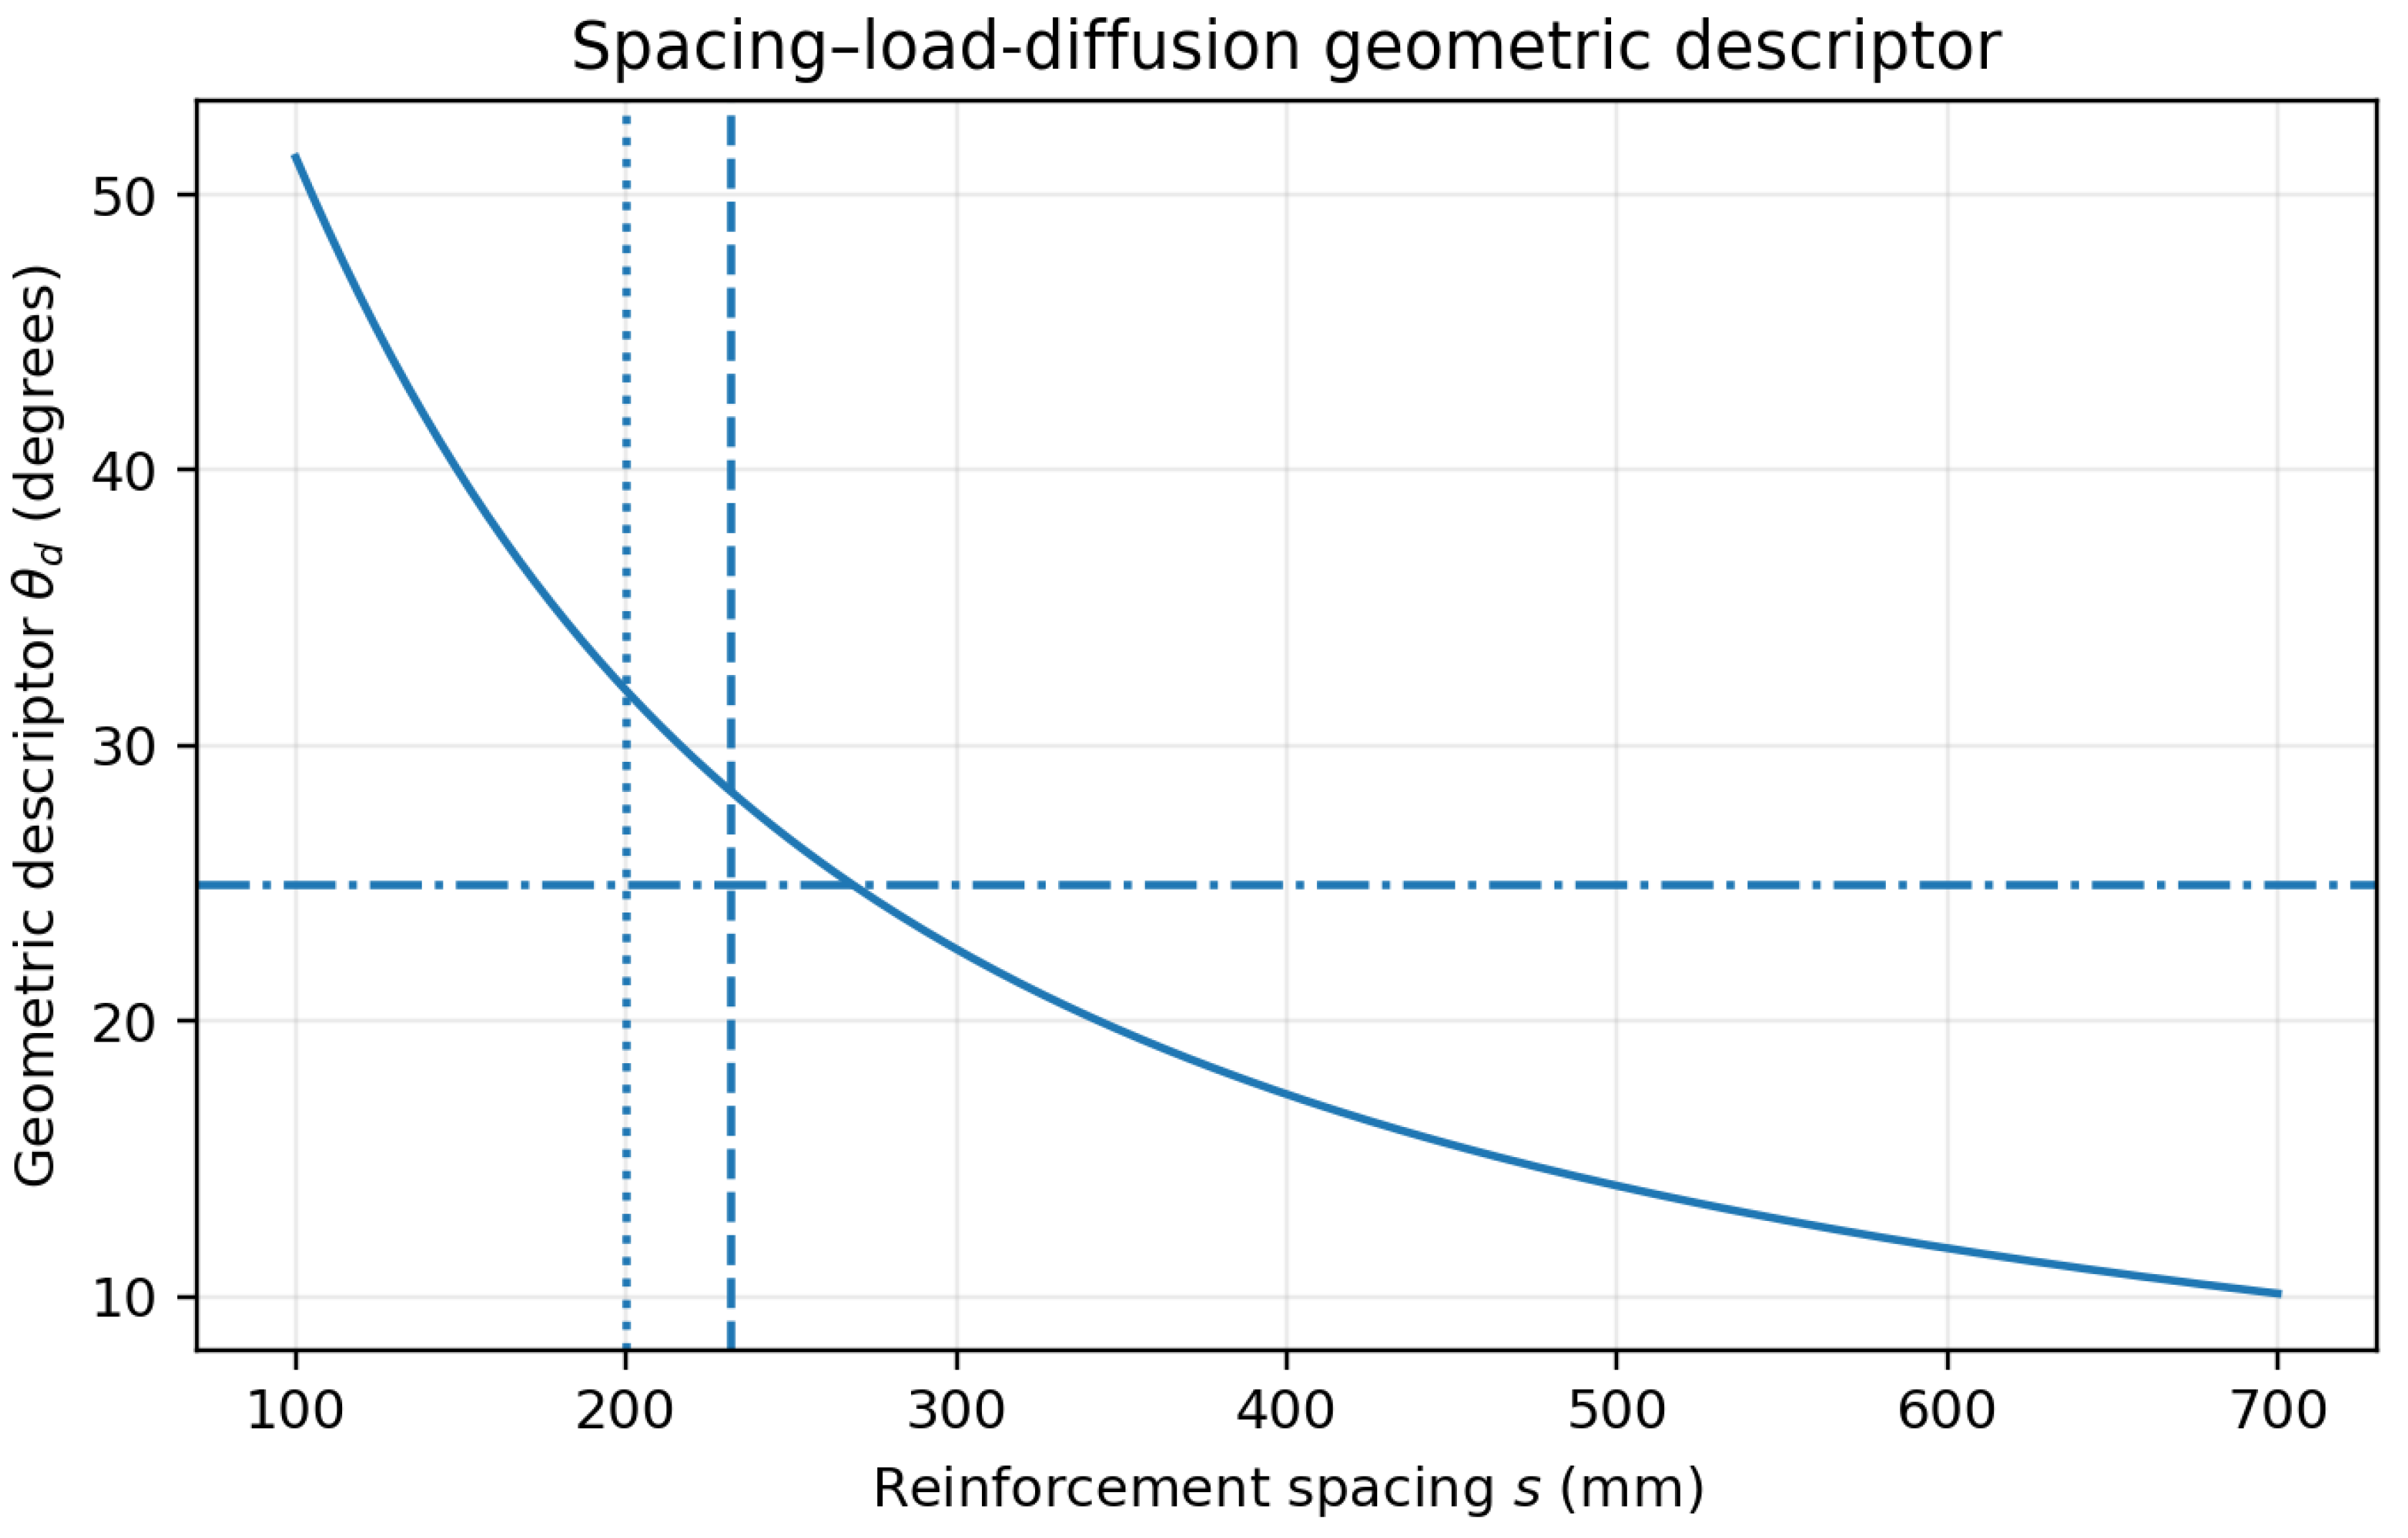
θ_d = arctan(h_d/r_d) = arctan(2h_d/D_d) (18)
This descriptor is not interchangeable with an STM strut angle. The S9 value of approximately 23.6° is treated as a model-specific observation and not as evidence for replacing the conventional STM methodology with a universal triaxial angle.
Figure 3.
Spacing versus the geometric load-diffusion descriptor for d = 125 mm. The 25° line is shown only as a reference to the discrete STM idealization discussed in the text.
Figure 3.
Spacing versus the geometric load-diffusion descriptor for d = 125 mm. The 25° line is shown only as a reference to the discrete STM idealization discussed in the text.
5. Governing Reinforcement Envelope
The framework is completed by expressing the admissible reinforcement ratio as the maximum requirement generated by the independent design determinants:
R_adopted ≥ max(R_M, R_Δ, R_cr, R_V, R_p, R_detail) (19)
| Determinant | Symbol | Primary check | Status in present study |
| Flexure | R_M | M_Ed ≤ M_Rd | Mandatory |
| Deflection | R_Δ | Serviceability deformation | Mandatory |
| Cracking | R_cr | Crack width/control | Mandatory |
| One-way shear | R_V | V_Ed ≤ V_Rd | Mandatory |
| Punching shear | R_p | V_u ≤ V_c / design resistance | Mandatory where applicable |
| Detailing/minimum | R_detail | Minimum steel, spacing, cover, anchorage | Mandatory |
This formulation is the central design logic of the study: the 50% target is not a fixed allowable reduction. It is a candidate quantity that remains admissible only when all governing requirements are satisfied.
6. ABAQUS Matrix and Comparative Calibration
The S1–S10 models are treated as an internal numerical matrix rather than as ten independent physical experiments. The matrix includes slab thicknesses of 67, 76, 180, and 200 mm and compares orthogonal controls with triaxial configurations. The reported comparisons are reproduced below.
| Specimen | h (mm) | Layout | s (mm) | P_u (kN/m2) | Matched interpretation |
| S1 | 76 | Orthogonal control | 120 | 36 | Reference |
| S2 | 76 | Triaxial half-ratio | 360 | 36 | R_P=1.000 vs S1 |
| S3 | 76 | Triaxial same-ratio | 180 | 37 | R_P≈1.028 vs S1 |
| S4 | 67 | Orthogonal | 120 | 28 | Reference |
| S5 | 67 | Triaxial half-ratio | 360 | 28 | R_P=1.000 vs S4 |
| S6 | 180 | Orthogonal | 120 | 190 | Reference |
| S7 | 180 | Triaxial same-ratio | 180 | 190 | R_P=1.000 vs S6 |
| S8 | 200 | Orthogonal double | 60 | 235 | Reference |
| S9 | 200 | Triaxial half-ratio | 360 | 225 | R_P=0.957 vs S8 |
| S10 | 200 | Triaxial same-ratio | 180 | 231 | R_P=0.983 vs S8 |
Figure 4.
Ultimate resistance reported for the S1–S10 ABAQUS matrix.
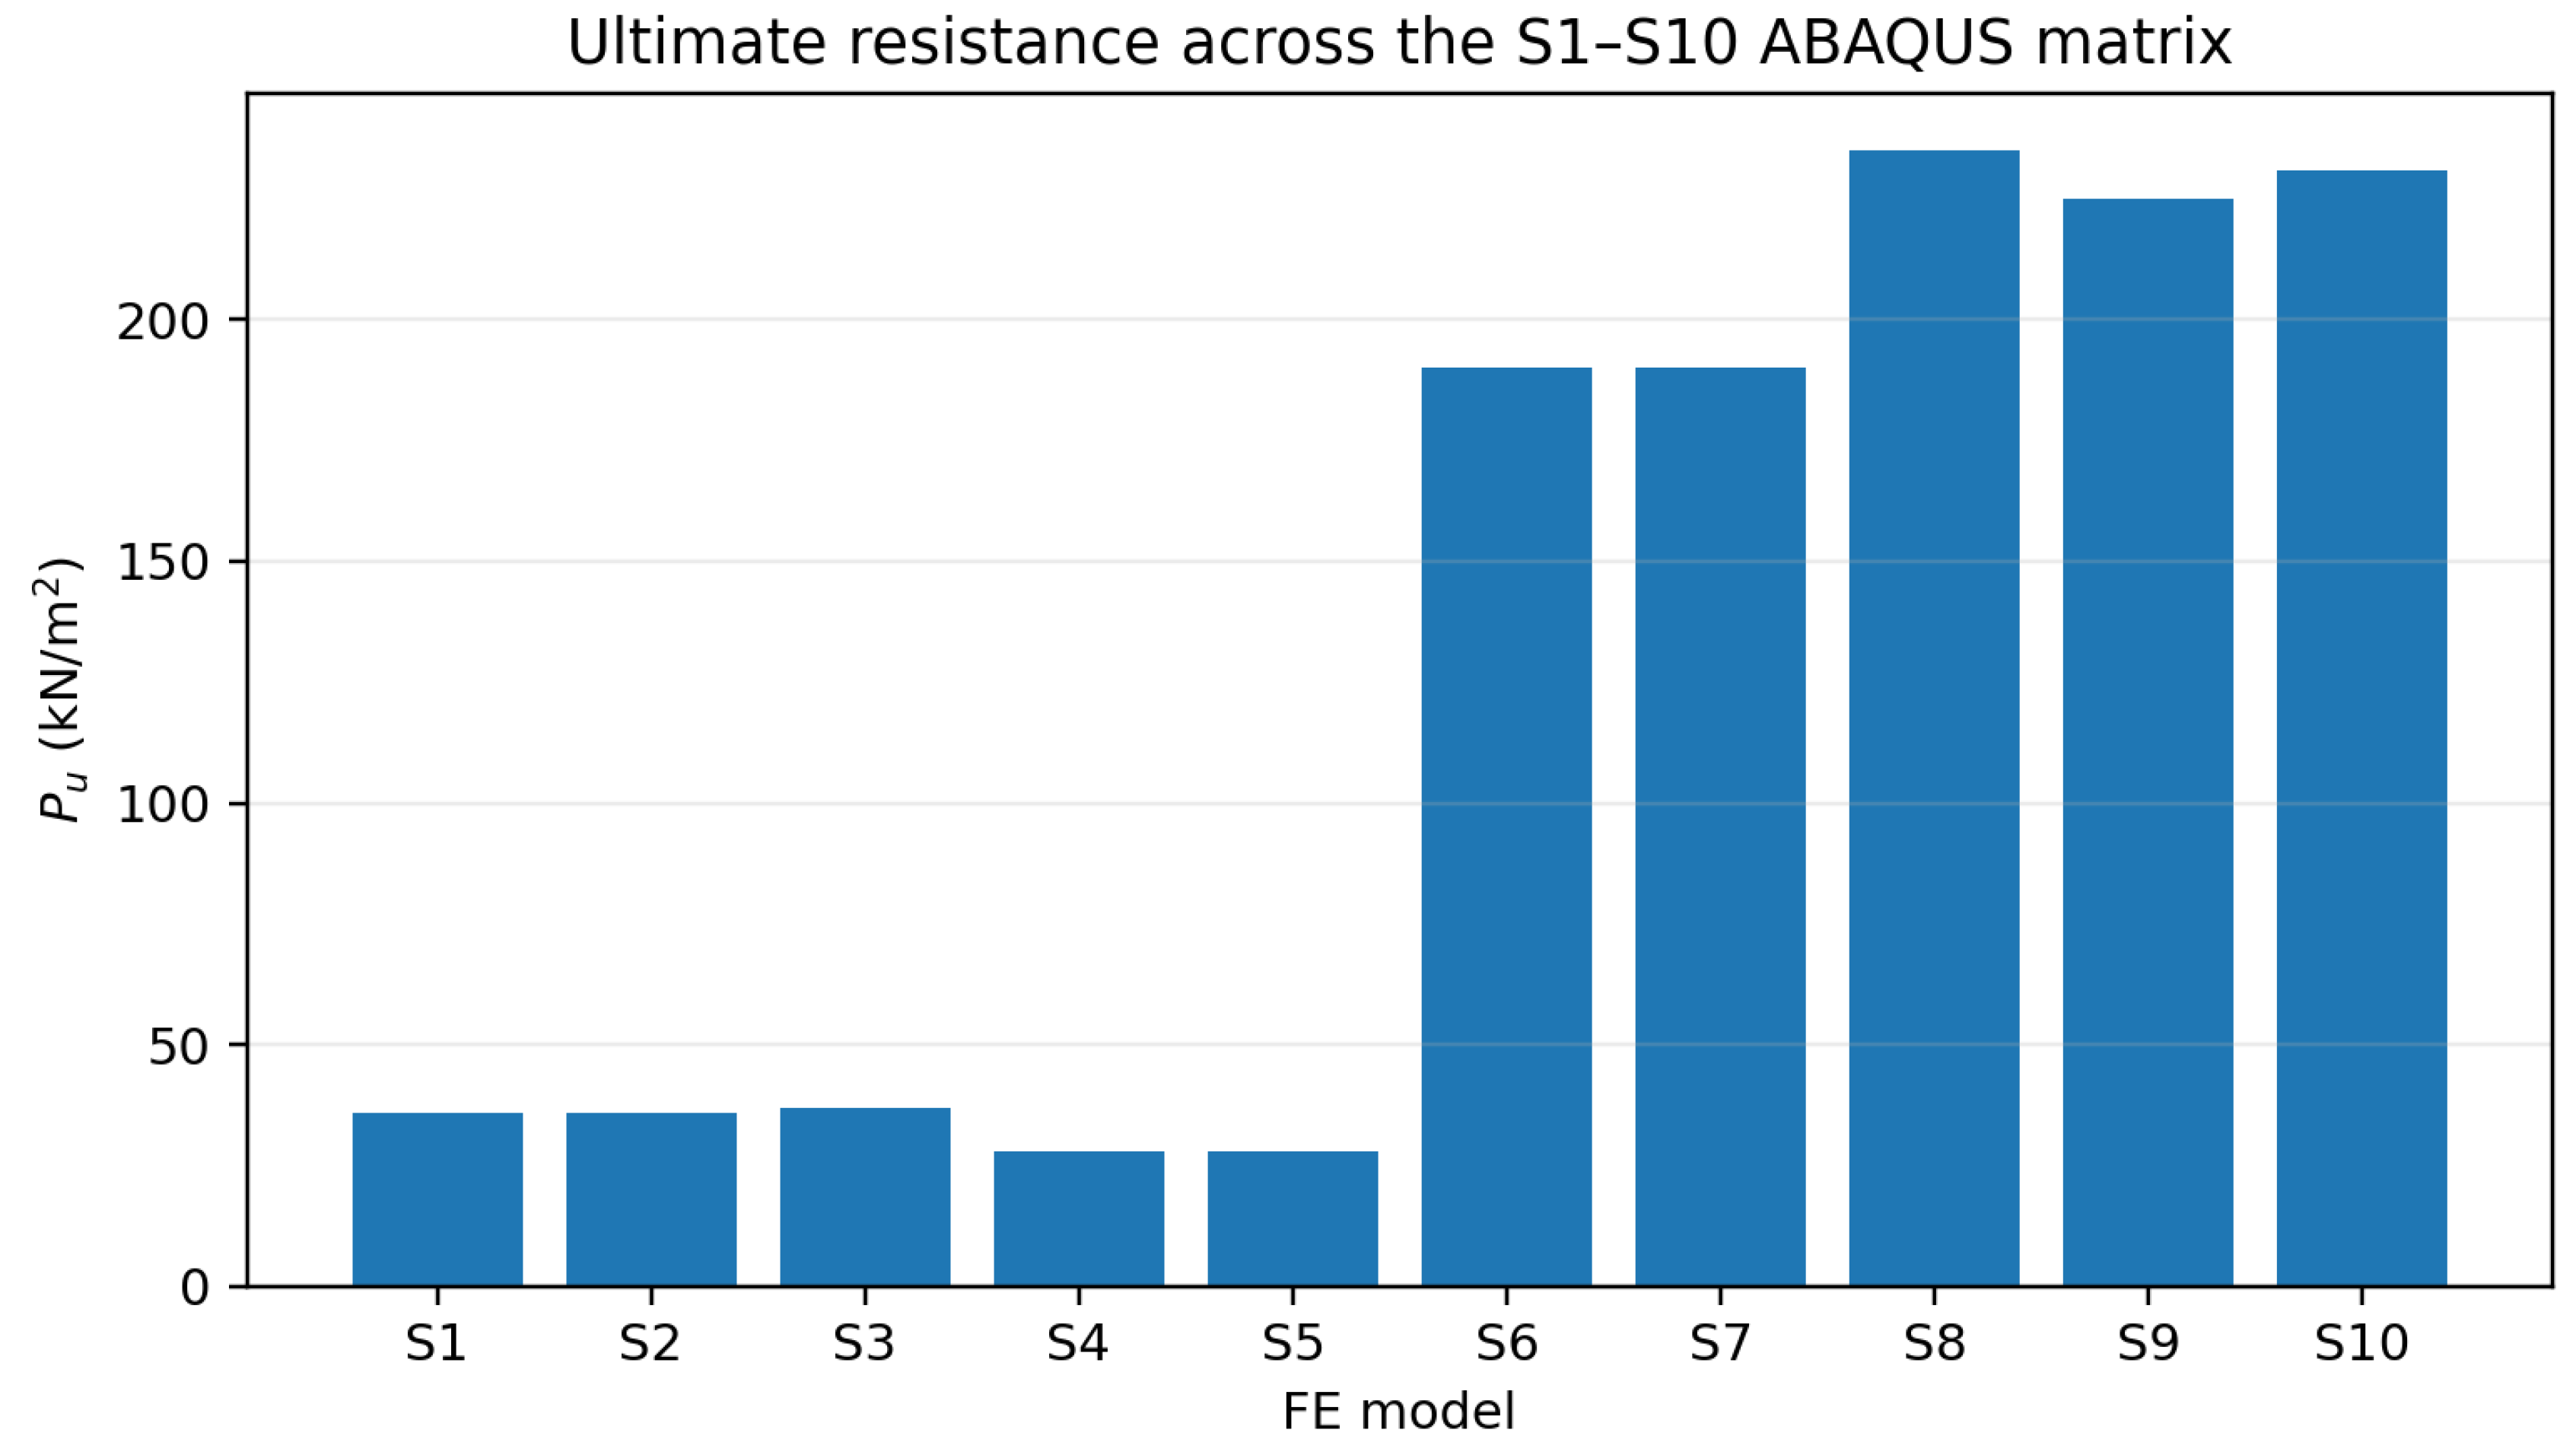
Figure 5.
Normalized resistance of the matched FE comparisons.
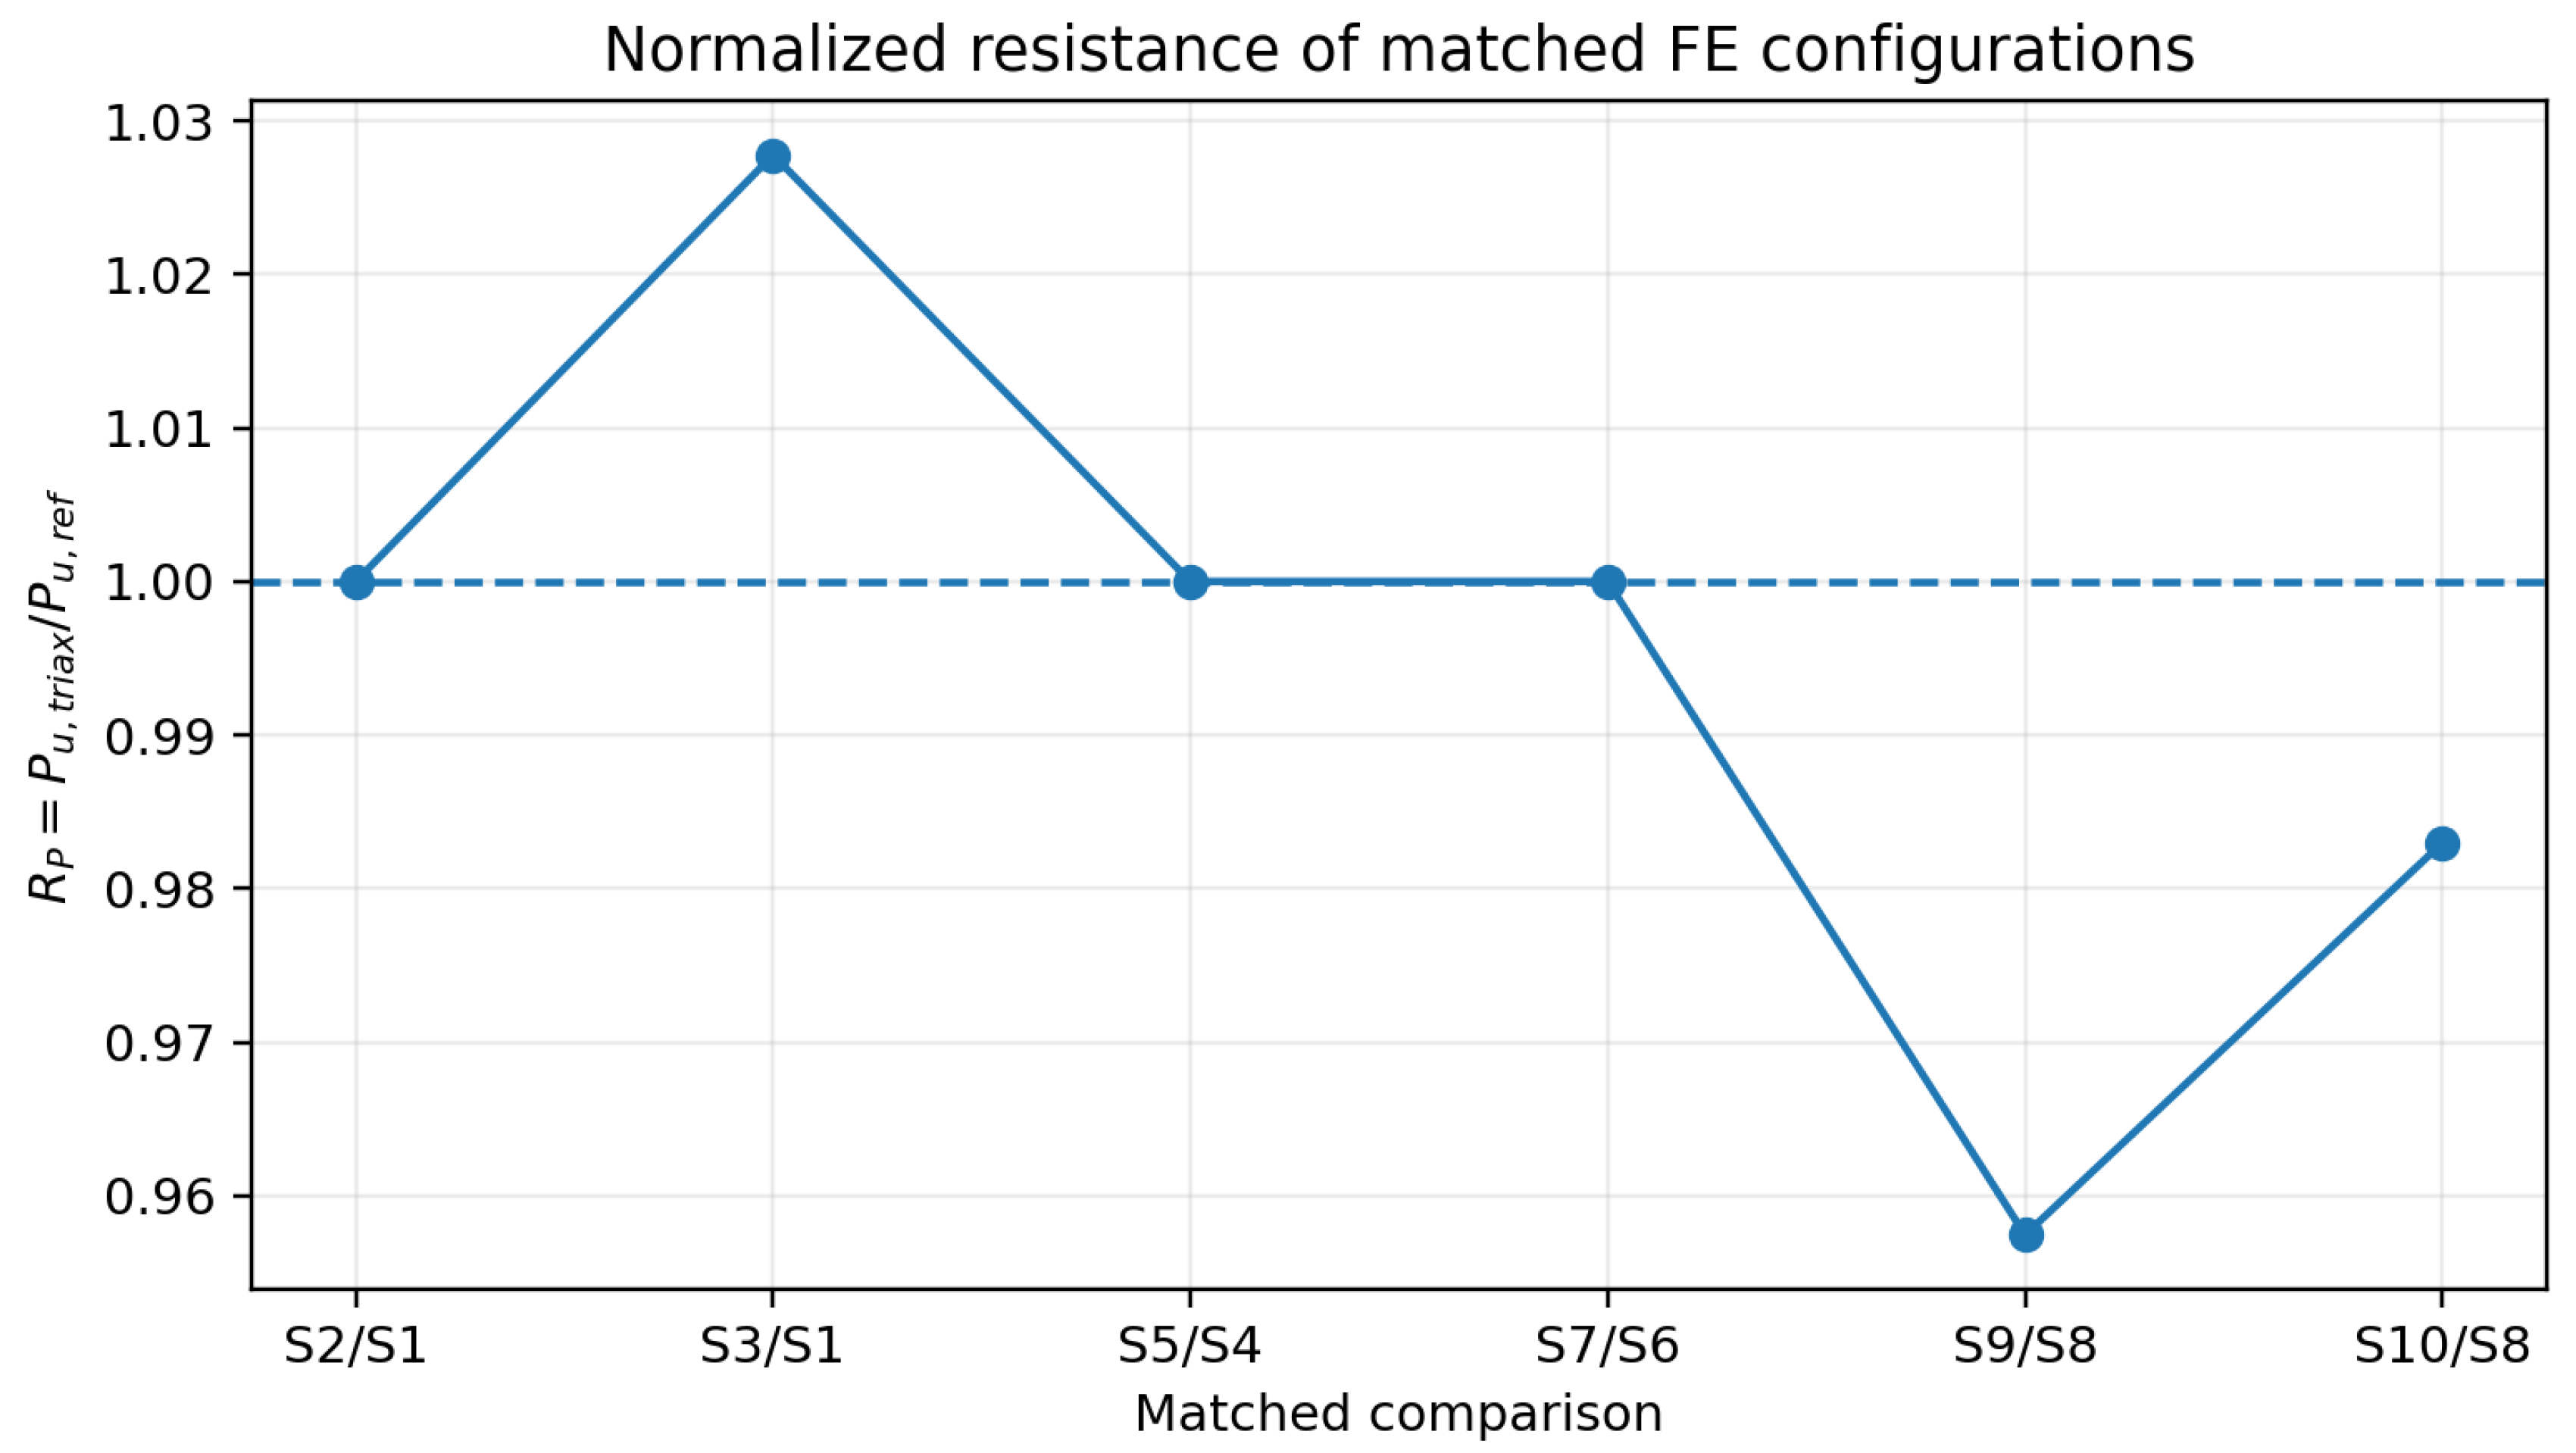
| Comparison | P_u,triax (kN/m2) | P_u,ref (kN/m2) | R_P | ΔP |
| S2/S1 | 36 | 36 | 1.000 | 0.0% |
| S3/S1 | 37 | 36 | 1.028 | +2.8% |
| S5/S4 | 28 | 28 | 1.000 | 0.0% |
| S7/S6 | 190 | 190 | 1.000 | 0.0% |
| S9/S8 | 225 | 235 | 0.957 | −4.3% |
| S10/S8 | 231 | 235 | 0.983 | −1.7% |
The observed matched-pair range is approximately 0.957≤R_P≤1.028. These values are useful for calibration of the present numerical framework, but they are not proposed as universal acceptance limits because the matrix has not yet been independently validated by physical tests and has not demonstrated mesh convergence.
7. Scientific Status of the Proposed Determinants
| Level | Content | Interpretation |
| I—Derived | s_h=[3/(2R_h)]s_o; equal-steel s_h=1.5s_o; E_hex=0.75E_0; m_n=1.5m_0; 1/√3 projection coefficient | Mathematical consequences of the adopted idealization |
| II—Numerically calibrated | S1–S10 resistance ratios and S9 response | Observations from the present FE matrix |
| III—Research hypotheses | R_h=0.50; k=0.60; 1.85d spacing bound; bar-diameter envelope | Require parametric and experimental validation |
| IV—Mandatory checks | Flexure, shear, punching, minimum steel, cracking, deflection, anchorage, cover, durability and constructability | Remain required irrespective of topology |
The distinction “Derived ≠ Calibrated ≠ Proposed ≠ Code-mandated” is retained as a governing editorial principle for the paper.
8. Parametric Interpretation and Sensitivity
The following curve is an analytical sensitivity plot generated from the equations of the framework. It is intended to reveal governing trends and is not additional experimental evidence.
Figure 6.
Illustrative spacing envelope versus slab thickness using d≈0.833h; the 1.85d term is a research hypothesis.
Figure 6.
Illustrative spacing envelope versus slab thickness using d≈0.833h; the 1.85d term is a research hypothesis.
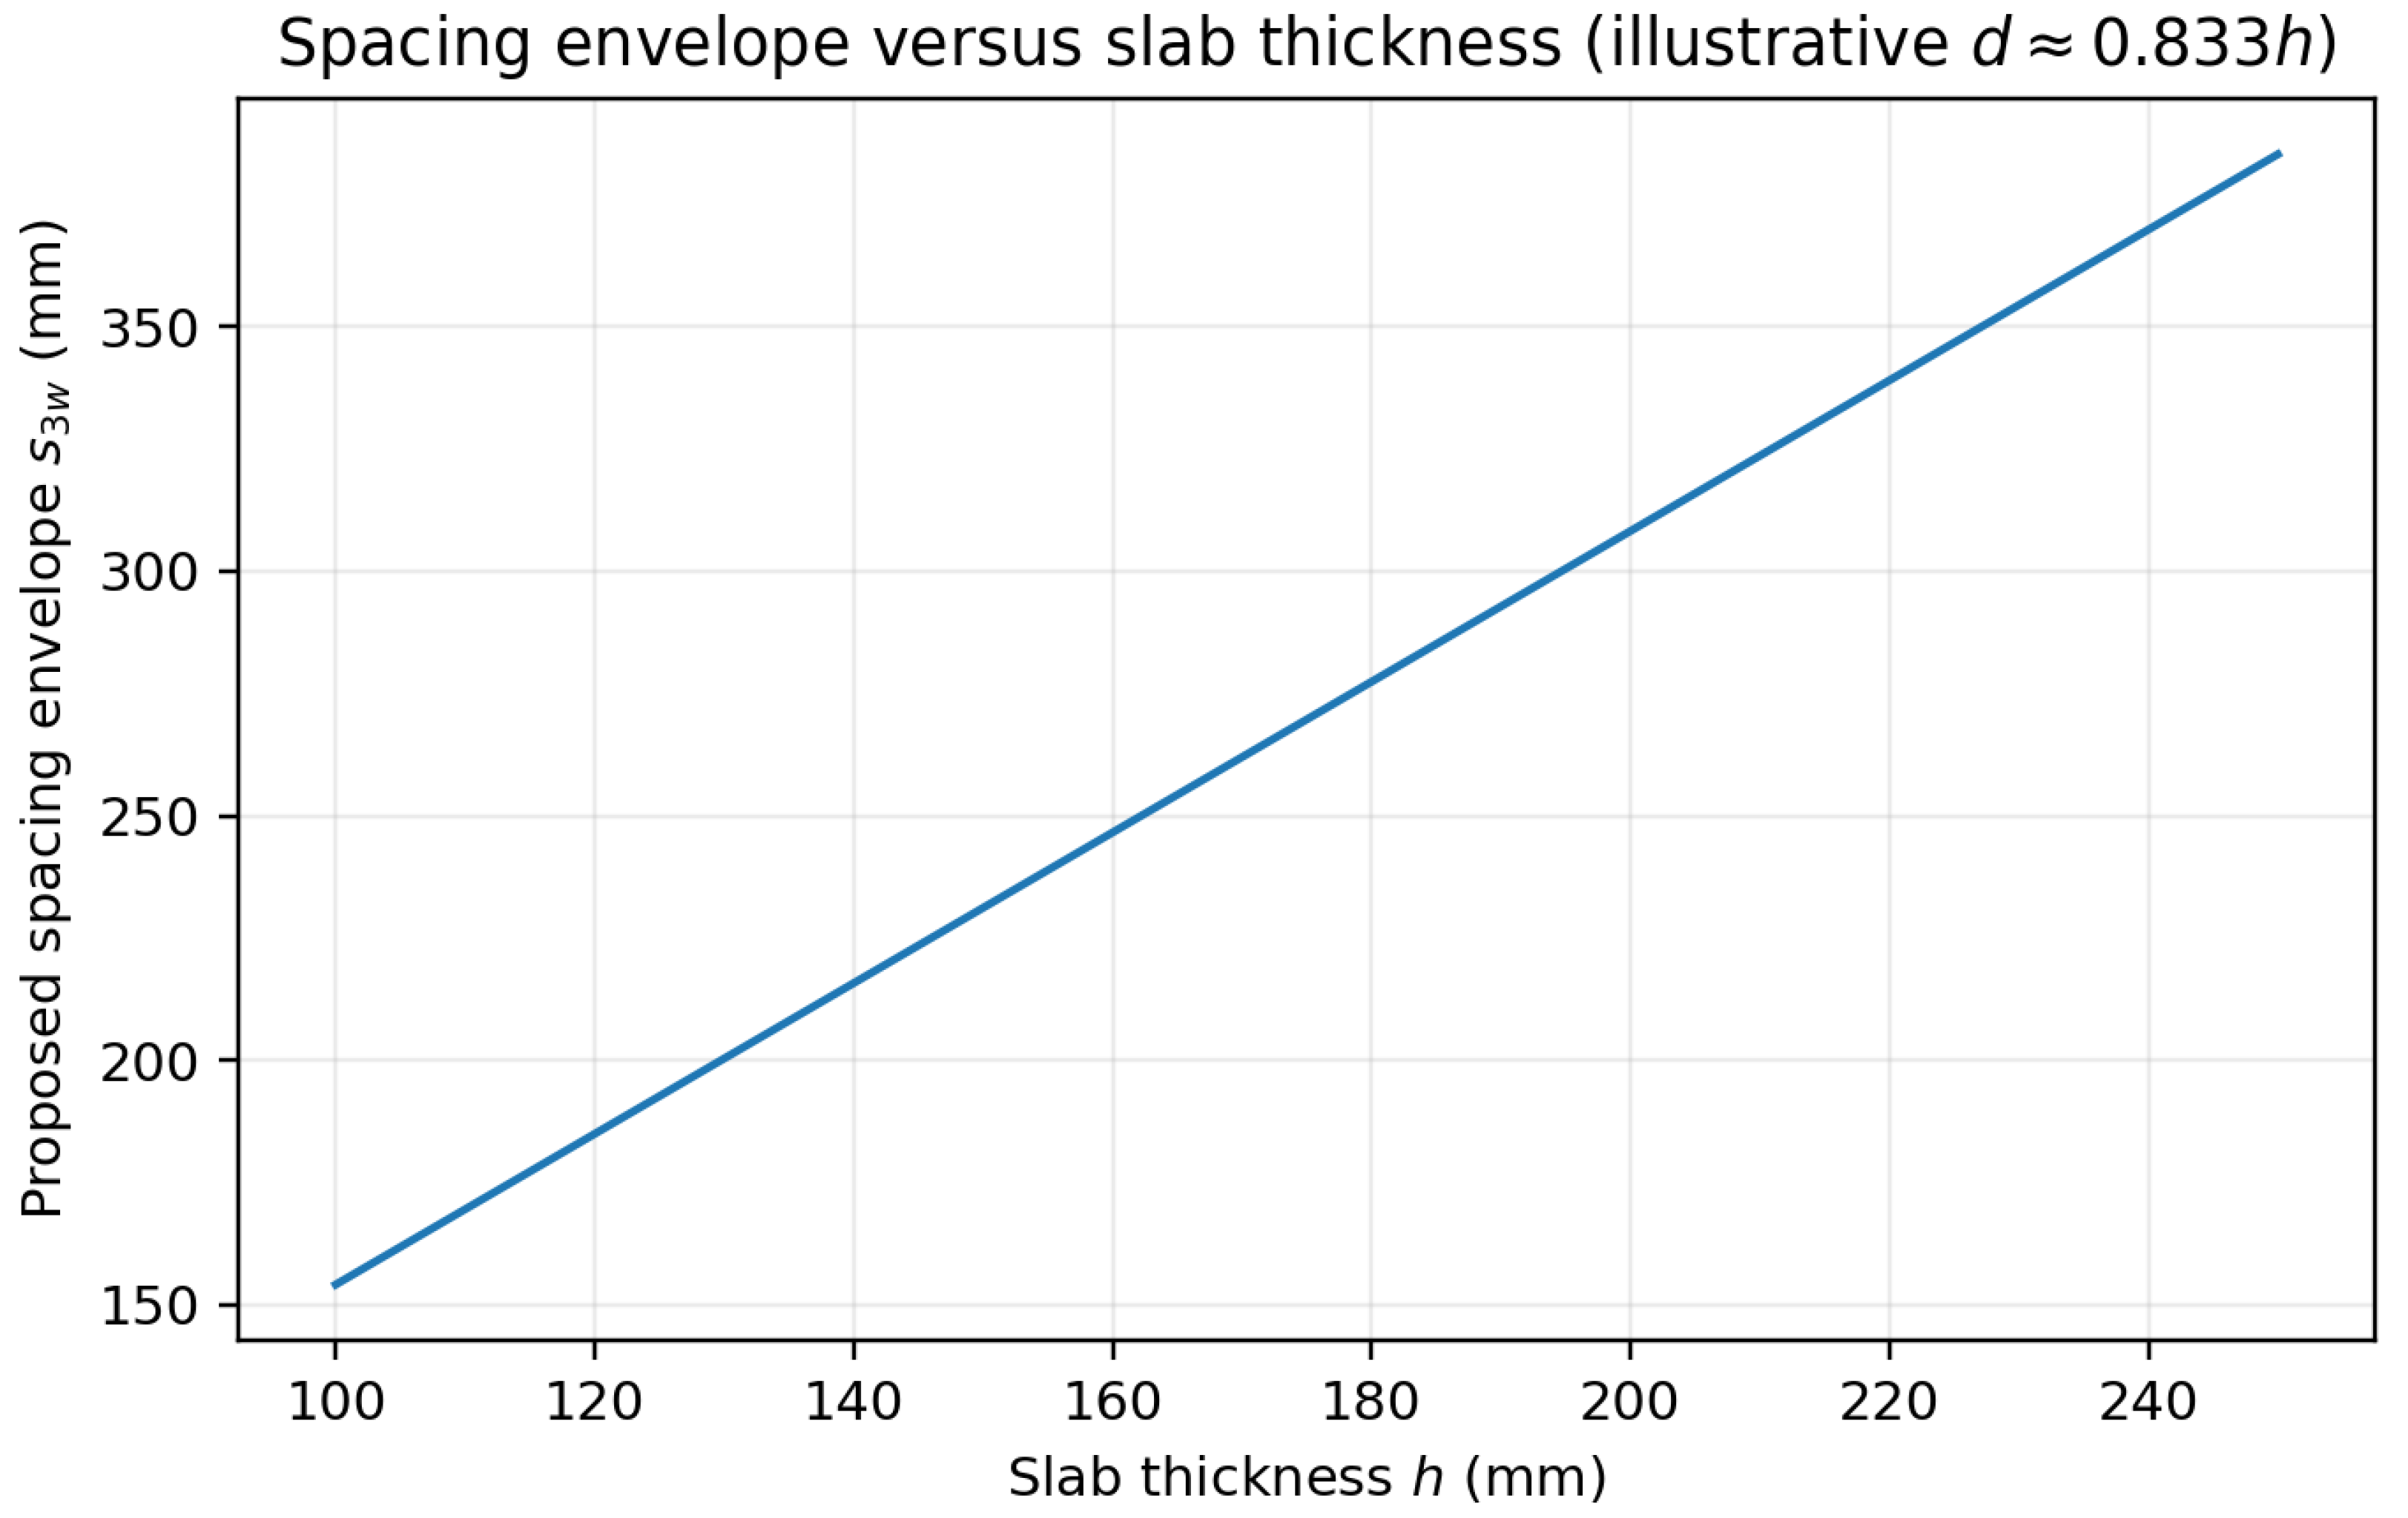
The spacing curve demonstrates a nonlinear practical consequence of reinforcement reduction: as R_h decreases, the quantity-equivalent spacing increases rapidly. Consequently, a reduction strategy that is feasible from a steel-volume perspective can become infeasible from a spacing or crack-control perspective. This is why the governing envelope in Equation (19) is necessary.
9. Final Interpretation of the 1.83 × 1.83 m Demonstration
The 1.83 × 1.83 m demonstration is treated here as a simply supported square reinforced-concrete slab supported continuously along all four edges. This boundary condition is consistent with the ABAQUS models in the reference study, in which U_z = 0 is imposed along each line of edge nodes while slab rotation remains free. The reference models all have a plan dimension of 1.83 × 1.83 m and use four slab thicknesses of 67, 76, 180, and 200 mm. [16,17]
The full slab span L = 1.83 m is used for the four-sided simply supported panels. For the present screening design, the design bending demand in each principal direction is evaluated from the square two-way plate response, and the reinforcement is then selected using a preliminary code-based flexural check with d = h − 25 mm, together with a minimum-reinforcement check. The resulting reinforcement layouts are preliminary code-designed counterparts to the original ABAQUS configurations and are not treated as replacements for the subsequent nonlinear finite-element verification.
The four proposed code-designed cases were deliberately matched to four direct counterparts among the ten original ABAQUS slabs. Case 1 corresponds directly to S4 (h = 67 mm, w_u = 28 kN/m2), Case 2 to S1 (h = 76 mm, w_u = 36 kN/m2), Case 3 to S6 (h = 180 mm, w_u = 190 kN/m2), and Case 4 to S10 (h = 200 mm, w_u = 231 kN/m2). These values are the reported ultimate FE pressures in the original study. [16,17]
The matched code-based layouts are summarized below. The reinforcement areas are expressed per metre width in each principal reinforcement direction for the two-way code-designed slabs.
| Case | Direct ABAQUS counterpart | h (mm) | Target FE pressure w_u (kN/m2) | Original ABAQUS reinforcement | Code-designed reinforcement | A_s,req (mm2/m) | A_s,prov (mm2/m) |
| Case 1 | S4 | 67 | 28 | Ø4.76 @ 120 mm, two orthogonal families | Ø8 @ 120 mm, two-way | 339 | 418.9 |
| Case 2 | S1 | 76 | 36 | Ø4.76 @ 120 mm, two orthogonal families | Ø8 @ 130 mm, two-way | 349 | 386.7 |
| Case 3 | S6 | 180 | 190 | Ø4.76 @ 120 mm, two orthogonal families | Ø10 @ 130 mm, two-way | 566 | 604.2 |
| Case 4 | S10 | 200 | 231 | Ø4.76 @ 180 mm, three families at 0°/60°/120° | Ø10 @ 120 mm, two-way | 606 | 654.5 |
The original ABAQUS study specifies Ø4.76 mm reinforcement. S1 and S4 use orthogonal reinforcement at 120 mm spacing, while S6 also uses the orthogonal configuration. S10 belongs to the triaxial/hexagonal group and uses the 180 mm arrangement with three reinforcement directions. [16,17]
For the original ABAQUS reinforcement, the area of one Ø4.76 mm bar is approximately 17.80 mm2. Thus, for 120 mm spacing, the reinforcement intensity of one orthogonal family is approximately 148.3 mm2/m, and the two-family total is approximately 296.6 mm2/m. For the S10 three-family arrangement at 180 mm spacing, the corresponding intensity is approximately 98.9 mm2/m per family, or approximately 296.6 mm2/m when the three families are considered together.
A direct quantity comparison is therefore obtained as follows:
| Case | ABAQUS model | ABAQUS total reinforcement area (mm2/m) | Code model | Code total reinforcement area (mm2/m) | Difference relative to ABAQUS |
| Case 1 | S4 | 296.6 | Ø8 @ 120, two-way | 837.8 | +182.5% |
| Case 2 | S1 | 296.6 | Ø8 @ 130, two-way | 773.3 | +160.7% |
| Case 3 | S6 | 296.6 | Ø10 @ 130, two-way | 1208.3 | +307.4% |
| Case 4 | S10 | 296.6 | Ø10 @ 120, two-way | 1309.0 | +341.4%* |
| * The Case 4 comparison should be interpreted with caution because S10 uses three reinforcement families, whereas the proposed code-designed Case 4 uses two orthogonal families. Therefore, the total steel-area comparison describes total embedded steel quantity, but it does not represent identical reinforcement topology. | |||||
The comparison indicates that the reinforcement quantities embedded in the original ABAQUS models are substantially smaller than those obtained from the present preliminary code-based flexural screening. This difference should not, by itself, be interpreted as evidence that either approach is incorrect. The original models were constructed primarily as nonlinear finite-element configurations for studying the influence of reinforcement topology and nominal steel quantity. The model set deliberately varies reinforcement topology and nominal ratio among S1–S10 rather than applying a single conventional code-design procedure to all ten slabs. The reported matrix includes orthogonal, triaxial/hexagonal half-ratio, triaxial/hexagonal same-ratio, and double-ratio configurations. [16,17]
Consequently, the appropriate interpretation of the present demonstration is not that the code-designed reinforcement should simply replace the original ABAQUS reinforcement. Instead, the two configurations should be treated as two different reinforcement design bases: (1) the original research configurations used in the ABAQUS simulations, and (2) newly generated code-based reinforcement layouts having the same slab dimensions, thicknesses, and target loading levels. The code-designed configurations should subsequently be re-modelled in ABAQUS using the same nonlinear material formulation, element types, reinforcement representation, embedded interaction, mesh-convergence procedure, and simply supported boundary conditions used for the reference models. The original study employs C3D8R concrete elements and T3D2 reinforcement elements with embedded interaction/perfect bond. [16,17]
The resulting comparison therefore establishes a more controlled framework for evaluating the proposed reinforcement concept. For each thickness level, the principal variables are held constant at a plan dimension of 1.83 × 1.83 m and a specified target pressure, while the reinforcement quantity and topology are varied. The principal response measures should then be the ultimate load, central deflection, crack-pattern development, principal concrete strains/stresses, and reinforcement stress/strain history. The ABAQUS results for the original configurations provide the reference response, while the code-designed models provide an independent reinforcement baseline.
Accordingly, the 1.83 × 1.83 m demonstration does not support direct transfer of a single bar size or spacing from one slab geometry to another. Rather, it demonstrates that the reinforcement arrangement must be re-derived for each thickness and loading condition, after which the proposed layouts must be verified through mesh-converged nonlinear ABAQUS analysis. In particular, any conclusion regarding reinforcement reduction in the triaxial/hexagonal configuration should be based on equal-dimensional, equal-thickness, and equal-loading comparisons with the corresponding orthogonal and code-designed models, followed by numerical and, where possible, experimental validation.
10. Discussion
The reorganized results indicate that the principal scientific question is not whether three reinforcement directions can be drawn within a slab, but whether their topology can be transformed into a reproducible design procedure. The exact density relation is the most robust part of the framework because it follows directly from counting reinforcement families per unit spacing. By contrast, the 50% reduction target is conditional and must be tested against spacing, minimum reinforcement, flexure, shear, punching, serviceability, and detailing.
The analytical stiffness and moment expressions provide a mechanistic basis for studying directional symmetry, but they are idealized. Real reinforced-concrete slabs include cracking, bond, concrete tension stiffening, nonlinear compression, anchorage, membrane action, boundary restraint, and redistribution after yielding. The FE matrix provides a first numerical calibration, but the present evidence does not isolate the proposed confinement or membrane mechanisms directly from ABAQUS stress and energy fields.
The S9 result is particularly useful for framing the load-transfer discussion. Its reported geometric/strut angle of approximately 23.6° is close to, but below, a 25° discrete STM reference angle, while the modeled resistance remains relatively high. The scientifically defensible interpretation is not that 23.6° should replace 25°, but that a single discrete STM angle should not be treated as a universal acceptance criterion for a continuum triaxial slab. Direct stress-trajectory extraction and dedicated STM comparisons are required.
11. Limitations and Required Validation
• Mesh convergence has not yet been demonstrated for the ten FE models.
• Only one underlying CDP material input was used; specimen-specific concrete strengths were not independently varied as a controlled parameter.
• Independent experimental validation of the triaxial specimens is absent.
• The proposed confinement and strain-energy mechanisms were not directly extracted from ABAQUS stress and energy fields.
• The FE models assume perfect bond and do not reproduce shrinkage, drying, or curing microcracking.
• The effective-depth basis should be unified before final publication, particularly for S9 d/s and angle calculations.
• The proposed 1.85d spacing bound, k=0.60, and 50% reduction target require parametric studies and physical testing before generalized design use.
Future validation should vary slab thickness, reinforcement ratio, bar diameter, spacing, aspect ratio, boundary restraint, and load position. Measurements should include crack widths, reinforcement strains in all three directions, principal concrete stresses, membrane/hoop forces, load-deflection response, and full-field deformation.
12. Conclusions
1. The revised paper establishes a four-axis framework that connects reinforcement topology, quantity, structural verification, and load-transfer geometry.
2. The exact quantity-equivalence relation is s_h=[3/(2R_h)]s_o; consequently, equal total steel corresponds to 1.5s_o, R_h=0.60 corresponds to 2.5s_o, and the nominal R_h=0.50 target corresponds to 3s_o before spacing caps.
3. The idealized equal-steel relations E_hex=0.75E_0 and m_n=1.5m_0 are mathematical results of the adopted mesh model and should not be interpreted as direct experimental strength multipliers.
4. The 50% total-steel reduction and k=0.60 are research hypotheses rather than code provisions or universal design limits.
5. The governing reinforcement requirement should be obtained from the maximum of flexural, deformation, cracking, shear, punching, and detailing/minimum-reinforcement requirements.
6. The S1–S10 FE matrix provides model-specific calibration, including R_P≈1.000 for S1/S2 and S4/S5, R_P≈1.000 for S6/S7, and R_P≈0.957 for S9/S8.
7. The 1.83 × 1.83 m demonstration, matched to four of the original ABAQUS specimens under four-edge simply supported conditions, shows that preliminary code-based reinforcement quantities substantially exceed the reinforcement embedded in the reference finite-element models; any claimed reduction must therefore be verified through matched nonlinear re-analysis rather than assumed from steel quantity alone.
8. The principal research contribution is therefore the integrated determinant framework and its explicit separation of derived equations, numerical observations, research hypotheses, and code-mandated checks.
Author Contributions
This manuscript distinguishes source-supported evidence from analytical inference and research hypotheses. The proposed triaxial determinant framework is intended for continued research, numerical verification, and experimental validation before any generalized design adoption.
References
- Gibson, L.J.; Ashby, M.F. Cellular Solids: Structure and Properties, 2nd ed.; Cambridge University Press: Cambridge, UK, 1997. [Google Scholar]
- Hales, T.C. The Honeycomb Conjecture. Discret. Comput. Geom. 2001, 25(1), 1–22. [Google Scholar] [CrossRef]
- Deshpande, V.S.; Fleck, N.A.; Ashby, M.F. Effective properties of the octet-truss lattice material. J. Mech. Phys. Solids 2001, 49(8), 1747–1769. [Google Scholar] [CrossRef]
- Thompson, D.W. On Growth and Form; Cambridge University Press: Cambridge, UK, 1917. [Google Scholar]
- Papka, S.D.; Kyriakides, S. In-plane compressive response and crushing of honeycombs. J. Mech. Phys. Solids 1994, 42(10), 1499–1532. [Google Scholar] [CrossRef]
- Masters, I.G.; Evans, K.E. Models for the elastic deformation of honeycombs. Philos. Trans. R. Soc. A 1996, 354(1717), 2791–2817. [Google Scholar]
- Evans, A.G.; Hutchinson, J.W.; Fleck, N.A.; Ashby, M.F.; Wadley, H.N.G. The topological design of multifunctional cellular metals. Prog. Mater. Sci. 2001, 46(3–4), 309–327. [Google Scholar] [CrossRef]
- Mander, J.B.; Priestley, M.J.N.; Park, R. Theoretical stress-strain model for confined concrete. J. Struct. Eng. 1988, 114(8), 1804–1826. [Google Scholar] [CrossRef]
- Richart, F.E.; Brandtzaeg, A.; Brown, R.L. A Study of the Failure of Concrete under Combined Compressive Stresses; Bulletin No. 185; University of Illinois Engineering Experiment Station: Urbana, IL, USA, 1928. [Google Scholar]
- Baumann, T. Zur Frage der Netzbewehrung von Flächentragwerken. Der Bauing. 1972, 47(10), 367–377. [Google Scholar]
- Park, R.; Gamble, W.L. Reinforced Concrete Slabs, 2nd ed.; John Wiley & Sons: New York, NY, USA, 2000. [Google Scholar]
- Johansen, K.W. Yield-Line Theory; Cement and Concrete Association: London, UK, 1962. [Google Scholar]
- ACI Committee 349. ACI CODE-349-23: Nuclear Safety-Related Concrete Structures—Code Requirements and Commentary; American Concrete Institute: Farmington Hills, MI, USA, 2024. [Google Scholar]
- ASME Boiler and Pressure Vessel Code, Section III, Division 2: Code for Concrete Containments; American Society of Mechanical Engineers.
- ACI Committee 318. ACI CODE-318-25: Building Code for Structural Concrete—Code Requirements and Commentary; American Concrete Institute: Farmington Hills, MI, USA, 2025. [Google Scholar]
- Taylor, R.; Maher, D.R.H.; Hayes, B. Effect of the arrangement of reinforcement on the behaviour of reinforced concrete slabs. Mag. Concr. Res. 1966, 18(55), 85–94. [Google Scholar] [CrossRef]
- Juma’a, M. Nonlinear Finite Element Analysis of the Effect of Reinforcement Arrangement on the Behaviour of Reinforced Concrete Slabs. M.Sc. Thesis, University of Basrah, Basrah, Iraq, 2013. [Google Scholar]
- Bastami, M.; Mousavi, A.; Abbasnejadfard, M. Evaluation of mechanical characteristics of high-strength reinforced concrete columns with hexagonal wire mesh under cyclic loading. Int. J. Concr. Struct. Mater. 2022, 16, 30. [Google Scholar] [CrossRef]
- Zhao, C.; Wang, Q.; Lu, X.; Wang, J. Numerical study on dynamic behaviors of NRC slabs in containment dome subjected to close-in blast loading. Thin-Walled Struct. 2019, 135, 269–284. [Google Scholar] [CrossRef]
- Kmiecik, P.; Kamiński, M. Modelling of reinforced concrete structures and composite structures with concrete strength degradation taken into consideration. Arch. Civ. Mech. Eng. 2011, 11(3), 623–636. [Google Scholar] [CrossRef]
- Hafezolghorani, M.; Hejazi, F.; Vaghei, R.; Jaafar, M.S.B.; Karimzade, K. Simplified damage plasticity model for concrete. Struct. Eng. Int. 2017, 27(1), 68–78. [Google Scholar] [CrossRef]
- Leitz, H. Zum Stand der Berechnung von kreuzweise bewehrten Platten. Der Bauing. 1923, 4(17), 495–499. [Google Scholar]
- Nielsen, M.P.; Hoang, L.C. Limit Analysis and Concrete Plasticity, 3rd ed.; CRC Press: Boca Raton, FL, USA, 2010. [Google Scholar]
- Rankin, G.I.B.; Long, A.E. Predicting the enhanced punching strength of high-strength concrete slabs. Proc. Inst. Civ. Eng. Build. 1997, 122(4), 403–413. [Google Scholar]
- Wang, S.; Ma, Y.; Deng, Z. Stretching-dominated truss lattice materials: Elastic anisotropy evaluation, control, and design. Compos. Struct. 2022, 298, 116004. [Google Scholar] [CrossRef]
- Aoyagi, Y.; Yamada, K.; Takahashi, T. Strength and deformational characteristics of three-way reinforced concrete containment models subjected to lateral forces. In Transactions of the 6th International Conference on Structural Mechanics in Reactor Technology (SMiRT 6), Paper J 4/6; North-Holland Publishing Company: Paris, France, 1981. [Google Scholar]
Disclaimer/Publisher’s Note: The statements, opinions and data contained in all publications are solely those of the individual author(s) and contributor(s) and not of MDPI and/or the editor(s). MDPI and/or the editor(s) disclaim responsibility for any injury to people or property resulting from any ideas, methods, instructions or products referred to in the content. |
© 2026 by the authors. Licensee MDPI, Basel, Switzerland. This article is an open access article distributed under the terms and conditions of the Creative Commons Attribution (CC BY) license (http://creativecommons.org/licenses/by/4.0/).
Copyright: This open access article is published under a Creative Commons CC BY 4.0 license, which permit the free download, distribution, and reuse, provided that the author and preprint are cited in any reuse.