

Submitted:
20 September 2026
Posted:
20 September 2026
You are already at the latest version
Abstract
Motor parks are high-activity urban environments where intensive passenger movement, transport operations, and waste generation intersect, yet quantitative evidence linking operational intensity with sanitation and waste-management conditions in Nigerian transport hubs remains limited. Understanding these interactions is necessary for developing targeted environmental health interventions. This study quantified structural and operational characteristics, waste-storage and disposal practices, policy perceptions, spatial differences in operational activity, and passenger utilisation intensity across six selected motor parks in Ilorin metropolis, Nigeria. A cross-sectional observational survey was conducted across six purposively selected motor parks representing public and private ownership structures. Facility-level data on establishment year, fleet size, daily passenger throughput, and passenger-per-vehicle ratio were collected. Among 72 surveyed participants, 36 respondents completed waste-management and policy assessment sections. Descriptive statistics, Wilson confidence intervals, chi-square goodness-of-fit tests, exact binomial testing, and facility-level comparative analyses were performed. Public parks had greater operational capacity than private parks, with mean fleet sizes of 45.0 ± 10.8 and 22.5 ± 3.5 vehicles, respectively, while private parks recorded higher passenger utilisation intensity (4.90 ± 0.14 versus 3.73 ± 0.43 passengers/vehicle/day). Fleet size strongly correlated with daily passenger throughput (Pearson r = 0.974; P = 0.001). Small waste bins were the predominant storage modality (22/36; 61.1%), followed by waste drums (12/36; 33.3%; χ² = 16.667; P < 0.001). Private waste collectors accounted for most disposal arrangements (33/36; 91.7%), and weekly evacuation was most common (28/36; 77.8%). Disposal costs of ≥₦5,000/month were reported by 27/36 respondents (75.0%; χ² = 15.44; P = 0.0015). Monthly sanitation policy ratings were favourable (31/36; 86.1%; P = 0.0014), whereas waste-commercialisation perceptions did not differ from a 50:50 distribution (P = 0.868). Ilorin South recorded the highest aggregate activity (85 vehicles; 330 passengers/day), and passenger utilisation intensity ranged from 3.33 to 5.00 passengers/vehicle/day. Motor parks exhibit substantial variation in operational pressure and sanitation requirements. Integrating transport activity indicators into sanitation planning, strengthening waste-service partnerships, and promoting resource-recovery approaches are recommended. Improved sanitation management in motor parks may reduce environmental exposure risks among passengers, transport workers, and surrounding communities while supporting healthier and more sustainable urban environments.
Keywords:
motor parks
; urban sanitation
; solid waste management
; passenger utilisation intensity
; environmental health
; waste disposal practices
; transport hubs
; circular economy
; nigeria
; urban public health
1. Introduction
Rapid urbanisation, population growth, and increasing mobility demands have intensified pressures on municipal sanitation systems, particularly in low- and middle-income countries where infrastructure development has not always kept pace with expanding urban activities (Olalekan et al., 2018; Raimi et al., 2019; 2019b; Gift & Olalekan, 2020; Gift et al., 2020; Omotoso et al., 2025). Solid waste generation has become a defining environmental challenge of contemporary cities, with inadequate collection, storage, transportation, and disposal systems contributing to environmental degradation, public health risks, and reduced urban liveability (United Nations Environment Programme [UNEP], 2019; Okoyen et al., 2020; Kumar et al., 2022; Raimi & Odubo, 2022; Morufu et al., 2022; Abiye et al., 2026). The World Health Organization (WHO) recognises that poorly managed waste can facilitate exposure to hazardous substances, biological contaminants, and vectors capable of transmitting disease, particularly among populations living and working in environments where sanitation services are limited (Raimi et al., 2017d; Raimi et al., 2019c; WHO, 2022; Morufu et al., 2021c; Olalekan et al., 2022; Yusuf et al., 2025; Olaniyi & Morufu, 2025; Henry & Morufu, 2025; Ndu et al., 2026). Although waste-management research has traditionally focused on households, municipal dumpsites, and industrial sources, increasingly dynamic urban spaces such as transport terminals and motor parks remain comparatively underexamined despite their continuous human activity, commercial interactions, and substantial waste-generation potential. Motor parks represent critical urban service environments where transportation activities intersect with sanitation, environmental management, and public health (Morufu et al., 2021c; Olalekan et al., 2022; Yusuf et al., 2025; Olaniyi & Morufu, 2025; Henry & Morufu, 2025; Ndu et al., 2026). These facilities accommodate large daily movements of passengers, drivers, traders, vehicle operators, and service providers, creating concentrated points of waste generation through food vending, packaging materials, vehicle maintenance activities, and passenger consumption patterns (Odipe et al., 2018; Henry et al., 2019; Adindu et al., 2025; Blossom et al., 2026). Evidence from Nigerian cities indicates that the location and management of motor parks influence surrounding environmental conditions, with poorly planned facilities associated with sanitation concerns, environmental nuisance, and pressure on adjacent communities (Adeogun et al., 2022). In Minna, for example, the siting of intercity motor parks was reported to have implications for neighbouring environmental conditions, highlighting the importance of integrating transport infrastructure planning with environmental management strategies (Adeogun et al., 2022). Similarly, studies from Ibadan have documented sanitation deficiencies within major motor parks, including concerns relating to toilet functionality, cleanliness, and waste-disposal practices, demonstrating that transport environments require dedicated assessment rather than being treated as extensions of general municipal waste systems (Olanrewaju et al., 2023; Ibekwe et al., 2018).
Within Nigeria, rapid urban expansion has created additional challenges for sustainable waste governance, particularly in cities where informal and formal systems operate simultaneously. Ilorin, the capital of Kwara State, has experienced increasing urban complexity, accompanied by concerns regarding waste accumulation, disposal practices, and environmental sanitation management (Raufu et al., 2023; Raufu & Raimi, 2023). Previous investigations in Ilorin have examined broader municipal waste-management challenges, public perceptions of central waste storage, and occupational risks among waste scavengers, revealing persistent gaps in waste handling systems and environmental health protection (Raufu et al., 2022; Raufu et al., 2023; Yusuf et al., 2023). Furthermore, the growth and operation of motor parks within Ilorin have raised concerns regarding urban organisation, including the emergence of informal transport facilities and associated environmental pressures (Ahmed, 2016). However, existing evidence has largely focused on general waste-management challenges or individual sanitation components, providing limited quantitative understanding of how motor park characteristics, operational intensity, passenger flows, ownership structures, and waste-management practices interact within the same analytical framework. Building on these unresolved questions, a more integrated understanding of motor parks as complex urban systems is needed, particularly because sanitation performance cannot be separated from operational scale, human movement patterns, governance arrangements, and resource-management opportunities. Existing waste-management approaches increasingly emphasise the transition from disposal-oriented systems towards circular and resource-efficient models that promote recovery, recycling, and value generation from waste streams (Taelman et al., 2020; Kurniawan et al., 2023). However, the application of such approaches in high-activity public spaces, including transport terminals, requires empirical evidence on the quantity and characteristics of waste-management practices, available storage options, disposal pathways, service frequency, and associated economic arrangements. In developing urban settings, inadequate waste segregation, irregular evacuation, and limited recovery mechanisms remain important barriers to sustainable waste systems (Anokye et al., 2024; Oboche, 2024). Consequently, understanding how waste is managed within motor parks provides an opportunity to identify operational constraints and assess pathways for improved sanitation governance and circular economy interventions.
Despite increasing attention to urban waste challenges, important knowledge gaps remain regarding the relationship between transport facility characteristics and environmental sanitation outcomes. Most available studies in Nigeria have examined waste practices among households, waste workers, or communities, while fewer studies have quantitatively evaluated motor parks as distinct operational environments. For instance, research on waste disposal in Nigerian urban communities has highlighted the influence of behavioural, socioeconomic, and infrastructural factors on disposal practices (Adogu et al., 2015; Musa et al., 2021; Iyasele & Dangana, 2023), but these findings cannot fully explain the unique dynamics of motor parks where waste generation is shaped by passenger volumes, vehicle turnover, commercial activities, and institutional management structures. Similarly, previous Ilorin-focused studies have provided important insights into municipal waste challenges and environmental sanitation concerns (Raufu et al., 2025; Raufu & Raimi, 2023), yet limited evidence exists on how individual motor parks differ in operational capacity, passenger utilisation intensity, ownership arrangements, and waste-management performance. Addressing this gap is particularly relevant because variations in facility scale and passenger throughput may influence waste-generation pressure, sanitation demands, and the feasibility of targeted management interventions. This study therefore adopts an integrated quantitative assessment of sanitation, waste management, and operational intensity across six selected motor parks in Ilorin, Nigeria. By combining measurements of fleet size, passenger throughput, passenger-to-vehicle ratios, waste-storage modalities, disposal pathways, evacuation frequency, disposal costs, and perceptions of sanitation and waste-commercialisation policies, the study provides a multidimensional assessment of motor park sustainability. Such an approach moves beyond descriptive evaluations of waste problems by examining how operational characteristics and management practices collectively shape environmental conditions within transport environments. Specifically, this study aims to: (1) quantify the structural and operational characteristics of the six Ilorin motor parks and examine differences in operational scale by park ownership type using fleet size, daily passenger throughput, and passengers per vehicle; (2) quantify the distribution of waste-storage modalities among respondents across the selected motor parks; (3) assess waste-disposal practices through disposal channels, waste-evacuation frequency, and monthly disposal costs; (4) quantify respondents’ ratings of monthly sanitation and waste-commercialisation policies and test whether waste-commercialisation ratings differ from a prespecified 50%-50% indifference distribution; (5) compare aggregate operational capacity and passenger throughput across Ilorin West, Ilorin East, and Ilorin South Local Government Areas; and (6) quantify passenger utilisation intensity using daily passenger-to-vehicle ratios and describe variation in operational intensity among facilities.
1. Methods
1.1. Study Design and Reporting Framework
This study employed a quantitative cross-sectional observational design to assess sanitation conditions, waste-management practices, and operational intensity across selected motor parks in Ilorin metropolis, Kwara State, Nigeria. The study was structured to examine motor parks as integrated urban service environments where transport operations, passenger movement, sanitation infrastructure, waste-generation processes, and management arrangements interact. The methodology was developed in accordance with the principles of transparent reporting for observational studies recommended by the Strengthening the Reporting of Observational Studies in Epidemiology (STROBE) statement (von Elm et al., 2007). The analytical framework consisted of three interconnected components: (i) facility-level operational characteristics, including ownership type, fleet size, daily passenger throughput, and passenger utilisation intensity; (ii) respondent-level sanitation and waste-management practices, including waste-storage modalities, disposal channels, evacuation frequency, and disposal costs; and (iii) respondent perceptions of sanitation and waste-commercialisation policies. Two analytical units were therefore considered. First, the motor park was treated as the unit of analysis for facility-level indicators, with six selected motor parks representing six independent operational environments. Second, individual respondents were treated as the unit of analysis for questionnaire-derived sanitation, waste-management, and policy perception variables.
2.2. Study Area
The study was conducted in Ilorin metropolis, the capital city of Kwara State, North-Central Nigeria. Ilorin is geographically located approximately at latitude 8.4966° N and longitude 4.5421° E and serves as an important administrative, commercial, and transportation centre linking northern and southern regions of Nigeria. The metropolis comprises three Local Government Areas (LGAs): Ilorin West, Ilorin East, and Ilorin South. The city has experienced progressive urban expansion, increasing population density, and growing transportation demand, which have placed additional pressure on environmental sanitation infrastructure and municipal waste-management systems (Raufu et al., 2023; Raufu & Raimi, 2023). Motor parks constitute important urban activity centres because they concentrate passengers, drivers, transport operators, traders, and service providers within limited spaces. These activities generate multiple waste streams, including food waste, packaging materials, and general municipal waste, requiring organised storage, collection, and disposal systems (NPC, 2016; Ibekwe et al., 2018; Kumar et al., 2022). Previous studies in Ilorin have documented challenges associated with solid waste management, waste handling practices, and occupational risks among waste workers (Raufu et al., 2022; Yusuf et al., 2023). However, limited quantitative evidence exists regarding how operational characteristics of individual motor parks influence sanitation requirements and waste-management practices.
2.3. Description and Selection of Motor Parks
Six motor parks were included in the study to capture variation in ownership structure, operational scale, and geographical distribution across Ilorin metropolis. Selection was purposive to include both publicly managed/transport-union-associated parks and privately operated facilities, allowing comparison of operational characteristics and management practices. The selected parks included:
2.3.1. Sawmill Garage (8.5000° N, 4.5500° E)
Sawmill Garage is among the established transport facilities in Ilorin and has historically functioned as a major intercity transportation hub. The facility is operated through transport associations, including the National Union of Road Transport Workers (NURTW) and other transport stakeholder groups, serving routes connecting Ilorin with southwestern Nigeria.
2.3.2. Maraba Garage (8.4945° N, 4.5699° E)
Established as one of the older transport locations in the metropolis, Maraba Garage serves as a major passenger interchange connecting Ilorin with northern Nigerian destinations. Its strategic location contributes to substantial daily passenger movement.
2.3.3. Bekki and Son Motor Park (8.4960° N, 4.5450° E)
Bekki and Son represents a privately managed transport facility established to support local and regional transportation services. Its inclusion provided representation of private ownership structures within the study.
2.3.4. Ero Omo Garage (8.4970° N, 4.5400° E)
Ero Omo Garage is an established transport location serving short-distance and regional travel routes, particularly towards southwestern destinations and communities within Kwara State.
2.3.5. Kasmag Motors (8.4950° N, 4.5430° E)
Kasmag Motors is a privately operated transport facility recognised for organised fleet operations and structured passenger services.
2.3.6. Okin Express (8.4930° N, 4.5700° E)
Located along the Maraba-Sango transport corridor, Okin Express provides regional passenger services, particularly towards northern parts of Nigeria.
The geographic coordinates of all selected parks were recorded using handheld Global Positioning System (GPS) devices and subsequently used for spatial visualisation of park distribution patterns within Ilorin metropolis.
2.4. Study Population and Sampling Procedure
The study population comprised transport operators, drivers, and relevant personnel working within the selected motor parks. A total of 72 respondents were recruited across the six motor parks. Eligible participants were individuals actively engaged in transport-related activities within the selected facilities and who possessed sufficient operational experience to provide information regarding motor park operations, sanitation conditions, waste handling, and management practices. Respondents who were not directly involved in motor park activities or who were unwilling to participate were excluded. Because not all respondents completed every questionnaire component, analytical populations differed according to study objective. Operational characteristics were assessed at the facility level (six motor parks), whereas waste-management practices and policy perception analyses were conducted among the 36 respondents who completed the relevant sections.
2.5. Sampling Strategy
Six motor parks were selected purposively to ensure representation of different ownership structures and operational contexts. Within each selected park, respondents were recruited using simple random sampling among available eligible operators and drivers. The final respondent distribution consisted of 72 recruited participants, while 36 respondents provided complete responses for sanitation, waste-management, and policy-related questions. The use of separate analytical populations reflects the hierarchical structure of the study, where motor parks represent facility-level operational units and respondents represent individual perceptions and reported practices.
2.6. Data Collection Instrument and Administration
Data were collected using a structured questionnaire developed from previous studies examining sanitation and solid waste-management practices in Nigerian urban settings (Ibekwe et al., 2018; Raufu et al., 2023), comprising four major sections: respondent characteristics (demographic and occupational information); motor park operational characteristics (ownership type, fleet size, daily passenger throughput, and vehicle utilisation indicators); waste-management practices (waste-storage modalities, disposal channels, evacuation frequency, and monthly disposal costs); and policy perception assessment (ratings of the monthly sanitation policy and the waste-commercialisation policy). In addition, direct observations were conducted within each motor park to document visible sanitation arrangements and to contextualise the questionnaire responses.
2.7. Measurement and Operational Definition of Variables
Facility-level variables
Fleet size
Fleet size was defined as the number of active vehicles operating within each motor park during the assessment period.
Daily passenger throughput
Daily passenger throughput was defined as the estimated number of passengers served by each motor park per day.
Passenger utilisation intensity
Passenger utilisation intensity was calculated as:
This indicator was used to quantify operational intensity independent of absolute facility size.
Respondent-level variables
Waste-storage modality
Waste-storage modality was categorised according to reported storage methods, including:
- small waste bins;
- waste drums;
- nylon bags.
Waste-disposal practices
Waste-disposal practices included:
- disposal channel;
- waste evacuation frequency;
- monthly disposal expenditure.
Policy perception variables
Sanitation policy ratings were categorised as:
- Excellent;
- Good;
- Poor.
Waste-commercialisation policy ratings were categorised as:
- Good;
- Bad.
2.8. GIS Data Acquisition and Spatial Analysis
Spatial coordinates of the six motor parks were collected in the field using a handheld Global Positioning System (GPS) receiver (Garmin eTrex 10; horizontal accuracy ≈ 3-5 m under open-sky conditions). Geographic locations were mapped to demonstrate the spatial distribution of selected facilities across Ilorin metropolis. GIS analysis was descriptive and used to visualise facility clustering along major transport corridors. Spatial analysis was not used to infer causal relationships between location and sanitation outcomes. All coordinates were recorded in decimal degrees using the WGS 84 geographic coordinate system (EPSG:4326) and subsequently projected to WGS 84 / UTM zone 32N (EPSG:32632) for mapping and distance-based visualisation, which is appropriate for central Nigeria, including Ilorin. Mapping and spatial visualisation were performed using QGIS version 3.28.
2.9. Data Management and Quality Assurance
Completed questionnaires were reviewed for completeness before data entry. Data were coded using predefined variable classifications to minimise transcription errors. Facility-level and respondent-level datasets were maintained separately to preserve the correct unit of analysis. Quality checks included verification of categorical coding, review of missing responses, and consistency checks between reported fleet size and passenger throughput values.
2.10. Statistical Analysis
Statistical analyses were performed according to the analytical objective and unit of observation, with descriptive statistics used to summarise categorical variables as frequencies and percentages and continuous variables, including fleet size, passenger throughput, disposal costs, and passenger-to-vehicle ratios; summarised using appropriate measures of central tendency and dispersion. For facility-level analyses, operational characteristics were summarised across the six motor parks, ownership-type comparisons were interpreted descriptively given the inclusion of only six facilities, and relationships between passenger throughput and fleet size were examined using correlation and regression approaches. For respondent-level analyses, distributions of waste-storage modalities, disposal channels, evacuation frequency, and disposal costs were assessed using frequencies and percentages; Wilson score 95% confidence intervals were calculated for proportions where appropriate; Pearson chi-square goodness-of-fit tests were used to compare observed distributions against specified expected distributions; and an exact binomial test was used to evaluate whether waste-commercialisation ratings differed from the prespecified 50%-50% indifference distribution. Statistical significance was assessed at an alpha level of 0.05, and was performed using SPSS version 22.0 (IBM Corp.). Results were presented in tables and charts to facilitate interpretation and support evidence-based recommendations for sustainable waste management.
2.11. Ethical Considerations
The Institutional Review Board of the Federal University of Health Sciences Research Ethics Committee approved the study (approval number: FUHS/EH/2025/018) before data collection began. All participants were informed of the study's purpose, their voluntary participation, confidentiality procedures, and their right to withdraw at any stage. Written informed consent was obtained before questionnaire administration. No personally identifiable information was collected during the study.
2.12. Data Availability Statement
The dataset generated and analysed during the current study will be made available from the corresponding author upon reasonable request, subject to ethical and confidentiality considerations.
2.13. Code Availability Statement
The statistical analysis code used for data processing and statistical evaluation will be made available upon reasonable request.
1. Results
3.1. Structural and Operational Characteristics of Selected Motor Parks
Table 1a & Figure 1 present the structural and operational characteristics of the six selected motor parks in Ilorin metropolis, demonstrating variation in ownership type, establishment period, fleet capacity, passenger throughput, and passenger utilisation intensity. The oldest facility was Sawmill Garage, established in 1976, whereas Bekki and Sons represented the most recently established park (2008). Fleet size ranged from 20 vehicles at Okin Express to 55 vehicles at Ero-Omo Garage, while daily passenger throughput varied from 100 passengers at Okin Express to 200 passengers at Ero-Omo Garage. Correspondingly, passengers per vehicle per day ranged from 3.33 at Sawmill Garage to 5.00 at Okin Express, indicating differences in operational intensity independent of absolute facility size. Across the six facilities, the median year of establishment was 1981 (IQR: 1978-2004), with a median fleet size of 37.5 vehicles (IQR: 26.3-48.8), median daily passenger throughput of 140 passengers (IQR: 122.5-172.5), and median passenger utilisation intensity of 3.98 passengers per vehicle per day (IQR: 3.61-4.68). Overall, the findings show that the selected motor parks differed substantially in operational scale and passenger demand characteristics, providing the basis for comparing facility-level variation in transport activity and sanitation requirements (Table 1a & Figure 1).
Table 1b & Figure 2 summarises facility-level operational scale according to ownership type, showing descriptive differences between public and private motor parks across the six study facilities. Publicly owned parks demonstrated higher absolute operational capacity, with a mean fleet size of 45.0 ± 10.8 vehicles compared with 22.5 ± 3.5 vehicles among privately owned parks, corresponding to a public–private difference of 22.5 vehicles. Similarly, mean daily passenger throughput was higher among public parks (165.0 ± 31.1 passengers/day) than private parks (110.0 ± 14.1 passengers/day), representing a difference of 55.0 passengers/day. In contrast, privately owned parks exhibited greater passenger utilisation intensity, with 4.90 ± 0.14 passengers per vehicle/day compared with 3.73 ± 0.43 among public parks, a difference of -1.17 passengers per vehicle/day. Public parks were also considerably older, with a mean establishment year of 1979.3 ± 12.1 compared with 2006.5 ± 2.1 among private facilities, reflecting a 27.3-year difference in operational history. These ownership-based contrasts are interpreted descriptively because the analysis involved only six facilities, including four public and two private parks; therefore, the estimates represent observed patterns rather than population-level differences. An exact two-sided permutation assessment based on all possible allocations of ownership labels among the six facilities did not support conventional statistical inference (minimum attainable P-value = 0.133), and the establishment-year comparison is presented primarily to describe structural differences between ownership categories rather than as an operational outcome (Table 1b & Figure 2).
Table 1c & Figure 3 presents the association between fleet size and daily passenger throughput across the six selected motor parks, demonstrating a strong positive relationship between facility capacity and passenger volume. Fleet size showed a perfect monotonic association with daily passenger throughput (Spearman’s ρ = 1.000; exact two-sided permutation P = 0.0028), reflecting identical ranking of the six motor parks according to both operational indicators. Similarly, Pearson correlation analysis showed a very strong linear relationship between fleet size and daily passenger throughput (r = 0.974; 95% CI: 0.776-0.997; P = 0.0010). Linear regression analysis further indicated that each additional vehicle within a motor park was associated with an estimated increase of 2.55 passengers per day (95% CI: 1.73-3.38; P = 0.0010), with the fitted model explaining 94.9% of the variation in daily passenger throughput (R² = 0.949). The estimated regression equation was: daily passenger throughput = 50.88 + 2.55 × fleet size. These findings indicate that fleet size and passenger throughput represent closely related measures of absolute operational scale and should not be simultaneously interpreted as independent predictors in subsequent modelling. Instead, passenger utilisation intensity, expressed as passengers per vehicle per day, provides a complementary measure of operational pressure by capturing differences in passenger demand relative to fleet capacity (Table 1c & Figure 3).
3.2. Distribution of Waste-Storage Modalities Among Motor Park Respondents
Table 2a & Figure 4 presents the distribution of waste-storage modalities among respondents across the six selected motor parks in Ilorin. Among the 36 respondents who completed the waste-management component of the survey, small waste bins were the most commonly reported storage modality, used by 22 respondents (61.1%; 95% CI: 44.9-75.2). Waste drums were reported by 12 respondents (33.3%; 95% CI: 20.2-49.7), while nylon bags represented the least frequently reported storage option, with only 2 respondents (5.6%; 95% CI: 1.5-18.1). Overall, the findings indicate that formal or semi-permanent storage options, particularly small waste bins and waste drums, accounted for the majority of reported storage practices, whereas reliance on nylon bags was uncommon among respondents. The proportion estimates and corresponding Wilson score confidence intervals provide the uncertainty around each storage modality at the respondent level (Table 2a & Figure 4).
Table 2b & Figure 5 presents the goodness-of-fit assessment of whether the observed distribution of waste-storage modalities differed from an equal distribution across the three identified storage categories. The observed frequencies of small waste bins (n = 22), waste drums (n = 12), and nylon bags (n = 2) were compared against an expected equal distribution of 12 respondents per category. The Pearson chi-square goodness-of-fit test demonstrated a statistically significant departure from equal distribution (χ² = 16.667, df = 2, P < 0.001), indicating that waste-storage modalities were not evenly distributed among respondents. The observed pattern was primarily driven by the higher-than-expected use of small waste bins and the lower-than-expected use of nylon bags. This analysis evaluates the distribution of storage modalities among respondents and does not assess associations between storage practices and motor park characteristics (Table 2b & Figure 5).
3.3. Waste-Disposal Practices, Evacuation Patterns, and Disposal Costs
Table 3a & Figure 6a presents the distribution of waste-disposal channels reported by respondents across the six selected motor parks. Among the 36 respondents who completed the waste-management section, private waste collectors represented the dominant disposal pathway, reported by 33 respondents (91.7%; 95% CI: 78.2-97.1). Government agencies accounted for waste disposal among 2 respondents (5.6%; 95% CI: 1.5-18.1), while self-disposal was reported by only 1 respondent (2.8%; 95% CI: 0.5-14.2). The findings indicate that waste management within the surveyed motor parks relied predominantly on privately managed collection services, with limited reported dependence on government-led disposal systems or individual disposal practices. The corresponding Wilson score confidence intervals demonstrate the precision of the estimated proportions at the respondent level (Table 3a & Figure 6a).
Table 3b & Figure 6b presents the distribution of waste-evacuation frequency among respondents. Weekly evacuation was the most commonly reported practice, with 28 of 36 respondents (77.8%; 95% CI: 61.9-88.3) indicating that waste was removed on a weekly basis. Bi-weekly evacuation was reported by 5 respondents (13.9%; 95% CI: 6.1-28.7), whereas monthly evacuation was the least frequently reported practice, involving 3 respondents (8.3%; 95% CI: 2.9-21.8). These findings suggest that most respondents experienced relatively frequent waste removal arrangements, although a subset of facilities relied on less frequent evacuation schedules that may increase the potential for temporary waste accumulation. The estimates were derived from the observed response distribution among the 36 respondents and are presented with Wilson score confidence intervals (Table 3b & Figure 6b).
Table 3c & Figure 6c presents the distribution of monthly waste-disposal costs among respondents. Reported monthly disposal expenditure varied across the four cost categories, with ₦5,000 representing the most frequently reported payment category among respondents (15/36; 41.7%; 95% CI: 27.1-57.8). This was followed by respondents reporting disposal costs greater than ₦5,000 (12/36; 33.3%; 95% CI: 20.2-49.7), while lower expenditure categories of ₦2,000 and ₦1,000 were reported by 7 respondents (19.4%; 95% CI: 9.8-35.0) and 2 respondents (5.6%; 95% CI: 1.5-18.1), respectively. Overall, the distribution indicates that most respondents reported moderate-to-high monthly waste-disposal expenditure, with 75.0% (27/36) reporting costs of at least ₦5,000 per month. The confidence intervals provide uncertainty estimates around each observed proportion (Table 3c & Figure 6c).
Table 3d & Figure 6d presents the statistical assessment of whether monthly waste-disposal costs were equally distributed across the four reported expenditure categories. Under the null hypothesis of equal distribution, each category was expected to contain nine respondents. The observed cost distribution differed significantly from this expectation (Pearson χ² = 15.44, df = 3, P = 0.0015), indicating that reported disposal costs were not evenly distributed across the four categories. Furthermore, 27 respondents (75.0%; 95% CI: 59.2-86.3) reported monthly disposal costs of at least ₦5,000, demonstrating that higher-cost categories accounted for the majority of reported expenditure patterns. This goodness-of-fit analysis evaluates the distribution of disposal-cost categories among respondents and does not assess differences between individual motor parks or ownership groups (Table 3d & Figure 6d).
Table 3e & Figure 6e summarise the predominant waste-disposal practices among respondents across the surveyed motor parks. Private waste collectors represented the dominant disposal channel, reported by 33 of 36 respondents (91.7%; 95% CI: 78.2-97.1). Weekly waste evacuation was the predominant collection frequency, reported by 28 respondents (77.8%; 95% CI: 61.9-88.3), while monthly disposal expenditure of at least ₦5,000 was reported by 27 respondents (75.0%; 95% CI: 59.2-86.3). Collectively, these findings indicate that waste management within the assessed motor parks was characterised by strong reliance on private collection services, frequent evacuation arrangements, and relatively high disposal-cost commitments among respondents (Table 3e & Figure 6e).
3.4. Respondents’ Perceptions of Sanitation and Waste-Commercialisation Policies
Table 4a & Figure 7a presents the distribution of respondents’ ratings of the monthly sanitation policy among the 36 respondents who completed the policy assessment component. The majority of respondents rated the monthly sanitation policy positively, with 22 respondents (61.1%; Wilson 95% CI: 43.5-76.9) categorising the policy as good, while 9 respondents (25.0%; Wilson 95% CI: 12.1-42.2) rated it as excellent. In contrast, 5 respondents (13.9%; Wilson 95% CI: 4.7-29.5) reported a poor rating. Overall, favourable ratings (excellent or good) were reported by 31 respondents (86.1%; Wilson 95% CI: 70.5-95.3), indicating that positive perceptions of the monthly sanitation policy predominated among surveyed respondents. A chi-square goodness-of-fit test comparing the observed three-category distribution with an equal expected distribution of 12 respondents per category demonstrated that the observed ratings differed significantly from equal proportions (χ² = 13.17, df = 2, P = 0.0014), suggesting that responses were concentrated within the favourable rating categories rather than being evenly distributed (Table 4a& Figure 7a).
Table 4b & Figure 7b presents respondents’ ratings of the waste-commercialisation policy. Responses were relatively balanced between favourable and unfavourable perceptions, with 19 respondents rating the policy as good (52.8%; Wilson 95% CI: 36.3–69.0) and 17 respondents rating it as bad (47.2%; Wilson 95% CI: 31.0–63.7). The distribution indicates a slight predominance of positive ratings; however, the confidence intervals demonstrate considerable overlap between the two response categories, reflecting uncertainty around the observed difference. These findings describe respondents’ perceptions of the waste-commercialisation policy among the surveyed motor park population and provide the basis for testing whether the observed distribution differs from a prespecified 50%–50% indifference distribution (Table 4b & Figure 7b).
Table 4c & Figure 7c presents the statistical assessment of whether respondents’ ratings of the waste-commercialisation policy differed from the prespecified indifference distribution of 50% good and 50% bad. Among the 36 respondents, 19 (52.8%) rated the policy as good and 17 (47.2%) rated it as bad. An exact two-sided binomial test showed that this observed distribution was not statistically different from the hypothesised 50:50 distribution (P = 0.868). The exact 95% confidence interval for the proportion rating the policy as good was 35.5–69.6%, which includes the null value of 50%. Therefore, the observed balance of responses provides no statistical evidence that respondents’ perceptions of the waste-commercialisation policy differed from an indifference distribution (Table 4c & Figure 7c).
Table 4d & Figure 7d provides a consolidated statistical summary of respondents’ evaluations of the two policy measures assessed in the study. For the monthly sanitation policy, favourable ratings dominated, with 31 of 36 respondents (86.1%) reporting either good or excellent ratings, and the observed three-category distribution differed significantly from equal proportions (χ² = 13.17, df = 2, P = 0.0014). In contrast, perceptions of the waste-commercialisation policy were more evenly divided, with 19 respondents (52.8%) reporting good ratings and 17 respondents (47.2%) reporting bad ratings; the exact binomial test indicated no evidence of deviation from the prespecified 50%-50% indifference distribution (P = 0.868; exact 95% CI for good ratings: 35.5-69.6%). Together, these results show distinct response patterns across the two policy domains, with stronger concentration of favourable responses for monthly sanitation policy and a balanced distribution of views regarding waste commercialisation (Table 4d & Figure 7d).
3.5. Spatial Variation in Operational Capacity and Passenger Throughput Across Ilorin LGAs
Table 5 & Figure 8 present the spatial distribution of aggregate operational activity across the three Local Government Areas (LGAs) of Ilorin metropolis. Each LGA contributed two motor parks to the assessment, allowing comparison of aggregated fleet capacity and passenger throughput across equivalent numbers of facilities. Ilorin South recorded the highest overall operational activity, with 85 vehicles and 330 daily passengers across its two sampled parks, corresponding to a mean of 42.5 vehicles and 165.0 passengers per park. Ilorin East followed, with 70 vehicles and 280 daily passengers, for a mean of 35.0 vehicles and 140.0 passengers per park. Ilorin West recorded the lowest aggregate passenger activity, with 70 vehicles and 270 daily passengers, equivalent to a mean of 35.0 vehicles and 135.0 passengers per park. Across all six facilities, the combined operational capacity was 225 vehicles serving an estimated 880 passengers daily, with an overall average of 37.5 vehicles and 146.7 passengers per park. These findings demonstrate variation in the spatial concentration of transport activity across the three LGAs, with Ilorin South exhibiting the highest aggregate operational intensity in terms of both fleet capacity and passenger throughput (Table 5 & Figure 8).
3.6. Passenger Utilisation Intensity Across Selected Motor Parks
Table 6 & Figure 9 present passenger utilisation intensity across the six selected motor parks, calculated as the daily passenger-to-vehicle ratio to describe operational intensity relative to fleet size. Passenger utilisation intensity varied across facilities, ranging from 3.33 passengers per vehicle/day at Sawmill Garage to 5.00 passengers per vehicle/day at Okin Express. Among the six motor parks, Okin Express recorded the highest utilisation intensity (5.00 passengers/vehicle/day), followed by Bekki and Sons (4.80), Kasmag Motors (4.33), Ero-Omo Garage (3.64), Maraba Garage (3.60), and Sawmill Garage (3.33). Collectively, the six facilities operated with a combined fleet of 225 vehicles and a daily passenger throughput of 880 passengers, resulting in an overall passenger utilisation intensity of 4.12 passengers per vehicle/day. The observed differences indicate that passenger demand relative to available fleet capacity varied between facilities, with smaller parks demonstrating higher utilisation ratios despite lower absolute passenger volumes. This metric provides a complementary measure of operational pressure by distinguishing passenger demand intensity from overall fleet size and total passenger throughput (Table 6 & Figure 9).
1. Discussion
4.1. Operational Scale, Facility Characteristics, and Passenger Demand Dynamics of Urban Motor Parks
The structural and operational diversity observed across the selected motor parks highlights the importance of considering transport facilities as heterogeneous urban systems rather than uniform points of passenger movement. Previous studies have demonstrated that motor parks in Nigerian cities function as complex socio-environmental spaces where transportation activities interact with sanitation infrastructure, waste generation, and surrounding urban environments (Sarah et al., 2024; Raufu et al., 2023; Yusuf et al., 2023; Adeogun et al., 2022; Ahmed, 2016). The observed variation in operational scale among facilities is consistent with evidence that the location, historical development, and management structure of motor parks influence their environmental pressures and service requirements. In Minna, Adeogun et al. (2022) reported that intercity motor park locations affected adjacent environmental conditions through increased human activity, waste accumulation, and urban interactions, suggesting that facilities with greater operational demands require proportionately stronger environmental management systems. Similarly, Ahmed (2016) identified the rapid expansion and informal organisation of transport activities in Ilorin as contributing factors to urban management challenges, particularly where transport growth exceeds regulatory and infrastructural planning capacity. The present findings extend these observations by demonstrating that operational intensity is not solely determined by facility size; rather, passenger demand relative to available vehicle capacity provides an additional dimension for understanding pressure on transport environments. This distinction is important because previous waste-management assessments have largely focused on disposal behaviour and infrastructure availability without incorporating operational metrics such as passenger throughput or utilisation intensity (Ibekwe et al., 2018; Olanrewaju et al., 2023; Digha et al., 2025; ilemi et al., 2025). Moreover, the differences observed between public and private facilities reflect broader patterns reported in urban service systems, where historical development, governance arrangements, and institutional capacity influence infrastructure performance and resource allocation (Kumar et al., 2022; Raufu, 2025; Morufu, 2025; Raufu et al., 2026). Although ownership-based comparisons in the present study were descriptive because of the limited number of facilities, the findings provide a useful framework for future investigations examining how organisational models influence environmental performance (Suleiman et al., 2019). This aligns with broader sustainability literature emphasising that effective urban waste and sanitation management requires context-specific assessment of operational characteristics rather than reliance on generic interventions (Taelman et al., 2020; World Bank, 2019). Therefore, integrating transport activity indicators into environmental assessments represents an important methodological advancement for understanding sanitation requirements in high-use urban facilities.
Furthermore, the strong association between fleet size and passenger throughput observed in this study reinforces the role of operational capacity as a primary determinant of activity intensity within motor parks. Similar relationships between urban activity concentration and waste-management demand have been documented across developing-country settings, where increased human mobility and commercial activity contribute to higher volumes of municipal waste and greater pressure on existing collection systems (UNEP, 2019; World Bank, 2019). However, the present analysis also demonstrates the limitation of using fleet size or passenger volume alone as indicators of environmental pressure, because these measures capture absolute activity but do not reflect how efficiently available transport capacity is utilised. The introduction of passengers per vehicle per day as an operational-intensity indicator provides a complementary measure that may better identify facilities experiencing disproportionate passenger demand relative to their physical capacity. This concept aligns with sustainability assessment frameworks that advocate multidimensional indicators incorporating operational performance, resource use, and environmental consequences (Taelman et al., 2020; Rauf & Raimi, 2023; Raufu & Morufu, 2023). In Nigeria, existing studies of motor park sanitation have primarily concentrated on waste disposal practices, refuse accumulation, and sanitation facility conditions, with limited attention to how transport intensity shapes these challenges (Ibekwe et al., 2018; Olanrewaju et al., 2023). Evidence from Ilorin and Kwara State similarly indicates persistent waste-management challenges associated with urban growth, inadequate systems, and increasing demand for environmental services (Raufu et al., 2022; Raufu et al., 2023; Raufu & Raimi, 2023). These challenges are particularly relevant because transport hubs concentrate transient populations, commercial activities, and waste-generating behaviours within limited spaces, creating potential pathways for environmental exposure and public health risks (Raimi & Raimi, 2020; Raimi et al., 2020; Morufu et al., 2021; 2021d; Raimi et al., 2021; Afolabi & Raimi, 2021; Afolabi & Morufu, 2021; WHO, 2022; Omang et al., 2021). Consequently, interventions targeting motor park sanitation should move beyond general waste collection improvements and incorporate facility-level operational characteristics, passenger demand patterns, and resource capacity. Such integrated approaches are consistent with emerging circular economy perspectives, which promote data-driven waste systems, improved resource recovery, and adaptive management strategies for rapidly growing urban environments (Anokye et al., 2024; Giri et al., 2024; Kurniawan et al., 2023). Collectively, these findings position motor parks as important but underrepresented components of urban environmental health planning and provide evidence for incorporating operational intensity into future sanitation policy and infrastructure decisions (Raimi & Raimi, 2020; Iyoha et al., 2025).
4.2. Waste-Storage Practices and Behavioural Dimensions of Sanitation Management
The predominance of structured storage options, particularly small waste bins and waste drums, suggests that waste containment practices within Ilorin motor parks are shaped by the need to manage continuous waste accumulation in highly frequented transport environments. This pattern is consistent with evidence from Nigerian motor park settings, where refuse disposal practices have been strongly influenced by the availability, accessibility, and suitability of storage facilities within transport nodes (Ibekwe et al., 2018). Similarly, studies examining environmental conditions around intercity motor parks have shown that transport facilities generate concentrated waste streams requiring designated containment approaches to prevent indiscriminate disposal and environmental deterioration (Agbo, 2026; Agboola et al., 2024; Adeogun et al., 2022; Ahmed, 2016). However, the persistence of multiple storage modalities rather than a uniform system reflects the fragmented nature of urban waste-management infrastructure in many low- and middle-income settings, where formal collection arrangements, user behaviour, and operational capacity often vary substantially between locations (Kumar et al., 2022; United Nations Environment Programme [UNEP], 2019). The observed reliance on bins and drums aligns with findings from Ilorin and Kwara State indicating that central storage arrangements and waste-handling practices remain important determinants of urban sanitation outcomes, although implementation challenges continue to affect system efficiency (Raufu et al., 2022; Raufu et al., 2023). Similar observations have been reported in other Nigerian communities, where storage practices were associated with awareness, environmental behaviour, and the perceived effectiveness of local waste services (Adogu et al., 2015; Agboola et al., 2024). Nevertheless, the limited use of nylon bags may indicate a transition away from temporary household-style containment towards more durable storage approaches suitable for commercial environments; this interpretation should be considered cautiously because storage choice may also reflect availability, cost, and waste-collector preferences rather than deliberate environmental management behaviour (Musa et al., 2021; Iyasele & Dangana, 2023). From a public health perspective, appropriate waste containment at motor parks is important because poorly managed waste accumulation can increase exposure to biological hazards, vectors, unpleasant odours, and occupational risks among workers and commuters (Omang et al., 2021; World Health Organization [WHO], 2022; Norhaslina & Shazwani, 2022). Therefore, the findings extend previous motor park sanitation research by demonstrating that storage infrastructure represents not merely a disposal convenience but an operational control point that can influence cleanliness, collection efficiency, and environmental health performance within transport systems.
Furthermore, the unequal distribution of storage modalities highlights a broader systems challenge: the presence of storage facilities alone may not guarantee sustainable waste management unless integrated with reliable collection, segregation, recovery, and monitoring mechanisms. Previous studies have demonstrated that developing-country waste systems frequently operate through mixed formal and informal arrangements, resulting in variations in storage practices, service reliability, and environmental outcomes (Sawyerr & Raimi, 2025; Giri et al., 2024; Kumar et al., 2022; Sampson-Akpan, 2009). The findings from Ilorin complement earlier evidence that waste-management conditions in the city remain affected by infrastructural limitations, uneven service delivery, and increasing urban waste pressures (Raufu & Raimi, 2023; Raufu, 2025). Similar patterns have been documented internationally, where inadequate coordination between storage, collection, and resource-recovery systems has constrained progress towards circular waste-management models (Kurniawan et al., 2023; Taelman et al., 2020). In this context, the dominance of bins and drums provides an opportunity for improving waste segregation and recovery pathways, particularly because appropriately designed storage systems can support downstream recycling and circular-economy interventions (Anokye et al., 2024; Maiurova et al., 2022; Oluwaseun et al., 2019). However, without institutional arrangements that support routine collection, stakeholder participation, and behavioural reinforcement, storage systems may remain isolated interventions rather than components of an integrated sanitation strategy. Evidence from other Nigerian settings indicates that knowledge, awareness creation, and socio-demographic factors influence sustainable disposal behaviour among waste generators and handlers (Beshel et al., 2024; Uba et al., 2023), suggesting that infrastructure and behavioural interventions should be implemented together. The findings therefore reinforce the need for transport authorities, municipal waste agencies, and environmental health regulators to adopt context-specific waste-management frameworks that link storage infrastructure with operational planning, environmental monitoring, and circular resource recovery. Such approaches are particularly relevant for motor parks, where high passenger turnover, commercial activities, and concentrated waste generation create conditions requiring adaptive sanitation systems rather than conventional household-based waste-management models (Olanrewaju et al., 2023; World Bank, 2019).
4.3. Waste-Disposal Pathways, Evacuation Systems, and Economic Dimensions of Waste Management
The predominance of privately managed waste collection within the surveyed motor parks reflects the increasing role of non-state actors in urban waste-service delivery in settings where municipal systems often face operational and infrastructural constraints. This finding is consistent with broader evidence from developing-country waste-management systems, where private-sector participation has frequently emerged as a mechanism for improving collection coverage, particularly in rapidly growing urban environments with limited public-sector capacity (Kumar et al., 2022; United Nations Environment Programme [UNEP], 2019). Similar reliance on external waste-service providers has been reported in Nigerian urban contexts, where household and institutional waste generators commonly depend on private collectors because government-led collection systems are often insufficiently regular or geographically limited (Adogu et al., 2015; Diabia et al., 2022). Within transport environments specifically, previous investigations of motor parks have highlighted the importance of organised waste evacuation systems because high passenger movement, commercial activities, and transient populations create continuous waste-generation pressures that require dedicated management arrangements (Ibekwe et al., 2018; Adeogun et al., 2022). The observed pattern also aligns with findings from Ilorin, where waste-management challenges have been associated with increasing urban waste loads, service-delivery limitations, and the need for improved coordination among waste generators, operators, and regulatory institutions (Raufu et al., 2023; Raufu, 2025). However, dependence on private collectors may also indicate a shift of responsibility from public environmental authorities to individual facilities and commercial operators, raising questions regarding service affordability, regulatory oversight, and equitable access to reliable waste management (Morufu, 2025; Ogunyemi et al., 2025). Similar concerns have been reported in other Nigerian studies demonstrating that waste disposal practices are influenced not only by infrastructure availability but also by institutional arrangements, awareness, and users’ willingness to engage with available services (Ayodeji, 2020; Iyasele & Dangana, 2023). The frequent evacuation schedules reported by respondents suggest that many motor parks have developed operational mechanisms to reduce prolonged waste accumulation; nevertheless, the presence of less frequent evacuation practices among some respondents remains relevant because irregular collection can contribute to temporary storage overload, environmental nuisance, and increased exposure risks. These concerns correspond with evidence linking inadequate waste handling and delayed evacuation to adverse sanitation outcomes, occupational hazards, and community health risks (Omang et al., 2021; World Health Organization [WHO], 2022). Therefore, the findings extend previous literature by demonstrating that motor park waste management in Ilorin is characterised by a service model driven largely by private collection networks, with evacuation frequency functioning as an important operational indicator of sanitation performance.
Furthermore, the distribution of disposal expenditure highlights the economic dimension of maintaining sanitation services within high-use transport environments. The concentration of respondents within moderate-to-high payment categories suggests that effective waste management requires sustained financial commitments from commercial stakeholders, rather than relying solely on the availability of disposal infrastructure. This observation agrees with previous research indicating that willingness and ability to pay influence the continuity of waste services, particularly where municipal financing mechanisms are inadequate or inconsistent (Ayodeji, 2020; Agbaji & Ejemot-Nwadiaro, 2019; Yes Program, 2015). Comparable findings from Nigerian communities have shown that households and businesses often incur direct waste-management costs to compensate for limitations in formal collection systems, although affordability remains a potential barrier to equitable participation (Agboola et al., 2024; Musa et al., 2021). Conversely, high disposal costs without corresponding improvements in recycling, recovery, or service quality may reinforce a linear waste-management model centred on collection and disposal rather than resource recovery. This limitation has been recognised internationally, with studies emphasising that sustainable waste systems require integration of collection efficiency, technological innovation, recycling infrastructure, and circular-economy principles (Abu et al., 2021; Giri et al., 2024; Kurniawan et al., 2023). In this regard, the financial contributions observed among motor park operators could provide an entry point for developing improved waste-recovery initiatives, including material separation, recycling partnerships, and data-driven collection systems, as demonstrated in circular waste-management frameworks (Anokye et al., 2024; Maiurova et al., 2022; Scarlat et al., 2025). Nevertheless, financial investment alone may not eliminate environmental risks if waste flows remain poorly monitored or if downstream disposal facilities are inadequate. Previous evidence from Nigerian and international settings indicates that ineffective coordination between waste generation, collection, transportation, and final disposal can undermine environmental performance despite increased expenditure (Sharholy et al., 2008; Singh et al., 2020). Consequently, the present findings support a transition from expenditure-focused waste management towards performance-based systems that evaluate service reliability, environmental outcomes, occupational safety, and resource recovery potential. Such an approach is particularly important in motor park environments, where sanitation management intersects with public health protection, urban mobility, and sustainable city development (Taelman et al., 2020; World Bank, 2019).
4.4. Policy Perception, Sanitation Governance, and Opportunities for Waste Valorisation
The generally favourable perception of the monthly sanitation policy suggests that visible, routine sanitation interventions may contribute to stronger stakeholder acceptance when they directly address environmental cleanliness and shared public-space management. This observation is consistent with previous studies demonstrating that sanitation initiatives are more likely to receive community support when users perceive tangible improvements in waste control, service reliability, and environmental conditions (Adogu et al., 2015; Agboola et al., 2024). In Nigerian urban settings, sanitation challenges have often been linked to inadequate coordination between waste generators, service providers, and regulatory institutions; therefore, positive perceptions of structured sanitation programmes may reflect recognition of their role in maintaining order within densely utilised environments (Agbaji & Ejemot-Nwadiaro, 2019; Diabia et al., 2022). Similar evidence from motor park studies indicates that sanitation conditions are closely connected with operational organisation, cleanliness standards, and the management of high-traffic public facilities (Ibekwe et al., 2018; Olanrewaju et al., 2023). The findings also correspond with observations from Ilorin, where waste-management assessments have identified the importance of organised storage, collection systems, and public participation in improving municipal sanitation outcomes (Raufu et al., 2022; Raufu et al., 2023; Ogunyemi et al., 2025). However, favourable perceptions should not be interpreted solely as evidence of effective waste governance, because previous research has shown that user satisfaction can coexist with underlying weaknesses in waste collection capacity, disposal infrastructure, and environmental monitoring (Kumar et al., 2022; United Nations Environment Programme [UNEP], 2019; Adiama et al., 2025). From a public health perspective, acceptance of sanitation policies is important because behavioural compliance and stakeholder cooperation influence the sustainability of environmental health interventions, particularly in commercial environments where waste generation is continuous and diverse (WHO, 2022; WHO, 2025; Uba et al., 2023). Consequently, the observed positive assessment of monthly sanitation policy supports the broader argument that visible sanitation measures can strengthen institutional legitimacy and encourage participation, while also highlighting the need for continued evaluation of whether perceived improvements translate into measurable environmental outcomes.
Furthermore, the more balanced perception of waste-commercialisation policy reflects the complexity of transitioning from conventional waste disposal approaches towards market-oriented and resource-recovery models. Unlike routine sanitation activities, waste commercialisation introduces economic dimensions involving cost-sharing, private-sector participation, recycling incentives, and potential changes in stakeholder responsibilities, which may generate more diverse opinions among users. Similar variability has been reported in studies examining willingness to pay, waste-service participation, and adoption of sustainable waste practices, where acceptance is influenced by perceived costs, benefits, awareness, and trust in service providers (Ayodeji, 2020; Musa et al., 2021; Haji Ali et al., 2017). The mixed perceptions observed in this study are also consistent with evidence from developing-country contexts showing that circular-economy-based waste reforms often encounter implementation barriers related to institutional readiness, technology, financing, and stakeholder engagement (Giri et al., 2024; Anokye et al., 2024; Oweibia et al., 2024; Mordecai et al., 2024; Elemuwa et al., 2024; Teddy et al., 2025). While commercialisation has potential to improve resource recovery and reduce disposal pressures, previous research cautions that market-based systems require appropriate governance frameworks to prevent exclusion of smaller operators and ensure equitable access to services (Kurniawan et al., 2023; Maiurova et al., 2022). In Nigeria, where waste-management systems frequently involve interactions between formal agencies, private operators, and informal actors, successful commercialisation may depend on regulatory coordination and transparent service arrangements rather than economic incentives alone (Raufu et al., 2022; Raufu, 2025; Ogunyemi et al., 2025). Therefore, the relatively divided perception of waste commercialisation provides an important policy signal: stakeholders may recognise the potential value of commercial approaches but remain uncertain about their practical implications. Integrating stakeholder consultation, environmental education, and measurable service improvements could strengthen acceptance of such reforms, consistent with international frameworks advocating waste systems that combine operational efficiency, environmental protection, and circular resource utilisation (Taelman et al., 2020; World Bank, 2019; Adenike et al., 2025).
4.5. Spatial Variation in Transport Activity and Implications for Urban Sanitation Planning
The spatial heterogeneity observed in operational intensity among motor parks in Ilorin metropolis reflects the influence of urban structure, mobility demand, and the functional roles of different administrative areas within rapidly growing Nigerian cities. The higher operational activity recorded in Ilorin South is consistent with evidence that transport nodes located within more commercially active or densely connected urban corridors tend to attract greater vehicle concentration and passenger movement, thereby generating higher associated environmental pressures. Adeogun et al. (2022) reported that the location and functional characteristics of intercity motor parks strongly influence their environmental implications, while Ahmed (2016) demonstrated that motor park distribution in Ilorin is closely linked with urban expansion, accessibility challenges, and increasing transport demand. Similar patterns have been reported in studies examining waste generation and management around transport facilities, where increased human mobility and passenger concentration contribute to higher waste loads and operational management requirements (Ibekwe et al., 2018; Olanrewaju et al., 2023). Furthermore, the observed variation across Ilorin LGAs supports broader evidence that urban service demands are spatially uneven, requiring location-specific planning approaches rather than uniform interventions (Kumar et al., 2022; Kader et al., 2023; Giri et al., 2024). In contrast, studies from other settings have shown that operational scale alone does not always determine environmental performance, as management capacity, infrastructure availability, and institutional coordination can modify the impacts of high-activity facilities (Taelman et al., 2020; Zhou et al., 2018). Therefore, the differences in transport intensity identified across Ilorin LGAs provide an important basis for integrating mobility patterns with sanitation planning, waste-resource recovery strategies, and targeted environmental management interventions, particularly in areas experiencing sustained passenger circulation (Raufu et al., 2023; Rauf & Raimi, 2023).
4.6. Passenger Utilisation Intensity as an Indicator of Environmental Service Pressure
Passenger utilisation intensity provides a useful indicator of the relationship between transport demand and available fleet capacity, revealing operational pressure that may not be captured by absolute vehicle numbers or total passenger counts alone. The variation observed among the selected motor parks suggests that facilities with relatively smaller fleets can experience greater demand concentration, which has implications for service efficiency, congestion management, and environmental loading around transport hubs. This finding aligns with Adeogun et al. (2022), who demonstrated that the functional characteristics and location of motor parks influence their operational demands and surrounding environmental conditions, while Ahmed (2016) highlighted how increasing transport activity and informal parking arrangements in Ilorin contribute to urban management challenges. Similarly, Ibekwe et al. (2018) reported that motor parks represent concentrated points of human activity where passenger movement influences waste generation patterns and sanitation requirements. Although previous studies have often focused on total waste accumulation or sanitation conditions rather than passenger-to-vehicle ratios, evidence from Olanrewaju et al. (2023) indicates that variations in facility utilisation and user density can affect the adequacy of sanitation infrastructure in motor parks. Furthermore, the relationship between population movement, resource consumption, and waste generation has been documented in urban environmental studies, with highly utilised facilities requiring adaptive management approaches to prevent increasing environmental burdens (Kumar et al., 2022; Giri et al., 2024). The observed utilisation differences also support circular economy perspectives, which emphasise that operational intensity should inform targeted waste recovery systems and service planning rather than relying on uniform interventions across facilities (Kurniawan et al., 2023; Taelman et al., 2020; Raufu, 2025). However, contrasting evidence suggests that high utilisation does not inevitably result in poor environmental outcomes when effective collection systems, stakeholder participation, and technological solutions are integrated into waste management frameworks (Maiurova et al., 2022; Anokye et al., 2024). Therefore, the passenger utilisation gradient identified across Ilorin motor parks extends existing literature by demonstrating that transport demand intensity is an important contextual factor for environmental sanitation planning and sustainable waste management interventions within urban transport ecosystems.
5. Summary of Findings
This study provides an integrated evaluation of sanitation practices, waste-management systems, policy perceptions, and operational intensity across six selected motor parks in Ilorin metropolis, Nigeria. The assessment of structural and operational characteristics showed considerable heterogeneity among facilities, with differences in ownership type, establishment period, fleet capacity, daily passenger throughput, and passenger utilisation intensity. Publicly owned parks generally demonstrated greater absolute operational capacity, with larger fleet sizes and higher daily passenger volumes, whereas privately owned parks recorded higher passengers per vehicle per day, indicating greater utilisation intensity relative to available fleet capacity. The strong association between fleet size and passenger throughput further demonstrates that both indicators represent related measures of operational scale, while passenger-per-vehicle ratios provide an independent measure of operational pressure at the facility level. These findings highlight that motor parks represent diverse urban activity centres with varying sanitation demands linked to differences in transport operations. Furthermore, the evaluation of waste-management practices revealed that small waste bins and waste drums constituted the dominant waste-storage modalities among respondents, whereas nylon bags were rarely reported. Waste disposal was primarily undertaken through private waste collectors, with limited reliance on government agencies or self-disposal practices. Most respondents reported weekly waste evacuation, suggesting the presence of routine waste-removal mechanisms within the surveyed facilities. However, the distribution of monthly waste-disposal costs demonstrated substantial variation, with a majority of respondents reporting expenditures of at least ₦5,000 per month. These findings indicate that although waste-collection systems exist within the assessed motor parks, financial contributions, service arrangements, and evacuation frequency remain important determinants of effective waste management. The policy assessment further demonstrated differences in respondents’ perceptions of sanitation-related interventions. Ratings of the monthly sanitation policy were predominantly favourable, with most respondents reporting good or excellent ratings, and the observed distribution differed significantly from an equal three-category distribution. In contrast, perceptions of waste commercialisation were evenly divided, with the observed proportion of favourable responses not statistically different from the prespecified 50%–50% indifference distribution. This suggests that while routine sanitation measures appear to receive broad acceptance, the concept of transforming waste into commercially valuable resources may require additional communication, stakeholder engagement, and practical demonstration of benefits. Spatial analysis of operational activity across Ilorin West, Ilorin East, and Ilorin South Local Government Areas showed differences in aggregate transport capacity and passenger throughput. Although each LGA contributed an equal number of sampled motor parks, Ilorin South recorded the highest combined fleet capacity and passenger volume. At the facility level, passenger utilisation intensity varied from 3.33 to 5.00 passengers per vehicle per day, demonstrating that operational pressure differs between parks beyond their absolute size. These findings indicate that sanitation planning and resource allocation should consider both facility capacity and passenger movement intensity to adequately address waste-generation pressures in urban transport environments.
5. Study Limitations
The findings should be interpreted in light of several methodological limitations. First, the study was conducted across six purposively selected motor parks, with each park representing a single facility-level observation for operational comparisons. Consequently, comparisons by ownership type and Local Government Area provide descriptive evidence of observed patterns but should not be interpreted as population-level estimates. The limited number of facilities also restricts the ability to conduct more complex statistical modelling or generalise findings to all motor parks within Ilorin or other Nigerian cities. Second, although 72 respondents participated in the broader survey, only 36 respondents completed the waste-management and policy assessment components. This reduced the effective sample size for respondent-level analyses and may have limited the precision of estimated proportions and policy perception measures. Third, several variables, including waste-storage practices, disposal arrangements, evacuation frequency, disposal costs, and policy ratings, were based on self-reported responses. Such measures may be influenced by recall limitations or respondents’ perceptions of socially acceptable practices. Finally, the cross-sectional design provides an assessment of conditions at a specific period and does not capture seasonal variations in passenger activity, waste generation patterns, or changes in sanitation practices over time. Direct measurements of waste quantities, waste composition, and longitudinal monitoring of operational changes were beyond the scope of this assessment. Future studies incorporating repeated measurements and direct environmental assessments would provide stronger evidence on temporal dynamics and causal relationships between transport activity and sanitation outcomes.
5. Implications for Policy and Interventions
The findings provide important implications for improving sanitation and waste-management systems within urban transport environments. The observed variation in operational capacity and passenger utilisation intensity suggests that sanitation interventions should move beyond uniform approaches and adopt facility-specific planning strategies. Motor parks with higher passenger throughput or greater passenger-per-vehicle intensity may require increased waste-storage capacity, more frequent evacuation schedules, and enhanced sanitation infrastructure to match operational demands. The dominance of private waste collectors highlights the importance of strengthening collaboration between transport unions, park operators, private waste-management companies, and local government authorities. Formal service agreements, monitoring mechanisms, and transparent financing arrangements could improve reliability and accountability within existing waste-collection systems. In addition, the relatively high proportion of respondents reporting substantial disposal costs indicates the need for sustainable financing models that balance affordability for transport operators with the operational requirements of effective waste management. The contrasting perceptions of sanitation policy and waste commercialisation also suggest different intervention priorities. While existing sanitation activities appear to have gained general acceptance, waste-commercialisation initiatives may require stronger awareness programmes, demonstration projects, and incentives that clearly communicate potential environmental and economic benefits. Integrating waste recovery, recycling, and circular economy principles into motor park management frameworks could create opportunities for reducing disposal burdens while generating value from recoverable waste streams. At the municipal level, urban transport and environmental sanitation planning should be integrated rather than treated as separate sectors. Incorporating operational indicators such as fleet size, passenger throughput, and passenger utilisation intensity into sanitation planning frameworks may support more targeted allocation of resources. Future interventions should consider motor parks as dynamic urban environments where mobility, commerce, and waste generation intersect, requiring coordinated strategies that combine infrastructure development, behavioural engagement, and sustainable waste-management systems.
5. Conclusion
This study provides a quantitative assessment of sanitation, waste-management practices, policy perceptions, and operational intensity across selected motor parks in Ilorin metropolis, Nigeria. The findings demonstrate that motor parks are heterogeneous urban environments with substantial variation in structural characteristics, operational capacity, and passenger movement patterns. Differences in fleet size, daily passenger throughput, and passenger utilisation intensity indicate that transport facilities generate varying levels of operational pressure, which may translate into different sanitation and waste-management requirements. Although publicly owned parks generally exhibited greater absolute transport capacity, privately owned facilities showed higher passenger utilisation intensity, highlighting the importance of considering both facility scale and operational efficiency when designing sanitation interventions. The study further demonstrates that waste management within the assessed motor parks is characterised by reliance on basic storage systems, predominantly small waste bins and waste drums, alongside strong dependence on private waste-collection services. The predominance of weekly evacuation practices suggests that routine waste removal mechanisms are present; however, variations in disposal costs and evacuation arrangements indicate differences in service experiences among respondents. In addition, respondents expressed generally favourable views regarding monthly sanitation policies, whereas perceptions of waste commercialisation remained evenly distributed, reflecting uncertainty regarding the practical implementation and benefits of waste recovery initiatives. Taken together, these findings show that effective sanitation management in motor parks requires approaches that integrate transport operations, waste-service delivery, and stakeholder participation. Strategies based solely on administrative boundaries or facility classification may not adequately capture operational realities, as passenger throughput and utilisation intensity influence the demand placed on sanitation systems. Therefore, sustainable motor park management should incorporate facility-level operational indicators alongside conventional sanitation planning parameters. Future research should expand assessment across additional urban centres, incorporate direct measurement of waste generation and composition, and evaluate the effectiveness of circular economy approaches within transport environments.
5. Health Significance
Motor parks represent important public health environments because they concentrate large numbers of passengers, transport workers, vendors, and service providers within shared urban spaces. The findings of this study highlight the relationship between transport activity and environmental sanitation conditions, demonstrating that variations in passenger volume, facility capacity, and waste-management practices may influence exposure opportunities within these high-contact settings. Poorly managed waste accumulation, inadequate storage systems, irregular evacuation, or inefficient disposal pathways may contribute to environmental contamination and create conditions that increase risks associated with vectors, odour nuisance, physical hazards, and degraded urban environmental quality. The observed dependence on private waste collectors and the variation in disposal costs emphasise the importance of reliable and equitable waste-management systems as components of urban health protection. Strengthening collaboration between motor park operators, transport unions, waste-management providers, and local authorities may improve sanitation service continuity and reduce environmental health risks. In particular, facilities with higher passenger utilisation intensity may require tailored sanitation schedules and infrastructure investments because greater population movement can increase waste generation pressure even where total fleet size is relatively smaller. The findings also have implications for health promotion and environmental governance. Positive perceptions of sanitation policies provide an opportunity for strengthening existing hygiene practices, while the uncertainty surrounding waste commercialisation suggests a need for clearer communication, participatory planning, and practical demonstrations of sustainable waste recovery models. Integrating waste reduction, recycling, and resource recovery approaches within motor park management could contribute to cleaner urban environments while supporting broader public health and sustainability objectives. From a public health perspective, this study reinforces the need to recognise transport hubs as priority settings for environmental health interventions. Improving sanitation infrastructure, strengthening waste-management coordination, and incorporating operational intensity indicators into urban planning frameworks may support healthier and more resilient urban transport environments. These measures align with broader efforts to reduce environmental health risks associated with unmanaged waste and promote sustainable urban development in rapidly growing Nigerian cities. Thus, it is graphically represented (Figure 10 below) as:
10. Recommendations
Based on the observed differences in operational scale, waste-management practices, policy perceptions, and passenger utilisation intensity across the selected motor parks, the following recommendations are proposed:
5.1 Short-term recommendations (0-12 months)
- Standardise waste-storage infrastructure across motor parks: Transport park authorities, in collaboration with local environmental health agencies, should provide appropriately sized and clearly designated waste-storage containers, prioritising facilities with higher passenger throughput and greater operational intensity.
- Strengthen routine waste evacuation systems: Since weekly evacuation was the predominant practice but disposal arrangements varied, park managers should establish documented waste-collection schedules, service monitoring mechanisms, and clear responsibilities among transport operators, waste collectors, and regulatory authorities.
- Implement facility-specific sanitation monitoring: Environmental health officers should conduct periodic sanitation assessments using operational indicators such as fleet size, daily passenger throughput, and passengers per vehicle/day to identify facilities requiring additional sanitation support.
- Improve waste-management record-keeping: Motor park authorities should maintain basic operational records, including waste-collection frequency, disposal costs, service-provider information, and sanitation complaints, to support evidence-based environmental health decisions.
- Enhance stakeholder awareness on waste commercialisation: Targeted engagement sessions should be organised for transport unions, park operators, and waste collectors to clarify the principles, benefits, and practical requirements of waste recovery and recycling initiatives, given the observed uncertainty in respondents’ perceptions of waste commercialisation.
5.2 Mid-term recommendations (1-3 years)
- vi.
- Develop integrated motor park sanitation management plans: Local government authorities should incorporate transport activity indicators into sanitation planning frameworks, ensuring that waste-management resources correspond with variations in passenger demand and operational intensity across facilities.
- vii.
- Formalise partnerships with private waste-management providers: Given the dominant role of private waste collectors, regulatory mechanisms should be developed to improve service accountability through registration, performance monitoring, agreed collection standards, and transparent payment structures.
- viii.
- Introduce waste segregation and recovery systems: Motor parks should transition from conventional waste disposal practices towards source separation, recycling, and material recovery approaches that reduce disposal burdens and support circular economy objectives.
- ix.
- Prioritise high-intensity facilities for infrastructure upgrades: Motor parks demonstrating higher passenger utilisation intensity should receive targeted improvements, including additional storage capacity, improved sanitation facilities, and more frequent waste-management services.
- x.
- Establish sanitation performance indicators for motor park management: Routine assessments should include measurable indicators such as waste-storage adequacy, evacuation frequency, disposal expenditure, passenger throughput, and passenger-to-vehicle ratios to monitor progress and identify gaps.
5.3 Long-term recommendations (≥3 years)
- xi.
- Integrate motor parks into urban environmental health planning frameworks: Transport hubs should be recognised as priority environmental health settings within city development strategies, with coordinated planning between transport authorities, environmental agencies, and public health institutions.
- xii.
- Develop circular economy-based waste-management models for transport environments: Long-term strategies should explore economically viable pathways for converting recoverable motor park waste into reusable materials, composting inputs, or other resource-recovery streams while reducing dependence on disposal-based systems.
- xiii.
- Establish continuous surveillance and research platforms: Municipal authorities and academic institutions should develop longitudinal monitoring systems to track changes in waste generation, sanitation conditions, passenger movement patterns, and intervention outcomes across motor parks.
- xiv.
- Expand evidence generation through larger-scale studies: Future assessments should include additional motor parks across multiple Nigerian cities, direct measurement of waste quantities and composition, and longitudinal evaluation of sanitation interventions to strengthen generalisability and policy translation.
- xv.
- Promote sustainable transport-sanitation governance models: Long-term policy frameworks should integrate mobility planning, environmental management, and public health protection to create cleaner, safer, and more resilient urban transport environments.
Declarations
Funding
This study was self-funded.
Consent to Participate
Written informed consent was obtained from all individual participants included in the study. Participants were informed of the study’s purpose, procedures, risks, and benefits, and their right to withdraw at any time without consequence. Consent was documented prior to any data collection or intervention activities.
Consent to Publish
not applicable. No individual person’s data (including images, videos, or personal identifiers) are presented in this manuscript.
Clinical Trial Number
not applicable.
Competing Interests
The authors declare no conflict of interest.
Data Availability
The data supporting the results are available upon reasonable request from the corresponding author.
Acknowledgements
We appreciate all the respondents who participated in the research.
References
- Abiye, T., Tano, D. A., & Morufu, O. R. (2026). Extractive economies, invisible burdens: Reframing environmental degradation in the Niger Delta as a public health emergency. Preprints. [CrossRef]
- Abu, N. H., Ajman, N. M. A., & Mansor, M. F. (2021). Household knowledge and practices in solid waste segregation and recycling in Malaysia. Central Asia and the Caucasus, 22(5). [CrossRef]
- Adenike, B. A., Fubara, G. E., Esther, O. A., & Morufu, O. R. (2025). Circular economy and polyethylene waste management in Nigeria. Oral presentation presented at the 1st International Conference of the Faculty of Science, Federal University Otuoke, Bayelsa State, 71.
- Adegoun, A. S., Idowu, O. O., Gombwer, N. W., & Oladimeji, S. B. (2022). Implications of the locations of intercity motor parks on its adjoining environment in Minna, Niger State. Tropical Journal of the Built Environment, 3(1), 197–206.
- Adiama, Y. B., Raimi, M. O., & Usiobaifo, A. H. (2025). Echoes of outbreaks past: Rethinking public health preparedness in Sub-Saharan Africa in the age of emerging pandemics. Oral Presentation Presented at the 3rd Ku8+International Conference, Kwara State University, Malete.
- Adindu, I. B., Ubouh, E. A., Obasi, K. O., & Raimi, M. O. (2025). Automobile spray paint dust and human health: A multi-site environmental health risk assessment of carcinogenic and non-carcinogenic effects in South-Eastern Nigeria. Authorea. [CrossRef] [PubMed]
- Adogu, P., Uwakwe, K., Egenti, K., Okwuoha, A., & Nkwocha, I. (2015). Assessment of waste management practices among residents of Owerri Municipal, Imo State, Nigeria. Journal of Environmental Protection, 6, 446–456.
- Afolabi, A. S., & Morufu, O. R. (2021). Investigating source identification and quality of drinking water in Piwoyi Community of Federal Capital Territory, Abuja Nigeria. Research Square. [CrossRef] [PubMed]
- Afolabi, A. S., & Raimi, M. O. (2021). When water turns deadly: Investigating source identification and quality of drinking water in Piwoyi Community of Federal Capital Territory, Abuja Nigeria. Online Journal of Chemistry, 1, 38–58. [CrossRef]
- Agbaji, D. D., & Ejemot-Nwadiaro, R. I. (2019). Solid waste management in Calabar Metropolis: Case study of Calabar Urban Development Authority (2008–2017). Greener Journal of Medical Sciences, 9(1), 17–31. [CrossRef]
- Agbo, O. S. (2026). Invisible fault lines: Health inequities and resilience in informal urban settlements. In Urban environments and human health. IntechOpen. [CrossRef]
- Agboola, O. O., Abah, E. A., Andrew, O. E., Adelanwa, E., Ijimbili, S. I., Acham, N. I., Unazi, I. E., & Onyemocho, A. (2024). Assessment of waste management practices among residents of Benue South. Lafia Journal of Scientific and Industrial Research, 2(1), 78–82. [CrossRef]
- Ahmed, Y. A. (2016). Menace of illegal motor parks in Nigerian urban environment: Example from Ilorin city. Journal of Research and Development, 3(1), 23–33.
- Anokye, K., Apea, O. B., Darko, A. O., & Kwabi, L. A. (2024). The future of waste management in Ghana: Assessing the feasibility and scalability of smart waste solutions amidst key adoption challenges. Cleaner Waste Systems, 9, 100183. [CrossRef]
- Ayodeji, P. I. (2020). Households attitudes and willingness to pay for solid waste management in two southwest States, Nigeria. Journal of African Social Studies, 1(2), 123–131.
- Beshel, C. A., Asor, L. J., Ojong, A. A., Betiang, P. A., & Ironbar, V. E. (2024). Age, gender, and self-concept as predictors of solid waste management among residents in Cross River State, Nigeria. International Journal of Management and Sustainability, 13(2), 320–336. [CrossRef]
- Blossom, A. I., Attah, U. E., Omokorie, O. K., & Olalekan, R. M. (2026). Automobile spray paint dust and human health: A multi-site environmental health risk assessment of carcinogenic and non-carcinogenic effects in South-Eastern Nigeria. American Journal of Environmental Sciences, 22(1), 25–48. [CrossRef]
- Diabia, S. I. C., Avula, A., Boniface, M., Orji, A. O., Kalu, M. O., Eze-Ufodiama, S. C., Ighafidon, A., Onyekwere, O. K., Yohanna, W., Azuonwu, G., & Iwuagwu, T. E. (2022). Assessment of solid waste management practices, challenges and improvement strategies for households and waste managers in South-South Nigeria. Pollution Research, 41(2), 707–717. [CrossRef]
- Digha, O. N., Babatunde, T. O., & Morufu, O. R. (2025). Artificial intelligence (AI) and data science for sustainable plastic waste management in Nigeria. Oral presentation presented at the 1st International Conference of the Faculty of Science, Federal University Otuoke, Bayelsa State, 72.
- Elemuwa, C. O., Ainu, M., Adias, T. C., Sunday, O. A., Ufuoma, R. S., Elemuwa, U. G., Christopher, O., Raimi, M. O., Oginifolunnia, O. C., Oweibia, M., Ozoemena, O. V., & Daniel, E. T. (2024). Boosting community engagement: Leveraging the ward health system approach for enhanced HPV vaccination acceptance in Nigeria. F1000Research, 13, 1392. [CrossRef]
- Gift, R. A., & Olalekan, R. M. (2020). Access to electricity and water in Nigeria: A panacea to slow the spread of Covid-19. Open Access Journal of Science, 4(2), 34. [CrossRef]
- Gift, R. A., Olalekan, R. M., Owobi, O. E., Oluwakemi, R. M., Anu, B., & Funmilayo, A. A. (2020). Nigerians crying for availability of electricity and water: A key driver to life coping measures for deepening stay at home inclusion to slow covid-19 spread. Open Access Journal of Science, 4(3), 69–80. [CrossRef]
- Giri, S., Khanal, A., Raimi, M. O., Ikyapa, T. P., & Khanal, A. (2024). Solid waste management in underdeveloped countries: Study of Nigeria and Nepal for achieving circularity and sustainable development goals. Journal of Environmental Informatics Letters. [CrossRef]
- Haji Ali, N. E., Ho-Chin, S., & Halmi, Z. (2017). Socio-demographic influencing behaviour against solid waste minimisation in Shah Alam City, Malaysia. Environmental-Behavioural Proceeding Journal, 2(6), 53–61. [CrossRef]
- Henry, O. S., Odipe, E. O., Olawale, S. A., & Raimi, M. O. (2019). Bacteriological assessment of selected hand dug wells in students' residential area: A case study of Osun State College of Health Technology, Ilesa, Nigeria. Global Scientific Journal, 7(1). www.globalscientificjournal.com.
- Ibekwe, S. T., Dongo, E. A., & Sridhar, K. C. M. (2018). Refuse disposal practices in three major motor parks in Ibadan municipality, Nigeria. International Journal of Public Health and Epidemiology, 7(12), 1–5.
- Ilemi, J. S., Okoro, E., & Morufu, O. R. (2025). Rethinking plastic waste in Nigeria: Community-driven approaches for a circular economy. Oral presentation presented at the 1st International Conference of the Faculty of Science, Federal University Otuoke, Bayelsa State, 74.
- Iyasele, O. B., & Dangana, M. (2023). Determinants of waste disposal practices among residents of Agege Local Government Area of Lagos State, Nigeria. African Journal of Environment and Natural Science Research, 6(2), 60–81. [CrossRef]
- Iyoha, O. W., Omotoso, A. J., Usiobaifo, B. E., Raimi, M. O., & Ofor, T. N. (2025). Beyond the tap: Water insecurity, environmental contamination, and health inequities in Uselu, Benin City. JMIR Preprints. [CrossRef]
- Kader, S., Jaufer, L., Bashir, O., & Olalekan, R. M. (2023). Comparative study on the stormwater retention of organic waste substrates biochar, sawdust and wood bark retrieved from Psidium guajava L. species. Agriculture and Forestry, 69(1), 105–112. [CrossRef]
- Kumar, A., Samadder, S. R., & Kumar, S. (2022). Waste management in developing countries: A review. Journal of Environmental Management, 311, 114055.
- Kurniawan, T. A., Meidiana, C., Othman, M. H. D., Goh, H. H., & Chew, K. W. (2023). Strengthening waste recycling industry in Malang (Indonesia): Lessons from waste management in the era of industry 4.0. Journal of Cleaner Production, 382, 135296. [CrossRef]
- Maiurova, A., Kurniawan, T. A., Kustikova, M., Bykovskaia, E., Othman, M. H. D., Singh, D., & Goh, H. H. (2022). Promoting digital transformation in waste collection service and waste recycling in Moscow (Russia): Applying a circular economy paradigm to mitigate climate change impacts on the environment. Journal of Cleaner Production, 354, 131604. [CrossRef]
- Mordecai, O., Uchenna, G. E., Emma, A., Elemuwa, T. D., Gabriel, J. O., Egberipou, T., Etim, E. O., Christopher, O. E., Morufu, O. R., & Anuoluwapo, B. (2024). Analyzing Nigeria's journey towards sustainable development goals: A comprehensive review from inception to present. Qeios. [CrossRef]
- Morufu, O. R. (2025). Persistent plastic pollution and the need for a global convention. Oral Presentation Presented at the 1st International Conference of the Faculty of Science, Federal University Otuoke, Bayelsa State, 74.
- Morufu, O. R., Aziba-anyam, G. R., & Teddy, C. A. (2021). Silent pandemic: Evidence-based environmental and public health practices to respond to the Covid-19 crisis. IntechOpen. [CrossRef]
- Morufu, O. R., Aziba-anyam, G. R., & Teddy, C. A. (2021d). Evidence-based environmental and public health practices to respond to the COVID-19 crisis. Research Square. [CrossRef] [PubMed]
- Morufu, O. R., Christopher, O., Emeka, C. L., Ebikapaye, O., & Alabo, A. F. (2022). Beyond palliatives: Responding to the current flooding and preventing the next one from Kogi to Bayelsa State. Bayelsa State Judiciary Magazine, 4th Edition.
- Morufu, O. R., Olawale, H. S., Clinton, I. E., & et al. (2021c). Quality water not everywhere: Exploratory analysis of water quality across Ebocha-Obrikom oil and gas flaring area in the core Niger Delta region of Nigeria. Research Square. [CrossRef] [PubMed]
- Musa, A. A., Abdulahi, Y. M., Umar, M. D., Bello, S., & Muhammed, F. (2021). Knowledge, attitudes and practice of solid waste disposal among residents of a selected community in Kano State, Nigeria. International Journal of Community Medicine and Public Health, 8(8), 3760–3765. [CrossRef]
- National Population Commission. (2016). Nigerian national population census. NPC.
- Ndu, I. F., Jack, F. N., & Raimi, M. O. (2026a). Unseen threats in our water: Assessing bacterial contamination in institutional tap water and vended water (Meruwa) in Otuogidi-Ogbia and Ogbia Main Town, Bayelsa State, Nigeria. Preprints. [CrossRef]
- Norhaslina, H., & Shazwani, R. (2022). Knowledge, attitude and practice on waste management among University Students in Malaysia. Malaysian Journal of Tropical Geography, 48(2), 1–15. [CrossRef]
- Oboche, A. S. (2024). Challenges in urban waste management and the role of green technology: Exploring future trends in circular economy for sustainable solutions in Nakuru and Mombasa, Kenya. SSRN Electronic Journal. [CrossRef]
- Odipe, O. E., Raimi, M. O., & Suleiman, F. (2018). Assessment of heavy metals in effluent water discharges from textile industry and river water at close proximity: A comparison of two textile industries from Funtua and Zaria, North Western Nigeria. Madridge Journal of Agriculture and Environmental Sciences, 1(1), 1–6. [CrossRef]
- Ogunyemi, B. T., Ariyo, A. B., & Raimi, M. O. (2025). Toxic legacies and missed opportunities: Waste mismanagement, public health risks, and circular economy solutions in Nigeria. Oral presentation presented at the ACS-FUO Conference of the Faculty of Science, Federal University Otuoke, Bayelsa State, 107.
- Okoyen, E., Raimi, M. O., Omidiji, A. O., & Ebuete, A. W. (2020). Governing the environmental impact of dredging: Consequences for marine biodiversity in the Niger Delta Region of Nigeria. Insights Mining Science and Technology, 2(3), 555586. [CrossRef]
- Olalekan, R. M., Olawale, H. S., Clinton, I. E., & Opasola, A. O. (2022). Quality water, not everywhere: Assessing the hydrogeochemistry of water quality across Ebocha-Obrikom oil and gas flaring area in the core Niger Delta Region of Nigeria. Pollution, 8(3), 751–778.
- Olalekan, R. M., Vivien, O. T., Adedoyin, O. O., & et al. (2018). The sources of water supply, sanitation facilities and hygiene practices in oil producing communities in central senatorial district of Bayelsa state, Nigeria. MOJ Public Health, 7(6), 337–345. [CrossRef]
- Olanrewaju, J. A., Allen, S.-A. A., Samuel, K., Olabimiji, B. B., & Oladeji, F. O. (2023). Toilet functionality and cleanliness status of major motor parks in Ibadan metropolis, Nigeria. Journal of Materials Science Research and Reviews, 6(4), 737–758. https://journaljmsrr.com/index.php/JMSRR/article/view/284.
- Oluwaseun, E. O., Raimi, M. O., Nimisingha, D. S., Abdulraheem, A. F., Okolosi-P., E., Habeeb, M. L., & Mary, F. (2019). Assessment of environmental sanitation, food safety knowledge, handling practice among food handlers of Bukateria complexes in Iju Town, Akure North of Ondo-State, Nigeria. Acta Scientific Nutritional Health, 3(6), 186–200. [CrossRef]
- Omang, D. I., John, G. E., Inah, S. A., & Bisong, J. O. (2021). Public health implication of solid waste generated by households in Bekwarra Local Government area. African Health Sciences, 21(3), 1467–1473. [CrossRef] [PubMed]
- Omotoso, A. J., Ojile, M. O., & Morufu, O. R. (2025). Uncovering the hidden burden: Water, sanitation, and hygiene (WaSH) gaps and their impact on health and learning outcomes in secondary schools, Ede South LGA, Nigeria. Authorea. [CrossRef] [PubMed]
- Opasola, O. A., & Raimi, M. O. (2025). From crisis to catalyst: Leveraging public health emergencies to redesign urban health policy in Nigerian megacities. Oral Presentation Presented at the 3rd Ku8+International Conference, Kwara State University, Malete.
- Oweibia, M., Elemuwa, U. G., Akpan, E., & et al. (2024). Analyzing Nigeria's journey towards sustainable development goals: A comprehensive review from inception to present. F1000Research, 13, 984. [CrossRef]
- Raimi, M. O., Abdulraheem, A. F., Major, I., Odipe, O. E., Isa, H. M., & Onyeche, C. (2019a). The sources of water supply, sanitation facilities and hygiene practices in an island community: Amassoma, Bayelsa State, Nigeria. Public Health Open Access, 3(1), 000134. [CrossRef]
- Raimi, M. O., Mcfubara, K. G., Abisoye, O. S., Ifeanyichukwu, E. C., Henry, S. O., & Raimi, G. A. (2021). Responding to the call through translating science into impact: Building an evidence-based approaches to effectively curb public health emergencies [COVID-19 Crisis]. Global Journal of Epidemiology and Infectious Disease, 1(1). [CrossRef]
- Raimi, M. O., Moses, T., Okoyen, E., Sawyerr, H. O., Joseph, B. O., & Oyinlola, B. O. (2020). A beacon for dark times: Rethinking scientific evidence for environmental and public health action in the coronavirus diseases 2019 era. Medical and Research Microbiology, 1(3).
- Raimi, M. O., & Odubo, T. R. (2022). Dutch diseases and resources curse: Key regulatory challenges and opportunities associated with extractive industries in Nigeria. 8th National Conference on Political Stability, Security and Economic Development, Merit House, Abuja-Nigeria.
- Raimi, M. O., Omidiji, A. O., Adeolu, T. A., Odipe, O. E., & Babatunde, A. (2019). An analysis of Bayelsa State water challenges on the rise and its possible solutions. Acta Scientific Agriculture, 3(8), 110–125. [CrossRef]
- Raimi, M. O., Omidiji, A. O., Odipe, O. E., & Suleiman, H. O. (2019b). Open defecation and public toilets importance: An economic perspective. Preventing Health Care in Nigeria: Everyone, Everywhere Leaving Nobody Behind, National Open University Auditorium, Jabi Abuja.
- Raimi, M. O., Pigha, T. K., & Ochayi, E. O. (2017d). Water-related problems and health conditions in the oil-producing communities in central senatorial district of Bayelsa State. Imperial Journal of Interdisciplinary Research (IJIR), 3(6). ISSN: 2454-1362.
- Raimi, M. O., & Raimi, A. G. (2020). The toughest triage in decision impacts: Rethinking scientific evidence for environmental and human health action in the times of concomitant global crises. CPQ Medicine, 11(1), 01–05.
- Rauf, Y. O., & Raimi, M. O. (2023). Wastes, wastes, everywhere not a place to breathe: Redressing and undressing Ilorin and Yenagoa city. AfricArXiv. [CrossRef]
- Raufu, Y. O. (2025). Assessment of operations and challenges of wastes management operators in Ilorin Metropolis. International Journal of Advanced Research in Multidisciplinary Studies (IJARMS), 5(1).
- Raufu, Y. O., Abolayo, T. T., Olusegun, A. O., Sawyeer, H. O., & Raimi, M. O. (2026). Assessment of solid wastes generation, characterisation and resource recovery in Federal University of Health Sciences Ila-Orangun. Preprints. [CrossRef]
- Raufu, Y. O., Afolabi, O. O., Eyitayo, B. M., Morufu, R. O., & Lateefat, O. (2023). Assessment of solid wastes management practices and its challenges in Kwara State, Nigeria. International Journal of Advanced Research in Multidisciplinary Studies (IJARMS), 3(1).
- Raufu, Y. O., & Morufu, R. O. (2023). Wastes, wastes, everywhere not a place to breath: Redressing and undressing Ilorin and Yenagoa city. AfricArXiv. [CrossRef]
- Raufu, Y. O., Olayinka, A. S., & Olawale, S. H. (2022). Residents' perception on central storage of solid wastes in Ilorin Metropolis, Kwara State, Nigeria. ES Journal of Public Health, 3(1). https://www.escientificlibrary.com.
- Raufu, Y. O., Olayinka, A. S., Raimi, M. O., Olawale, S. H., & Olabisi, O. L. (2023). Assessment of occupational risks of waste scavenging in Ilorin metropolis. AfricArXiv. [CrossRef]
- Sampson-Akpan, P. E. (2009). Solid waste management in Calabar, Cross River State. University of Calabar.
- Sarah, S. J., Morufu, O. R., Josephine, D. K., & et al. (2024). Assessing air quality at waste dump site of Plateau State University, Bokkos, Nigeria: Evaluating socio-economic and health implications for the community. Authorea. [CrossRef] [PubMed]
- Sawyerr, H. O., & Raimi, M. O. (2025). Surveillance in the shadows: Reinventing community-based disease monitoring systems in rural Nigeria. Oral Presentation Presented at the 3rd Ku8+International Conference, Kwara State University, Malete.
- Scarlat, N., Motola, V., Dallemand, J. F., Monforti-Ferrario, F., & Mofor, L. (2015). Evaluation of energy potential of municipal solid waste from African urban areas. Renewable and Sustainable Energy Reviews, 50, 1269–1286. [CrossRef]
- Sharholy, M., Ahmad, K., Mahmood, G., & Trivedi, R. C. (2008). Municipal solid waste management in Indian cities – A review. Waste Management, 28(2), 459–467. [CrossRef] [PubMed]
- Singh, J., Kumar, P., & Kumar, V. (2020). Waste management practices in India: A review. Journal of Cleaner Production, 287, 120718.
- Suleiman, R. M., Raimi, M. O., & Sawyerr, H. O. (2019). A deep dive into the review of National Environmental Standards and Regulations Enforcement Agency (NESREA) Act. International Research Journal of Applied Sciences. https://scirange.com/abstract/irjas.2019.108.125.
- Taelman, S. E., Sanjuan-Delmas, D., Tonini, D., & Dewulf, J. (2020). An operational framework for sustainability assessment including local to global impacts: Focus on waste management systems. Resources, Conservation and Recycling, 162, 104964. [CrossRef]
- Teddy, C. A., Christopher, O. E., & Morufu, O. R. (2025). Community engagement and social innovation for environmental justice in Sub-Saharan Africa. Oral Presentation Presented at the 1st International Conference of the Faculty of Science, Federal University Otuoke, Bayelsa State, 75.
- Uba, U. J., Efut, E. N., Obeten, U. B., Asuquo, E. E., & Uba, J. C. (2023). Sociodemographic factors and environmental workers' knowledge of the impact of awareness creation on sustainable disposal of solid wastes. Heliyon, 9(7), e18122. [CrossRef] [PubMed]
- United Nations Environment Programme. (2019). Global waste disposal outlook. https://www.unenvironment.org/resources/report/global-waste-disposal-outlook.
- World Bank. (2019). What a waste: Solid waste disposal in Asia. Urban Development Sector Unit, East Asia and Pacific Region. www.worldbank.org/urban/solid_wm/erm/CWG%20folder.uwp1.pdf.
- World Health Organization. (2022). Waste and human health. https://www.who.int/news-room/fact-sheets/detail/hazardous-waste-and-its-health-impact.
- World Health Organization. (2025). Progress on household drinking-water, sanitation and hygiene 2000–2024: Special focus on inequalities. https://www.who.int/publications/m/item/progress-on-household-drinking-water-sanitation-and-hygiene-2000-2024--special-focus-on-iniequalities.
- YES Programs. (2015). Bringing safety and sanitation to the Jalingo Motor Park. www.yesprograms.org/stories/bringing-safety-and-sanitation-jalingo-motor-park.
- Yusuf, O. R., Opasola, O. A., Adewoye, S. O., Raimi, O. M., & Balogun, E. M. (2023). Assessment of occupational risks of wastes scavenging in Ilorin Metropolis. Journal of Agriculture, Earth and Environmental Sciences, 2(3), 1–8.
- Zhou, Z., Tang, Y., Dong, J., Chi, Y., Ni, M., Li, N., & Zhang, Y. (2018). Environmental performance evolution of municipal solid waste management by life cycle assessment in Hangzhou, China. Journal of Environmental Management, 227, 23–33. [CrossRef] [PubMed]
Figure 1.
Structural and operational characteristics of the six Ilorin motor parks.
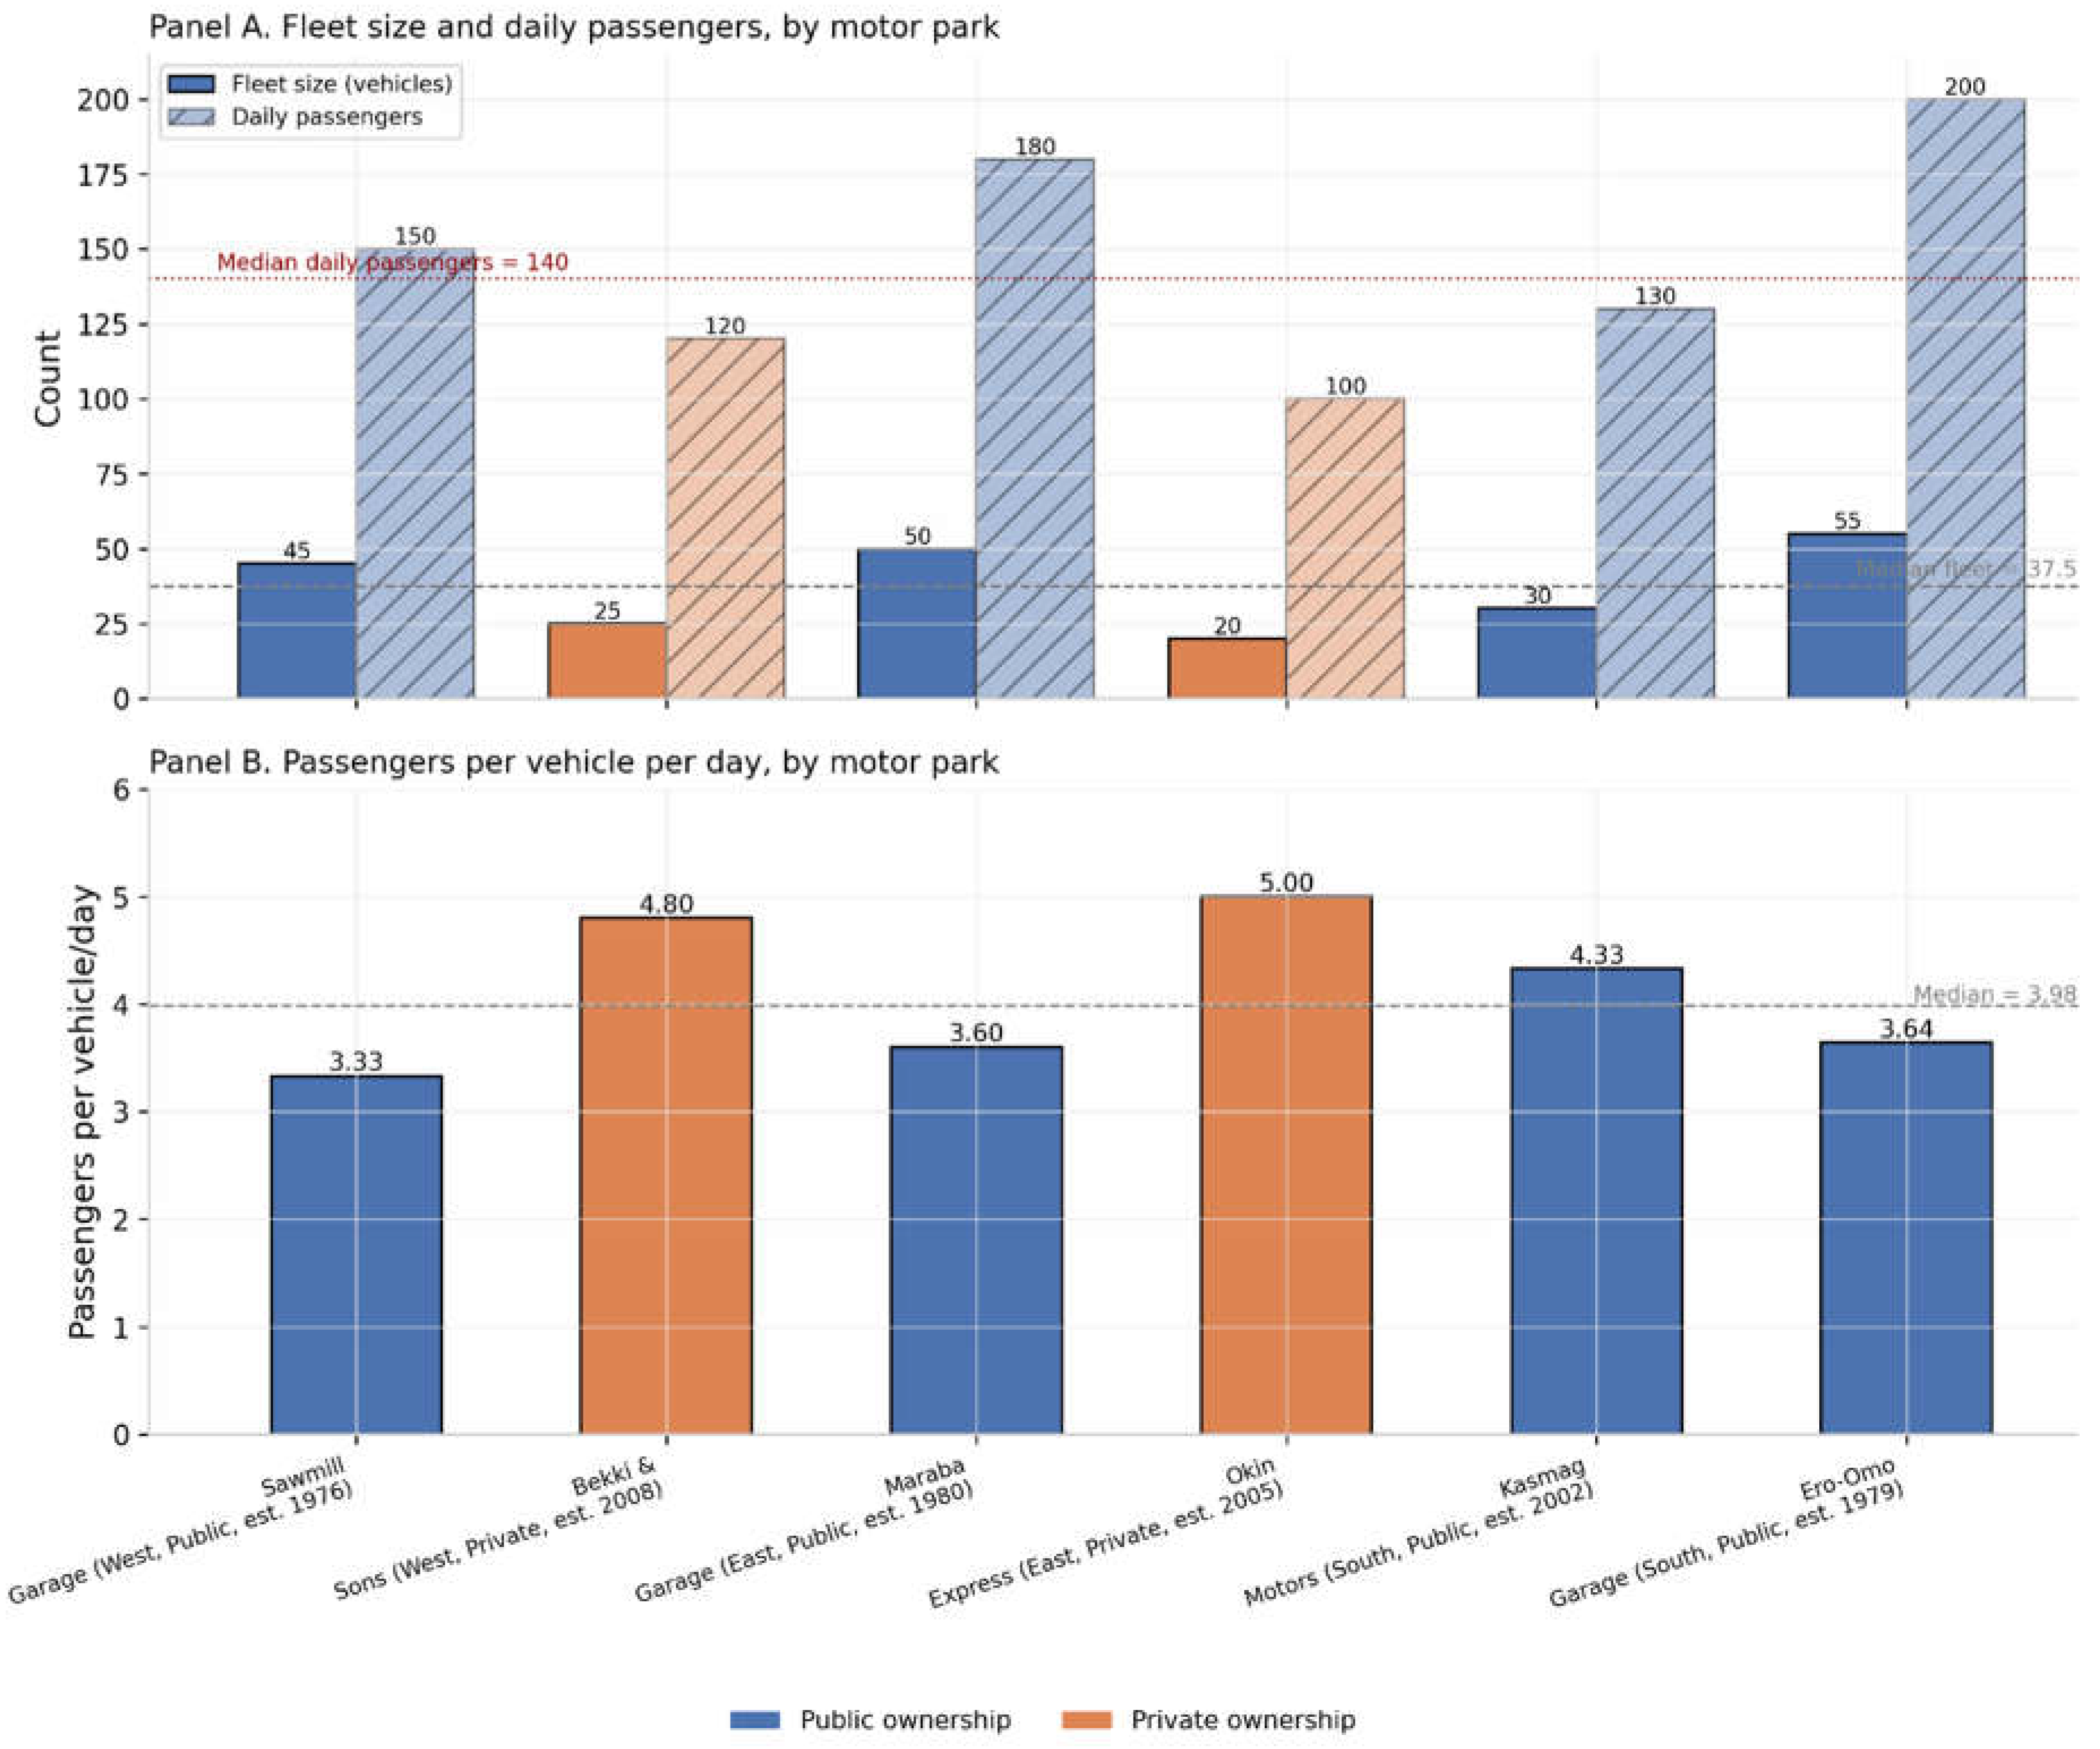
Figure 2.
Facility-level operational scale according to ownership type.
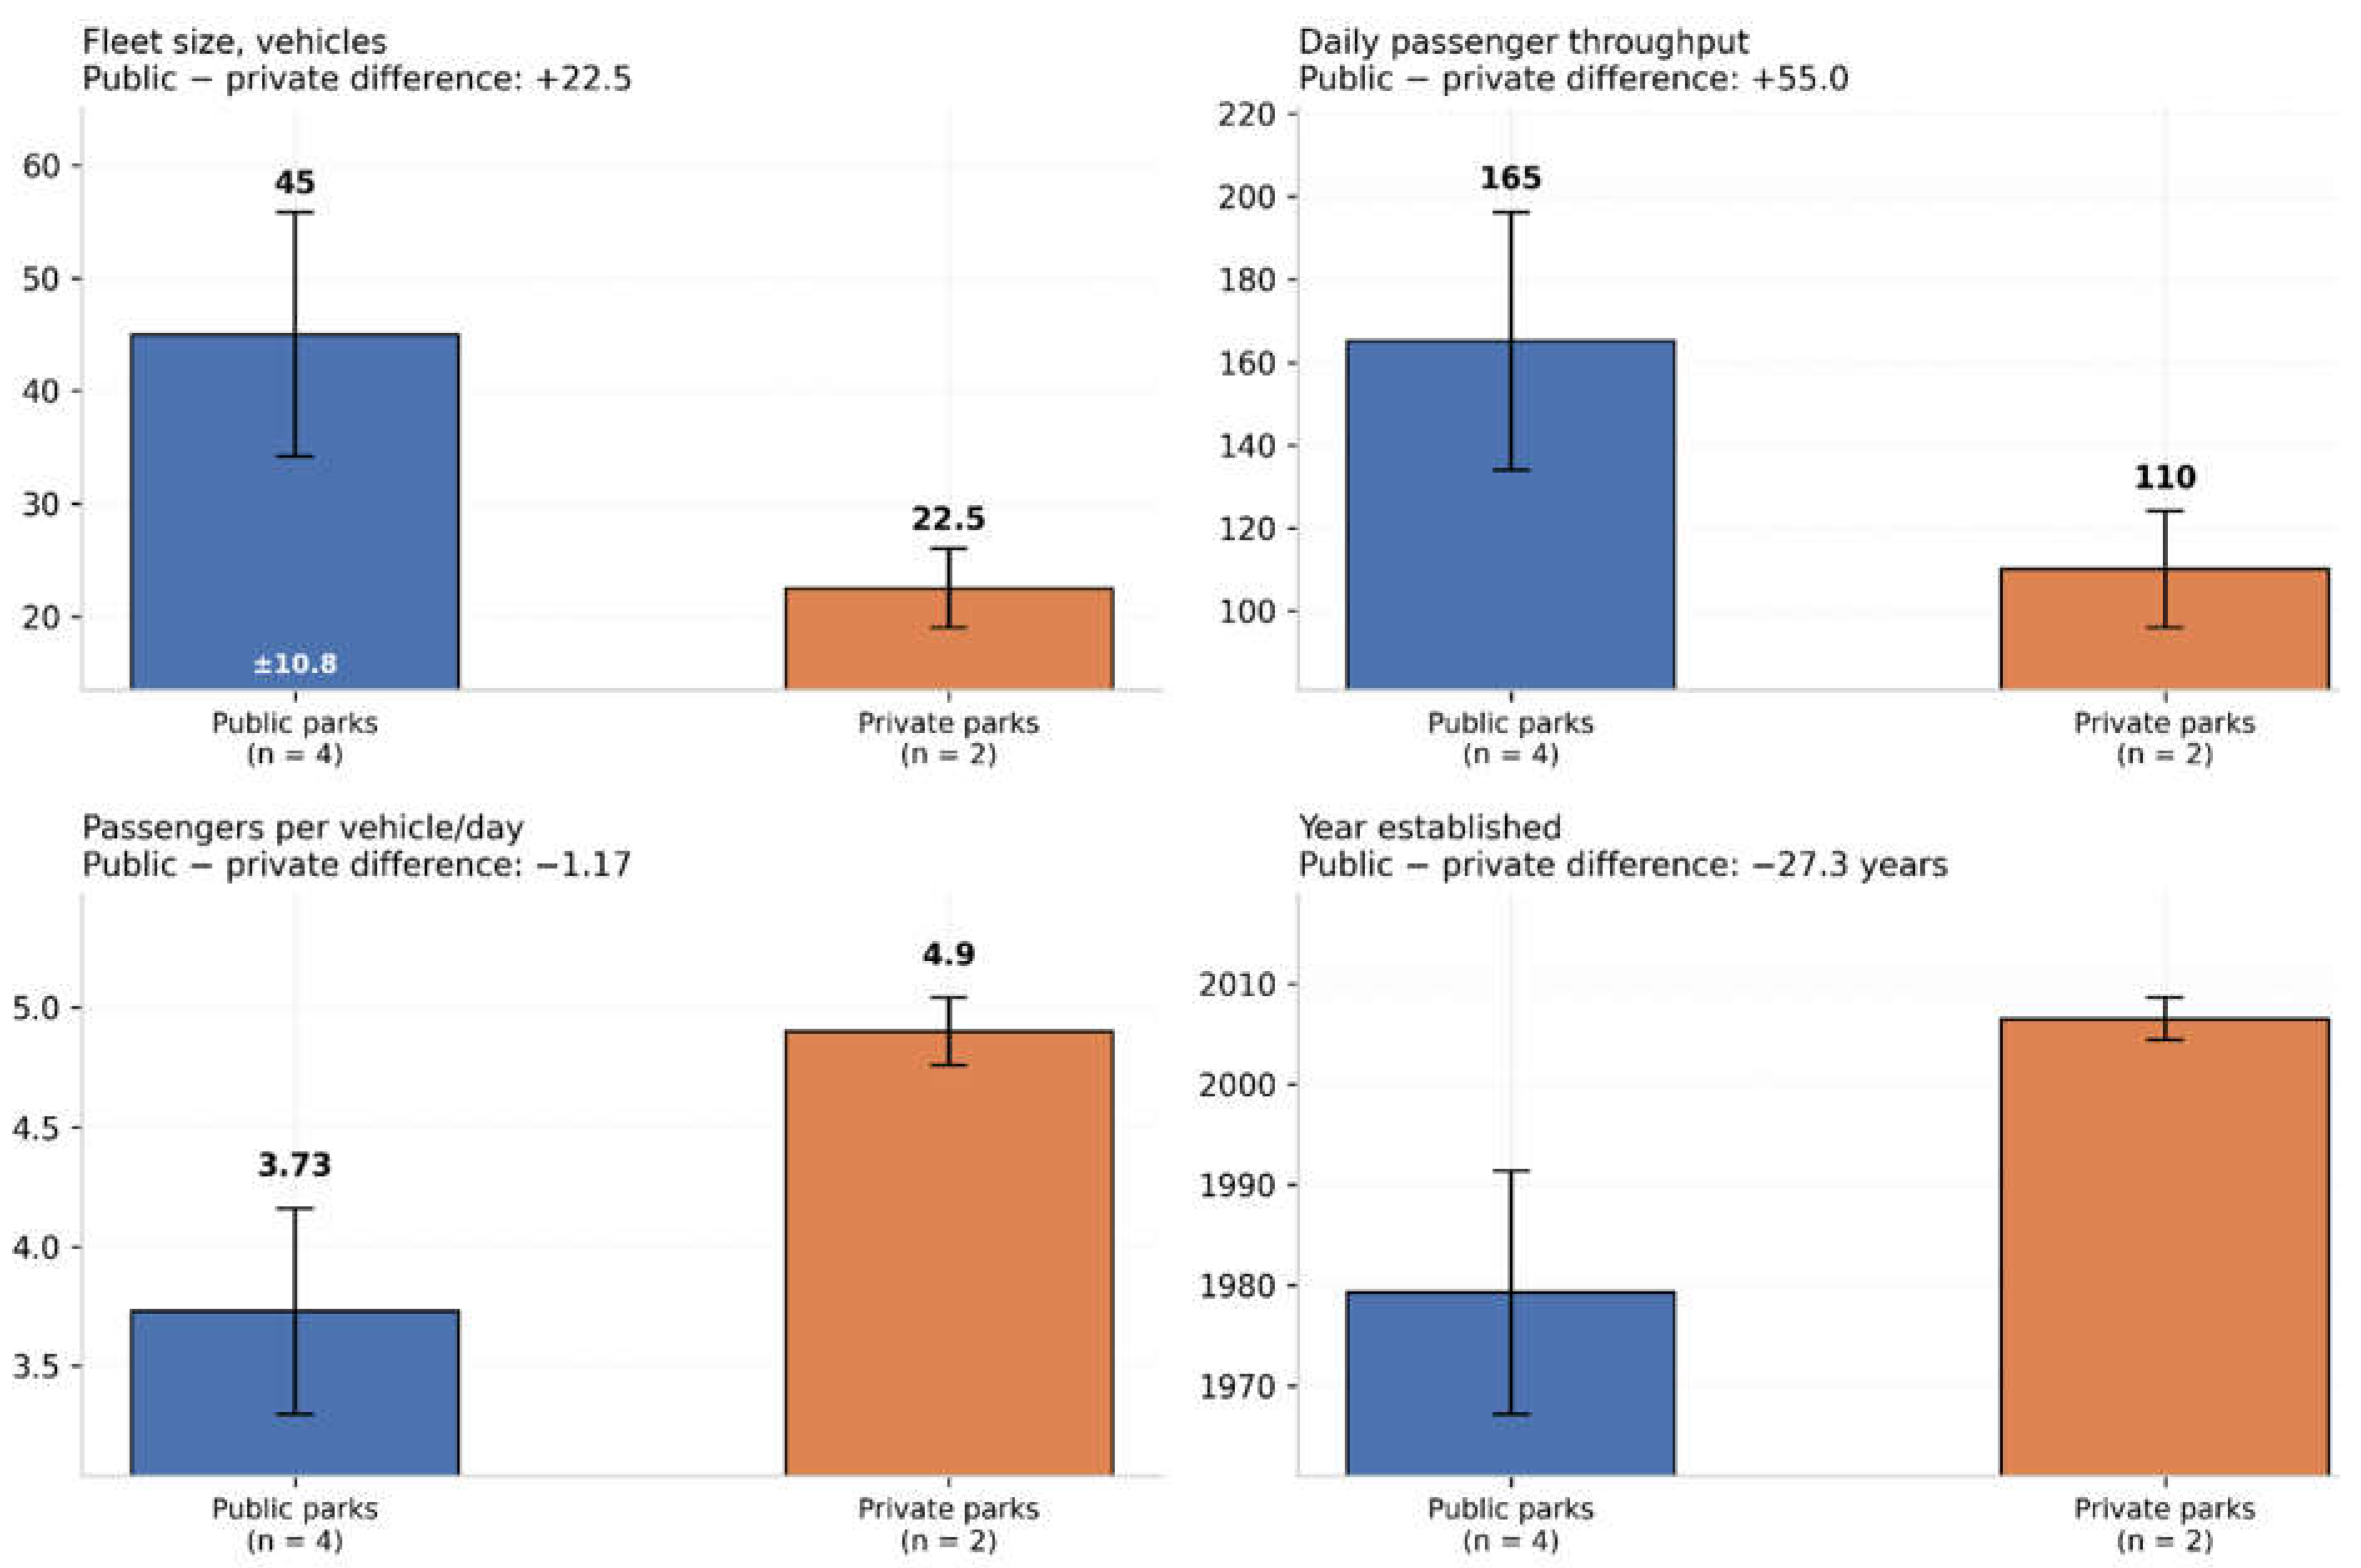
Figure 3.
Association between fleet size and daily passenger throughput across the six motor parks.
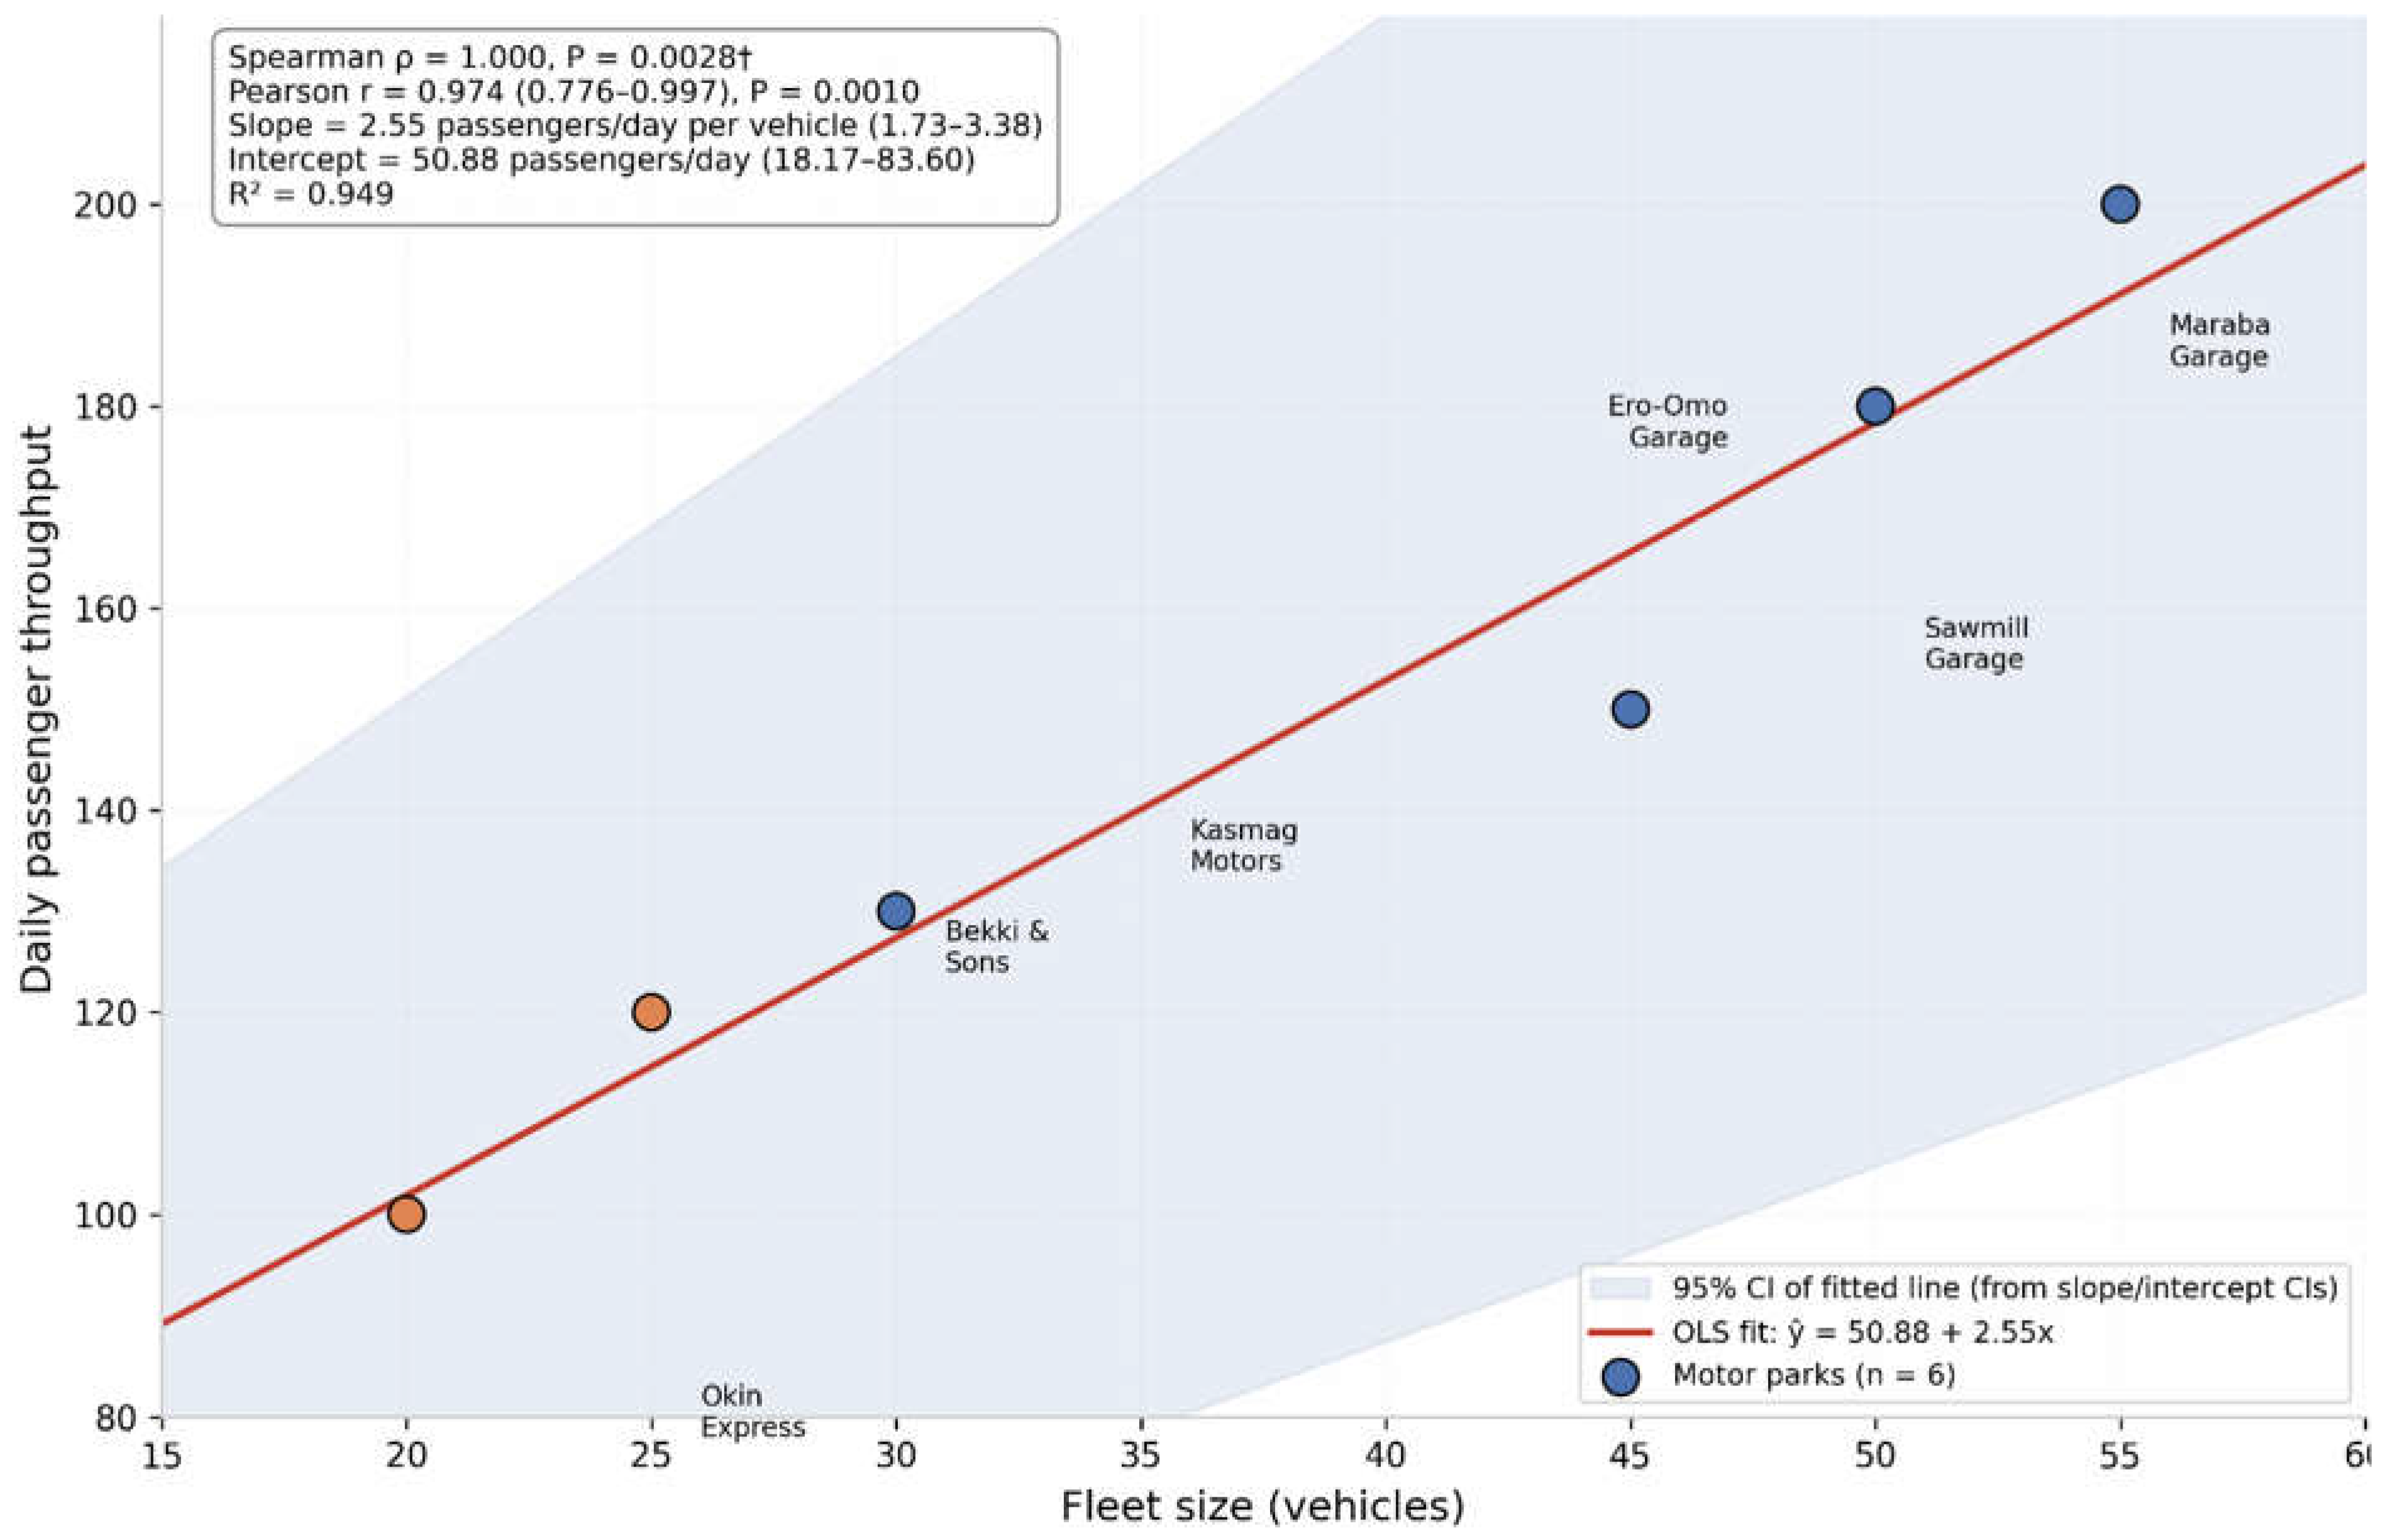
Figure 4.
Distribution of waste-storage modalities among respondents across the six selected motor parks in Ilorin.
Figure 4.
Distribution of waste-storage modalities among respondents across the six selected motor parks in Ilorin.
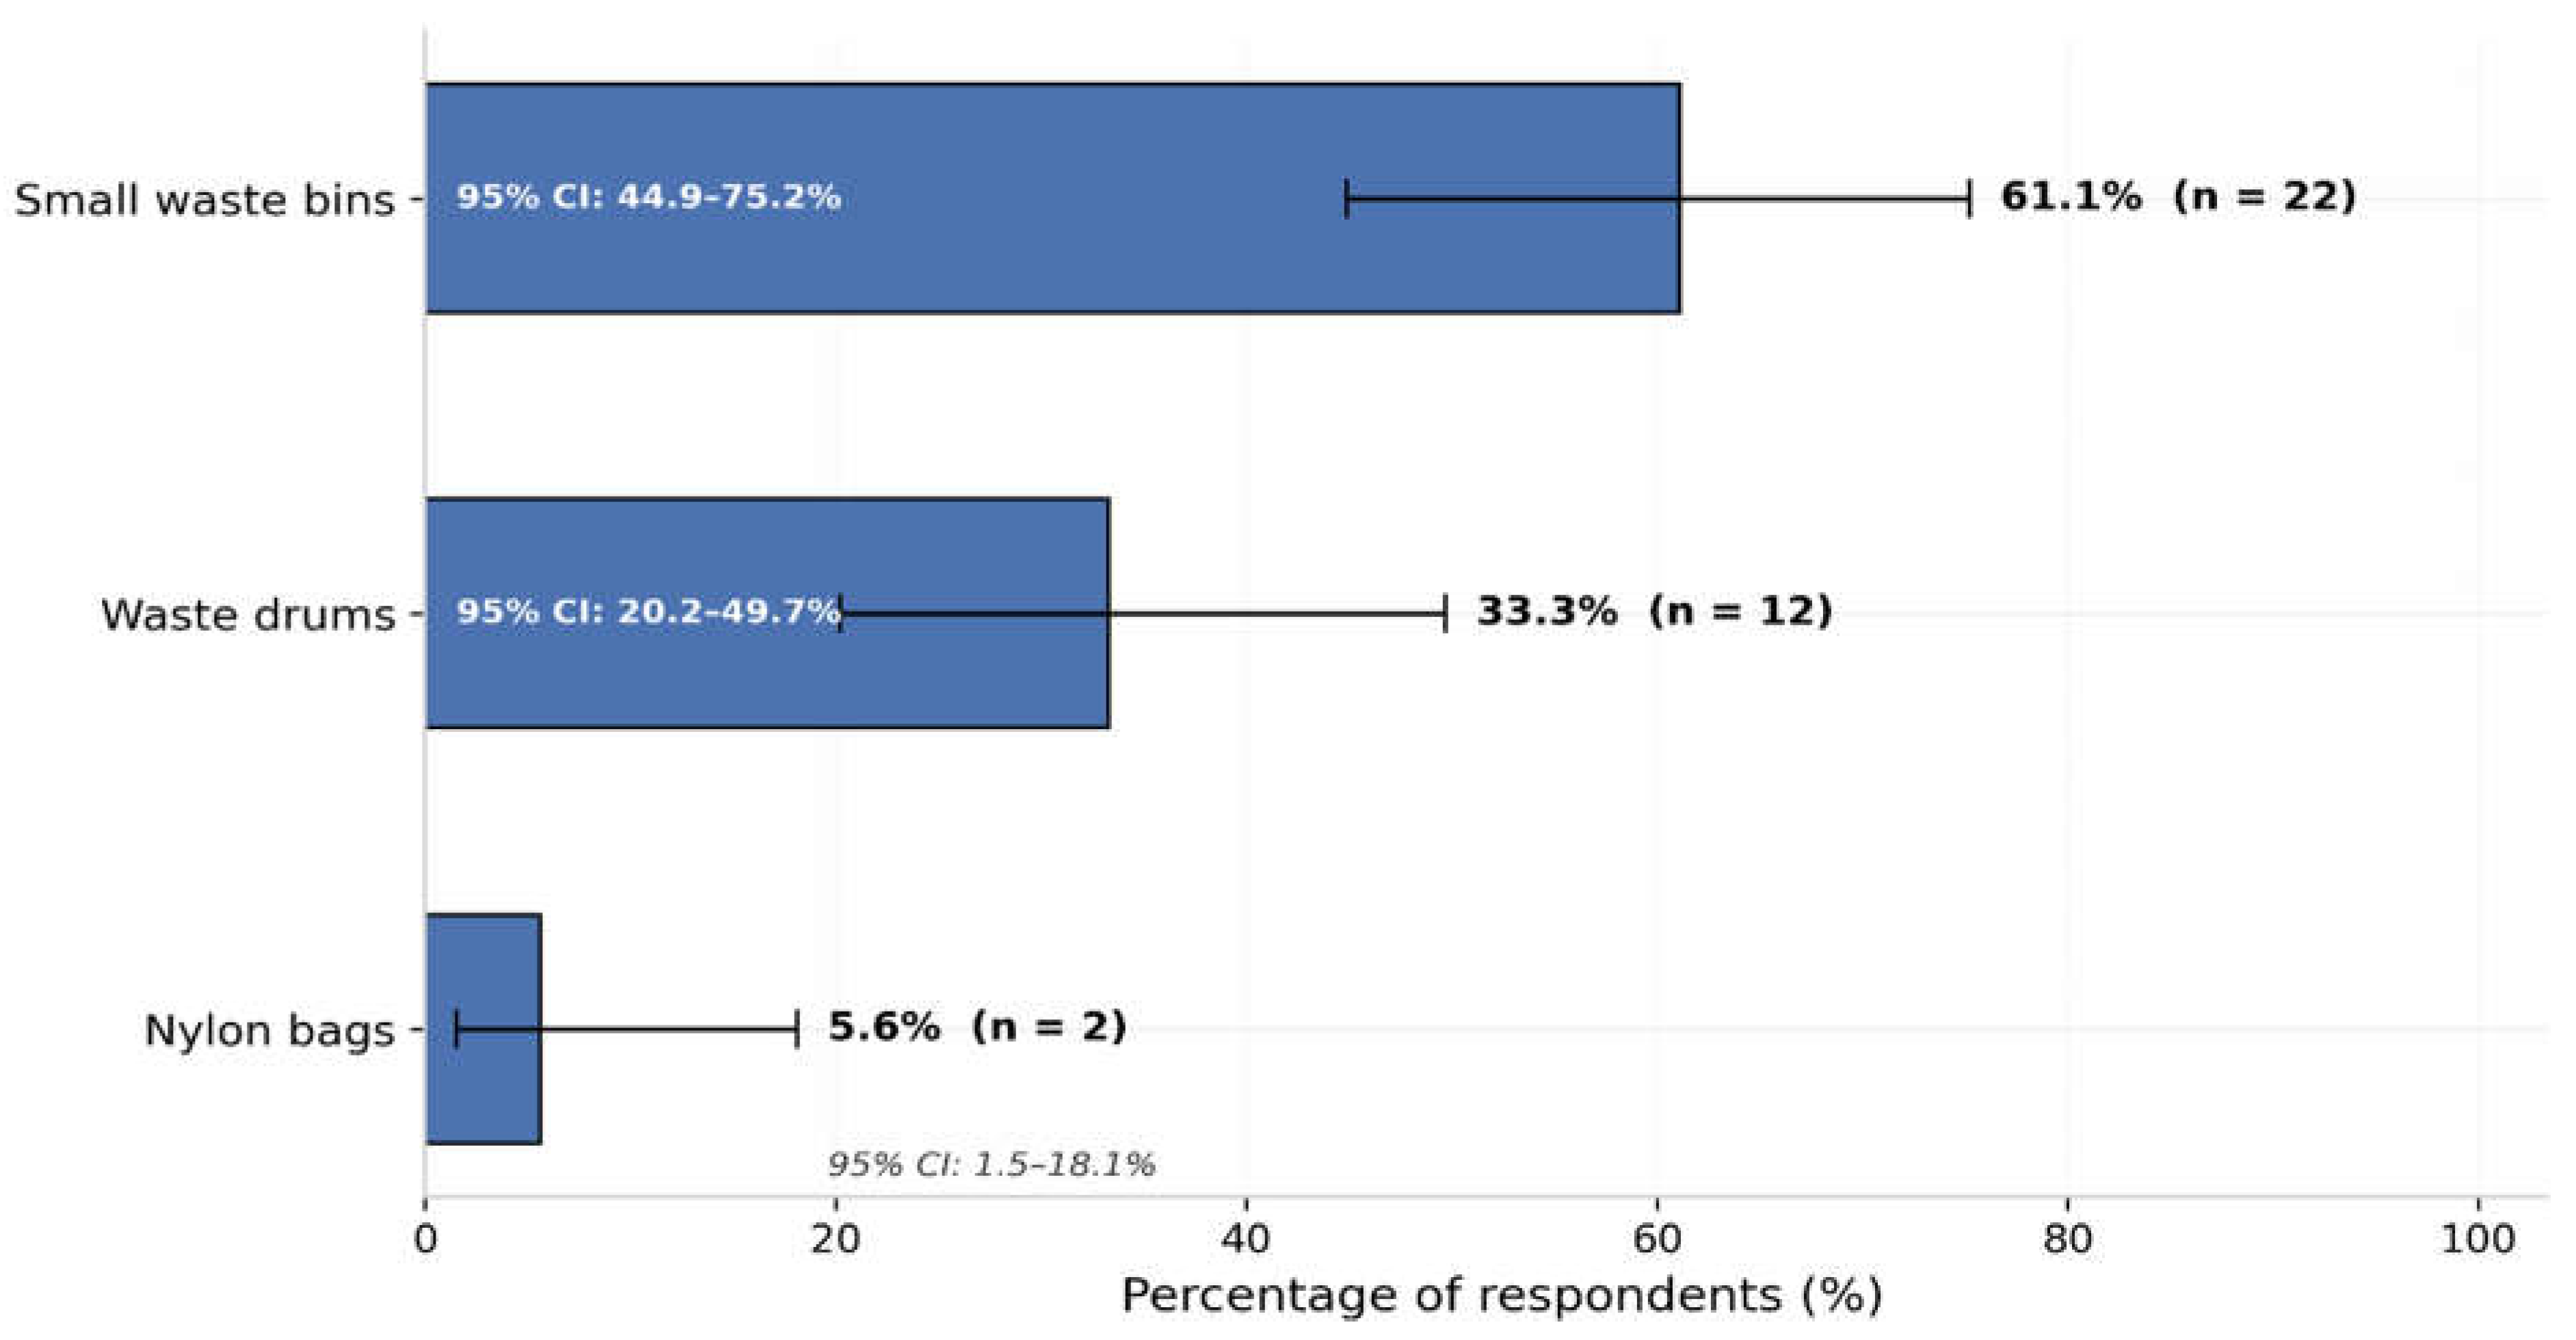
Figure 5.
Test of the observed distribution of waste-storage modalities.
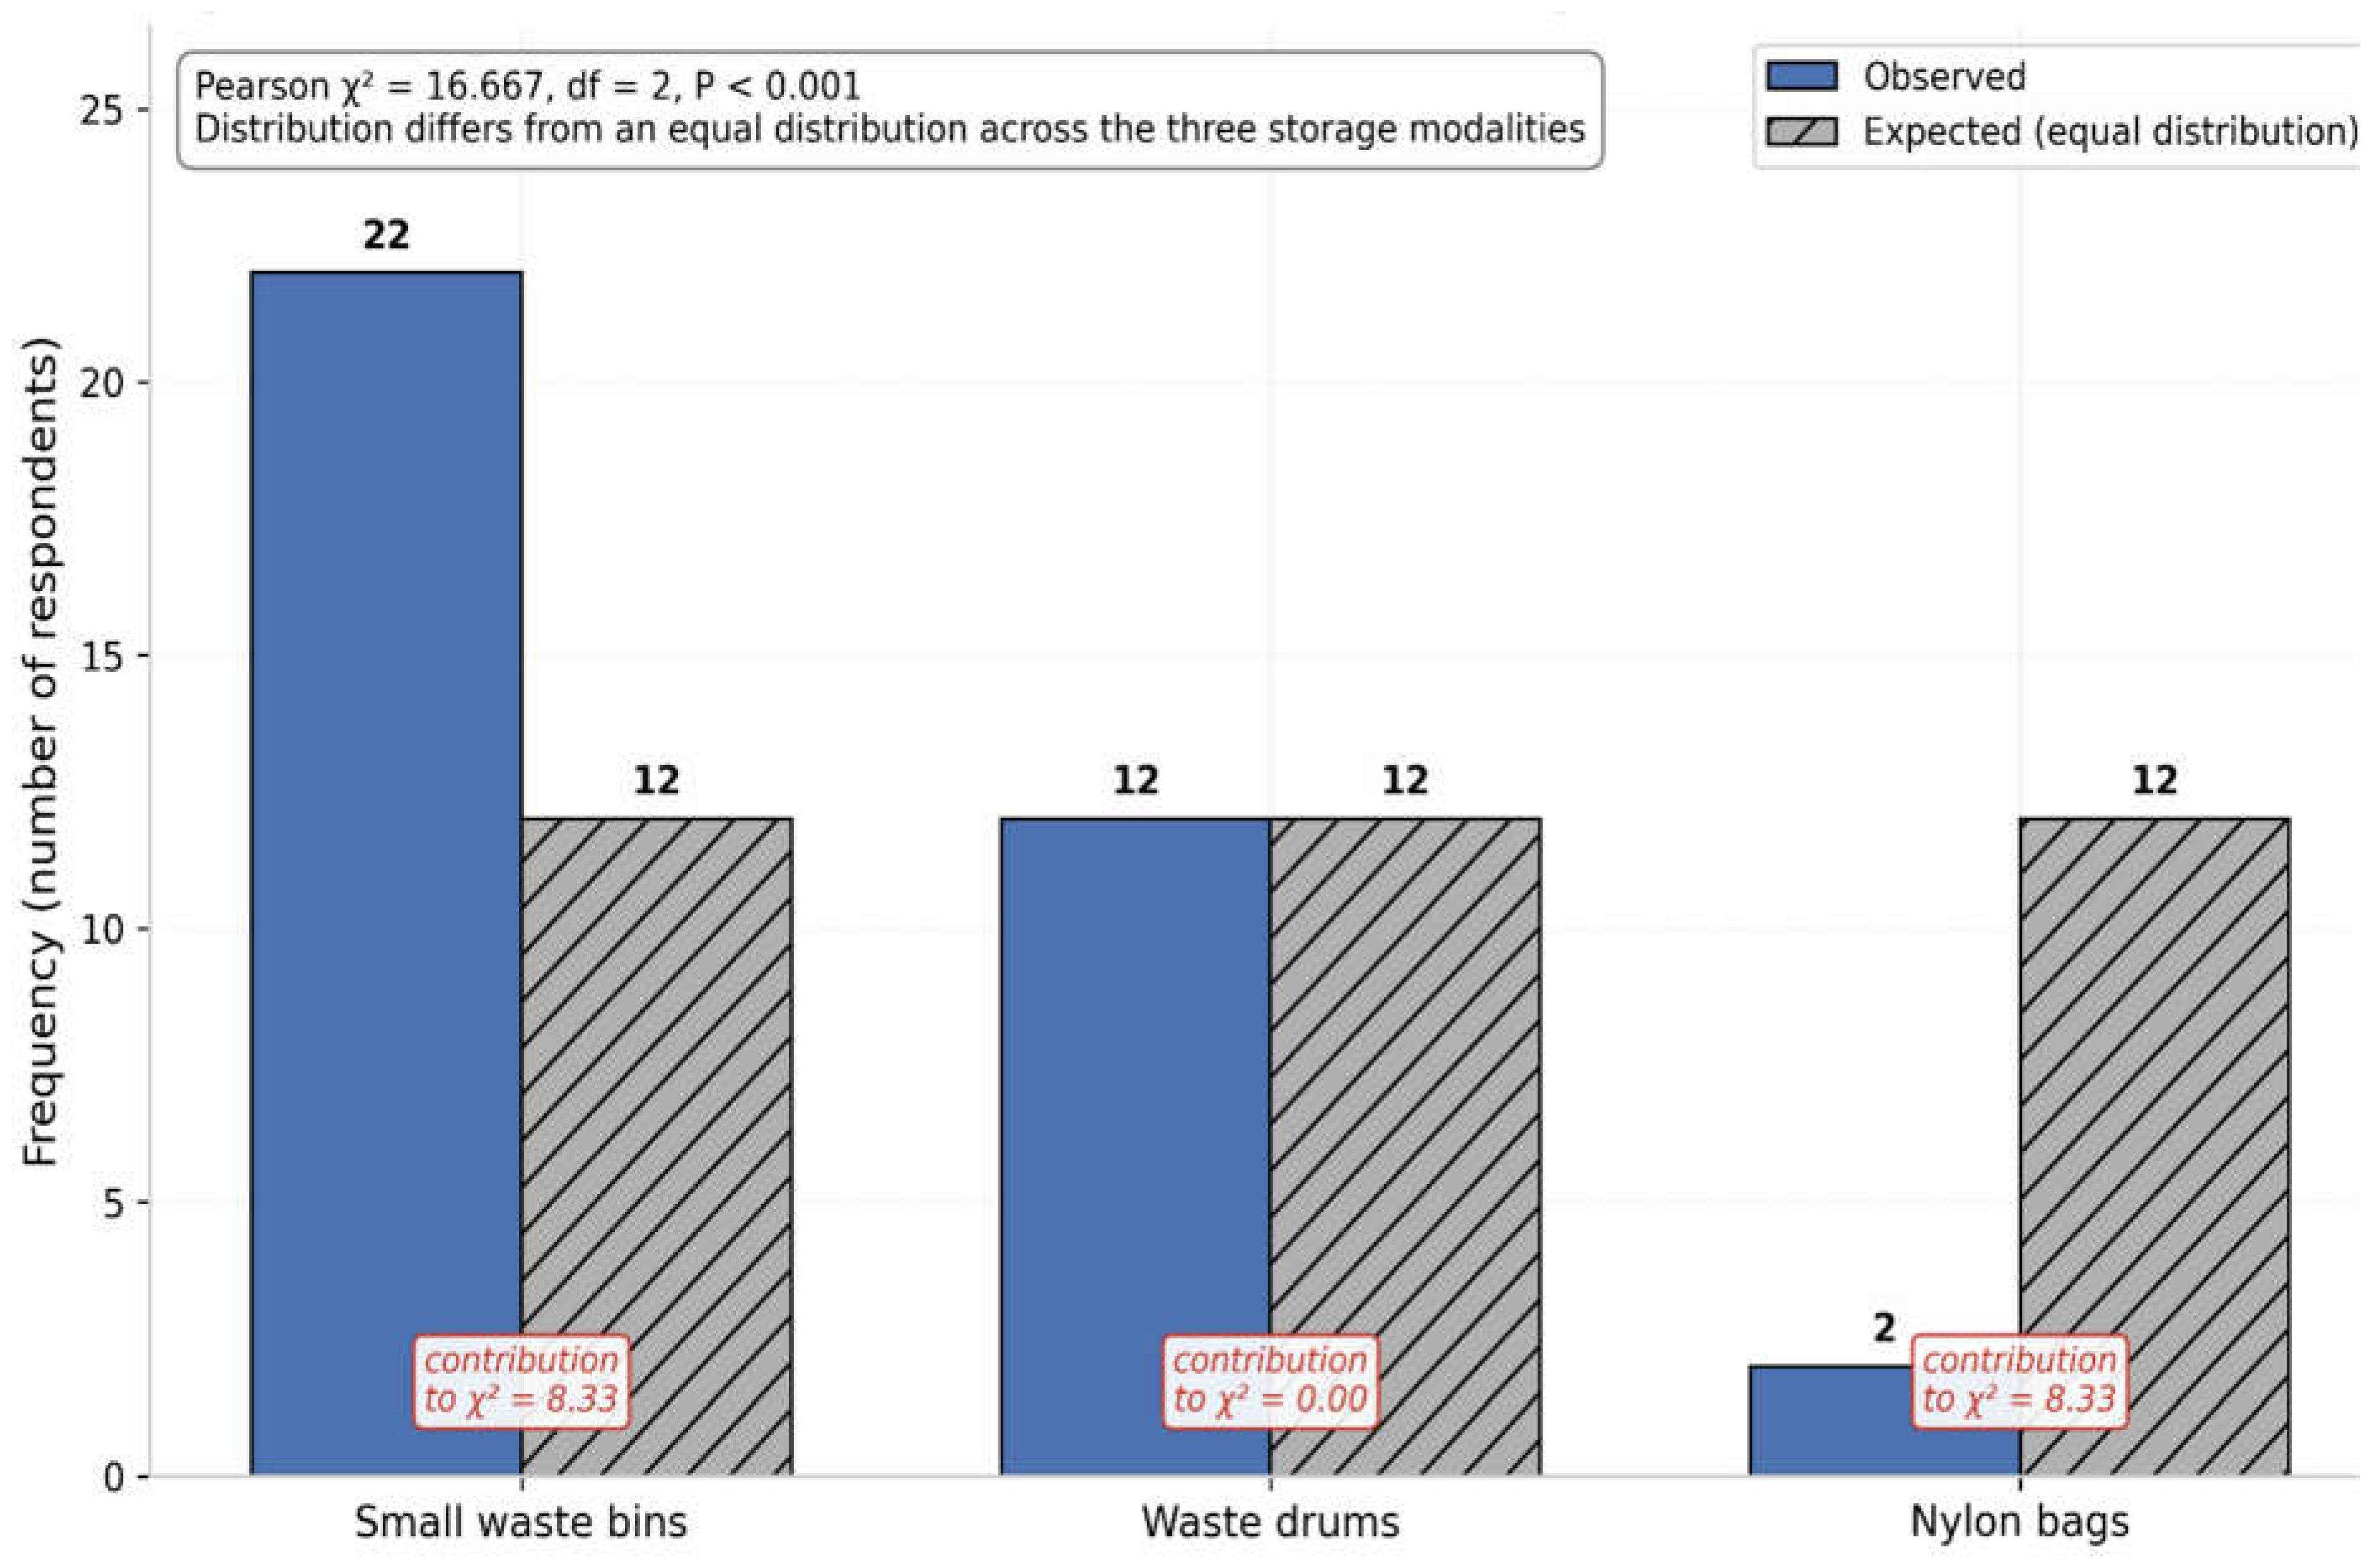
Figure 6.
Waste disposal practices among respondents across the six selected motor parks in ilorin.
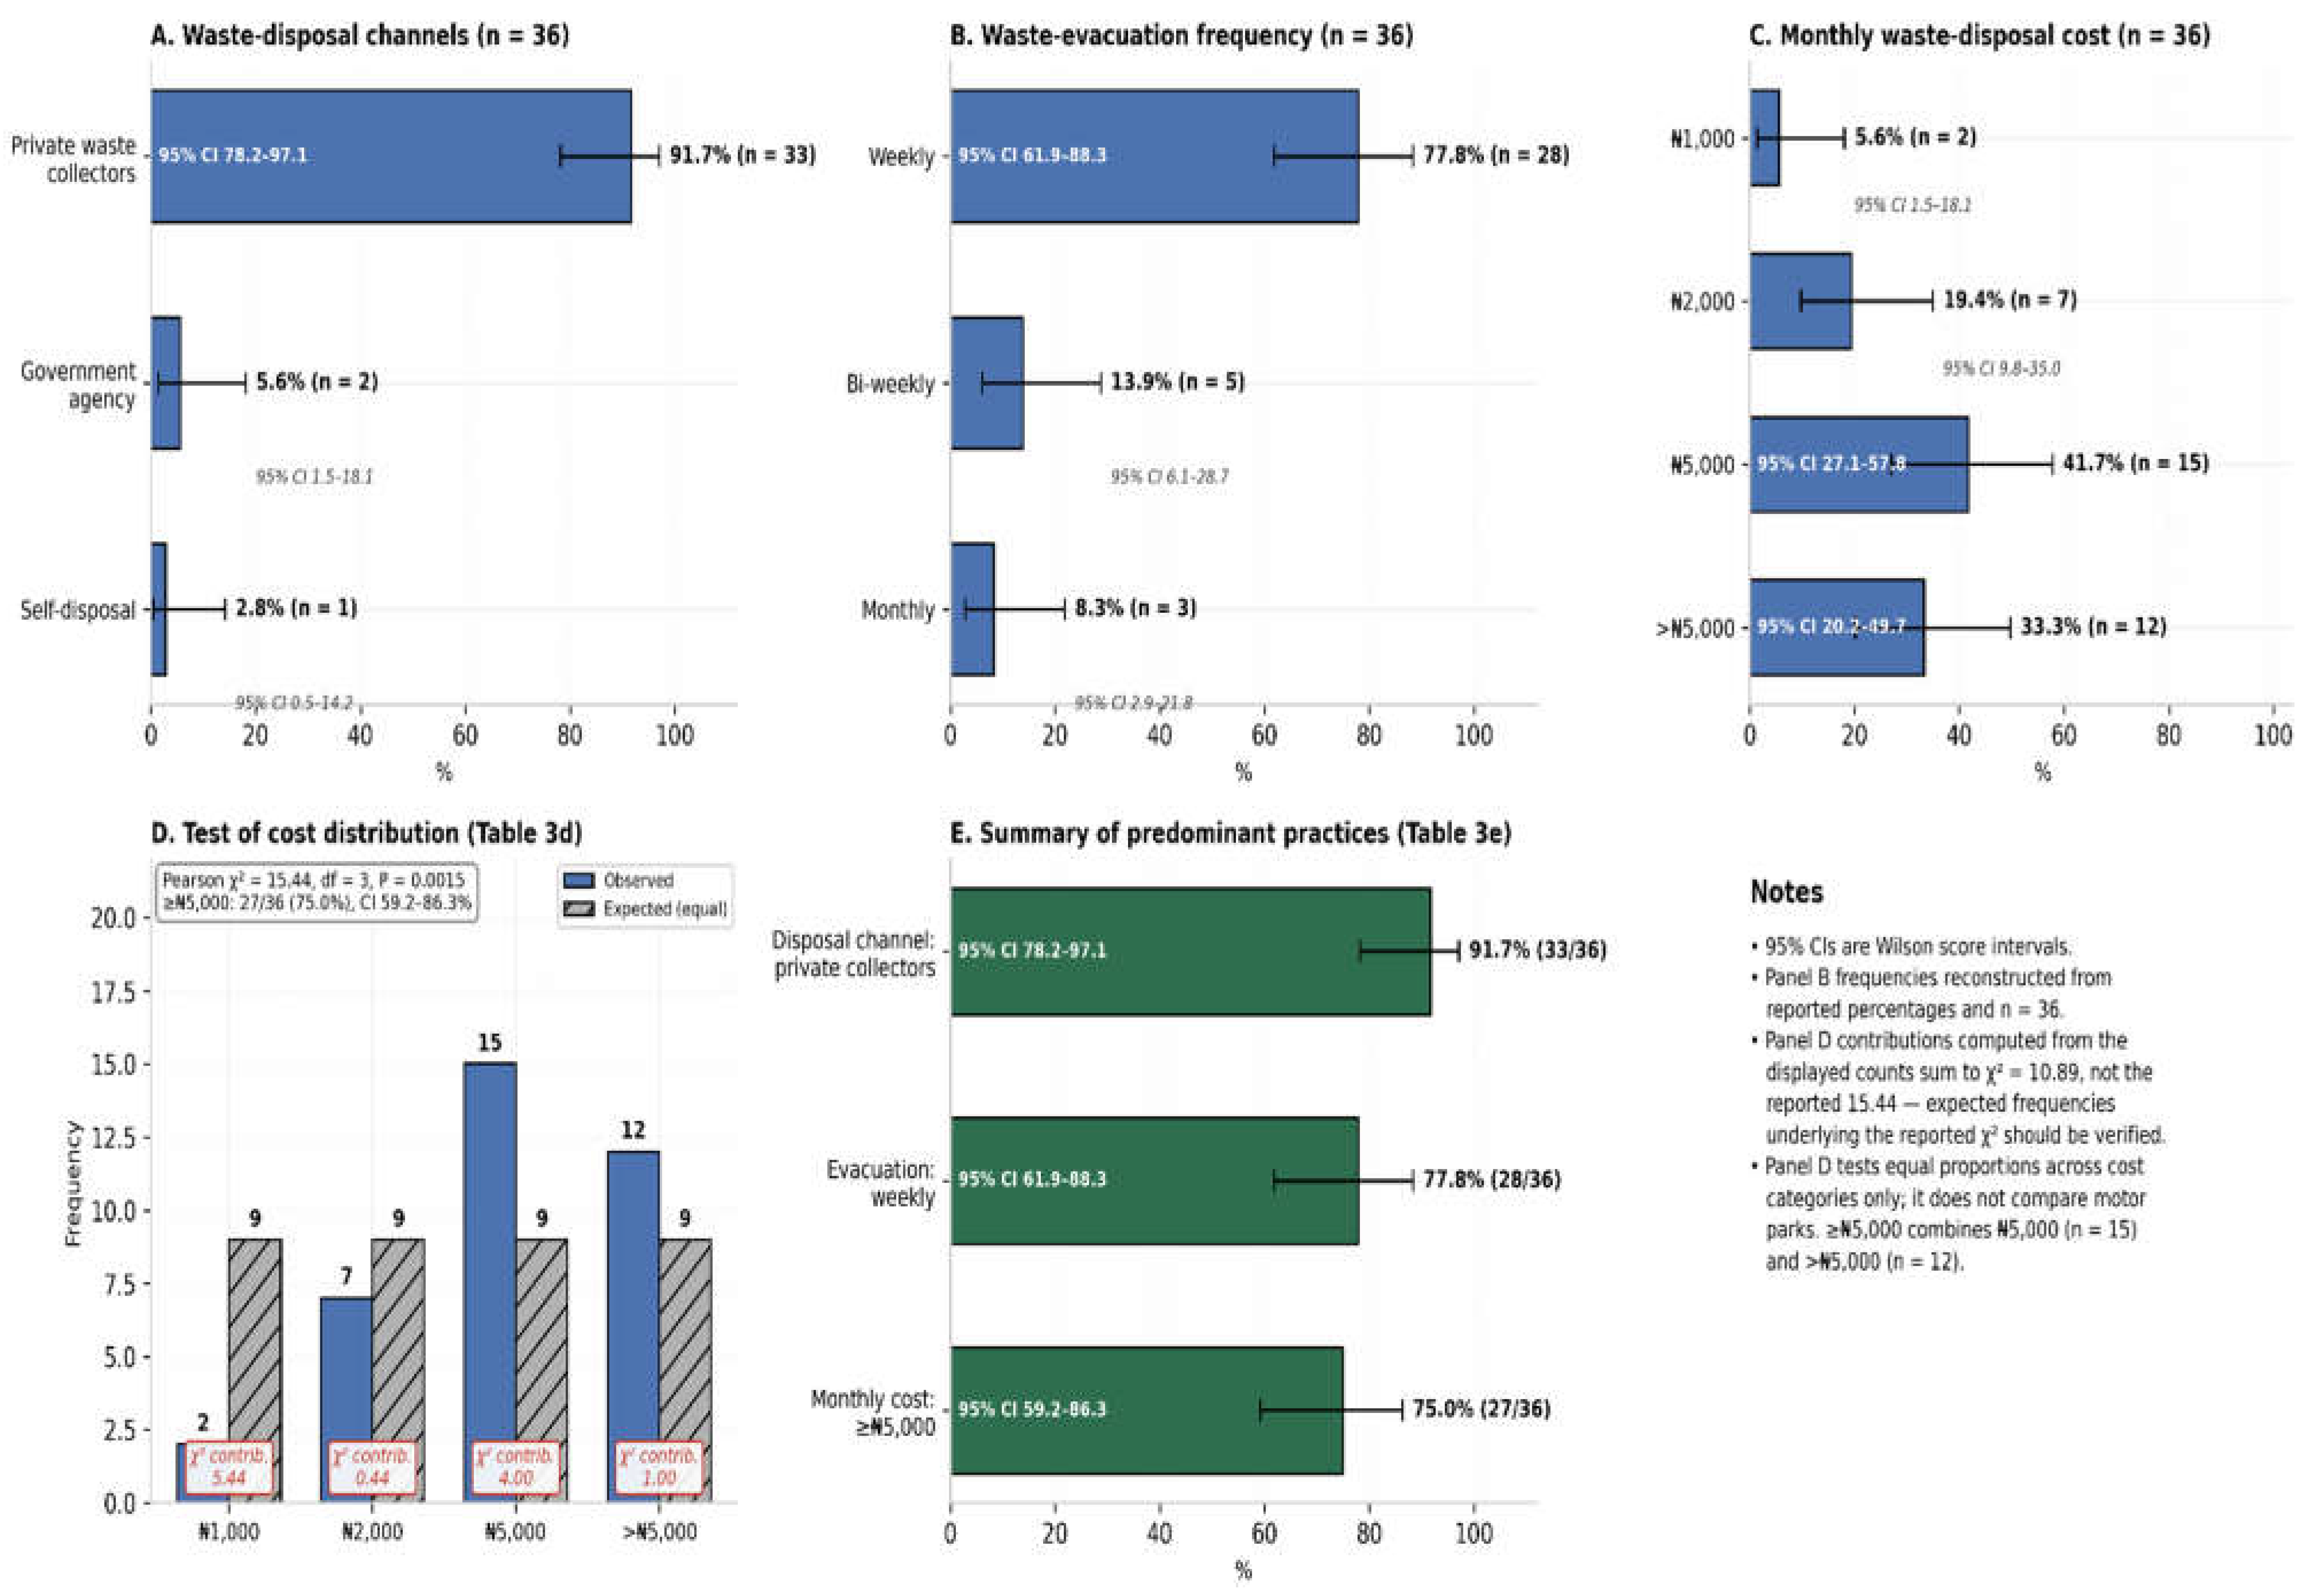
Figure 7.
Respondents' ratings of Sanitation & Waste Commercialization policies.
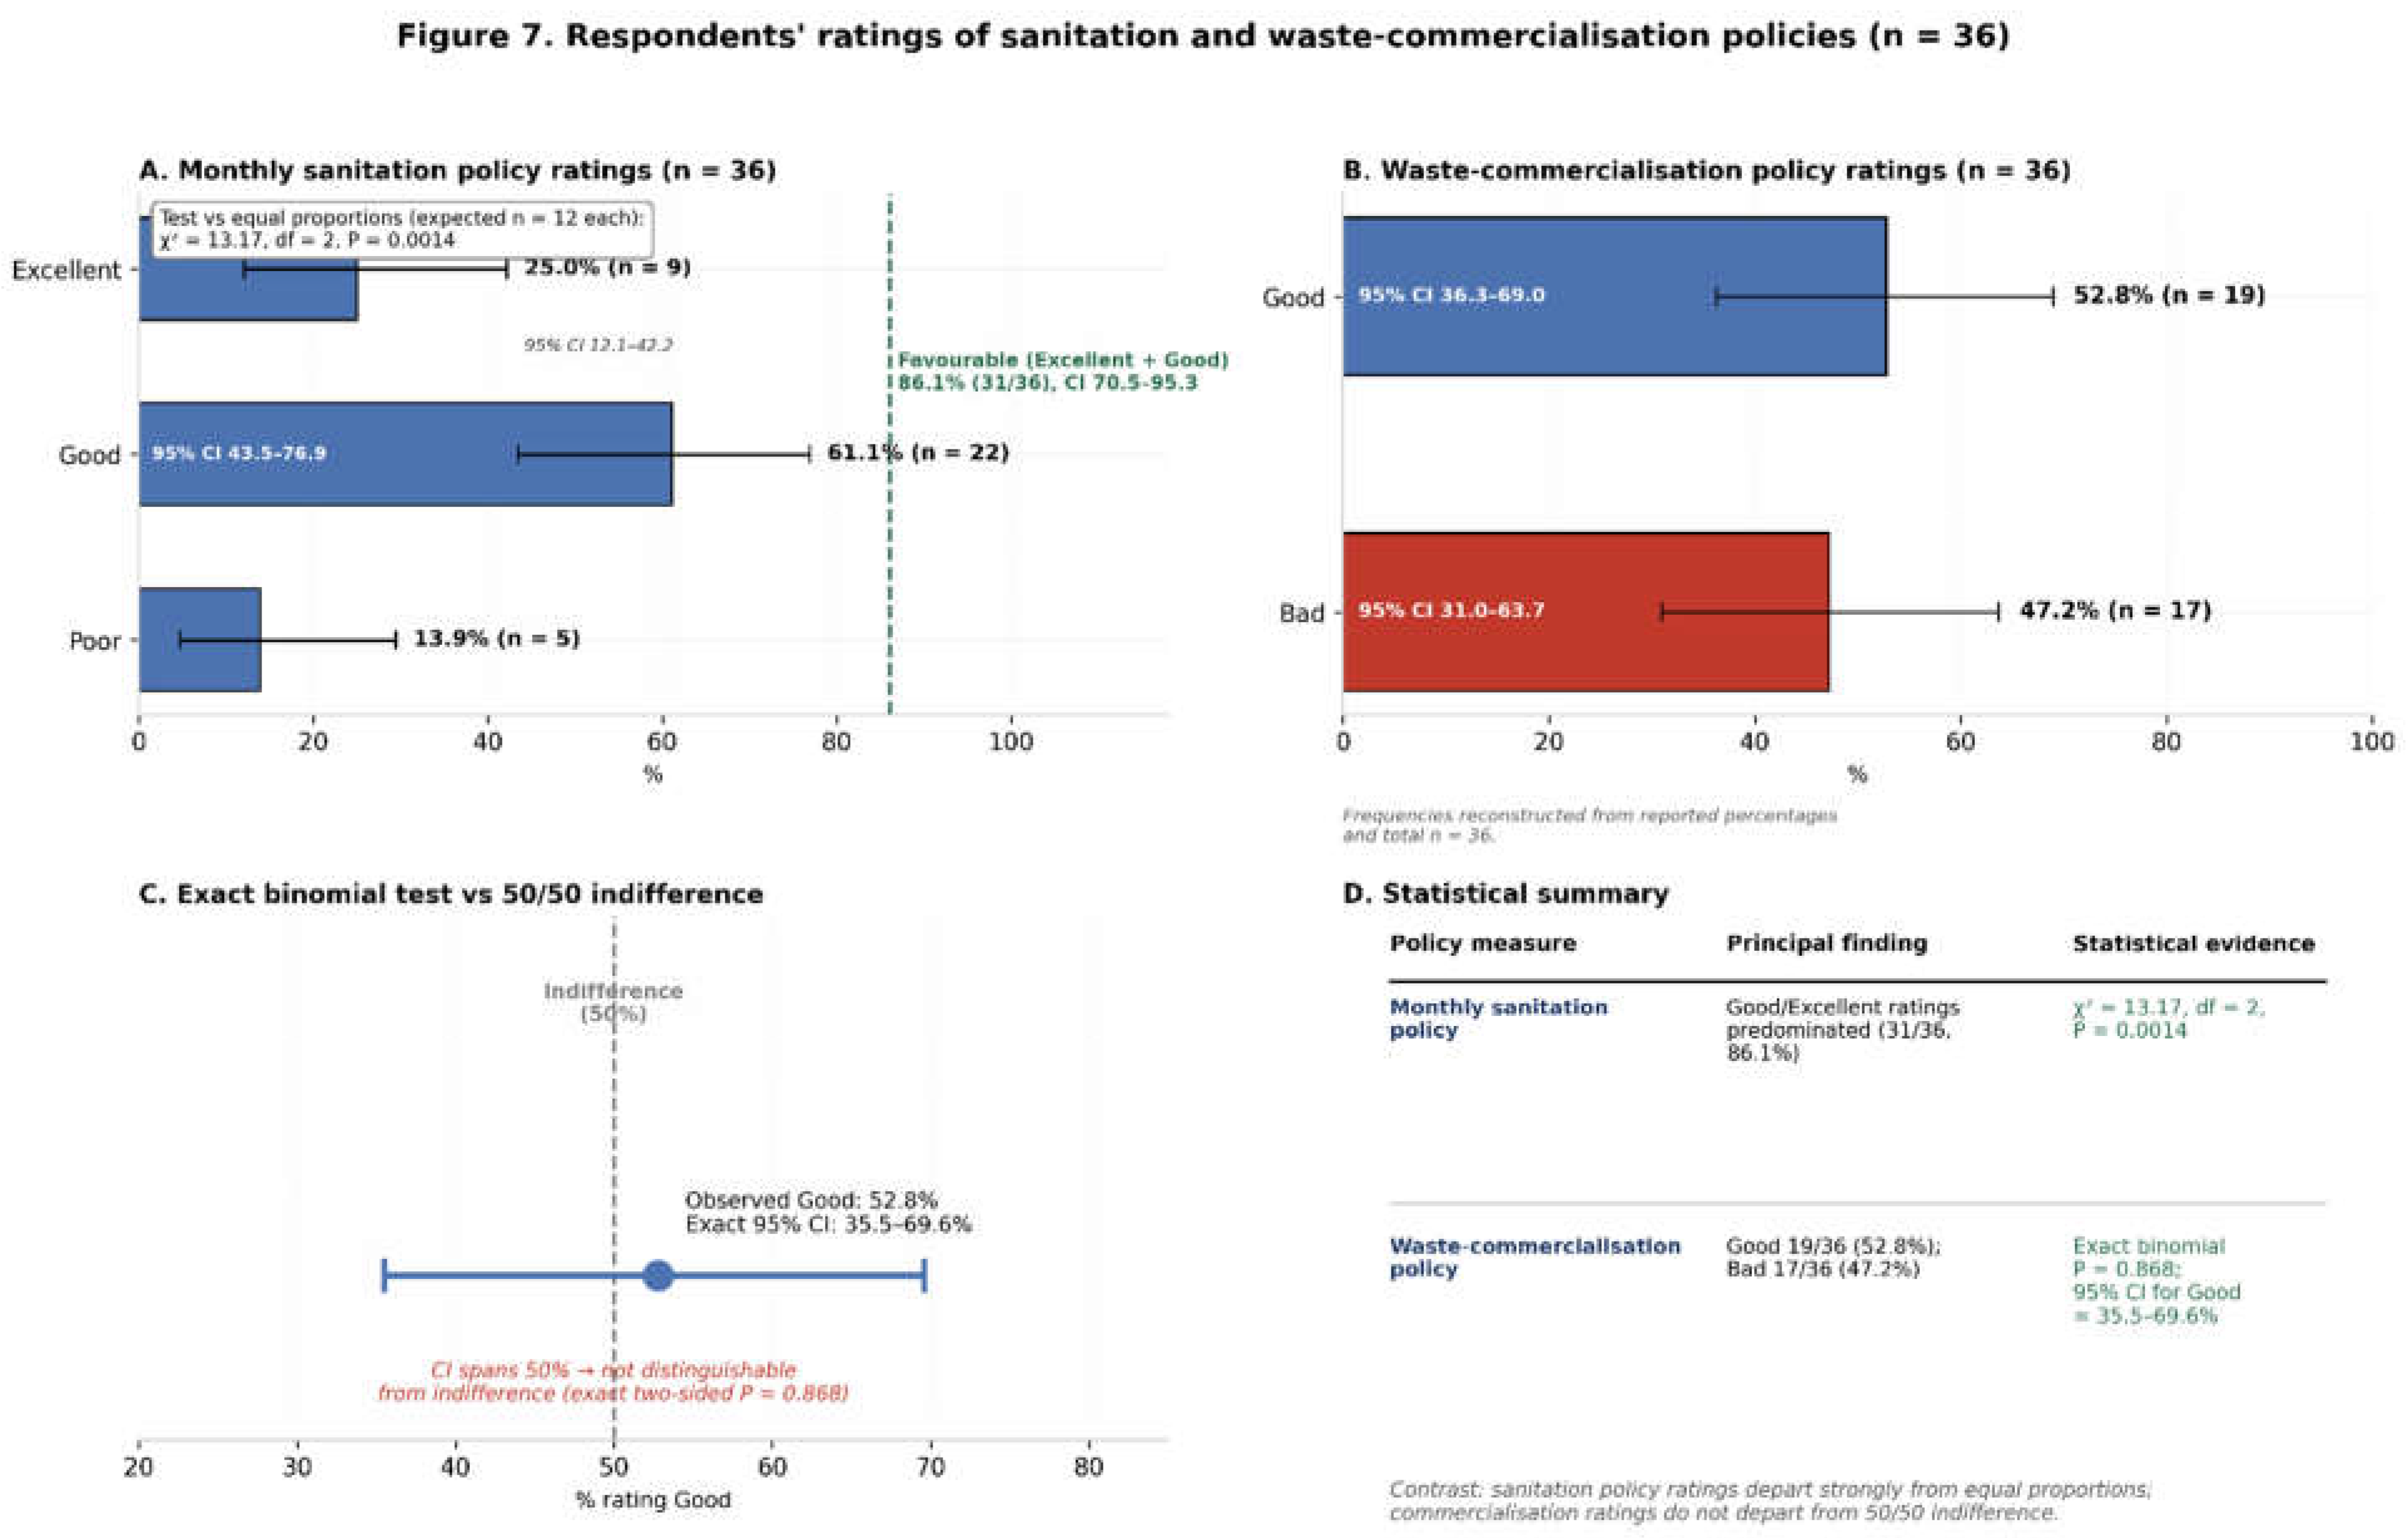
Figure 8.
Spatial distribution of operational activity across the three LGAs. Panel A shows total vehicles and total daily passengers per LGA; Panel B shows mean activity per park. Ilorin South recorded the highest totals and per-park averages, while Ilorin West and East showed similar, lower levels of activity.
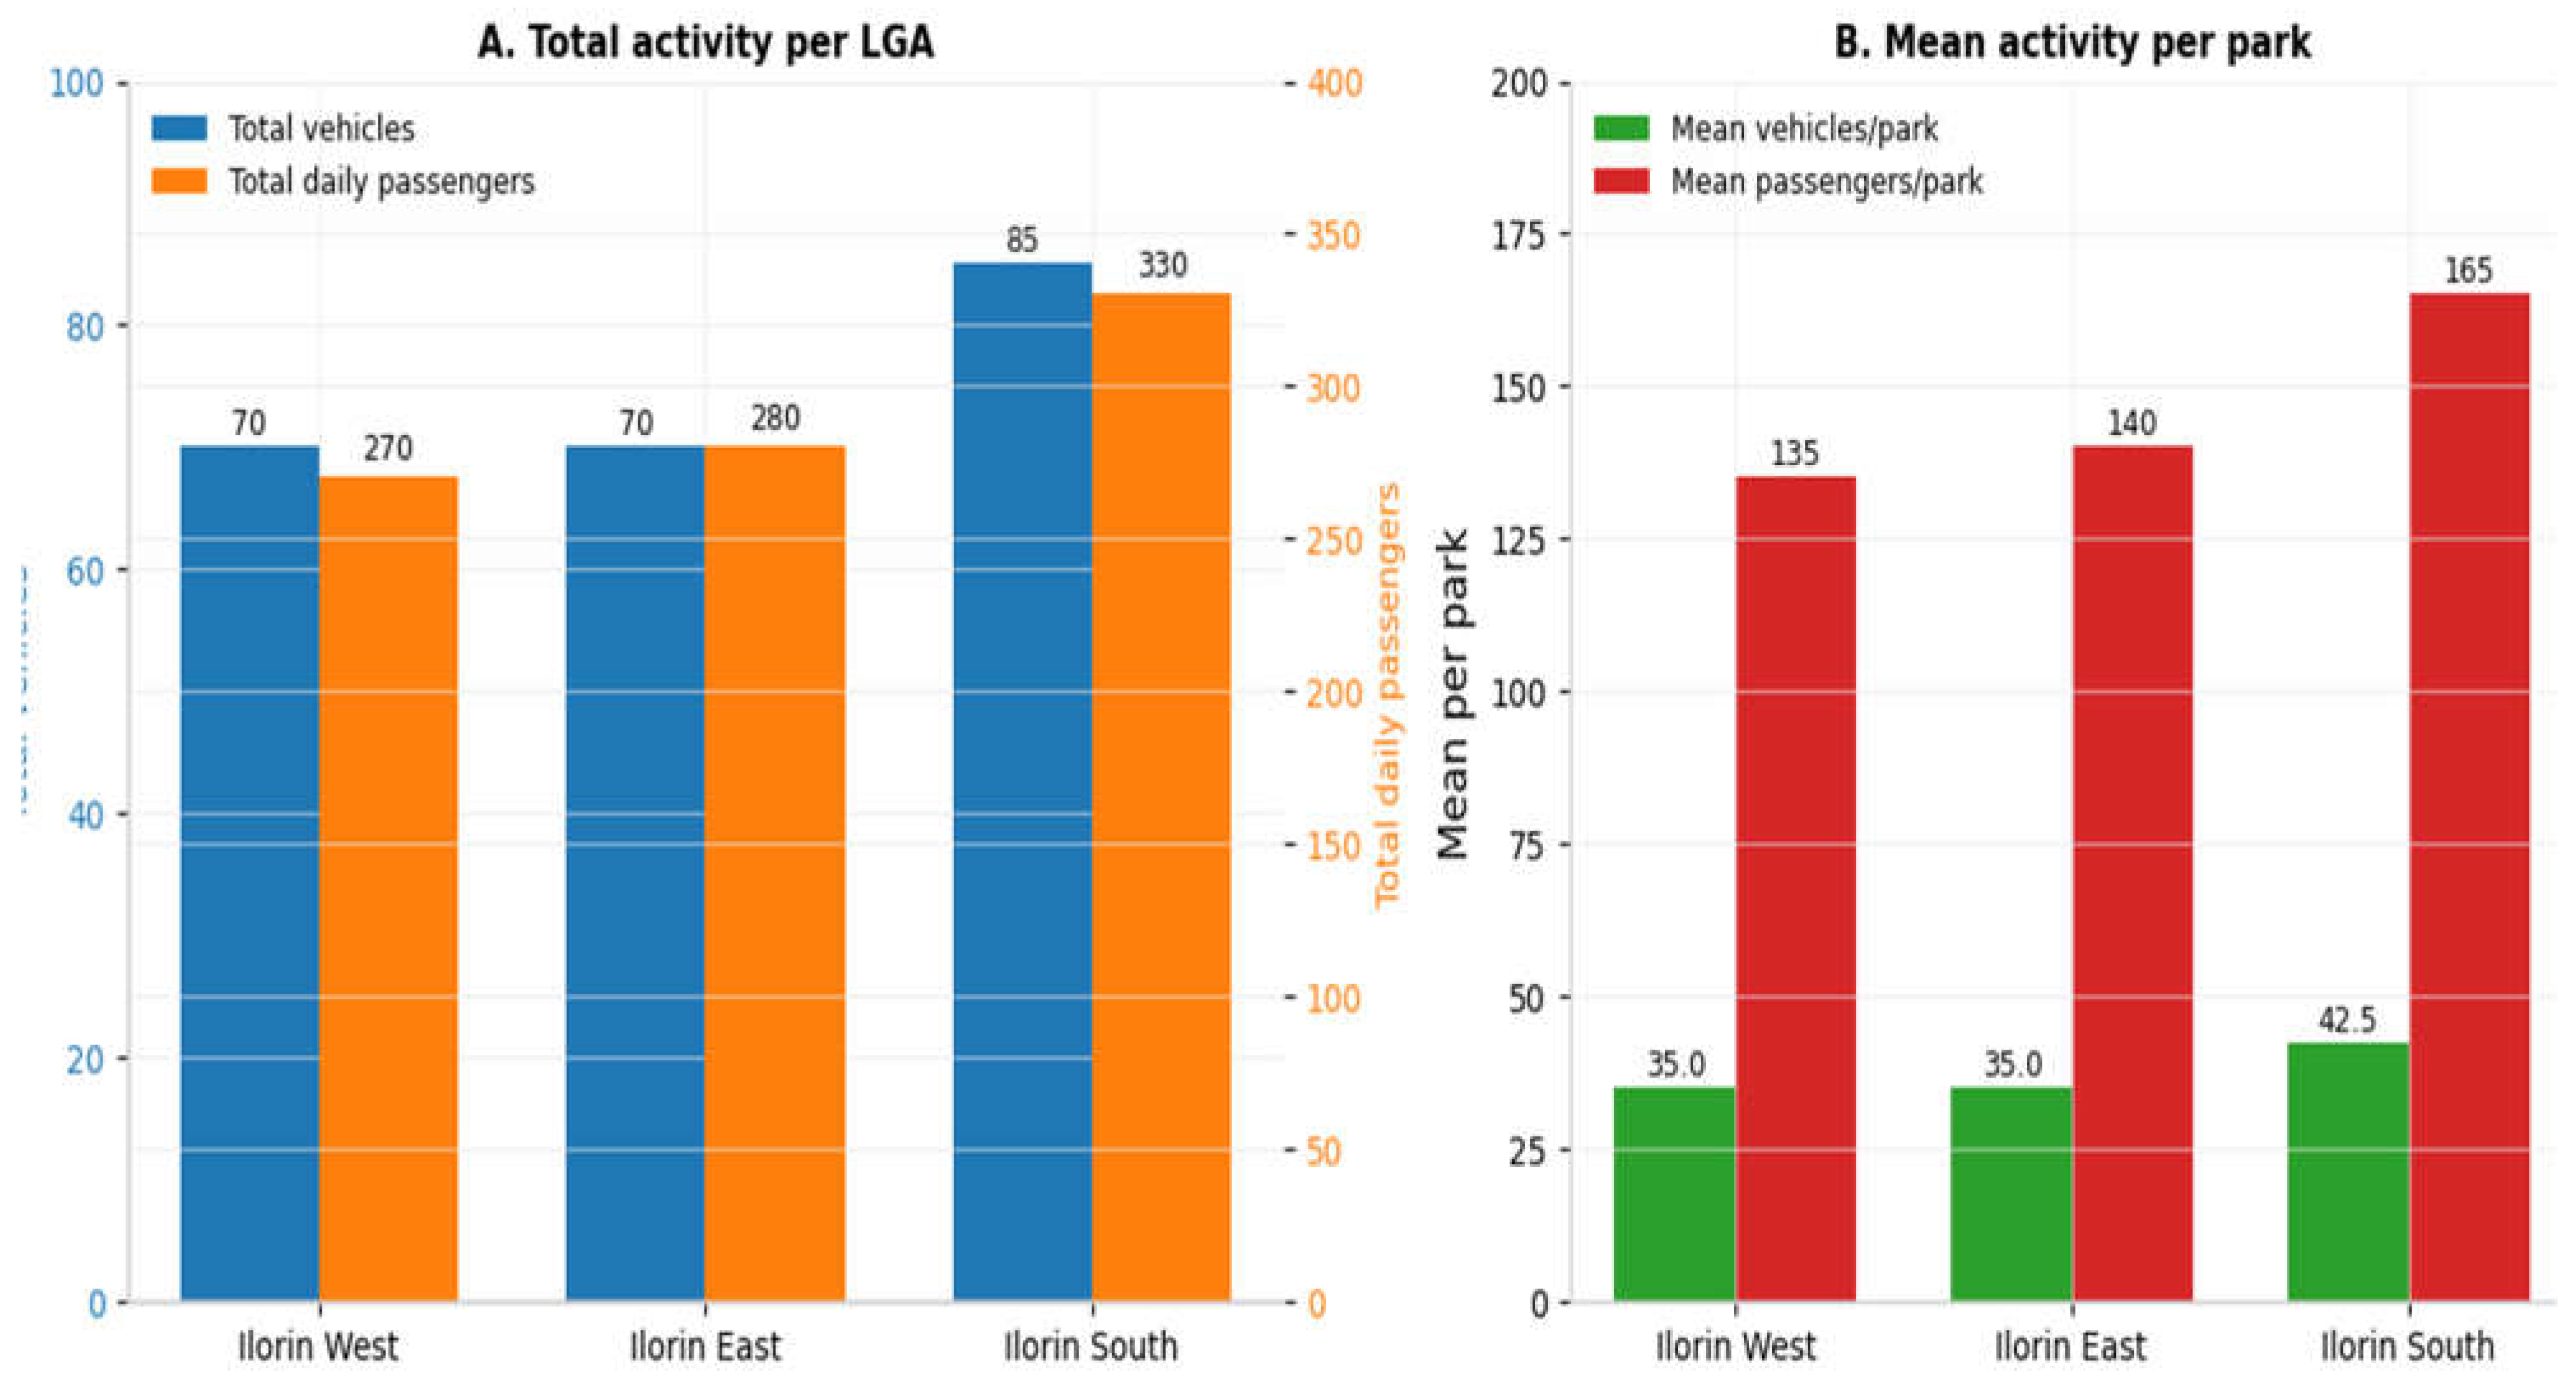
Figure 9.
Utilisation intensity measures for the motor parks. Panel A shows the total number of vehicles and daily passengers per park; Panel B shows passengers per vehicle per day, with the dashed line marking the overall mean of 4.12. Okin Express recorded the highest utilisation intensity despite having the fewest vehicles, while the largest parks (Ero-Omo, Maraba) operated below the mean intensity.
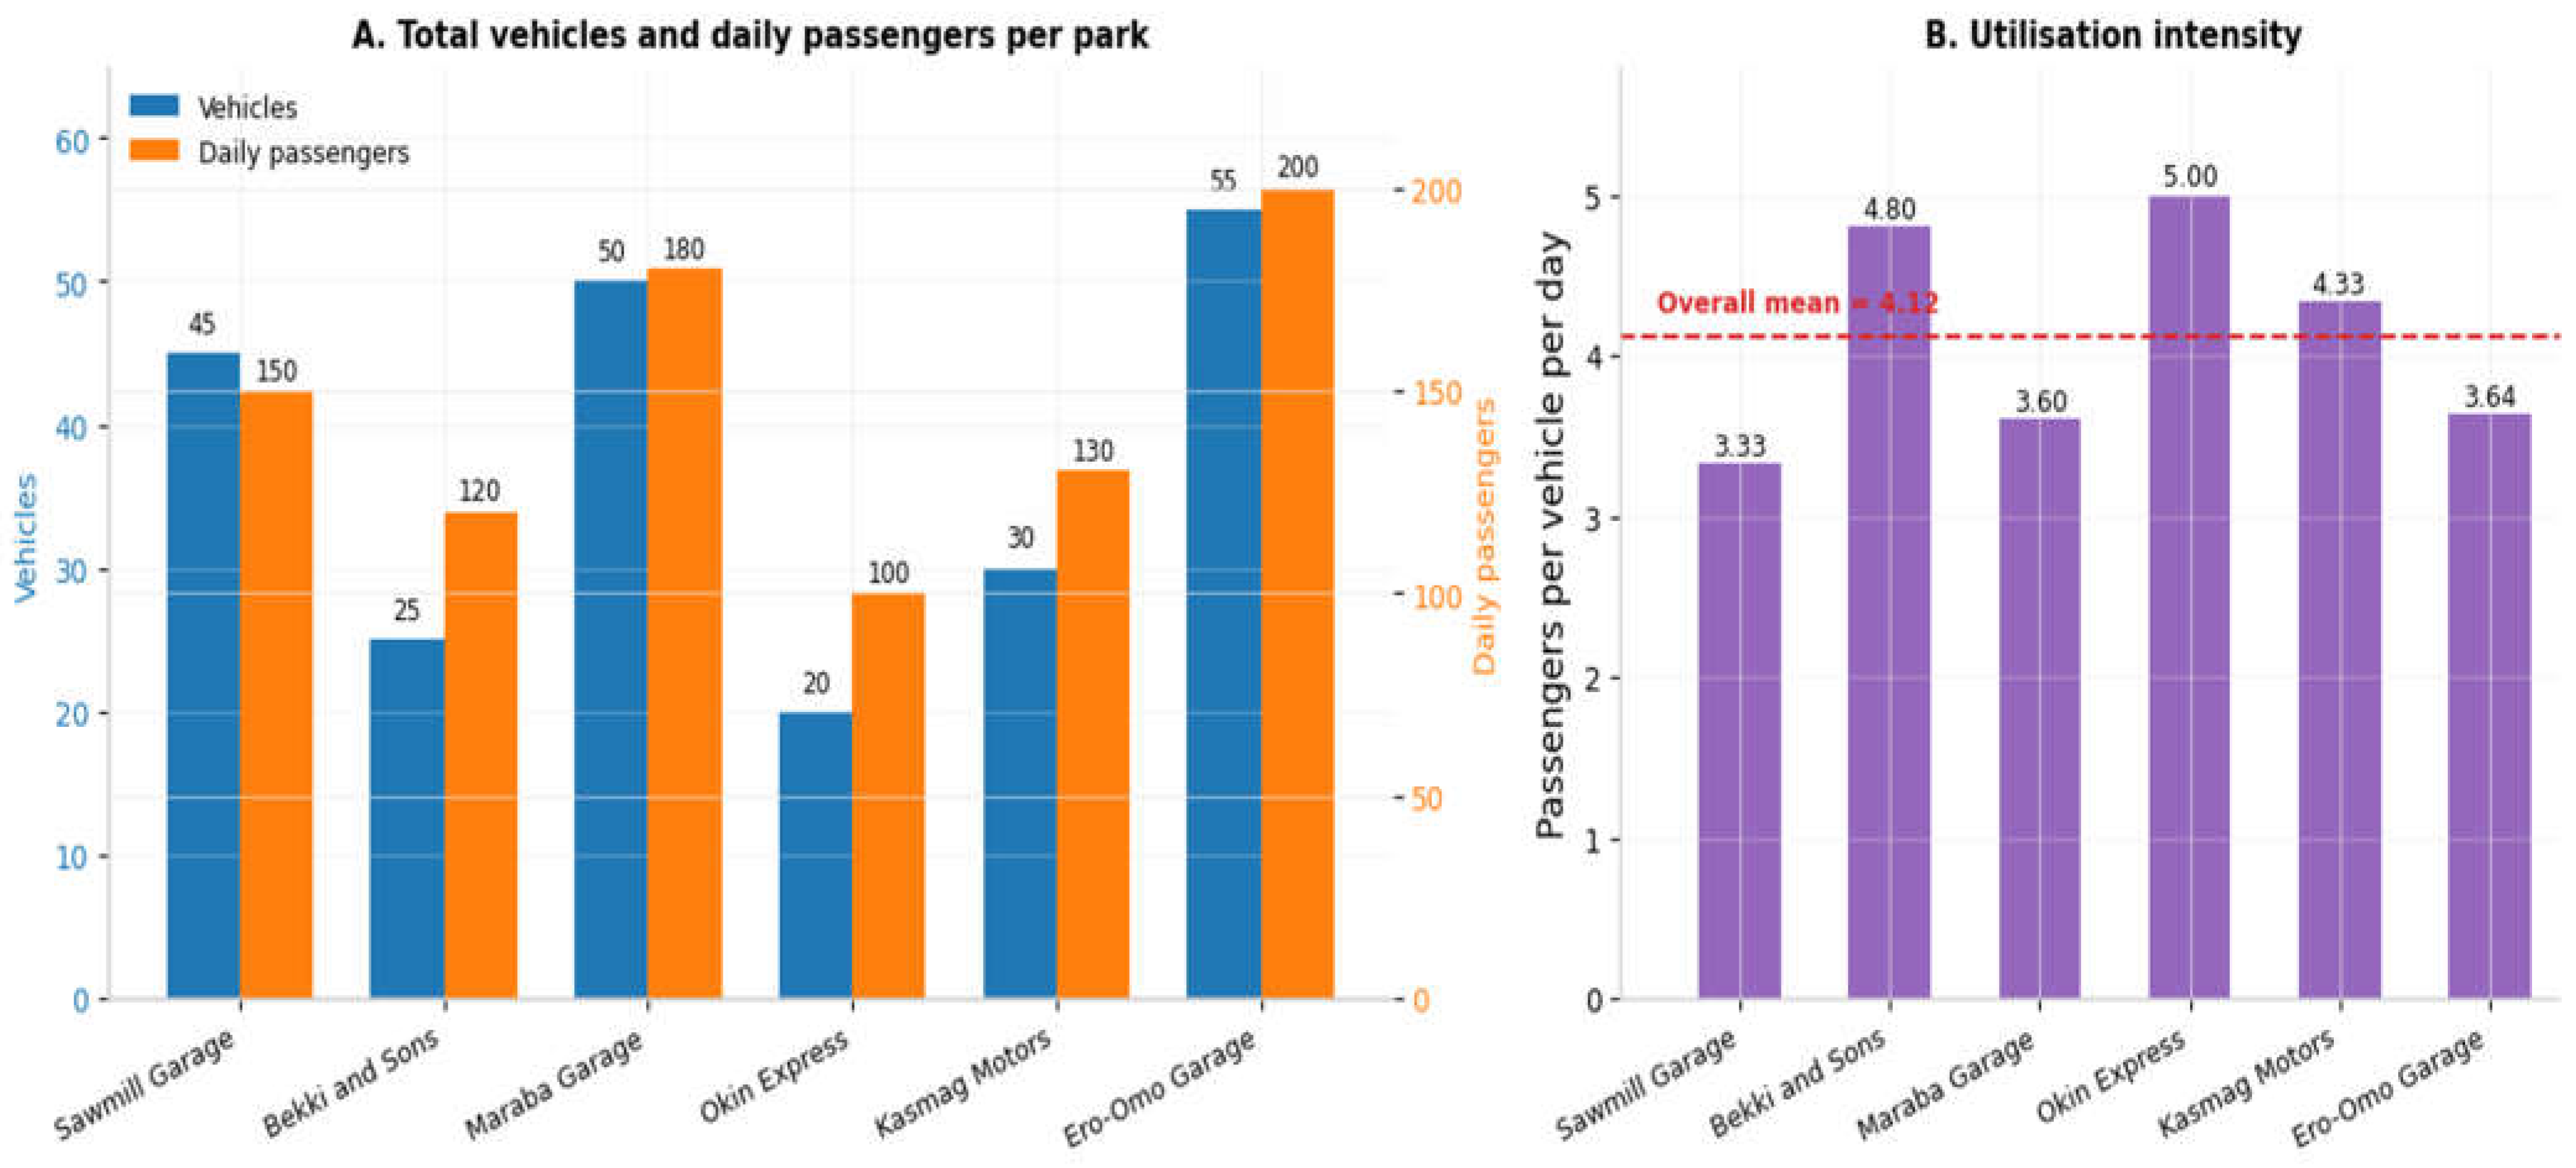
Figure 10.
Conceptual framework linking motor park sanitation, waste-management practices, and public health outcomes.
Figure 10.
Conceptual framework linking motor park sanitation, waste-management practices, and public health outcomes.
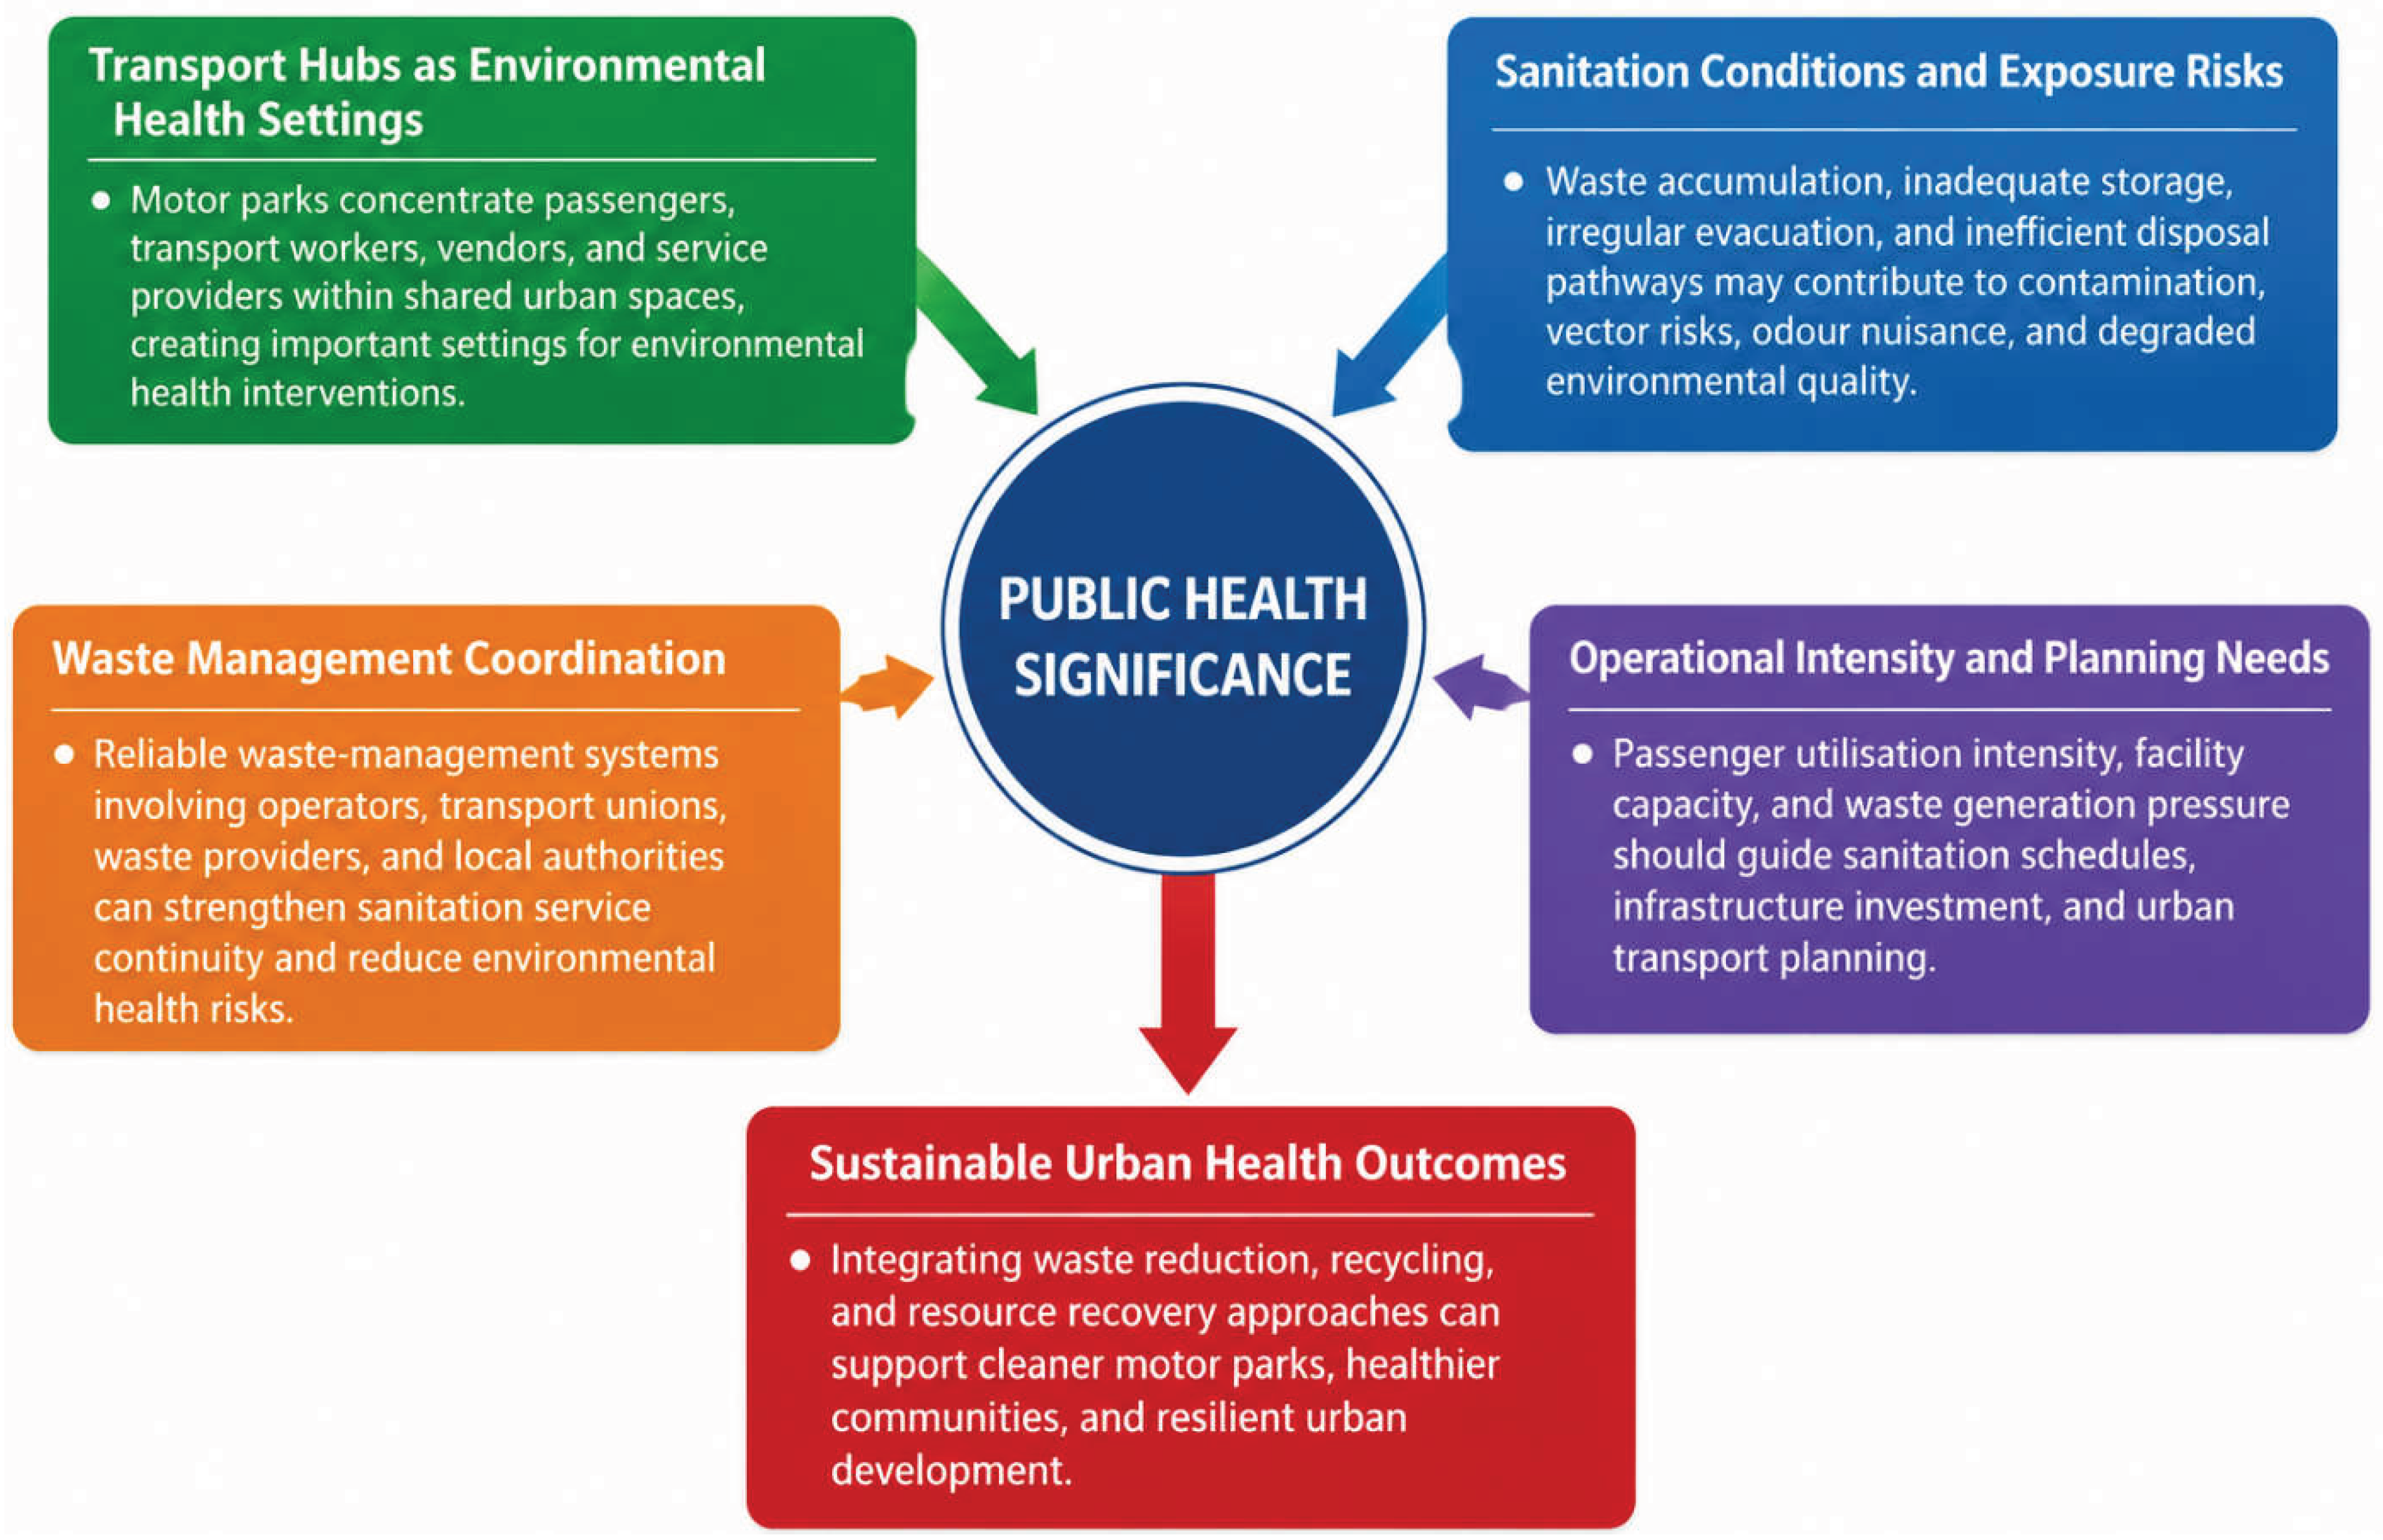

Table 1a.
Structural and operational characteristics of the six Ilorin motor parks.
| Motor park | LGA | Ownership | Year established | Fleet size, vehicles | Daily passengers | Passengers per vehicle/day |
| Sawmill Garage | Ilorin West | Public | 1976 | 45 | 150 | 3.33 |
| Bekki and Sons | Ilorin West | Private | 2008 | 25 | 120 | 4.80 |
| Maraba Garage | Ilorin East | Public | 1980 | 50 | 180 | 3.60 |
| Okin Express | Ilorin East | Private | 2005 | 20 | 100 | 5.00 |
| Kasmag Motors | Ilorin South | Public | 2002 | 30 | 130 | 4.33 |
| Ero-Omo Garage | Ilorin South | Public | 1979 | 55 | 200 | 3.64 |
| Overall median (IQR) | — | — | 1981 (1978-2004) | 37.5 (26.3-48.8) | 140 (122.5-172.5) | 3.98 (3.61-4.68) |
Note: Passengers per vehicle/day was calculated as daily passenger throughput divided by fleet size. Each motor park is one independent facility-level observation (n = 6).
Table 1b.
Facility-level operational scale according to ownership type.
| Operational measure | Public parks (n = 4), mean ± SD | Private parks (n = 2), mean ± SD | Public − private difference |
| Fleet size, vehicles | 45.0 ± 10.8 | 22.5 ± 3.5 | +22.5 |
| Daily passenger throughput | 165.0 ± 31.1 | 110.0 ± 14.1 | +55.0 |
| Passengers per vehicle/day | 3.73 ± 0.43 | 4.90 ± 0.14 | −1.17 |
| Year established | 1979.3 ± 12.1 | 2006.5 ± 2.1 | −27.3 years |
Note: Ownership contrasts are descriptive because only six facilities were observed, including two privately owned parks. An exact two-sided permutation test based on the 15 possible allocations of two private labels among six facilities has a minimum attainable P-value of 0.133; therefore, no conventional significance claim is made for the ownership contrasts. The year-of-establishment comparison is included to document the marked age imbalance between ownership groups rather than as an operational outcome.
Table 1c.
Association between fleet size and daily passenger throughput across the six motor parks.
| Analysis | Estimate | 95% CI | P-value |
| Spearman rank correlation, ρ | 1.000 | — | 0.0028† |
| Pearson correlation, r | 0.974 | 0.776–0.997 | 0.0010 |
| Linear regression slope, passengers/day per additional vehicle | 2.55 | 1.73–3.38 | 0.0010 |
| Linear regression intercept, passengers/day | 50.88 | 18.17–83.60 | 0.0010 |
| R² | 0.949 | — | — |
†Exact two-sided permutation P-value. The Spearman coefficient is 1.000 because the six parks have identical rank ordering for fleet size and daily passenger throughput. Regression equation: daily passengers = 50.88 + 2.55 × fleet size.
Table 2a.
Distribution of waste-storage modalities among respondents across the six selected motor parks in Ilorin.
Table 2a.
Distribution of waste-storage modalities among respondents across the six selected motor parks in Ilorin.
| Waste-storage modality | Frequency (n) | Percentage (%) | 95% CI |
| Small waste bins | 22 | 61.1 | 44.9–75.2 |
| Waste drums | 12 | 33.3 | 20.2–49.7 |
| Nylon bags | 2 | 5.6 | 1.5–18.1 |
| Total | 36 | 100.0 | — |
95% CIs are Wilson score intervals calculated at the respondent level. Percentages may not sum to exactly 100% because of rounding.
Table 2b.
Test of the observed distribution of waste-storage modalities.
| Statistical measure | Result |
| Observed frequencies | 22, 12, 2 |
| Expected frequency under equal distribution | 12, 12, 12 |
| Pearson χ² | 16.667 |
| Degrees of freedom | 2 |
| P-value | <0.001 |
| Interpretation | Distribution differs from an equal distribution across the three storage modalities |
Table 3a.
Distribution of waste-disposal channels among respondents.
| Waste-disposal channel | N | % | 95% CI |
| Private waste collectors | 33 | 91.7 | 78.2–97.1 |
| Government agency | 2 | 5.6 | 1.5–18.1 |
| Self-disposal | 1 | 2.8 | 0.5–14.2 |
| Total | 36 | 100.0 | — |
95% CIs are Wilson score intervals.
Table 3b.
Distribution of waste-evacuation frequency among respondents.
| Waste-evacuation frequency | n | % | 95% CI |
| Weekly | 28 | 77.8 | 61.9–88.3 |
| Bi-weekly | 5 | 13.9 | 6.1–28.7 |
| Monthly | 3 | 8.3 | 2.9–21.8 |
| Total | 36 | 100.0 | — |
Frequencies were reconstructed from the percentages presented in Figure 1 (77.8%, 13.9%, and 8.3%) and total sample size of 36. 95% CIs are Wilson score intervals.
Table 3c.
Distribution of monthly waste-disposal costs among respondents.
| Monthly waste-disposal cost | n | % | 95% CI |
| ₦1,000 | 2 | 5.6 | 1.5–18.1 |
| ₦2,000 | 7 | 19.4 | 9.8–35.0 |
| ₦5,000 | 15 | 41.7 | 27.1–57.8 |
| >₦5,000 | 12 | 33.3 | 20.2–49.7 |
| Total | 36 | 100.0 | — |
95% CIs are Wilson score intervals.
Table 3d.
Statistical assessment of the monthly waste-disposal cost distribution.
| Statistical measure | Result |
| Expected frequency per category under equal distribution | 9.0 |
| Pearson χ² | 15.44 |
| Degrees of freedom | 3 |
| P-value | 0.0015 |
| Respondents reporting ≥₦5,000/month | 27 (75.0%) |
| 95% CI for ≥₦5,000 | 59.2–86.3% |
| Interpretation | Monthly disposal costs were not equally distributed across the four reported cost categories |
Table 3e.
Summary of waste-disposal practices.
| Waste-management indicator | Predominant category | n/N | % | 95% CI |
| Disposal channel | Private waste collectors | 33/36 | 91.7 | 78.2-97.1 |
| Evacuation frequency | Weekly | 28/36 | 77.8 | 61.9-88.3 |
| Monthly disposal cost | ≥₦5,000 | 27/36 | 75.0 | 59.2-86.3 |
Table 4a.
Distribution of respondents’ ratings of the monthly sanitation policy.
| Rating of monthly sanitation policy | N | % | Wilson 95% CI |
| Excellent | 9 | 25.0 | 12.1–42.2 |
| Good | 22 | 61.1 | 43.5–76.9 |
| Poor | 5 | 13.9 | 4.7–29.5 |
| Total | 36 | 100.0 | — |
| Favourable (Excellent + Good) | 31 | 86.1 | 70.5–95.3 |
Wilson score intervals. The three-category distribution was assessed against equal proportions (expected n = 12 per category): χ² = 13.17, df = 2, P = 0.0014.
Table 4b.
Respondents’ ratings of the waste-commercialisation policy.
| Rating of waste-commercialisation policy | n | % | Wilson 95% CI |
| Good | 19 | 52.8 | 36.3–69.0 |
| Bad | 17 | 47.2 | 31.0–63.7 |
| Total | 36 | 100.0 | — |
Frequencies are reconstructed from the 52.8% and 47.2% reported in Figure 2 and the total sample of 36.
Table 4c.
Exact test of the waste-commercialisation policy distribution against indifference.
| Statistical measure | Result |
| Prespecified indifference distribution | 50% Good : 50% Bad |
| Observed Good | 19/36 (52.8%) |
| Observed Bad | 17/36 (47.2%) |
| Test | Exact binomial test, two-sided |
| Exact P-value | 0.868 |
| Exact 95% CI for proportion rating Good | 35.5-69.6% |
| Interpretation | Observed distribution is not statistically distinguishable from 50/50 indifference |
Table 4d.
Statistical summary.
| Policy measure | Principal finding | Statistical evidence |
| Monthly sanitation policy | Good/Excellent ratings predominated (31/36, 86.1%) | χ² = 13.17, df = 2, P = 0.0014 |
| Waste-commercialisation policy | Good: 19/36 (52.8%); Bad: 17/36 (47.2%) | Exact binomial P = 0.868; 95% CI for Good = 35.5–69.6% |
Table 5.
Spatial distribution of operational activity across the three LGAs.
| LGA | No. of parks | Total vehicles | Total daily passengers | Mean vehicles/park | Mean passengers/park |
| Ilorin West | 2 | 70 | 270 | 35.0 | 135.0 |
| Ilorin East | 2 | 70 | 280 | 35.0 | 140.0 |
| Ilorin South | 2 | 85 | 330 | 42.5 | 165.0 |
| Overall | 6 | 225 | 880 | 37.5 | 146.7 |
Table 6.
Measure of utilisation intensity of the motor parks.
| Motor park | Vehicles | Daily passengers | Passengers/vehicle/day |
| Sawmill Garage | 45 | 150 | 3.33 |
| Bekki and Sons | 25 | 120 | 4.80 |
| Maraba Garage | 50 | 180 | 3.60 |
| Okin Express | 20 | 100 | 5.00 |
| Kasmag Motors | 30 | 130 | 4.33 |
| Ero-Omo Garage | 55 | 200 | 3.64 |
| Overall | 225 | 880 | 4.12 |
The six facilities range from 3.33 to 5.00 passengers per vehicle per day, with an overall mean of approximately 4.12.
Disclaimer/Publisher’s Note: The statements, opinions and data contained in all publications are solely those of the individual author(s) and contributor(s) and not of MDPI and/or the editor(s). MDPI and/or the editor(s) disclaim responsibility for any injury to people or property resulting from any ideas, methods, instructions or products referred to in the content. |
© 2026 by the authors. Licensee MDPI, Basel, Switzerland. This article is an open access article distributed under the terms and conditions of the Creative Commons Attribution (CC BY) license (http://creativecommons.org/licenses/by/4.0/).
Copyright: This open access article is published under a Creative Commons CC BY 4.0 license, which permit the free download, distribution, and reuse, provided that the author and preprint are cited in any reuse.